

SUMMARY
Type 1 diabetes (T1D) results from the progressive loss of β cells, a process propagated by pro-inflammatory cytokine signaling that disrupts the balance between pro- and anti-apoptotic proteins. To identify proteins involved in this process, we performed comprehensive proteomics of human pancreatic islets treated with interleukin-1β and interferon-γ, leading to the identification of 11,324 proteins, of which 387 were significantly regulated by treatment. We then tested the function of growth/differentiation factor 15 (GDF15), which was repressed by the treatment. We found that GDF15 translation was blocked during inflammation, and it was depleted in islets from individuals with T1D. The addition of exogenous GDF15 inhibited interleukin-1β+interferon-γ-induced apoptosis of human islets. Administration of GDF15 reduced by 53% the incidence of diabetes in NOD mice. Our approach provides a unique resource for the identification of the human islet proteins regulated by cytokines and was effective in discovering a potential target for T1D therapy.
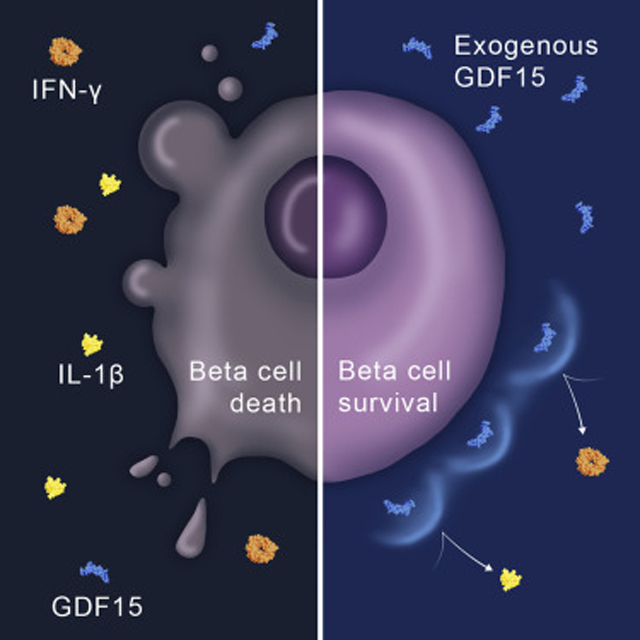
Graphical Abstract
In Brief
Nakayasu et al. used a proteomics-based approach in human islets to study the T1D-related process of β-cell destruction. They found that pro-inflammatory cytokines lead to the suppression of GDF15 mRNA translation. The study also revealed that GDF15 promotes the protection of β cells and prevents diabetes onset in mice.
INTRODUCTION
Type 1 diabetes (T1D) is a chronic disease that affects approximately 1.25 million people in the U.S. Insulin administration successfully ameliorates the symptoms of T1D, but it does not prevent or cure this devastating disease, which shortens the lifespan of those affected by more than 10 years (Atkinson et al., 2014; DiMeglio et al., 2018; Livingstone et al., 2015). Since T1D is caused by a gradual, autoimmune-mediated destruction of insulin-producing β cells in the pancreatic islet, immunotherapies have been extensively tested to prevent or arrest disease (Ehlers, 2016). Recent clinical trial efforts suggest that immunomodulation can delay disease onset in certain-high risk individuals, but responses to drug therapy are typically heterogeneous and limited in duration (Herold et al., 2019). A major hurdle in this process is a lack of understanding around the response of pancreatic β cells during immune activation and disease evolution.
Pro-inflammatory cytokines, such as interferon (IFN)-γ, interleukin (IL)-1β, and tumor necrosis factor (TNF)-α, can be potent mediators of β-cell destruction by amplifying cell-mediated inflammation, directly activating apoptotic signaling, and inducing pro-apoptotic proteins (Eizirik et al., 2009; Eizirik et al., 2012; Ramos-Rodríguez et al., 2019). In addition, these cytokines have been shown to contribute to apoptosis by inducing mitochondrial dysfunction and endoplasmic reticulum stress (Eizirik et al., 2013; Gurzov and Eizirik, 2011). To prevent massive tissue damage, the organism has feedback mechanisms that counterbalance the effects of the pro-inflammatory cytokines (Elenkov and Chrousos, 2002). These feedback mechanisms, however, seem to be altered in T1D, failing to prevent a strong and progressive decrease in the β-cell population (Campbell-Thompson et al., 2016; Gupta et al., 2014). We hypothesized that comprehensive proteomics analyses of the cytokine responses in human islets could identify key pathways in the β cell that are up- or downregulated, which could define new targets that could be exploited for the development of T1D therapies.
Using comprehensive proteomics analysis, we aimed to unveil the molecular signatures of cytokine-induced β cell signaling to identify factors that regulate the balance between cell death and survival. Human pancreatic islets were treated with a combination of the pro-inflammatory cytokines, IL-1β and IFN-γ, and submitted to an in-depth proteomic analysis, leading to the identification and quantification of approximately 11,000 proteins. Our data showed significant activation of pathways related to inflammation, antigen processing and presentation, apoptosis, and cytokine signaling. Based on these expression profiles, we identified and confirmed growth/differentiation factor 15 (GDF15, also known as macrophage inhibitory cytokine 1 [MIC-1]) as an islet-protective factor. This study exemplifies the utility of advanced proteomics to elucidate signaling pathways and identify interesting factors or targets for mechanistic study and elucidates the mechanism of GDF15 synthesis regulation by pro-inflammatory cytokines, its function in blocking apoptotic signaling, and in vivo activity in preventing insulitis.
RESULTS
Comprehensive Proteomic Analysis of Human Pancreatic Islets Treated with Cytokines
To investigate the molecular responses to pro-inflammatory stress that lead to β-cell death, human pancreatic islets from each of 10 non-diabetic cadaveric donors were treated with or without 50 U/mL IL-1β + 1,000 U/mL IFN-γ for 24 h. Due to the limited number of channels in the tandem-mass tags (TMT) kit used, islet samples from 5 different donors, including the samples treated with cytokines and respective controls, were combined in one TMT set, whereas the samples from the other 5 donors were multiplexed in a second set. Each TMT set was fractionated by high-pH reversed-phase chromatography and analyzed by liquid chromatography-tandem mass spectrometry (2D LC-MS/MS) (Figure 1A) (Pride repository: PXD009131). The proteomic analysis resulted in the identification and quantification of 11,324 proteins, of which 9,695 proteins were identified in both TMT experiments (Table S1; Figure 1B). A total of 387 of these proteins were consistently and significantly altered in abundance in response to the cytokine treatment in both TMT sets (Table S2; Figure 1C). To ensure the biological significance of the data, we performed a post hoc statistical power analysis. The average power with a paired sample size of 5 was 0.93 for both sets 1 and 2. Evaluating each protein for adequate power indicated that 87.7% of proteins in both sets had a power of great than 0.8 to detect a fold change of 1.5 for sets 1 and 2, respectively. (Figures S1A and S1B). The power analysis confirmed that the size of the present study is appropriate to investigate even small changes in protein abundances in response to the cytokine treatment.
Figure 1. Global Proteomic Analysis of Human Pancreatic Islets Treated with IFN-γ and IL-1β Using Tandem Mass Tags.
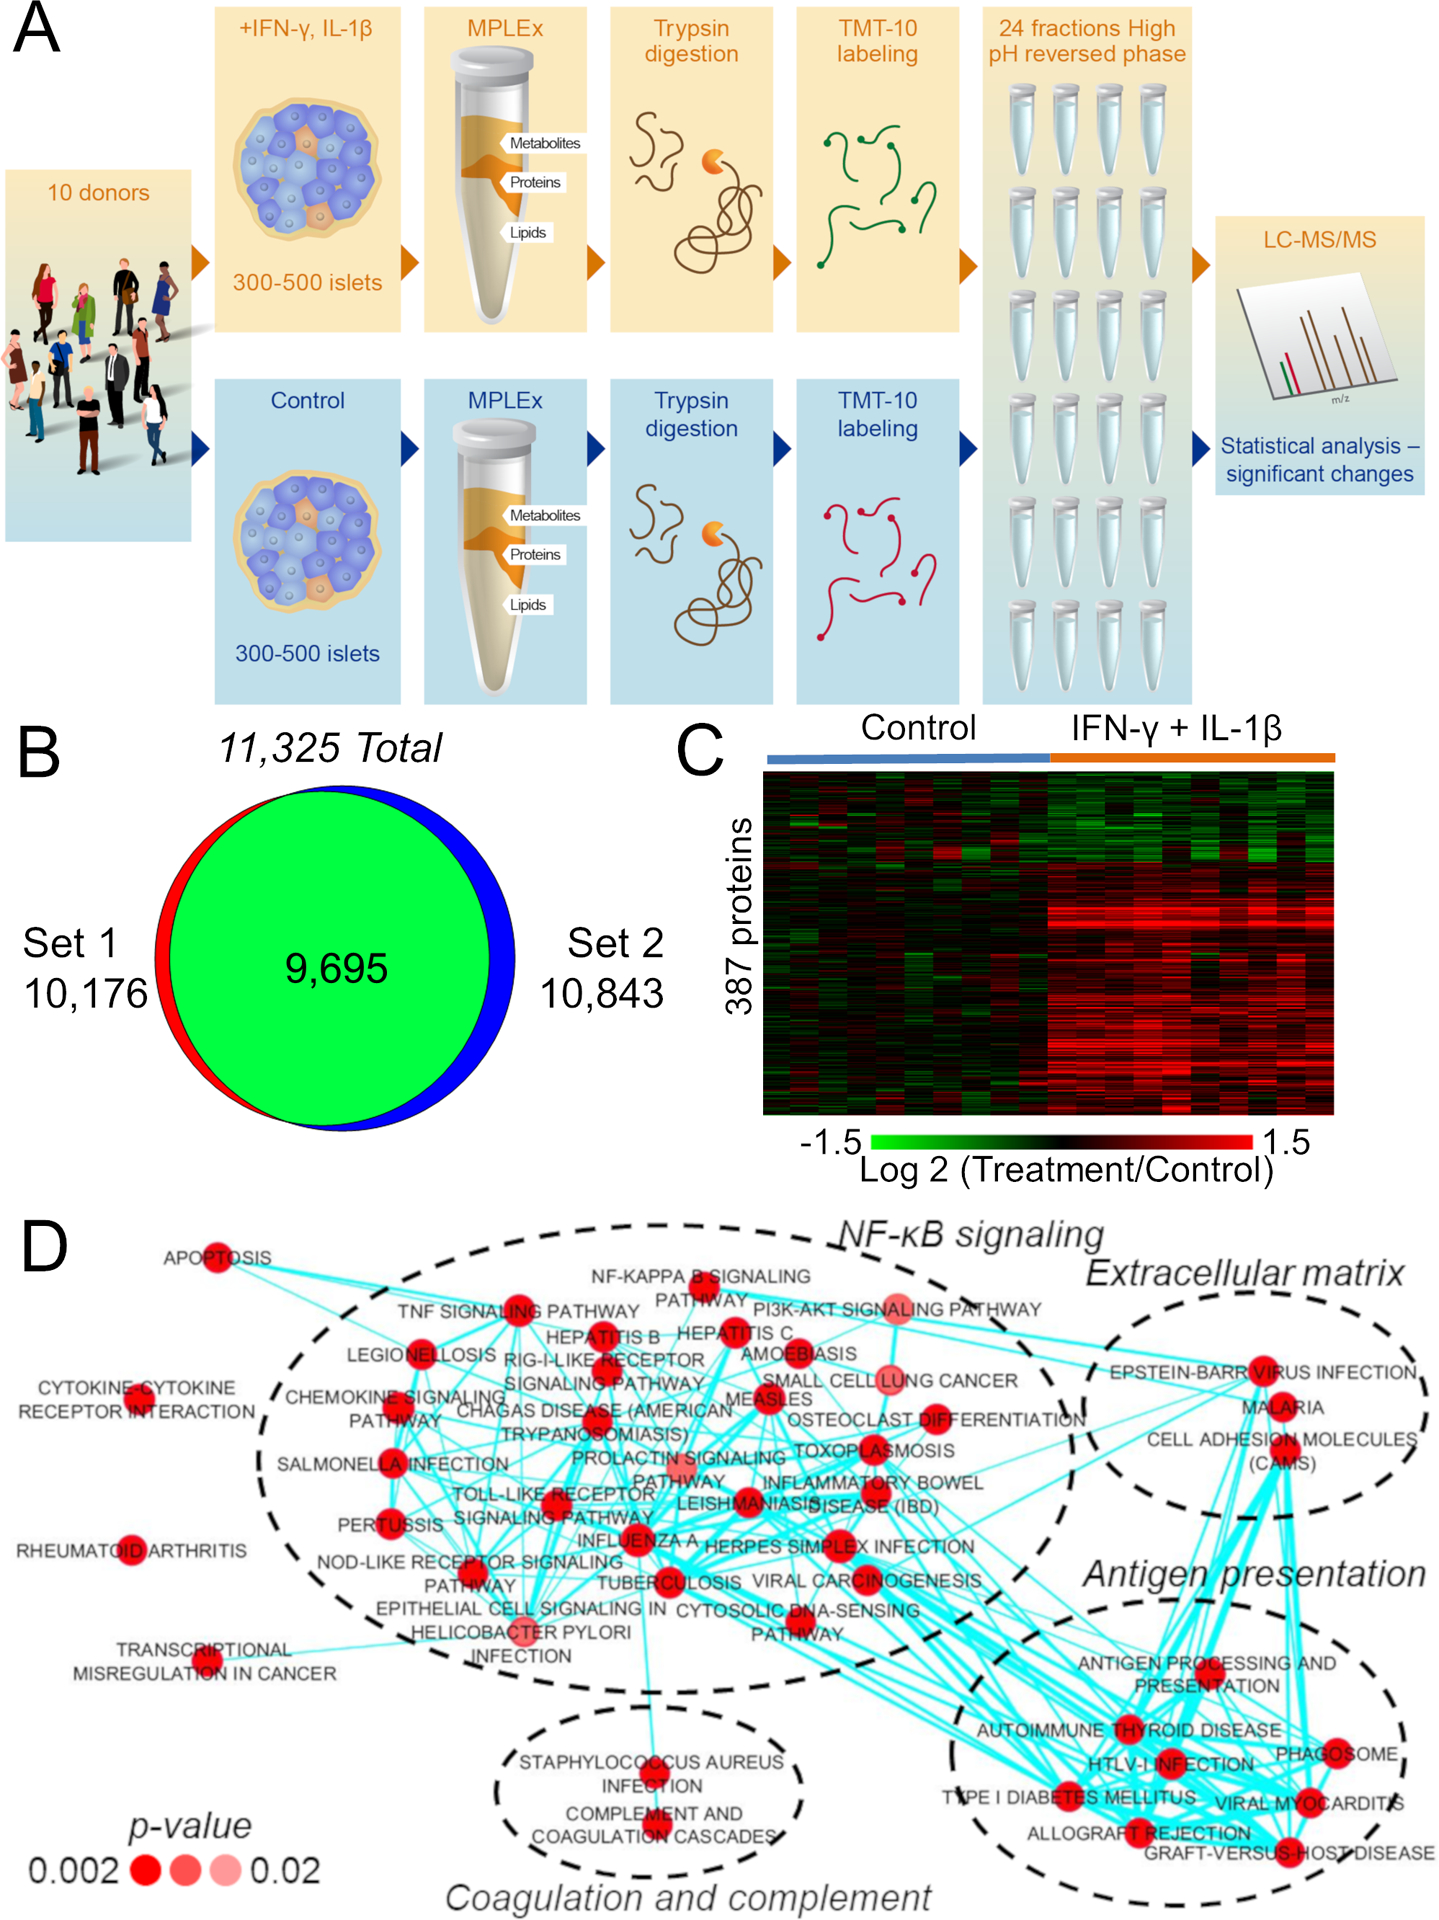
(A) Experimental workflow of the proteomic analysis of pancreatic islets.
(B) Number of identified proteins. The complete list of identified proteins is shown in Table S1.
(C) Heatmap of consistently significant proteins in both proteomic sets (see Table S2 for the complete list). The statistical power is shown in Figures S1A and S1B and a cross-validation set in Figures S1C–S1E.
(D) Function-enrichment analysis of the differentially abundant proteins upon IFN-γ and IL-1β treatment. The network was clustered according to similar functions of significantly enriched pathways. The intensity of red colors of the nodes represents how significant the enrichment is, while the thickness of the edges represents the degree of similarity (shared proteins) between pathways. A detailed network of proteins related to apoptosis is shown in Figure S1F.
Multiplexing samples using TMT combined with extensive fractionation of peptides prior to LC-MS/MS analysis leads to comprehensive coverage of the proteome; however, it may also result in protein fold change compression (Ow et al., 2009). Therefore, to more accurately determine the extent of fold changes in protein abundances, we performed an independent, label-free proteomics analysis of islets from two additional donors. These samples had the same cytokine treatment and were digested with trypsin before being analyzed by a label-free 2D LC-MS/MS proteomic approach (Figure S2C). Proteins such as E3 ubiquitin-protein ligase RNF213, fractalkine, and ubiquitin D had only modest (1.7 to 2.9) fold change (comparing the signal intensities of treated versus control samples) in the TMT-labeled experiment. However, in the label-free analysis, this difference was much larger (E3 ubiquitin-protein ligase RNF213, fractalkine, and ubiquitin D were only detected in samples after treatment) (Figure S2D), showing that the extent of regulation in protein expression is higher than detected in the TMT-labeled experiment. Notably, and despite the fold change compression, these proteins were correctly identified as regulated by the cytokine treatment.
The label-free proteomics experiment also served to validate the overall findings from the TMT-labeled analysis, since it was based on an independent experiment, i.e., the islets were obtained from two additional non-diabetic donors and treated with cytokines in a different laboratory using the same protocol. Furthermore, the samples were analyzed using an alternative proteomics pipeline without TMT labeling and an independent label-free quantification approach. In the label-free proteomics dataset, a total of 6,038 proteins were identified, including 207 of the 387 significantly regulated proteins found in the TMT-labeled proteomics experiment. Out of these 207 proteins, 182 (88%) were regulated in the same direction compared to proteins identified in the TMT-labeled proteomics experiment (Figures S2D and S2E). Overall, this independent analysis cross-validated a large portion of the proteins found to be significantly regulated by the IL-1β + IFN-γ treatment and showed that some of the proteins found to be differentially expressed in the first experiment were even more markedly modified than initially assumed.
Cellular Pathways Regulated by the IL-1β + IFN-γ Treatment
We next performed a function-enrichment analysis using the DAVID database to determine pathways regulated by the cytokine treatment. A total of 49 pathways were significantly enriched with cytokine-regulated proteins (Figure 1D). To facilitate interpretation, we clustered different pathways into main biological processes based on their overlapping signaling (shared proteins) as previously described (Merico et al., 2010). The analysis revealed that the cytokine treatment regulated proteins related to NF-κB signaling, cytokine-cytokine receptor interactions, apoptosis, antigen processing and presentation, extracellular matrix, coagulation and complement cascades, rheumatoid arthritis, and transcriptional mis-regulation in cancer (Figure 1D). Because β-cell death was the main phenotype of interest in our study, we next performed a more detailed analysis of proteins related to apoptosis using the MetaCore tool, which led to the assignment of 88 differentially abundant proteins to this function, of which 73 (83%) were annotated to be physically or functionally interacting with each other (Figure S1F). Of note, most of the proteins in this pathway were upregulated with the treatment, while some potential inhibitors of apoptosis, such as thrombospondin 1 (Cunha et al., 2017), were downregulated. This observation supports the hypothesis that pro-inflammatory cytokines induce cell death by breaking the homeostatic balance between pro- and anti-apoptotic factors.
Another pathway that drew our attention was the cytokine-cytokine receptor interaction because this indicated that the IL-1β + IFN-γ treatment regulates the expression of cytokines and receptors that might result in sequential, feedforward signaling events in the cells. Importantly, these types of molecules are pharmacologically active, making them potential candidates for therapies. The present proteomics analysis detected and identified 54 cytokines, chemokines, and growth factors, of which 19 were regulated by IL-1β + IFN-γ. Out of these regulated cytokines, chemokines, and growth factors, 16 were upregulated, while only 3 were downregulated (Figure 2A). Taken together, the proteomic analysis showed a significant regulation of proteins related to cytokine signaling and apoptosis in pancreatic islets treated with pro-inflammatory cytokines.
Figure 2. Cytokines, Chemokines, and Growth Factors Regulated by IFN-γ and IL-1β in Pancreatic Islets.
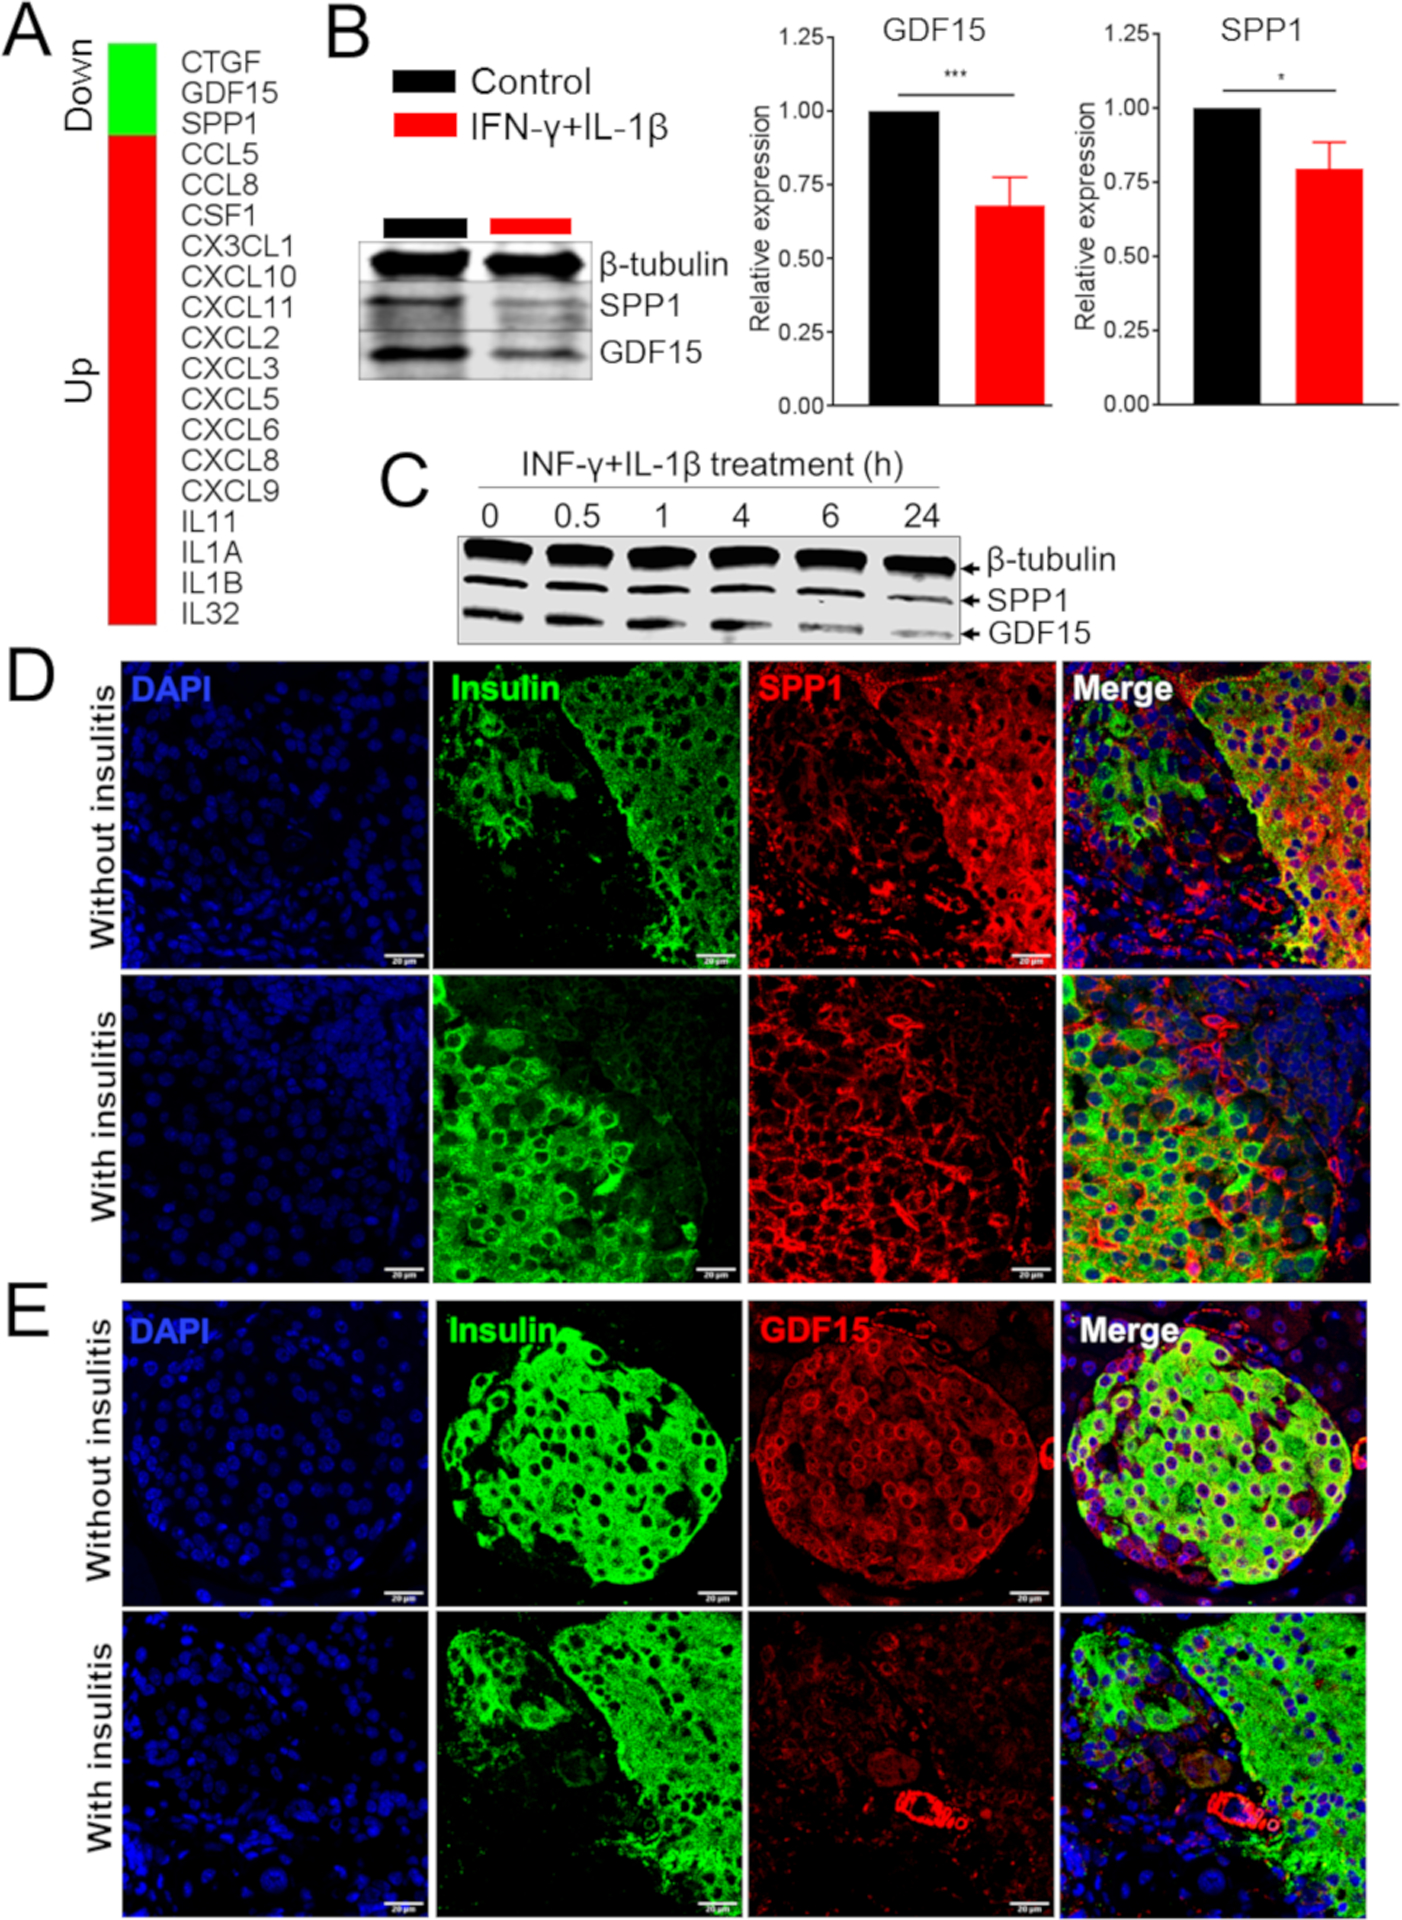
(A) Cytokines, chemokines, and growth factors significantly regulated by IFN-γ and IL-1β treatment of human islets.
(B) Western blot and quantification (right panels) of GDF15 and SPP1 in EndoC-βH1 cells treated with IL-1β and IFN-γ.
(C) Western blot of GDF15 and SPP1 in MIN6 cells treated with IL-1β and IFN-γ.
(D and E) Immunofluorescence analysis of SPP1 (D) and GDF15 (E) in pancreata derived from NOD mice with or without insulitis.
t test: *p ≤ 0.05, ***p ≤ 0.001.
Abundance Profiles of Selected Proteins in Cells and In Vivo
To identify possible therapeutic targets, we prioritized proteins to be further studied based on four criteria: (1) regulation in response to the IL-1β + IFN-γ treatment, (2) function in apoptosis, (3) classification as cytokines, chemokines, or growth factors, and (4) validation by the label-free proteomic analysis. Only 5 proteins matched all these criteria: fractalkine, IL-1α, IL-1β, osteopontin (secreted phosphoprotein 1 [SPP1]), and growth/differentiation factor 15 (GDF15). Of those cytokines, SPP1 and GDF15 were chosen for further study because there was limited information about their role in T1D, yet they have been described as regulating different aspects of the immune response (Artz et al., 2016; Bootcov et al., 1997; Cai et al., 2018; Clemente et al., 2016; Kahles et al., 2014). We first validated cytokine-mediated downregulation of SPP1 and GDF15 by treating the EndoC-βH1 human β-cell line and the mouse MIN6 β-cell line with IL-1β + IFN-γ. Immunoblot analysis confirmed the reduction in SPP1 and GDF15 protein expression in response to cytokine treatment by 25% and 35%, respectively, in EndoC-βH1 cells (Figure 2B). Similar results were observed in MIN6 cells (Figure 2C). We next analyzed the expression of GDF15 and SPP1 in vivo in mouse islets from non-obese diabetic (NOD) mice, a model of autoimmune diabetes (Makino et al., 1980). Pancreata from 8-week-old normoglycemic female NOD mice with or without insulitis were analyzed by immunofluorescence using antibodies against GDF15 and SPP1. There was a decreased abundance of GDF15 and SPP1 in islets from NOD mice with insulitis compared to those from NOD mice without insulitis (Figures 2D and 2E). Taken together, these results suggest that several pathways, including cytokine-receptor interaction, antigen presentation, and apoptosis, are regulated by the IL-1β + IFN-γ treatment in human islets. The results also demonstrated a downregulation of GDF15 and SPP1 in β cells, a finding that was also observed in murine islets with insulitis in vivo.
Mechanism Regulating GDF15 and SPP1 Expression in Human Islets
Pro-inflammatory cytokines can regulate the levels of proteins by a variety of mechanisms, ranging from transcription and translation to protein degradation and secretion (Carpenter et al., 2014). To investigate possible regulatory mechanisms, we compared the protein and transcript levels of GDF15 and SPP1 in human islets treated with IL-1β + IFN-γ. Both proteins were significantly reduced in response to cytokine treatment: GDF15 was downregulated by 70%, and SPP1 was reduced by approximately 60% (Figure 3A). These data were confirmed by immunoblot analysis, which showed a reduction of approximately 20% and 60% in the levels of SPP1 and GDF15, respectively (Figures 3A and S2). Consistent with a likely transcriptional mechanism of regulation, levels of the mRNA encoding SPP1 were coordinately decreased by about 70% by cytokine treatment (Figure 3A). By contrast, levels of the mRNA encoding GDF15 were increased two-fold by cytokine treatment, suggesting a regulation of this protein at the post-transcriptional level. We then investigated whether this phenomenon was restricted to GDF15 by comparing the expression of the 387 proteins regulated by IL-1β + IFN-γ to their corresponding mRNA levels from a transcriptomics analysis of human islets exposed to the same cytokines (Eizirik et al., 2012). Among the proteins whose expression increased following cytokine treatment, 65% showed a synchronized increase in their corresponding mRNAs (Figure 3B). In contrast, only 35% of the downregulated proteins showed a significant decrease in their transcript levels (Figure 3B). Together, these data suggest that decreases in protein abundance are more likely to be independent of reduction in transcriptional rates, whereas increases in protein expression correspond to coordinate increases in mRNAs.
Figure 3. Growth/Differentiation Factor 15 (GDF15) Expression Is Post-transcriptionally Regulated in β Cells Treated with Cytokines.
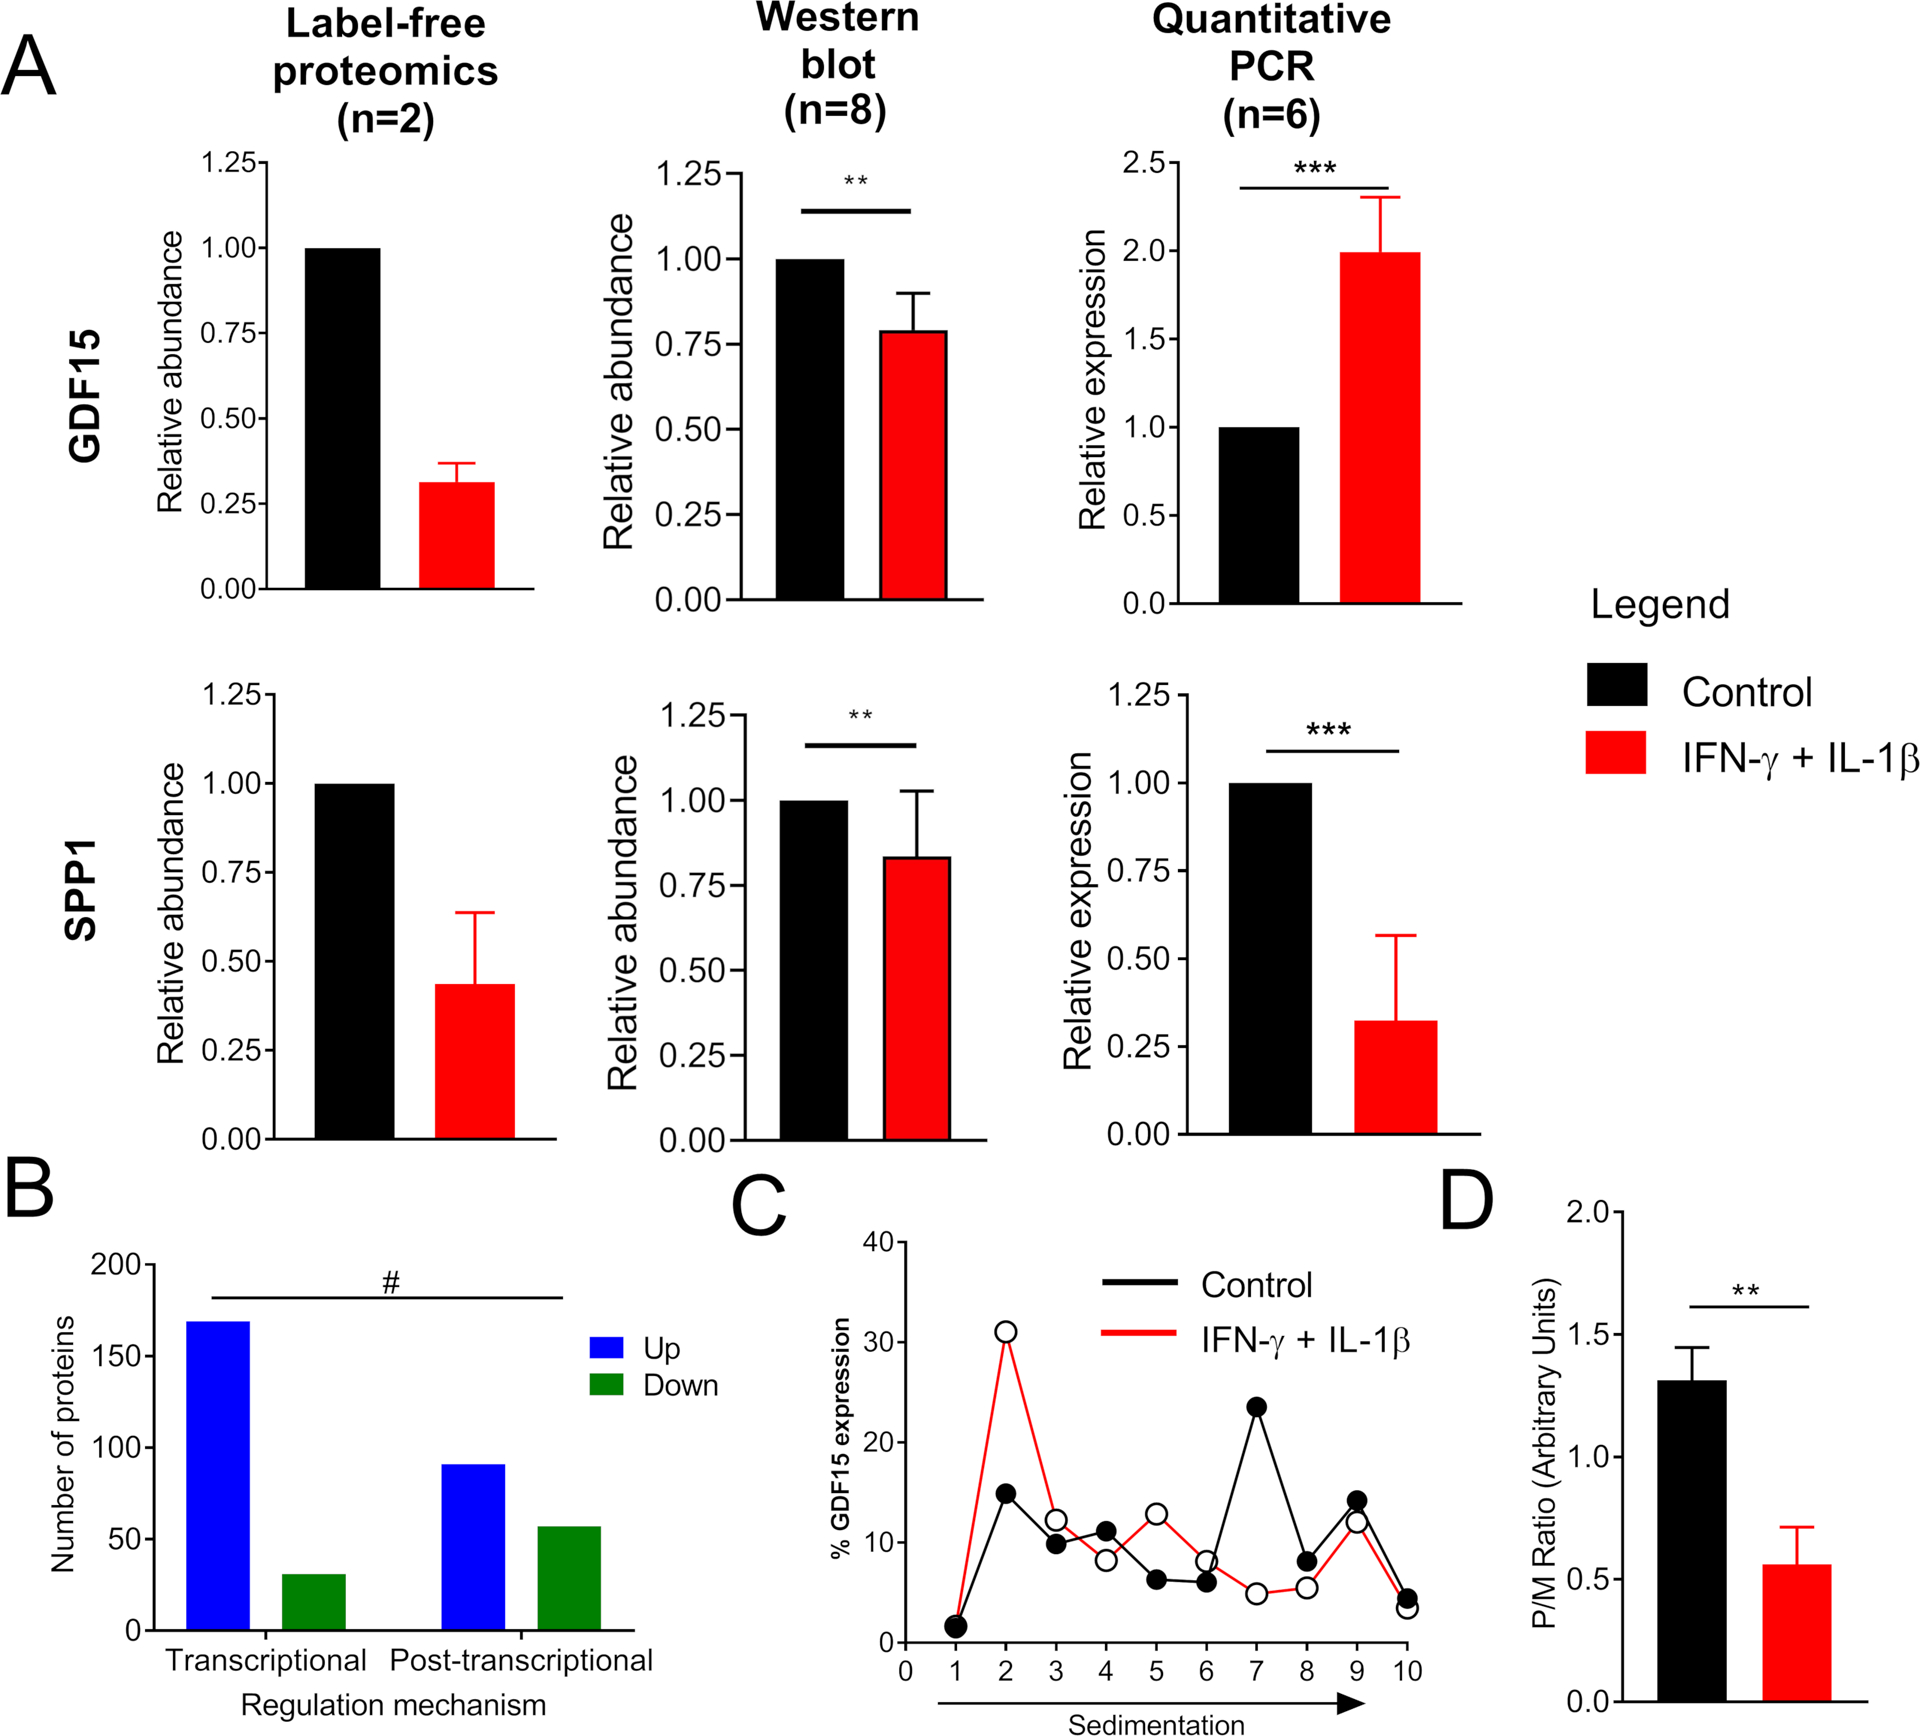
(A) GDF15 and SPP1 levels in human islets treated with the combination of cytokines IL-1β+IFN-γ were measured by label-free proteomics, western blot, and qPCR. The western blot image is shown in Figure S2.
(B) Regulation of protein abundances by IL-1β+IFN-γ. All the 387 significantly regulated proteins were compared against their transcript levels from a previous publication (Eizirik et al., 2012). The graph shows proteins that had their mRNA and protein levels regulated in a synchronized or unsynchronized fashion.
(C) Polyribosomal profiling of GDF15 transcript in EndoC-βH1 cells treated with the combination of cytokines IL-1β+IFN-γ.
(D) Ratio of GDF15 transcript bound to poly over monoribosomes (P/M).
t test: *p ≤ 0.05, **p ≤ 0.01 and ***p ≤ 0.001. Fisher’s exact test: # p ≤ 0.0001.
Several posttranscriptional mechanisms might account for regulation of protein levels, including alterations at the level of ribosome engagement during mRNA translation, for instance, secondary to ER stress (Carpenter et al., 2014). To test whether the decrease in GDF15 protein level during cytokine treatment was due to a block in GDF15 mRNA translation, we performed polyribosomal profiling experiments (Templin et al., 2014). Results from polyribosomal profiling showed that during cytokine treatment, GDF15 mRNA was found mostly in the monoribosomal fractions, as measured by qPCR (Figures 3C and 3D). These results indicate that GDF15 mRNA translation is blocked by treatment with pro-inflammatory cytokines.
GDF15 Protects β Cells from IL-1β- and IFN-γ-Induced Cell Death
As shown in Figure S2, not all proteins in the apoptotic pathway were upregulated with the cytokine treatment. We hypothesized that downregulated proteins in this pathway could be anti-apoptotic factors, since the treatment induces cell death. To test this hypothesis, we first performed a network analysis with the Metacore tool of the downstream signaling regulated by GDF15 and SPP1. This analysis showed some overlap on the signaling transduction pathways, with both GDF15 and SPP1 signaling converging to regulating apoptosis (Figure 4A), thereby indicating their potential on regulating cell death. We then pre-treated the human insulin-producing EndoC-βH1 cells with 50 ng/mL of recombinant SPP1 (rSPP1) or 100 ng/mL of recombinant GDF15 (rGDF15) for 12–16 h followed by treating with IFN-γ + IL-1β for another 24 h. Apoptosis was assessed by western blot analysis of cleaved caspase 3. As expected, IFN-γ + IL-1β treatment alone induced apoptosis as indicated by 3-fold increase in the amount of cleaved caspase 3 (Figures 4B–4D). Pretreatment with GDF15 and SPP1, however, led to an ~50% reduction in cleaved caspase 3 (Figures 4B–4D). We performed similar treatment of human islets and measured caspase 3/7 activity by a luminescence assay, which confirmed a complete protection by rGDF15 and rSPP1 pre-treatment against cytokine-induced apoptosis (Figure 4E). Additionally, viability and apoptosis studies on human islets performed using flow cytometry showed similar beneficial effects of rGDF15 and rSPP1 against cytokines (Figure S3). Therefore, we conclude that GDF15 and SPP1 protect EndoC-βH1 cells and human islets from apoptosis induced by exposure to IFN-γ + IL-1β.
Figure 4. Growth/Differentiation Factor 15 (GDF15) and Osteopontin (SPP1) Block Interferon (INF)-γ- and Interleukin (IL)-1β-Induced Apoptosis.
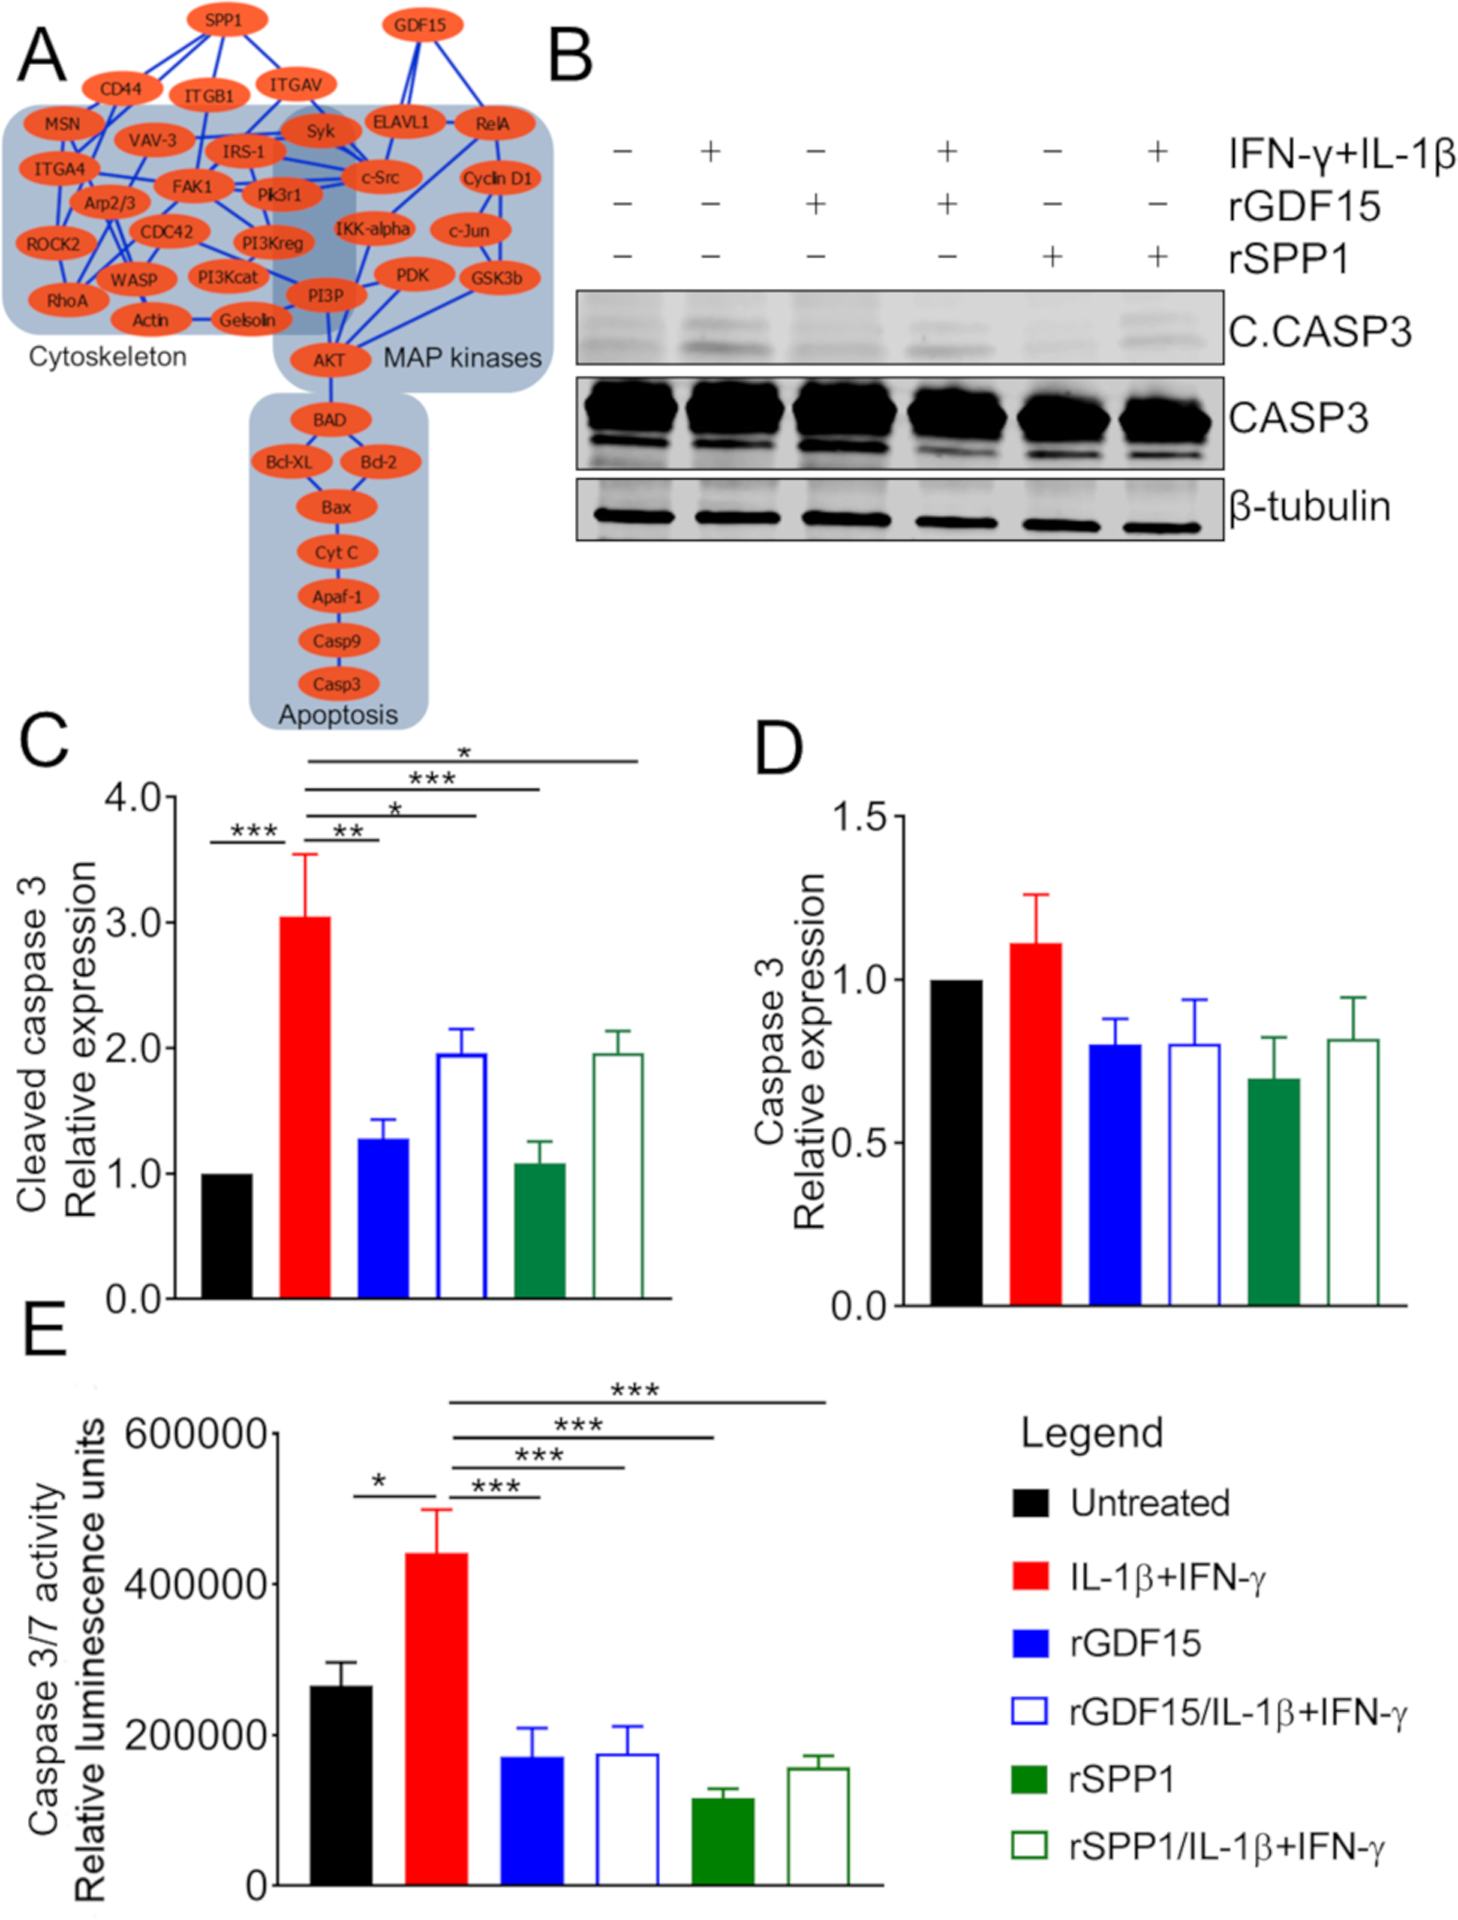
(A) Network analysis using MetaCore of downstream signaling of GDF15 and SPP1. Note that both GDF15 and SPP1 regulate the apoptotic pathway by different but overlapping signaling.
(B) EndoC-βH1 human β cells pretreated with SPP1 and GDF15 and then stimulated with the cytokines INF-γ and IL-1β. Cell lysates were analyzed by western blot by probing with anti-cleaved (active) caspase 3, anti-caspase 3, and anti-β-tubulin (loading control) antibodies.
(C and D) Quantification of western blot bands from
(B). Relative expression of cleaved caspase 3 in different samples compared to the untreated control sample (C). Relative expression of caspase 3 in different samples compared to the untreated control sample (D).
(E) Caspase 3/7 activity measured by luminescent enzymatic assay (expressed in relative luminescence units) in human islets pretreated with SPP1 and GDF15 and then stimulated with the cytokines INF-γ and IL-1β.
A cross-validation experiment by flow cytometry is shown in Figure S3. t test: *p ≤ 0.05, **p ≤ 0.01 and ***p ≤ 0.001.
GDF15 Inhibits Insulitis and Decreases Incidence of Diabetes in NOD Mice
After determining that GDF15 protected β cells from IFN-γ + IL-1β-induced apoptosis, we addressed the question of whether it could also protect pancreatic islets in vivo. Therefore, we treated 6-week-old female NOD mice (n = 5) every two days for two weeks with rGDF15 or vehicle alone. The body weight and blood glucose levels were monitored over the treatment period and were shown to be stable and unaffected by the GDF15 administration (Figures 5A and 5B), which is expected since at this stage, NOD mice are not yet hyperglycemic. After the treatment period, mice were euthanized and pancreata were excised for histopathological analysis. This analysis showed a significant decrease in insulitis of GDF15-treated mice compared to the control group (Figures 5C and 5D). The decrease in insulitis was accompanied by a reduction in oxidative stress, as shown by immunostaining of the lipid peroxidation marker, 4-hydroxynonenal (4HNE) (Figure 5E). Having shown that GDF15 reduced insulitis, we hypothesized that it could also prevent or delay the incidence of diabetes. To test this hypothesis, 6-week-old NOD mice (n = 20) were treated with rGDF15 every 2 days for 4 weeks and monitored for up to 24 weeks of age for the development of diabetes (defined as blood glucose > 250 mg/dL on two consecutive measurements). GDF15 treatment reduced by 53% (p = 0.006) the incidence of diabetes in these mice (Figure 6). Overall, these data show a reduction in insulitis and oxidative stress by GDF15 in vivo, leading to reduced incidence of diabetes in NOD mice.
Figure 5. Growth/Differentiation Factor 15 (GDF15) Reduces Insulitis in NOD Mice.
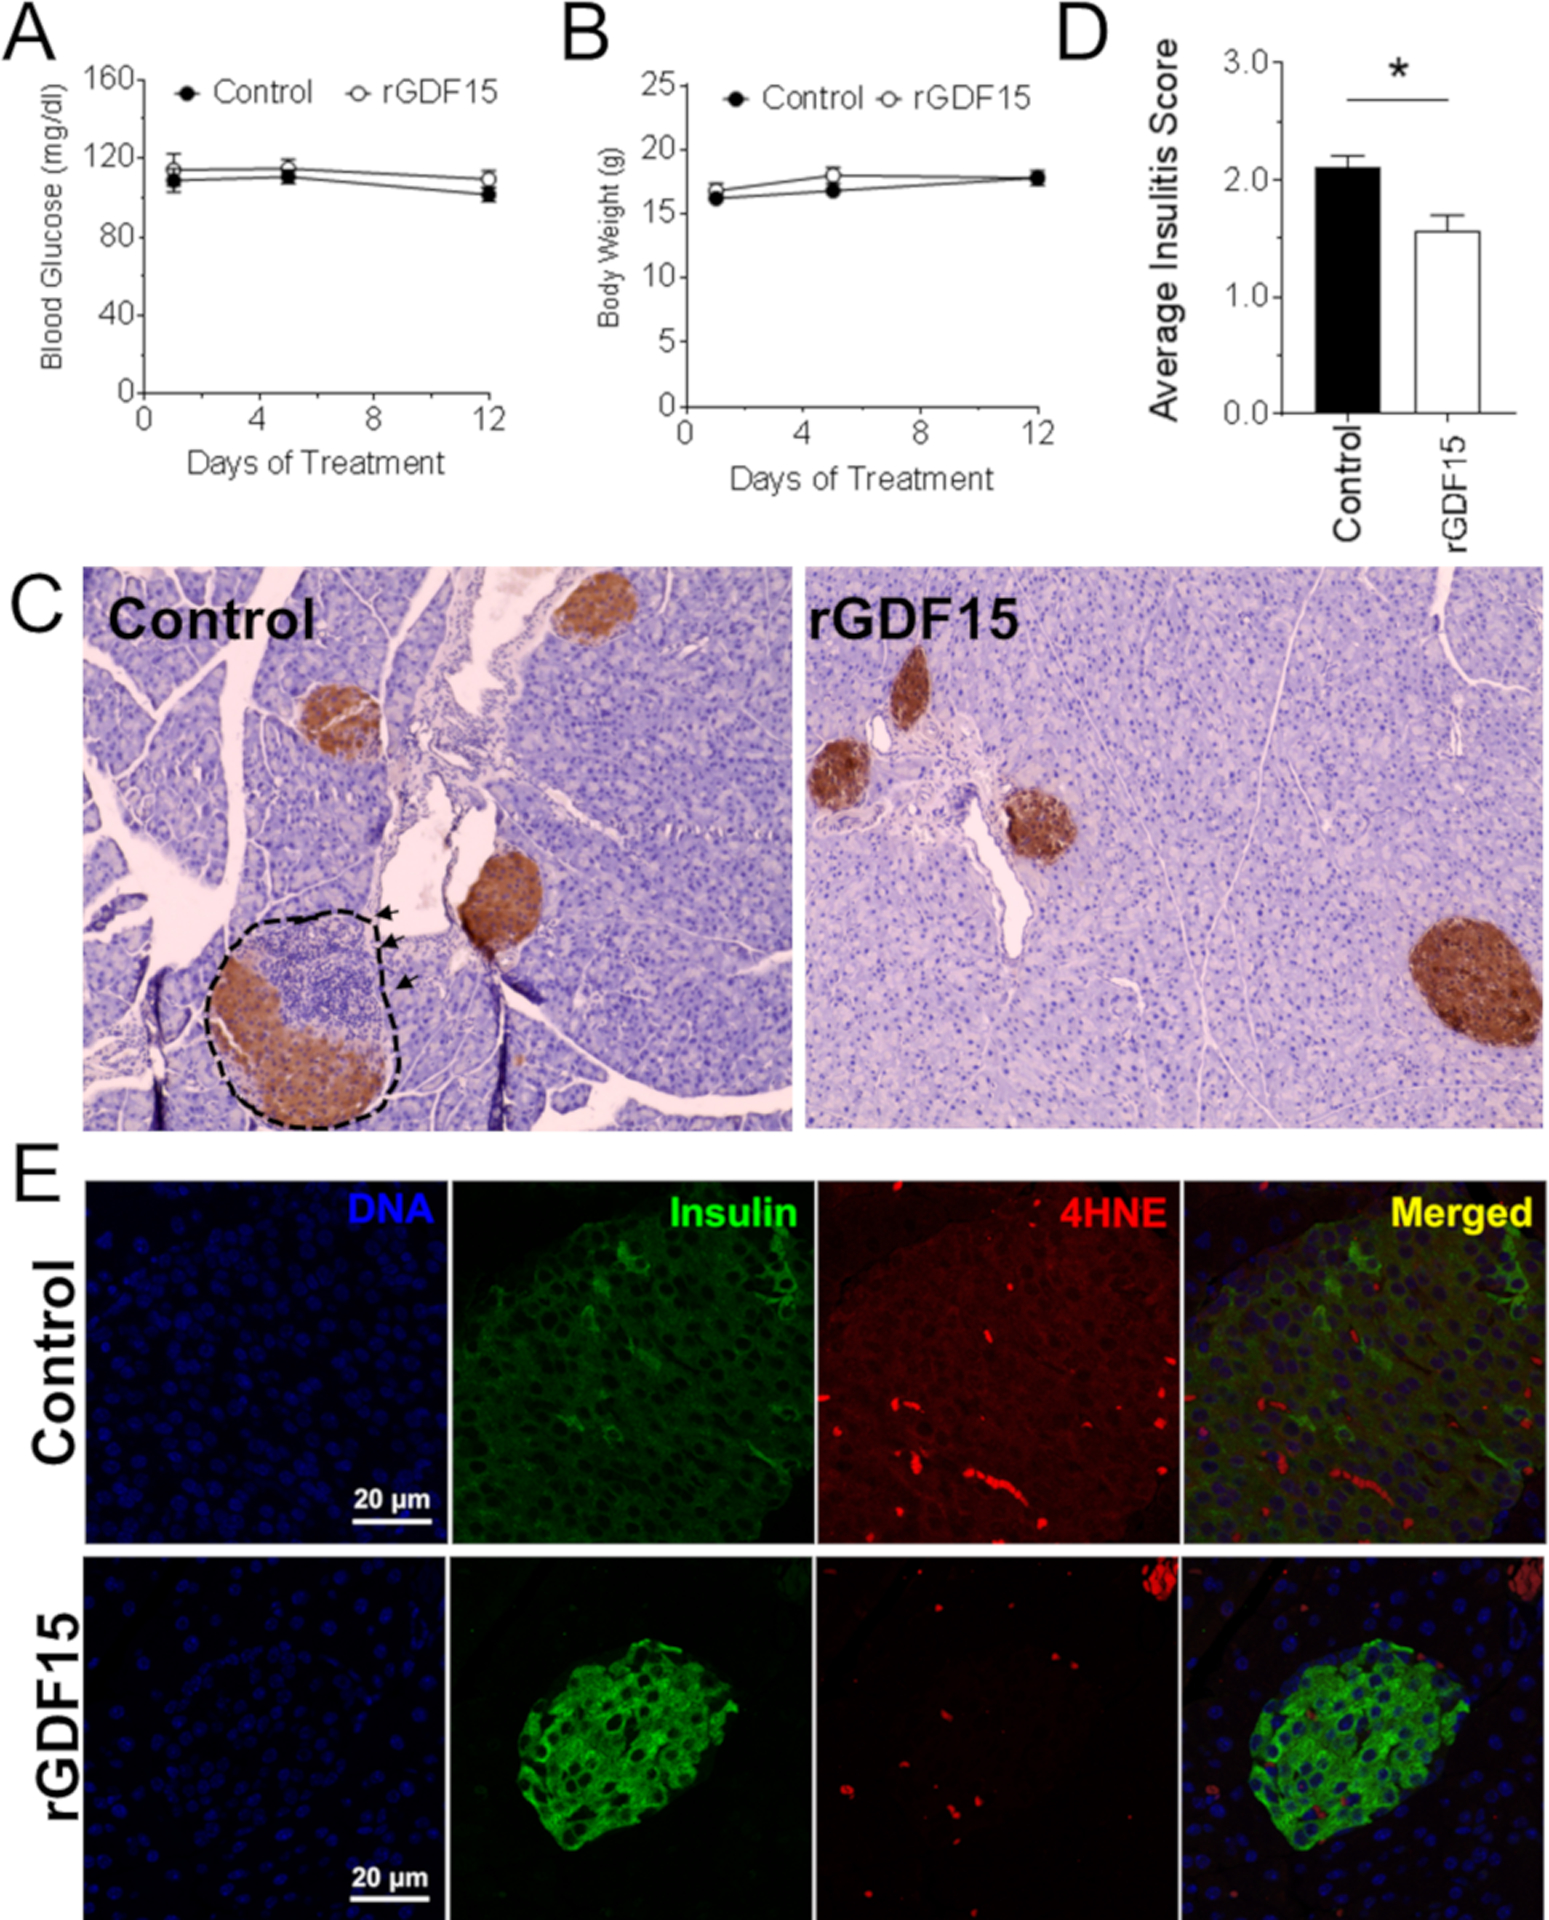
NOD mice (n = 5 per group) were injected intraperitoneally every second day for two weeks with 0.5 mg/kg recombinant GDF15 (rGDF15) and monitored for body weight, blood glucose, insulitis, and oxidative stress.
(A and B) Body weight (A) and blood glucose levels
(B) of mice treated with GDF15.
(C) Immunohistochemistry of pancreata from mice treated or not with GDF15.
(D) Degree of insulitis in control mice and mice treated with GDF15.
(E) Immunofluorescence staining of 4-hydroxynonenal (4HNE) of pancreata from mice treated or not with GDF15.
t test: *p ≤ 0.05.
Figure 6. Effect of Growth/Differentiation Factor 15 (GDF15) on the Development of Diabetes in NOD Mice.
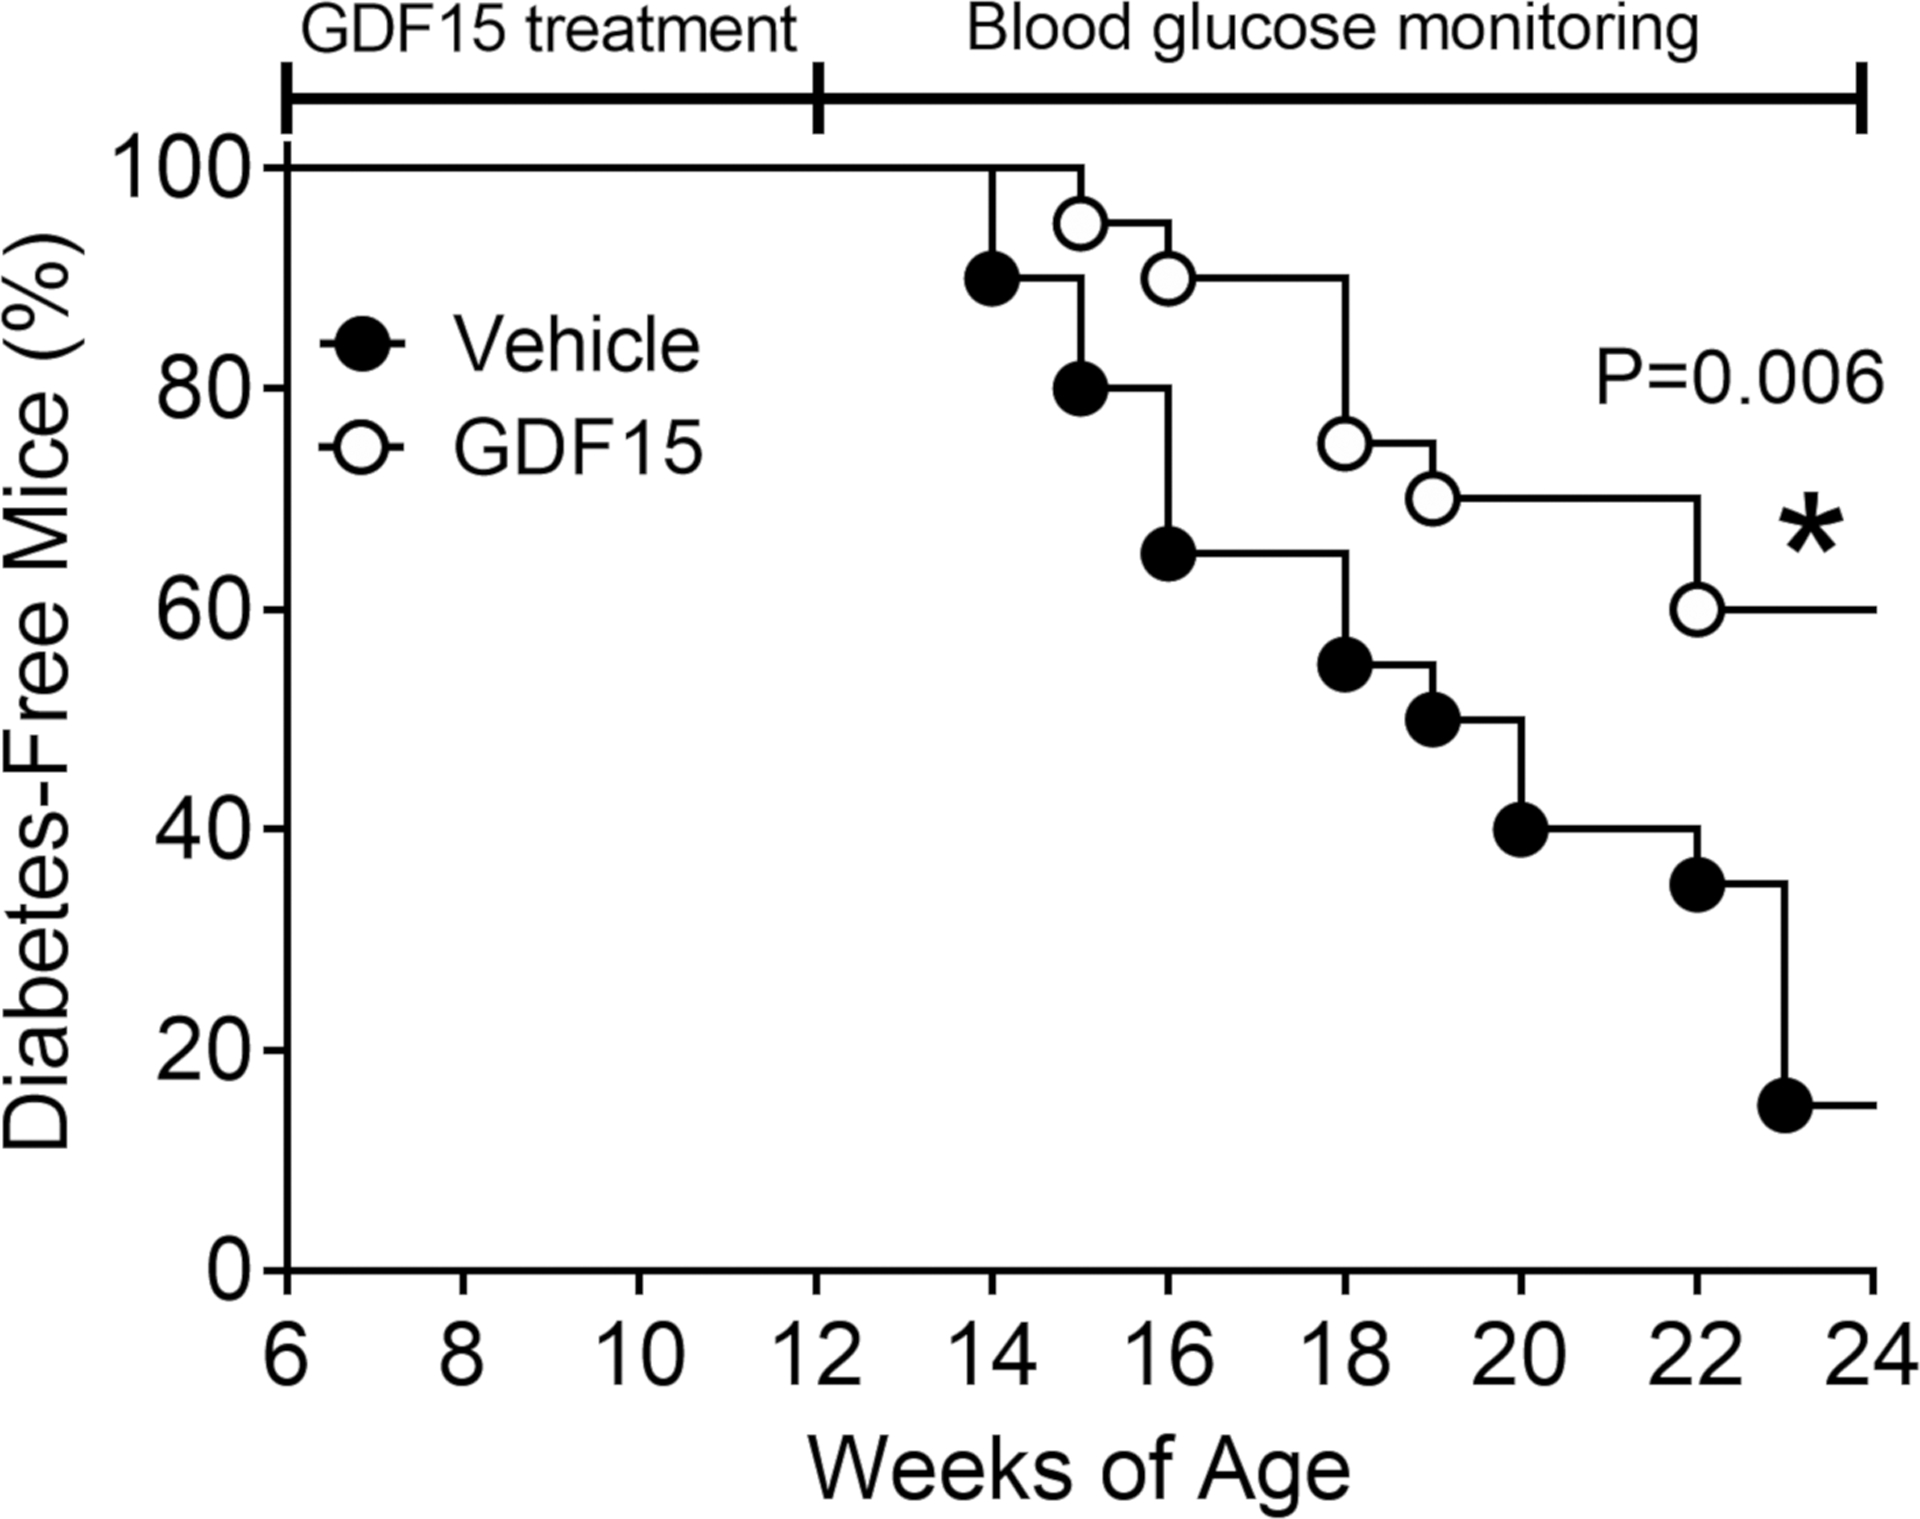
NOD mice (n = 20 per group) were injected intraperitoneally every two days between 6 and 12 weeks of age with 0.5 mg/kg recombinant human GDF15 (rhGDF15) and monitored for blood glucose until >80% of the control group developed diabetes (defined as glucose > 250 mg/dL on two consecutive measurements). *Statistical analysis was performed using Mantel-Cox test.
GDF15 Levels in Pancreatic Sections of Individuals with Diabetes
Finally, to validate our findings from in vitro and in vivo models in human T1D, we investigated the levels of GDF15 in pancreas from donors with diabetes. The immunostaining analysis showed that GDF15 was present in different parts of the pancreas but with relatively higher abundance in islets (Figure 7A, row 1). Islets from donors with T1D exhibited an ~10-fold reduction in GDF15 abundance (Figures 7A, rows 2 and 3, and 7B). Two of the donors with T1D had residual insulin abundance and decreased but still detectable levels of GDF15 (Figures 7A, row 3, and 7B). On the other hand, islets from individuals with T2D and from individuals with no diabetes had similar abundance of GDF15 (Figures 7A, row 4, and 7B). For comparison, no significant changes in the levels of glucagon abundance were observed in islets from donors with T1D or T2D compared to the control group. Taken together, our data showed that the abundance of GDF15 is reduced in islets of individuals with T1D, similar to what we found with islets treated with pro-inflammatory cytokines and in islets from NOD mice with insulitis.
Figure 7. Expression of GDF15 in Human Pancreas.
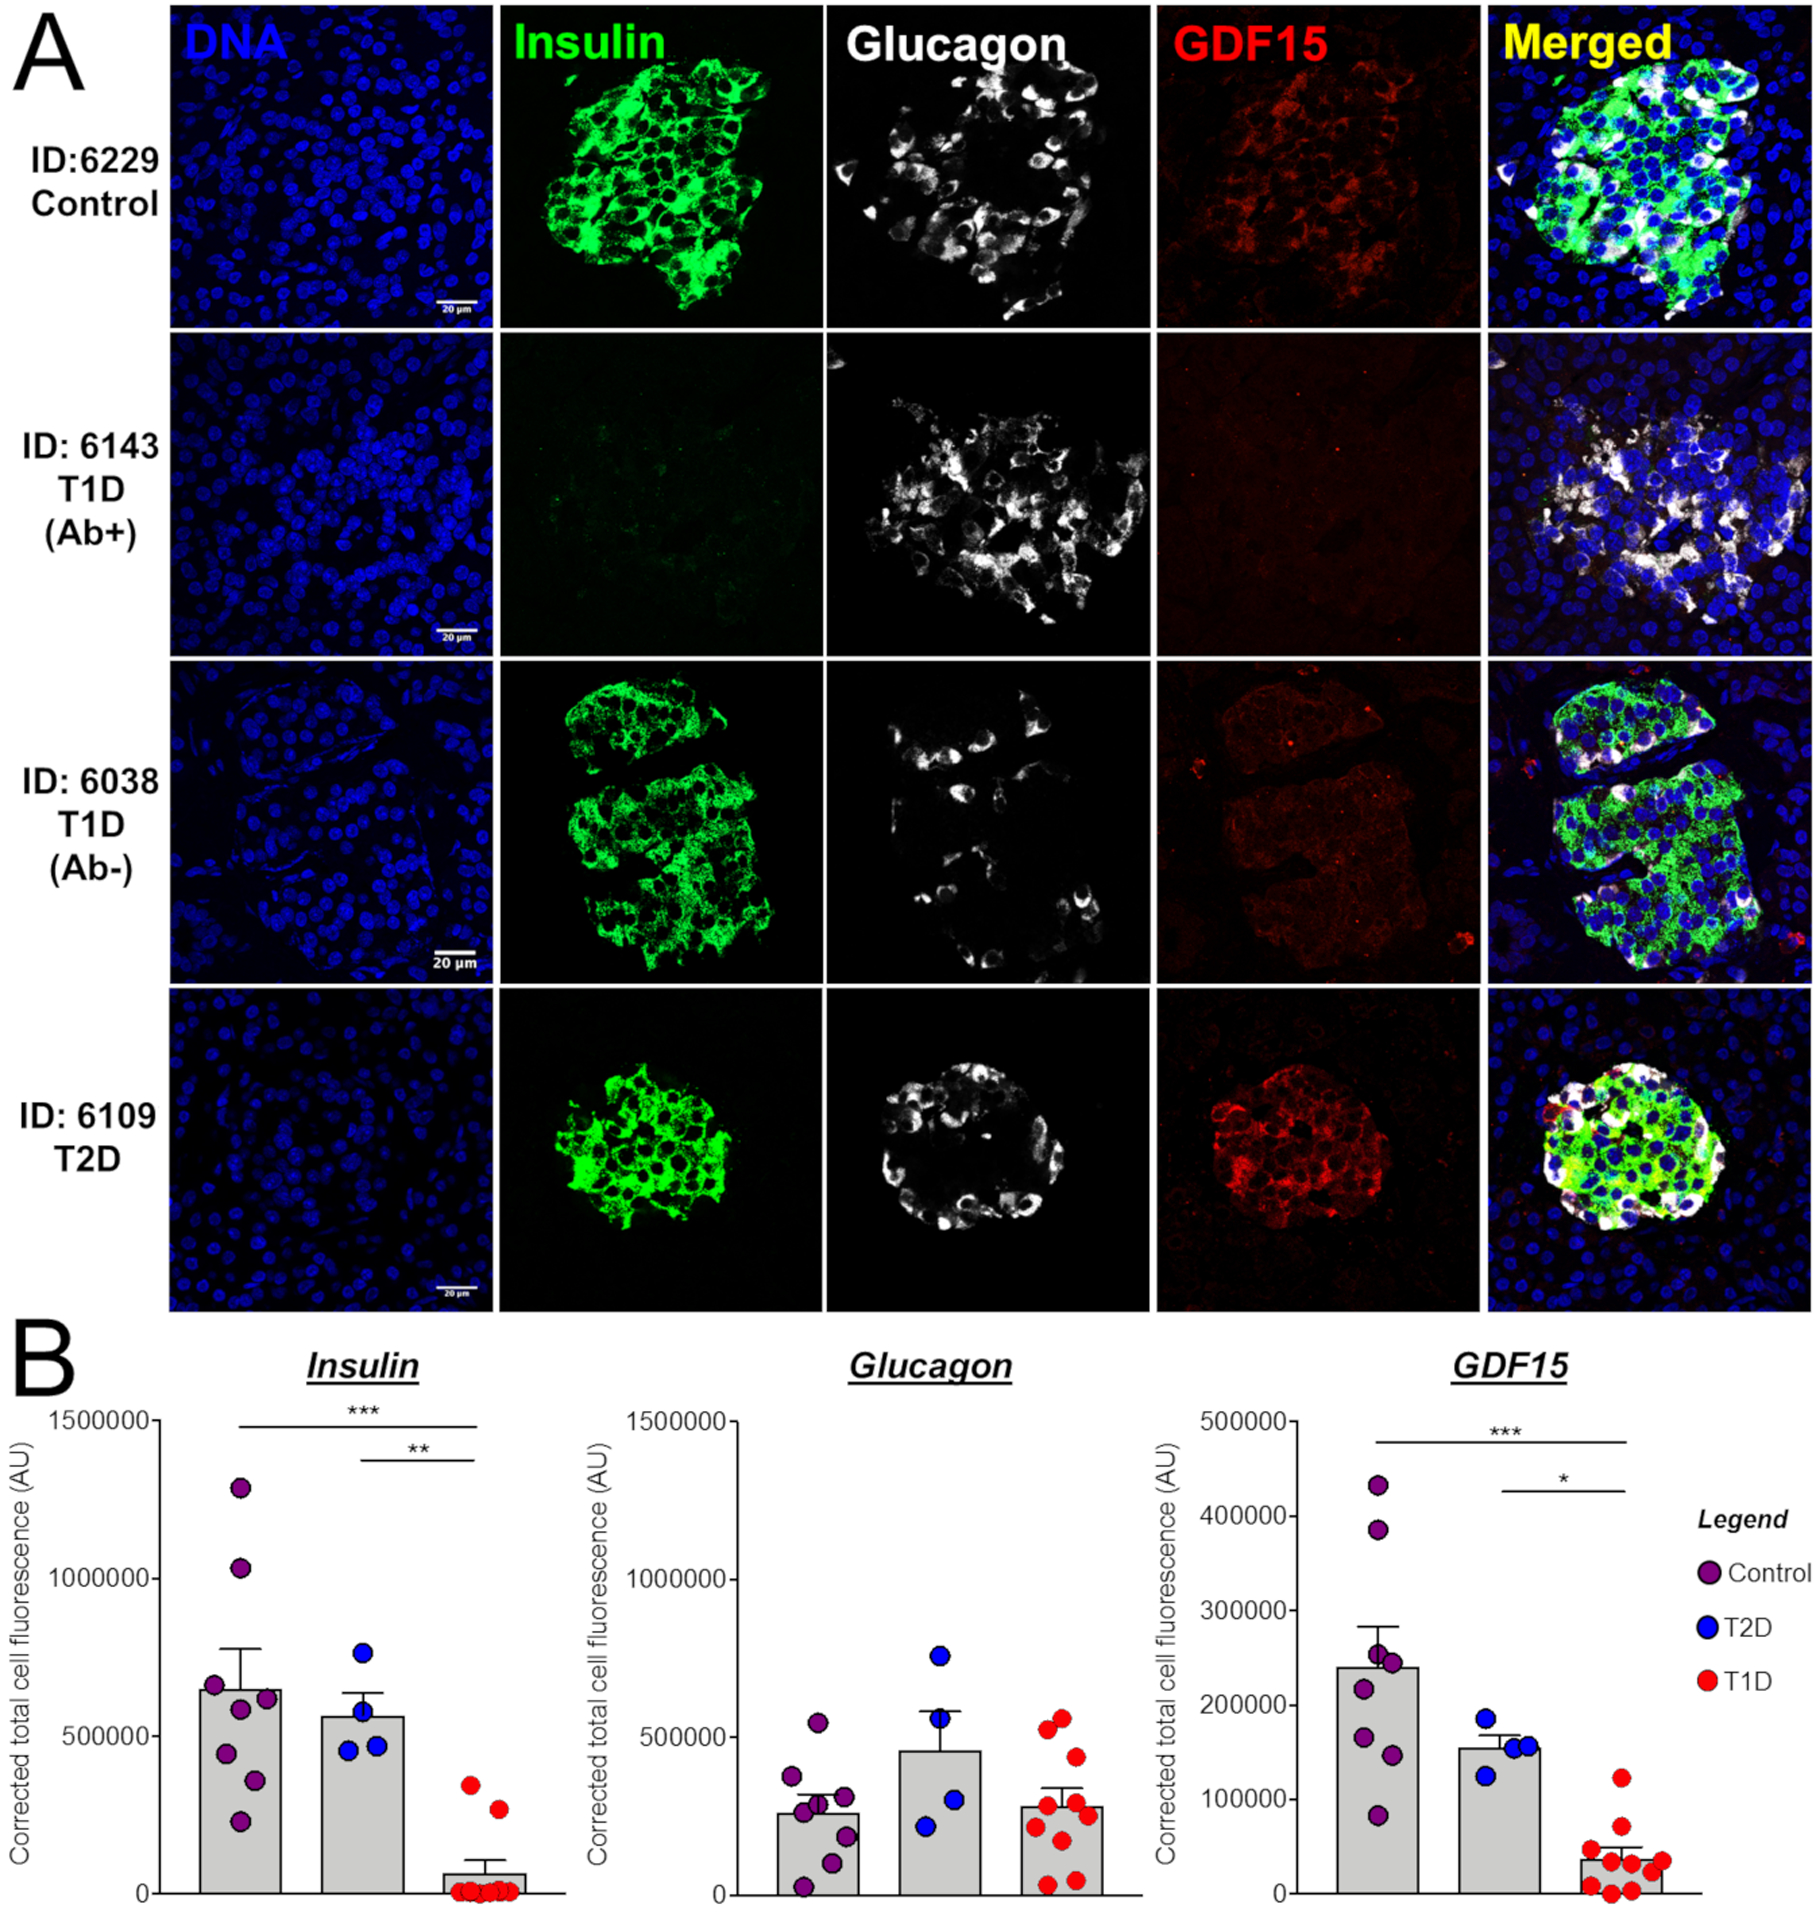
(A) Pancreas tissue sections from normoglycemic human donors and from those diagnosed with T1D and T2D were stained for DNA, insulin, glucagon, and GDF15. IDs represent donor identification numbers from the Network for Pancreatic Organ Donors with Diabetes (nPOD) (Table S4). Scale bars represent 20 μm.
(B) Quantification of staining intensities of insulin, glucagon, and GDF15.
ANOVA Test: *p ≤ 0.05, **p ≤ 0.01 and ***p ≤ 0.001.
DISCUSSION
In this paper, we aimed to the test the balance between pro- and anti-apoptotic signaling induced by cytokines in the context of β-cell death by performing a comprehensive proteomics analysis of cytokine-treated islets. In our study, we leveraged recent advances in mass spectrometry-based proteomics to enable the detection of many extremely low abundance proteins, such as cytokines, chemokines, and growth factors, providing a more complete picture of the pathways regulated by pro-inflammatory cytokines in human islets. This deep proteomics coverage resulted in the precise identification and quantification of over 11,000 proteins in human islets. Overall, the treatment revealed a strong regulation of pathways such NF-κB signaling, cytokine-cytokine receptor interaction, apoptosis, and antigen processing and presentation. Supporting the hypothesis that β cells die due to an imbalance between pro- and anti-apoptotic factors, well-described apoptotic activators, such as PTPN2 and STAT1 (Santin et al., 2011; Suk et al., 2001), were upregulated with the treatment, whereas SPP1 and connective tissue growth factor (CTGF), proteins described to protect and regenerate β cells, respectively (Guney et al., 2011; Lyssenko et al., 2011), were downregulated after the IFN-γ + IL-1β treatment.
To further investigate the balance between pro- and anti-apoptotic factors, we next studied the mechanism of GDF15 downregulation due to IFN-γ + IL-1β treatment, since GDF15 had previously been shown to inhibit apoptosis in endothelial cells (Li et al., 2013). We showed that GDF15 abundance was reduced in cytokine-treated human islets and in human and rodent β cell lines by translational blockade. This phenomenon seems to be extensive and not restricted to GDF15, since only 35% of the downregulated proteins were regulated at the transcriptional level. In terms of GDF15 regulation, this gene is post-transcriptionally regulated in murine macrophages by tristetraprolin (TTP or ZFP36), an RNA-binding protein that targets transcripts containing adenylate-uridylate (AU)-rich elements (AREs) for degradation (Tiedje et al., 2016). TTP is indeed a major regulator of the inflammatory response by targeting cytokine mRNAs to degradation, as these transcripts often bear AREs (Sedlyarov et al., 2016). TTP has also been shown to bind and prevent specific transcripts to be translated (Brooks and Blackshear, 2013), but its role in regulating GDF15 levels in the islets requires further investigation. Of note, TTP mRNA expression is increased by >2-fold (p < 0.05) following IFN-γ + IL-1β treatment of human islets, as evaluated by RNA sequencing of two different batches of human islet preparations (n = 5 each) (Eizirik et al., 2012; Gonzalez-Duque et al., 2018).
We next showed that GDF15 inhibited cytokine-induced apoptosis of human islets and a β-cell line. GDF15 was first reported to act as an anti-inflammatory cytokine that decreases the production of TNF-a in macrophages activated with bacterial lipopolysaccharide (Bootcov et al., 1997). The anti-apoptotic property of GDF15 is not surprising, since it inhibits inflammation, a process that often triggers apoptosis. Indeed, anti-apoptotic effects of GDF15 have been documented in other tissues (Heger et al., 2010; Schiegnitz et al., 2012), but they have not been studied in islets yet. In terms of signaling, the GDF15 receptor was recently identified to be GDNF family receptor α-like (GFRAL), which requires co-receptor RET to elicit intracellular signaling (Emmerson et al., 2017; Hsu et al., 2017; Mullican et al., 2017; Yang et al., 2017). Despite the deep coverage of our proteomic analysis, GFRAL and RET proteins were not detected, which indicates that these proteins might be expressed at very low levels. There is also a possibility that GDF15 interacts with a different receptor or that it inhibits pro-apoptotic signaling by other mechanisms. For instance, Luan et al. showed that GDF15 induces immune tolerance in acute infections and sepsis through mobilization of triacylglycerols from the liver, which reduces inflammation systemically (Luan et al., 2019). GDF15 has also been shown to inhibit angiogenesis by interacting and blocking CTGF signaling (Whitson et al., 2013). Interestingly, GDF15 and CTGF have been shown to be co-regulated in cardiac fibrosis and jejunum damage (Krusche et al., 2011; Yu et al., 2010), which was also observed in human islets treated with IL-1β + IFN-γ (Figure 2A). However, the role of this co-regulation in preventing β-cell apoptosis remains to be clarified.
GDF15 has been associated with a variety of metabolic syndrome-related diseases, such as cardiovascular diseases, obesity, and type 2 diabetes (Unsicker et al., 2013), and is a marker of myocardial infarction and a prognostic factor of heart failure (Khan et al., 2009). Increased levels of GDF15, however, do not seem to be a causative factor for heart failure but rather a consequence of the cellular responses aimed at repairing damaged heart muscle (Kempf et al., 2011). Indeed, molecular studies have shown that GDF15 protects the heart from fatal rupture after myocardial infarction (Kempf et al., 2011). In obesity, GDF15 was first associated with anorexia-cachexia of cancer patients, likely as the consequence of overexpression of this protein by tumor or tumor-associated immune cells (Tsai et al., 2016), observations that were fundamental for the discovery of its functions in controlling body weight. High levels of GDF15 activate the GFRAL receptor in the hindbrain, reducing appetite and food intake and promoting weight loss (Chung et al., 2017; Emmerson et al., 2017; Hsu et al., 2017; Mullican et al., 2017; Yang et al., 2017). In addition, GDF15 was shown to be an important signal in response to nutrition stress induced by long-term high-fat feeding or dietary amino acid imbalance (Patel et al., 2019). In diabetes, increased levels of GDF15 are present in the plasma of individuals with T2D, but this phenomenon seems to be independent of the incidence of the disease (Carstensen et al., 2010). Moreover, GDF15 improves insulin sensitivity in mice fed a high-fat chow (Chung et al., 2017; Jung et al., 2018; Lee et al., 2017), showing its potential for treating T2D. Our data add another element to this growing literature; namely, it indicates a directly protective effect of GDF15 against cytokine-induced β-cell apoptosis. This protection was also observed in vivo, as GDF15 administration reduced by 53% the incidence of diabetes in NOD mice. Although it is difficult to make a direct comparison due to differences in the treatment regimens, similar levels of protection were observed for anti-CD3, ω−3 fatty acid, and palmitic acid esters of hydroxy stearic acid treatments (Bi et al., 2017; Bresson et al., 2006; Syed et al., 2019).
In conclusion, we present a unique resource for the identification of human islet proteins regulated by pro-inflammatory cytokines. By mining this new dataset, and integrating it with available RNA sequencing data, we detected an imbalance between pro- and anti-apoptotic proteins modulated by IL-1 + IFN-γ in β cells. This imbalance includes a post-transcriptional downregulation of GDF15, presently shown to act as an anti-apoptotic protein. This finding provides a proof of concept for the utility of the present resource. Additional extension and mining of the human islet proteome has the potential to indicate novel avenues for the therapy of diabetes.
Limitations of Study
Here, we have shown that GDF15 can prevent IL-1β + IFN-γ-induced apoptosis in human islets and EndoC-βH1 cells. We also showed that it can inhibit insulitis and partially prevent diabetes in NOD mice. However, a limitation of the study is the lack of understanding of the GDF15 mechanism of action. We showed that GDF15 has effects directly in human islets and EndoC-βH1 cells, but its receptor, GFRAL, is currently thought to be only expressed in the hindbrain (Emmerson et al., 2017; Hsu et al., 2017; Mullican et al., 2017; Yang et al., 2017). Therefore, additional work needs to be done to determine whether GDF15 has a receptor in human islets or if it acts through a systemic action of the hindbrain.
STAR★METHODS
LEAD CONTACT AND MATERIALS AVAILABILITY
Requests for further information and resources should be directed to and will be fulfilled by the Lead Contact, Thomas Metz (thomas.metz@pnnl.gov). Proteomics data are available as described below. No other reagents or resources were generated as a part of this study.
EXPERIMENTAL MODEL AND SUBJECT DETAILS
Human Islets
Pancreatic islets from cadaveric donors were acquired from the Integrated Islet Distribution Program (IIDP) (Brissova et al., 2019). Because the tissues came from cadaveric donors, the study was not considered human subjects research, and no consent was required.
The characteristics of the tissue donors are listed in Table S3. The mean and standard deviation in age of the donors was 44.1 ± 12.8 years. The mean and standard deviation in BMI of the donors was 28.9 ± 5.1. Islets were obtained from 15 males and 12 females.
To ensure the biological significance of the data we performed a post hoc statistical power analysis. The average power with a paired sample size of 5 was 0.93 for both proteomics sets 1 and 2. Evaluating each protein for adequate power indicated that 87.7% of proteins in both sets had a power of greater than 0.8 to detect a fold-change of 1.5 for sets 1 and 2, respectively. (Figures S1A and S1B). The power analysis confirmed that the size of the present study is appropriate to investigate even small changes in protein abundances in response to the cytokine treatment.
An analysis of the influence of sex on the results of the study was not performed, since there was not adequate power in the study to address this question.
Human islets were received from IIDP as described above and were required to have a minimum of 85% purity as measured by dithizone and 90% viability. Islets were maintained in Standard Islet Medium (Prodo) supplemented with human AB serum (Prodo), Ciprofloxacin (Fisher) and glutamine and glutathione (Prodo) at 37°C, under 100% humidity and 5% CO2 atmosphere. To study the protective effect of GDF15 and SPP1, we pretreated islets with human recombinant 100 ng/mL GDF15 (Sino Biologicals) and 50 ng/mL SPP1 (GenTex), followed by cytokine treatment for 24 h. Recombinant GDF15 was previously tested for TGF-β contamination by ELISA, confirming absence of TGF-β in the sample.
EndoC-βH1 Human β Cell Line
EndoC-βH1 is a male, engineered cell line resulted from the lentiviral transfection of SV40LT expressed under the control of the insulin promoter (Ravassard et al., 2011). This cell line has been shown to respond to glucose stimulus by secreting insulin and it serves as an adequate model for studying cytokine-mediated β cell death (Gurgul-Convey et al., 2015; Gurgul-Convey et al., 2016).
EndoC-βH1 cells were obtained from Dr. R. Scharfmann (University of Paris, France) and cultured as described previously (Scharfmann et al., 2014). Briefly, EndoC-βH1 cells were maintained at 37°C and 5% CO2 atmosphere, and in DMEM media consisting of 1 g/L each of D-glucose and L-glutamine, 100 units/mL penicillin, 100 μg/mL streptomycin, 2% albumin from bovine fraction V, 50 μM 2-mercaptoethanol, 10 mM nicotinamide, 5.5 μg/ml transferrin, and 6.7 ng/mL sodium selenite. To study the protective effect of GDF15 and SPP1, we pretreated EndoC βH1 cells and human islets with human recombinant 100 ng/mL GDF15 (Sino Biologicals) and 50 ng/mL SPP1 (GenTex), followed by cytokine treatment for 24 h. Recombinant GDF15 was previously tested for TGF-β contamination by ELISA, confirming absence of TGF-β in the sample.
MIN6 Murine β Cell Line
MIN6 is a male, insulinoma-derived cell line from transgenic mice transfected with SV40 T-antigen that has the ability to secrete insulin on the presence of glucose (Ishihara et al., 1993).
MIN6 cells were maintained under standard culture conditions (Miyazaki et al., 1990). Briefly, MIN6 cells were maintained at 37°C and 5% CO2 atmosphere, and in DMEM media consisting of 4.5 g/L each of D-glucose and L-glutamine, 10% fetal bovine serum, 100 units/mL penicillin, 100 μg/mL streptomycin, 20 mM HEPES, and 50 mM 2-mercaptoethanol.
Mice
5-week-old female NOD/ShiLTJ (NOD) mice were purchased from Jackson Laboratories and maintained as per the approved protocol from Indiana University Animal Care and Use Committee. Mice were housed in a standard 12 h light:dark cycle (6:00am-6:00pm) with a temperature range between 18–23°C. Mice were fed a standard chow diet (2018S, Harlan Laboratories). Health status was checked daily by veterinary technicians.
NOD mice spontaneously develop autoimmune diabetes with many similarities to human T1D, such as pancreas autoantibodies and autoreactive CD4+ and CD8+ T lymphocytes (Anderson and Bluestone, 2005).
Human Pancreas
Histological slices of human pancreata from cadaveric donors were kindly provided by the Network for Pancreatic Organ Donors with Diabetes (nPOD) (Pugliese et al., 2014). Because the tissues came from cadaveric donors, the study was not considered human subjects research, and no consent was required.
The characteristics of the tissue donors are listed in Table S4. The mean and standard deviation in age of the donors was 39.3 ± 9.9 years for control individuals (n = 3 male and 5 female), 32.9 ± 5.3 for type 1 diabetic individuals (n = 4 male and 6 female), and 45.6 ± 8.1 for type 2 diabetic individuals (n = 2 male and 2 female). The mean and standard deviation in BMI of the donors was 26.5 ± 5.3 for control individuals, 25.5 ± 3.9 for type 1 diabetic individuals, and 34.6 ± 6.7 for type 2 diabetic individuals.
An analysis of the influence of sex on the results of the study was not performed.
METHOD DETAILS
Pancreatic Islet Culture and Treatment
The islet cultures were cultured as described above, left to recover overnight and then treated with cytokines by adding fresh medium containing 50 U/mL IL-1β and 1000 U/mL IFN-γ, or left untreated by adding fresh medium without cytokines, and cultured for 24 h. Treated islets were collected into microcentrifuge tubes and washed twice by adding PBS containing 1% phosphatase inhibitor cocktail (Thermo Fisher Scientific) and 10 mM NaF (Sigma Aldrich), spinning at 1200 rpm at 4°C for 2 min and discarding the supernatant. Samples were then flash frozen with liquid N2 and stored at −80°C before processing.
Proteomic Analysis Using Tandem Mass Tags
Samples were submitted to Metabolite, Protein and Lipid Extraction (MPLEx), as previously described (Nakayasu et al., 2016). Briefly, 300–500 treated or control islets from the same 10 donors were resuspended in milliQ water, and 5 volumes of 2:1 (v:v) chloroform:-methanol solution was added. The samples were then incubated on ice for 5 min, vigorously vortexed for 1 min and centrifuged at 12,000 rpm at 4°C for 10 min. The protein disk was collected and washed by adding cold (−20°C) methanol and centrifuging at the same conditions, while the lipid and metabolite fractions were isolated and saved for future analyses. Protein pellets were then dried in a vacuum centrifuge and dissolved in 50 mM NH4HCO3 containing 8 M urea and 10 mM dithiothreitol. After incubating for 1 h at 37°C with shaking at 800 rpm, 400 mM iodoacetamide was added to a final concentration of 40 mM, and the mixture incubated for another h at the same conditions. The reaction mixture was then diluted 8 folds with 50 mM NH4HCO3, and 1 M CaCl2 was added to a final concentration of 1 mM. Proteins were digested for 5 h at 37°C using trypsin at 1:50 enzyme:protein ratio. Digested peptides were desalted by solid-phase extraction using C18 cartridges (Discovery, 50 mg, Sulpelco) and dried in a vacuum centrifuge. Peptides were then labeled and sorted into 2 sets of tandem mass tags (TMT-10plex, Thermo Fisher Scientific) following the manufacturer’s recommendations and desalted again using C18 cartridges. Labeled peptides were fractionated into 24 fractions using high-pH reversed phase chromatography, dried in a vacuum centrifuge and resuspended in 0.1% formic acid (Wang et al., 2011).
Peptides were analyzed on a Waters NanoAquity UPLC system with a custom packed C18 column (70 cm × 75 μm i.d., Phenomenex Jupiter, 3 μm particle size, 300Å pore size) coupled with a Q-Exactive mass spectrometer (Thermo Fisher Scientific). Peptide separation was carried out with a gradient of water (solvent A) and acetonitrile (solvent B) both containing 0.1% formic acid (1%–8% B in 2 min, 8%–12% B in 18 min, 12%–30% B in 55 min, 30%–45% B in 22 min, 45%–95% B in 3 min, hold for 5 min in 95% B and 99%–1% B in 10 min). Eluting peptides were directly analyzed by nanoelectrospray ionization and full-MS scans were collected over 400–2000 m/z at a resolution of 35,000 at 400 m/z. The top 12 most intense parent ions were submitted to high-energy collision induced dissociation (HCD) fragmentation (2.0 m/z isolation width; 30% normalized collision energy; 17,500 resolution at 400 m/z), before being dynamically excluded for 30 s.
Tandem mass spectra were converted to DTA peak lists using Decon2LS_V2 (Mayampurath et al., 2008) combined with DTARefinery (Petyuk et al., 2010), both using default parameters. MSGF+ (Kim and Pevzner, 2014) was then used to search peptide spectra against islet protein sequences based on the RNAseq data from a previous study (Eizirik et al., 2012) deposited in RefSeq and supplemented with keratin sequences (32,780 total protein sequences). As searching parameters, the parent ion mass tolerance was set at 10 ppm, tryptic digestion in at least one of the termini was considered, and 2 missed cleavages were allowed. Cysteine carbamidomethylation and N-terminal/lysine TMT addition were searched as static modifications, whereas methionine oxidation was set as variable modification. Spectral-peptide matches were first filtered using a MSGF probability ≤ 1.0E −9, and then further filtered at protein level with a probability ≤ 1.0E −10, resulting in < 1% false-discovery rate.
Label-free Proteomic Analysis
Approximately 150 treated or control islets from 2 independent donors were obtained from IIDP as described above, and digested with trypsin using trifluoroethanol as a denaturing agent (Wang et al., 2005). Peptides were fractionated into 12 fractions by high resolution reversed phase capillary liquid chromatography employing a nanoACQUITY UPLC® system (Waters Corporation, Milford, MA) equipped with an autosampler. Capillary columns, 200 μm i.d. × 50 cm long, were packed with 3 μm Jupiter C18 bonded particles (Phenomenex, Torrence, CA). Separations were performed at a flow rate of 3.3 μL/min using a binary pump system, with 10 mM ammonium formate (pH 10.0) as mobile phase A and 10 mM ammonium formate in 90% acetonitrile (pH 10.0) as mobile phase B. 45 μL of peptide mixtures (0.5 μg/μL) were loaded onto the column and separated using a binary gradient of 5%–15% B in 15 min, 15%–25% B in 25 min, 25%–45% B in 25 min, and 45%–90% B in 38 min. The eluate was collected in 96 fractions and further concatenated into 12 samples, which were then individually analyzed by LC-MS/MS as described above. The data were processed with MaxQuant v.1.5.3.28 (Tyanova et al., 2016) by searching against the protein sequence database described above, and considering trypsin digestion specificity in at least one of the peptide termini, methionine oxidation as variable modification and cysteine carbamidomethylation as fixed modification. The ion mass tolerance was set at 20 and 4.5 ppm for the first and main peptide searches. The data were filtered at 1% false-discovery rate in both peptide-spectrum matches and protein levels. Then the quantification was performed by label-free quantification using default parameters.
Western Blotting
After cytokine treatment the human islets, EndoC-βH1 cells and MIN6 cells were harvested and lysed with lysis buffer and protein content was determined using the Lowry method. A total of 20 μg of protein per sample was electrophoresed on 4%–20% Bis-Tris gels (Bio-Rad) under denaturing conditions and blotted onto a PVDF membrane. The blots were blocked and probed for the following primary antibodies with overnight incubation at 4°C: cleaved caspase 3 (Cell Signaling; 1:1000), Caspase 3 (1:1000), GDF15 (Bioss; 1:500), SPP1 (Thermo Fisher Scientific; 1:1000), b-tubulin (Cell Signaling; 1:2000). Li-Cor anti-rabbit or anti-mouse (1:10000) secondary antibodies were used for the quantification of protein expression. The data were quantified using ImageStudio (LI-COR).
Caspase 3/7 Activity and Flow Cytometry Assay to Measure Apoptosis
Caspase-Glo 3/7 assay kit (Promega) was used to analyze caspase activity. Briefly, human islets were pre-exposed to 100 ng/mL rGDF15 or 50 ng/mL rSPP1 for 24 h and treated or not with 50 U/mL IL-1β and 1000 U/mL IFN-γ for additional 24 h. After the treatment period 25 islets per well with similar size were handpicked and suspended in 1:1 ratio of culture media to caspase-Glo reagent (100 μL of media + 100 μL of caspase-Glo reagent) in a 96 well plate and incubated for 1 h. The samples were read in a luminescent plate reader and the values were represented as relative luminescence units (RLU) of caspase 3/7 activity. We also measured cell viability by flow cytometry (BD, FACSCantoII) using the apoptotic (annexin V) and viability (7AAD) (BD Annexin A5 FITC/7-AAD Kit) markers. Briefly, human islets were dissociated by incubating them with 1mL of Accutase (edmillipore) and 1ul of DNase I (edmillipore) at 37°C for 10 min. After 10 min of incubation, 0.1% of BSA-PBS was added to stop the reaction and the cells were then washed twice with PBS and cultured overnight with islet culture media. After overnight culture the islets were replenished with fresh culture media and treated with or without rGDF15 and rSPP1 as mentioned above. On the day of measurement, the cells were washed twice with 0.1% BSA-PBS and incubated for 20 min at 37°C in KRBS buffer supplemented with 3.3 mM D-glucose and annexin V-FITC and 7-AAD and then analyzed using BD FACSCantoII.
Quantitative RT-PCR
Total RNA was isolated using RNeasy plus mini kit (QIAGEN) as per the manufacturer’s protocol. Reverse transcription was performed using M-MLV RT kit (Invitrogen) and qRT-PCR was performed using TaqMan probe-based approach (Applied Biosystems). TaqMan primer were used for the quantification GDF15 and SPP1 messenger RNA expression and b-actin was used as a house-keeping control for the normalization and the data were expressed as relative fold expression against untreated control samples.
Polyribosomal Profiling
Polyribosomal profiling studies were performed using untreated and IL-1β + IFN-γ treated human EndoC-βH1 cells. Briefly, cells were lysed and centrifuged on a 10%–50% sucrose gradient. BioComp piston gradient fractionator connected with an in-line UV monitor (absorbance 254 nm) was used to determine the RNA and gradients were collected in ten 1mL fractions. Fractions from 1 to 5 were considered to be monoribosome-associated RNAs and fractions 6 to 10 were considered to be polyribosome-associated RNAs. PM ratio (polysomes to monosomes ratio) was calculated by area under the curve (AUC) of polysome fractions (more than two ribosomes) divided by area under the curve of monosome fractions (80S ribosome). Percentage of mRNA expression was calculated as described previously (Templin et al., 2014). P/M ratio for GDF15 mRNA was calculated by using total percentage of 6 to 10 polysome fractions divided by total percentage of 1 to 5 monosome fractions.
Animal Studies
For the insulitis study, NOD mice (n = 5) were acclimatized for one week and were then injected intraperitoneally every second day for two weeks with 0.5 mg/kg rGDF15 dissolved in water or water alone. Recombinant proteins were previously tested for TGF-β contamination by ELISA, confirming absence of TGF-β in the preparations. For the diabetes prevention study, we used 20 mice per group, which in previous studies from our group (Cabrera et al., 2013), was shown to provide a 95% power to detect an increase in non-diabetic proportion of 0.66 with a significance level (alpha) of 0.05 (two-tailed). NOD mice were acclimatized for one week and then beginning at 6 weeks of age were injected intraperitoneally (IP) every 2 days for 4 weeks with 0.5 mg/kg rGDF15 dissolved in saline or saline alone. Mice were monitored for 24 weeks, until > 80% of the control group developed diabetes (blood glucose level > 250 mg/mL on two separate occasions. Body weight and blood glucose were monitored as previously described (Maganti et al., 2016). Mice were euthanized and pancreata were harvested at the end of the different experiments.
Immunohistochemistry/Immunofluorescence
Pancreata were fixed with 4% PFA at room temperature for 4 h, paraffin embedded, and immunostaining was performed as previously described (Evans-Molina et al., 2009) using the following antibodies: insulin (Santa Cruz) and counter stained with peroxidase conjugated anti-rabbit IgG (Vector). Insulitis was scored from immunohistochemical staining as described previously (Tersey et al., 2014) using at least 3 pancreas sections 70 μm apart from 5 mice per group and the images were acquired using an EVOIS XL Core microscope (Life Technologies). For studies using immunofluorescence we used the following primary antibodies: insulin (Dako; 1:400), GDF15 (Bioss; 1:200), SPP1 (Thermo Fisher Scientific; 1:200), 4-HNE (Abcam; 1:200), glucagon (Abcam; 1:300) and counter stained with following secondary antibodies: goat anti-guinea pig (Alexa 488; 1:400), donkey anti-rabbit (Alexa-568; 1:250) and donkey anti-mouse (Alexa-647; 1:300). The images were acquired using LSM 800 confocal microscope (Carl Ziess, Germany). Experiments without the primary antibody and with a competition assay by adding recombinant protein were run in parallel to assess the specificity of the staining.
QUANTIFICATION AND STATISTICAL ANALYSIS
Quantitative and Pathway Analysis of TMT-labeled Proteomic Analysis
For quantification, TMT reporter ion intensities of confidently identified peptides were extracted with MASIC (Monroe et al., 2008). Then intensities of reporter ions of peptides with multiple MS/MS spectra were summed together to remove redundancy and increase signal-to-noise ratios. Quality control processing of the proteomics data include sample-level outlier evaluation using a robust Principal Component Analysis (Webb-Robertson et al., 2011) and total sample abundance normalization with median centering (Callister et al., 2006; Webb-Robertson et al., 2011). No sample-level issues were identified. Proteins were quantified with a standard reference-based quantification (Taverner et al., 2012; Wang et al., 2013). The Bioconductor analysis package limma (Ritchie et al., 2015) was used to identify proteins differentially expressed in each of the two TMT sets, using the paired samples setting. Statistical power was calculated based on a two-sided paired t test with a type one error rate, a, of 0.05 using the ‘sampsizepwr’ function in MATLAB R2018a. The standard deviation was computed for each protein from the control group for both set 1 and set 2, 10,621 and 11,404 proteins, respectively. Normality of the proteomics data was evaluated with a Kolmogrov-Smirnov test of normality and in all cases less than 5% failed to meet our assumptions of normality.
The DAVID online resource (http://david.ncifcrf.gov) was then used to obtain functional enrichment of up- and downregulated proteins. Only enriched functions from KEGG database was used for plotting the pathway network with Enrichment Map tool (Merico et al., 2010). Physical/regulatory interactions among differentially abundant apoptotic proteins were mapped with Metacore pathway analysis software (Thomson Reuters) using the gene ontology process “regulation of apoptotic processes.”
Image Processing and Quantification
For quantification of immunofluorescence experiments, human pancreatic sections were examined by acquiring Z stacks images using confocal microscopy (Carl Zeiss Microscopy, Germany). Fluorescence intensity of the images was quantified by using ImageJ (NIH) as described elsewhere (Sun et al., 2016). Briefly, from each pancreatic section, 5–10 islets were randomly selected, and the islet areas (number of pixels) and their integrated densities were then measured. Background fluorescence intensity was measured for each islet and the corrected total islet cell fluorescence was calculated by the following formula: Total Islet Cell Fluorescence (CTCF) = Integrated Density - (Area of selected cell X Mean fluorescence of background). All image analyses were performed in a blinded fashion and independently by two individuals.
Statistical Analysis of Other Experiments
Besides the proteomic analysis, statistical test of all the other experiments were performed with GraphPad Prism (GraphPad Software). For most of the experiments, results were considered significant when p ≤ 0.05 for Student’s t test (two-tailed, unpaired). For the proteomics versus transcriptomics comparison a two-tailed Fisher’s exact was used and considered significant with p ≤ 0.05 cutoff. For the image quantitative analysis, an one-way ANOVA test was used and considered significant with p ≤ 0.05. For NOD mouse diabetes outcome experiments, a log-rank (Mantel-Cox) test was used to determine significance between control- and rhGDF15-treated groups. Normality of data was evaluated with a Kolmogrov-Smirnov test of normality and in all cases less than 5% failed to meet our assumptions of normality.
For all statistical analyses, the parameters can be found in the figures and figure legends, as applicable.
DATA AND CODE AVAILABILITY
The raw LC-MS/MS proteomics data files were deposited in the ProteomeXchange-associated Pride data repository under the accession number PXD009131.
Supplementary Material
KEY RESOURCES TABLE
| REAGENT or RESOURCE | SOURCE | IDENTIFIER |
|---|---|---|
| Antibodies | ||
| Anti-cleaved caspase 3 | Cell Signaling Technology | Cat# 9664; RRID:AB_2070042 |
| Anti-caspase 3 | Cell Signaling Technology | Cat# 9662; RRID:AB_331439 |
| Anti-GDF15 | Bioss | Cat# bs-3818R; RRID:AB_10857699 |
| Anti-SPP1 | Thermo Fisher Scientific | Cat# PA5–34579; RRID:AB_2551931 |
| Anti-Tubulin | Cell Signaling Technology | Cat# 2128; RRID:AB_823664 |
| Anti-rabbit IgG | Li-Cor Biosciences | Cat# 926–68073; RRID:AB_10954442 |
| Anti-mouse IgG | Li-Cor Biosciences | Cat# 926–32212; RRID:AB_621847 |
| Anti-insulin | Santa Cruz Biotechnology | Cat# sc-9168; RRID:AB_2126540 |
| peroxidase conjugated anti-rabbit IgG | Vector Labs | Cat# MP-7401; RRID:AB_2336529 |
| Anti-Glucagon | Abcam | Cat# ab10988; RRID:AB_297642 |
| Anti-insulin | Agilent | Cat# A0564; RRID:AB_10013624 |
| Anti-4-HNE | Abcam | Cat# ab46545; RRID:AB_722490 |
| goat anti-guinea pig (Alexa Fluor-488) | Molecular Probes | Cat# A-11073; RRID:AB_2534117 |
| donkey anti-rabbit (Alexa Fluor-568) | Thermo Fisher Scientific | Cat# A10042; RRID:AB_2534017 |
| donkey anti-mouse(Alexa Fluor-647) | Thermo Fisher Scientific | Cat# A-21240, RRID:AB_2535809 |
| donkey anti-rabbit (IRD®800CW) | LI-COR Biosciences | Cat# 926–32213; RRID:AB_621848 |
| Chemicals, Peptides, and Recombinant Proteins | ||
| Ciprofloxacin | Fisher | MT61277RG |
| Penicillin Streptomycin | Life Technologies Ltd | 15140–122 |
| Standard Islet Medium | Prodo | PIM-S001GMP |
| human AB serum | Prodo | PIM-ABS001GMP |
| Glutamine and Glutathione Supplement | Prodo | PIM-G001GMP |
| Dulbecco’s Modified Eagle Medium | Life Technologies Ltd | 11965–092 |
| Dulbecco’s Modified Eagle Medium | Life Technologies Ltd | 11885–084 |
| ECM | Sigma-Aldrich | E1270 |
| Fibronectin from bovine plasma | Sigma-Aldrich | F1141 |
| Nicotinamide | Sigma-Aldrich | N0636–100G |
| Sodium selenite | Sigma-Aldrich | S8132 |
| Human Transferrin | Sigma-Aldrich | T8158 |
| Fatty Acid Free heat shock BSA powder | Equitech | BAH66 |
| Beta-2-mercaptoethanol | Fisher BioReagents | O3446I-100 |
| Recombinant IL-1β | R and D systems | 201-LB-005 |
| Recombinant IFN-γ | R and D systems | 285-IF-100 |
| Recombinant SPP1 | GenTex | GTX48134-PRO |
| Halt phosphatase inhibitor cocktail | Thermo Fisher Scientific | 78420 |
| Sodium fluoride | Sigma | S7920 |
| Urea | Sigma | U0631 |
| Ammonium Bicarbonate | Sigma | 9830 |
| Calcium chloride | Sigma | C1016 |
| Tandem mass tags - 10plex | Thermo Fisher Scientific | 90110 |
| Dithiothreitol | Thermo Fisher Scientific | 20291 |
| Iodoacetamide | Thermo Fisher Scientific | 90034 |
| Ammonium Formate | Sigma | 9735 |
| Formic acid | Sigma | 33015 |
| C18 SPE cartrigde, Discovery, 50 mg | Supelco | 52601-U |
| D-Sucrose | Fisher Bio Reagent | BP220–212 |
| Cycloheximide solution | Sigma | C4859–1ML |
| Recombinant RNasin® Ribonuclease Inhibitor | Promega | N2515 |
| Benzonase ® Nuclease | Edmillipore | 70746–3 |
| Human GDF15 Protein (His Tag) – Produced in yeast; the absence of TGF-β contamination was confirmed by ELISA (R&D system; Cat#MB100B). | Sino Biologicals | 10936-H07Y |
| Human GDF15 Protein – Produced in E. coli, endotoxin tested: < 1 EU/μg protein by LAL assay; the absence of TGF-β contamination was confirmed by ELISA (R&D system; Cat#MB100B). | ProSpec | cyt-335 |
| Annexin A5 FITC / 7-AAD Kit | Beckman Coulter | IM36154 |
| Mini-PROTEAN TGX Gels | BIO-RAD | 456–1094 |
| 10X- Tris/Glycine/SDS Buffer | BIO-RAD | 161–0772 |
| 10X- Tris/Glycine Buffer | BIO-RAD | 161–0771 |
| Signal Enhancer HIKARI 250 (Solution 1 & Solution 2) | Nacalai U.S.A | NU00102 |
| Critical Commercial Assays | ||
| Caspase-Glo 3/7 assay kit | Promega | G8090 |
| RNeasy plus mini kit | QIAGEN | 74134 |
| M-MLV RT kit | Invitrogen | 28025013 |
| TaqMan Gene Expression Master mix | Applied biosystems | 4369016 |
| Apo-ONE ® Homogeneous Caspase-3/7 Assay | Promega | G7790 |
| Deposited Data | ||
| Proteomics data | Pride repository | PXD009131 |
| Experimental Models: Cell Lines and Tissue | ||
| Human: EndoC-βH1 cells | Dr. R. Scharfman (University of Paris, France) | N/A |
| Mouse: MIN6 | J. Miyazaki (Japan) | N/A |
| Human: pancreatic islets | Integrated Islet Distribution Program (IIDP) | N/A |
| Human: pancreas tissue sections | Network for Pancreatic Organ Donors with Diabetes (nPOD) | N/A |
| Experimental Models: Organisms/Strains | ||
| Mouse: NOD/ShiLTJ (NOD) | Jackson Laboratories | 1976 |
| Oligonucleotides | ||
| GDF15 | TaqMan | Cat# 4448892; ID Hs00171132_m1 |
| SPP1 | TaqMan | Cat# 4331182; Hs00959010_m1 |
| β-actin | TaqMan | Cat# 4333762F; ID Hs01060665_g1 |
| Software and Algorithms | ||
| MSGF+ | Pevzner Lab, University of California - San Diego | https://doi.org/10.1038/ncomms6277 |
| MASIC | Omics Group, Pacific Northwest National Laboratory | https://doi.org/10.1016/j.compbiolchem.2008.02.006 |
| Decon2LS_V2 | Omics Group, Pacific Northwest National Laboratory | https://doi.org/10.1186/1471-2105-10-87 |
| DTARefinery | Omics Group, Pacific Northwest National Laboratory | https://doi.org/10.1074/mcp.M900217-MCP200 |
| MaxQuant v.1.5.3.28 | Cox Lab, Max-Planck Institute for Biochemistry | https://doi.org/10.1038/nprot.2016.136 |
| Enrichment Map | Bader Lab, University of Toronto | https://doi.org/10.1371/journal.pone.0013984 |
| Metacore | THOMSON REUTERS | N/A |
| GraphPad Prism v7 | GraphPad Software | N/A |
| ImageJ software | http://imagej.net/Contributors | N/A |
| FCS Express v6 | De Novo Software | N/A |
Context and Significance.
Type 1 diabetes results from the apoptotic destruction of the insulin-producing pancreatic β cells by an autoimmune response. Here, researchers at Pacific Northwest National Laboratory and their collaborators identified a protein, growth/differentiation factor 15 (GDF15), as a β-cell protective factor. GDF15 blocked pro-inflammatory cytokine-mediated cell death of human islets and a β-cell line. GDF15 also reduced the autoimmune response and diminished the onset of diabetes in mice. Therefore, GDF15 is a potential target for developing a therapy for type 1 diabetes.
Highlights.
Proteomics of cytokine-treated human islets identified GDF15 as a protective factor
GDF15 levels were reduced in cytokine-treated islets by translational blockade
GDF15 inhibited IL-1β +INF-γ-induced apoptosis of human islets and a β-cell line
Administration of GDF15 prevented diabetes in non-obese diabetic mice
ACKNOWLEDGMENTS
The authors thank Nathan Johnson and Rose Perry for their help with the illustrations. The authors thank the NIDDK-supported Integrated Islet Distribution Program (IIDP) and Network for Pancreatic Organ Donors with Diabetes (nPOD) for providing the human islets and pancreas tissue sections, respectively, used in the study. This work was supported by National Institutes of Health (NIH), United States, National Institute of Diabetes and Digestive and Kidney Diseases grants UC4 DK104166 (to R.G.M, C.E.M., D.L.E., and T.O.M.), UC4 DK104167 (W.J.Q. and R.N.K.), UC4 DK108101, R01 DK60581 (to R.G.M.), and R01 DK093954 (to C.E.M); United States Department of Veterans Affairs, VA Merit Award I01BX001733 (to C.E.M.); Fonds National de la Recherche Scientifique (FNRS), Welbio CR-2015A-06, Belgium (to D.L.E.); a JDRF (United States) Strategic Research Agreement (to C.E.M and R.G.M.); and gifts from the Sigma Beta Sorority (United States), the Ball Brothers Foundation (United States), the George and Frances Ball Foundation (United States), and the Holiday Management Foundation (United States) (to C.E.M and R.G.M.). F.S. was supported by JDRF postdoctoral fellowship (3-PDF-2016-199-A-N). D.L.E. also received funds from Innovative Medicines Initiative 2 Joint Undertaking under grant agreement no. 115797 (INNODIA), which is supported by the Union’s Horizon 2020 research and innovation program and EFPIA (Belgium), JDRF and The Leona M. and Harry B. Helmsley Charitable Trust (United States). This work used core services supported by NIH grant P30 DK097512 (to Indiana University) and by NIH grant P30 DK020595 (to University of Chicago). Work was performed in the Environmental Molecular Sciences Laboratory, a U.S. Department of Energy (DOE) national scientific user facility at Pacific Northwest National Laboratory (PNNL) in Richland, WA. Battelle operates PNNL for the DOE under contract DE-AC05-76RLO01830.
Footnotes
SUPPLEMENTAL INFORMATION
Supplemental Information can be found online at https://doi.org/10.1016/j.cmet.2019.12.005.
DECLARATION OF INTERESTS
The authors declare no competing financial interests.
REFERENCES
- Anderson MS, and Bluestone JA (2005). The NOD mouse: a model of immune dysregulation. Annu. Rev. Immunol 23, 447–485. [DOI] [PubMed] [Google Scholar]
- Artz A, Butz S, and Vestweber D (2016). GDF-15 inhibits integrin activation and mouse neutrophil recruitment through the ALK-5/TGF-βRII heterodimer. Blood 128, 529–541. [DOI] [PubMed] [Google Scholar]
- Atkinson MA, Eisenbarth GS, and Michels AW (2014). Type 1 diabetes. Lancet 383, 69–82. [DOI] [PMC free article] [PubMed] [Google Scholar]
- Bi X, Li F, Liu S, Jin Y, Zhang X, Yang T, Dai Y, Li X, and Zhao AZ (2017). ω−3 polyunsaturated fatty acids ameliorate type 1 diabetes and autoimmunity. J. Clin. Invest 127, 1757–1771. [DOI] [PMC free article] [PubMed] [Google Scholar]
- Bootcov MR, Bauskin AR, Valenzuela SM, Moore AG, Bansal M, He XY, Zhang HP, Donnellan M, Mahler S, Pryor K, et al. (1997). MIC-1, a novel macrophage inhibitory cytokine, is a divergent member of the TGF-beta superfamily. Proc. Natl. Acad. Sci. USA 94, 11514–11519. [DOI] [PMC free article] [PubMed] [Google Scholar]
- Bresson D, Togher L, Rodrigo E, Chen Y, Bluestone JA, Herold KC, and von Herrath M (2006). Anti-CD3 and nasal proinsulin combination therapy enhances remission from recent-onset autoimmune diabetes by inducing Tregs. J. Clin. Invest 116, 1371–1381. [DOI] [PMC free article] [PubMed] [Google Scholar]
- Brissova M, Niland JC, Cravens J, Olack B, Sowinski J, and Evans-Molina C (2019). The integrated islet distribution program answers the call for improved human islet phenotyping and reporting of human islet characteristics in research articles. Diabetes 68, 1363–1365. [DOI] [PMC free article] [PubMed] [Google Scholar]
- Brooks SA, and Blackshear PJ (2013). Tristetraprolin (TTP): interactions with mRNA and proteins, and current thoughts on mechanisms of action. Biochim. Biophys. Acta 1829, 666–679. [DOI] [PMC free article] [PubMed] [Google Scholar]
- Cabrera SM, Colvin SC, Tersey SA, Maier B, Nadler JL, and Mirmira RG (2013). Effects of combination therapy with dipeptidyl peptidase-IV and histone deacetylase inhibitors in the non-obese diabetic mouse model of type 1 diabetes. Clin. Exp. Immunol 172, 375–382. [DOI] [PMC free article] [PubMed] [Google Scholar]
- Cai M, Bompada P, Salehi A, Acosta JR, Prasad RB, Atac D, Laakso M, Groop L, and De Marinis Y (2018). Role of osteopontin and its regulation in pancreatic islet. Biochem. Biophys. Res. Commun 495, 1426–1431. [DOI] [PubMed] [Google Scholar]
- Callister SJ, Barry RC, Adkins JN, Johnson ET, Qian WJ, Webb-Robertson BJ, Smith RD, and Lipton MS (2006). Normalization approaches for removing systematic biases associated with mass spectrometry and label-free proteomics. J. Proteome Res 5, 277–286. [DOI] [PMC free article] [PubMed] [Google Scholar]
- Campbell-Thompson M, Fu A, Kaddis JS, Wasserfall C, Schatz DA, Pugliese A, and Atkinson MA (2016). Insulitis and β-cell mass in the natural history of type 1 diabetes. Diabetes 65, 719–731. [DOI] [PMC free article] [PubMed] [Google Scholar]
- Carpenter S, Ricci EP, Mercier BC, Moore MJ, and Fitzgerald KA (2014). Post-transcriptional regulation of gene expression in innate immunity. Nat. Rev. Immunol 14, 361–376. [DOI] [PubMed] [Google Scholar]
- Carstensen M, Herder C, Brunner EJ, Strassburger K, Tabak AG, Roden M, and Witte DR (2010). Macrophage inhibitory cytokine-1 is increased in individuals before type 2 diabetes diagnosis but is not an independent predictor of type 2 diabetes: the Whitehall II study. Eur. J. Endocrinol 162, 913–917. [DOI] [PubMed] [Google Scholar]
- Chung HK, Ryu D, Kim KS, Chang JY, Kim YK, Yi HS, Kang SG, Choi MJ, Lee SE, Jung SB, et al. (2017). Growth differentiation factor 15 is a myomitokine governing systemic energy homeostasis. J. Cell Biol 216, 149–165. [DOI] [PMC free article] [PubMed] [Google Scholar]
- Clemente N, Raineri D, Cappellano G, Boggio E, Favero F, Soluri MF, Dianzani C, Comi C, Dianzani U, and Chiocchetti A (2016). Osteopontin bridging innate and adaptive immunity in autoimmune diseases. J. Immunol. Res 2016, 7675437. [DOI] [PMC free article] [PubMed] [Google Scholar]
- Cunha DA, Cito M, Grieco FA, Cosentino C, Danilova T, Ladrière L, Lindahl M, Domanskyi A, Bugliani M, Marchetti P, et al. (2017). Pancreatic β-cell protection from inflammatory stress by the endoplasmic reticulum proteins thrombospondin 1 and mesencephalic astrocyte-derived neutrotrophic factor (MANF). J. Biol. Chem 292, 14977–14988. [DOI] [PMC free article] [PubMed] [Google Scholar]
- DiMeglio LA, Evans-Molina C, and Oram RA (2018). Type 1 diabetes. Lancet 391, 2449–2462. [DOI] [PMC free article] [PubMed] [Google Scholar]
- Ehlers MR (2016). Immune interventions to preserve β cell function in type 1 diabetes. J. Investig. Med 64, 7–13. [DOI] [PMC free article] [PubMed] [Google Scholar]
- Eizirik DL, Colli ML, and Ortis F (2009). The role of inflammation in insulitis and beta-cell loss in type 1 diabetes. Nat. Rev. Endocrinol 5, 219–226. [DOI] [PubMed] [Google Scholar]
- Eizirik DL, Sammeth M, Bouckenooghe T, Bottu G, Sisino G, Igoillo-Esteve M, Ortis F, Santin I, Colli ML, Barthson J, et al. (2012). The human pancreatic islet transcriptome: expression of candidate genes for type 1 diabetes and the impact of pro-inflammatory cytokines. PLoS Genet. 8, e1002552. [DOI] [PMC free article] [PubMed] [Google Scholar]
- Eizirik DL, Miani M, and Cardozo AK (2013). Signalling danger: endoplasmic reticulum stress and the unfolded protein response in pancreatic islet inflammation. Diabetologia 56, 234–241. [DOI] [PubMed] [Google Scholar]
- Elenkov IJ, and Chrousos GP (2002). Stress hormones, proinflammatory and antiinflammatory cytokines, and autoimmunity. Ann. N Y Acad. Sci 966, 290–303. [DOI] [PubMed] [Google Scholar]
- Emmerson PJ, Wang F, Du Y, Liu Q, Pickard RT, Gonciarz MD, Coskun T, Hamang MJ, Sindelar DK, Ballman KK, et al. (2017). The metabolic effects of GDF15 are mediated by the orphan receptor GFRAL. Nat. Med 23, 1215–1219. [DOI] [PubMed] [Google Scholar]
- Evans-Molina C, Robbins RD, Kono T, Tersey SA, Vestermark GL, Nunemaker CS, Garmey JC, Deering TG, Keller SR, Maier B, and Mirmira RG (2009). Peroxisome proliferator-activated receptor gamma activation restores islet function in diabetic mice through reduction of endoplasmic reticulum stress and maintenance of euchromatin structure. Mol. Cell. Biol 29, 2053–2067. [DOI] [PMC free article] [PubMed] [Google Scholar]
- Gonzalez-Duque S, Azoury ME, Colli ML, Afonso G, Turatsinze JV, Nigi L, Lalanne AI, Sebastiani G, Carre A, Pinto S, et al. (2018). Cell Metab. 28, 946–960.e6. [DOI] [PubMed] [Google Scholar]
- Guney MA, Petersen CP, Boustani A, Duncan MR, Gunasekaran U, Menon R, Warfield C, Grotendorst GR, Means AL, Economides AN, and Gannon M (2011). Connective tissue growth factor acts within both endothelial cells and beta cells to promote proliferation of developing beta cells. Proc. Natl. Acad. Sci. USA 108, 15242–15247. [DOI] [PMC free article] [PubMed] [Google Scholar]
- Gupta S, Cerosaletti K, and Long SA (2014). Renegade homeostatic cytokine responses in T1D: drivers of regulatory/effector T cell imbalance. Clin. Immunol 151, 146–154. [DOI] [PubMed] [Google Scholar]
- Gurgul-Convey E, Kaminski MT, and Lenzen S (2015). Physiological characterization of the human EndoC-βH1 β-cell line. Biochem. Biophys. Res. Commun 464, 13–19. [DOI] [PubMed] [Google Scholar]
- Gurgul-Convey E, Mehmeti I, Plötz T, Jörns A, and Lenzen S (2016). Sensitivity profile of the human EndoC-βH1 beta cell line to proinflammatory cytokines. Diabetologia 59, 2125–2133. [DOI] [PubMed] [Google Scholar]
- Gurzov EN, and Eizirik DL (2011). Bcl-2 proteins in diabetes: mitochondrial pathways of β-cell death and dysfunction. Trends Cell Biol. 21, 424–431. [DOI] [PubMed] [Google Scholar]
- Heger J, Schiegnitz E, von Waldthausen D, Anwar MM, Piper HM, and Euler G (2010). Growth differentiation factor 15 acts anti-apoptotic and pro-hypertrophic in adult cardiomyocytes. J. Cell. Physiol 224, 120–126. [DOI] [PubMed] [Google Scholar]
- Herold KC, Bundy BN, Long SA, Bluestone JA, DiMeglio LA, Dufort MJ, Gitelman SE, Gottlieb PA, Krischer JP, Linsley PS, et al. ; Type 1 Diabetes TrialNet Study Group (2019). An anti-CD3 antibody, teplizumab, in relatives at risk for type 1 diabetes. N. Engl. J. Med 381, 603–613. [DOI] [PMC free article] [PubMed] [Google Scholar]
- Hsu JY, Crawley S, Chen M, Ayupova DA, Lindhout DA, Higbee J, Kutach A, Joo W, Gao Z, Fu D, et al. (2017). Non-homeostatic body weight regulation through a brainstem-restricted receptor for GDF15. Nature 550, 255–259. [DOI] [PubMed] [Google Scholar]
- Ishihara H, Asano T, Tsukuda K, Katagiri H, Inukai K, Anai M, Kikuchi M, Yazaki Y, Miyazaki JI, and Oka Y (1993). Pancreatic beta cell line MIN6 exhibits characteristics of glucose metabolism and glucose-stimulated insulin secretion similar to those of normal islets. Diabetologia 36, 1139–1145. [DOI] [PubMed] [Google Scholar]
- Jung SB, Choi MJ, Ryu D, Yi HS, Lee SE, Chang JY, Chung HK, Kim YK, Kang SG, Lee JH, et al. (2018). Reduced oxidative capacity in macrophages results in systemic insulin resistance. Nat. Commun 9, 1551. [DOI] [PMC free article] [PubMed] [Google Scholar]
- Kahles F, Findeisen HM, and Bruemmer D (2014). Osteopontin: A novel regulator at the cross roads of inflammation, obesity and diabetes. Mol. Metab 3, 384–393. [DOI] [PMC free article] [PubMed] [Google Scholar]
- Kempf T, Zarbock A, Widera C, Butz S, Stadtmann A, Rossaint J, Bolomini-Vittori M, Korf-Klingebiel M, Napp LC, Hansen B, et al. (2011). GDF-15 is an inhibitor of leukocyte integrin activation required for survival after myocardial infarction in mice. Nat. Med 17, 581–588. [DOI] [PubMed] [Google Scholar]
- Khan SQ, Ng K, Dhillon O, Kelly D, Quinn P, Squire IB, Davies JE, and Ng LL (2009). Growth differentiation factor-15 as a prognostic marker in patients with acute myocardial infarction. Eur. Heart J 30, 1057–1065. [DOI] [PubMed] [Google Scholar]
- Kim S, and Pevzner PA (2014). MS-GF+ makes progress towards a universal database search tool for proteomics. Nat. Commun 5, 5277. [DOI] [PMC free article] [PubMed] [Google Scholar]
- Krusche CA, Holthöfer B, Hofe V, van de Sandt AM, Eshkind L, Bockamp E, Merx MW, Kant S, Windoffer R, and Leube RE (2011). Desmoglein 2 mutant mice develop cardiac fibrosis and dilation. Basic Res. Cardiol 106, 617–633. [DOI] [PMC free article] [PubMed] [Google Scholar]
- Lee SE, Kang SG, Choi MJ, Jung SB, Ryu MJ, Chung HK, Chang JY, Kim YK, Lee JH, Kim KS, et al. (2017). Growth differentiation factor 15 mediates systemic glucose regulatory action of T-helper type 2 cytokines. Diabetes 66, 2774–2788. [DOI] [PubMed] [Google Scholar]
- Li J, Yang L, Qin W, Zhang G, Yuan J, and Wang F (2013). Adaptive induction of growth differentiation factor 15 attenuates endothelial cell apoptosis in response to high glucose stimulus. PLoS One 8, e65549. [DOI] [PMC free article] [PubMed] [Google Scholar]
- Livingstone SJ, Levin D, Looker HC, Lindsay RS, Wild SH, Joss N, Leese G, Leslie P, McCrimmon RJ, Metcalfe W, et al. ; Scottish Diabetes Research Network epidemiology group; Scottish Renal Registry (2015). Estimated life expectancy in a Scottish cohort with type 1 diabetes, 2008–2010. JAMA 313, 37–44. [DOI] [PMC free article] [PubMed] [Google Scholar]
- Luan HH, Wang A, Hilliard BK, Carvalho F, Rosen CE, Ahasic AM, Herzog EL, Kang I, Pisani MA, Yu S, et al. (2019). GDF15 is an inflammation-induced central mediator of tissue tolerance. Cell 178, 1231–1244.e11. [DOI] [PMC free article] [PubMed] [Google Scholar]
- Lyssenko V, Eliasson L, Kotova O, Pilgaard K, Wierup N, Salehi A, Wendt A, Jonsson A, De Marinis YZ, Berglund LM, et al. (2011). Pleiotropic effects of GIP on islet function involve osteopontin. Diabetes 60, 2424–2433. [DOI] [PMC free article] [PubMed] [Google Scholar]
- Maganti AV, Tersey SA, Syed F, Nelson JB, Colvin SC, Maier B, and Mirmira RG (2016). Peroxisome proliferator-activated receptor-g activation augments the β-cell unfolded protein response and rescues early glycemic deterioration and β cell death in non-obese diabetic mice. J. Biol. Chem 291, 22524–22533. [DOI] [PMC free article] [PubMed] [Google Scholar]
- Makino S, Kunimoto K, Muraoka Y, Mizushima Y, Katagiri K, and Tochino Y (1980). Breeding of a non-obese, diabetic strain of mice. Jikken Dobutsu 29, 1–13. [DOI] [PubMed] [Google Scholar]
- Mayampurath AM, Jaitly N, Purvine SO, Monroe ME, Auberry KJ, Adkins JN, and Smith RD (2008). DeconMSn: a software tool for accurate parent ion monoisotopic mass determination for tandem mass spectra. Bioinformatics 24, 1021–1023. [DOI] [PMC free article] [PubMed] [Google Scholar]
- Merico D, Isserlin R, Stueker O, Emili A, and Bader GD (2010). Enrichment map: a network-based method for gene-set enrichment visualization and interpretation. PLoS One 5, e13984. [DOI] [PMC free article] [PubMed] [Google Scholar]
- Miyazaki J, Araki K, Yamato E, Ikegami H, Asano T, Shibasaki Y, Oka Y, and Yamamura K (1990). Establishment of a pancreatic beta cell line that retains glucose-inducible insulin secretion: special reference to expression of glucose transporter isoforms. Endocrinology 127, 126–132. [DOI] [PubMed] [Google Scholar]
- Monroe ME, Shaw JL, Daly DS, Adkins JN, and Smith RD (2008). MASIC: a software program for fast quantitation and flexible visualization of chromatographic profiles from detected LC-MS(/MS) features. Comput. Biol. Chem 32, 215–217. [DOI] [PMC free article] [PubMed] [Google Scholar]
- Mullican SE, Lin-Schmidt X, Chin CN, Chavez JA, Furman JL, Armstrong AA, Beck SC, South VJ, Dinh TQ, Cash-Mason TD, et al. (2017). GFRAL is the receptor for GDF15 and the ligand promotes weight loss in mice and nonhuman primates. Nat. Med 23, 1150–1157. [DOI] [PubMed] [Google Scholar]
- Nakayasu ES, Nicora CD, Sims AC, Burnum-Johnson KE, Kim YM, Kyle JE, Matzke MM, Shukla AK, Chu RK, Schepmoes AA, et al. (2016). MPLEx: a robust and universal protocol for single-sample integrative proteomic, metabolomic, and lipidomic analyses. mSystems 1, e00043–16. [DOI] [PMC free article] [PubMed] [Google Scholar]
- Ow SY, Salim M, Noirel J, Evans C, Rehman I, and Wright PC (2009). iTRAQ underestimation in simple and complex mixtures: “the good, the bad and the ugly”. J. Proteome Res 8, 5347–5355. [DOI] [PubMed] [Google Scholar]
- Patel S, Alvarez-Guaita A, Melvin A, Rimmington D, Dattilo A, Miedzybrodzka EL, Cimino I, Maurin AC, Roberts GP, Meek CL, et al. (2019). GDF15 provides an endocrine signal of nutritional stress in mice and humans. Cell Metab. 29, 707–718.e8. [DOI] [PMC free article] [PubMed] [Google Scholar]
- Petyuk VA, Mayampurath AM, Monroe ME, Polpitiya AD, Purvine SO, Anderson GA, Camp DG 2nd, and Smith RD (2010). DtaRefinery, a software tool for elimination of systematic errors from parent ion mass measurements in tandem mass spectra data sets. Mol. Cell. Proteomics 9, 486–496. [DOI] [PMC free article] [PubMed] [Google Scholar]
- Pugliese A, Yang M, Kusmarteva I, Heiple T, Vendrame F, Wasserfall C, Rowe P, Moraski JM, Ball S, Jebson L, et al. (2014). The juvenile diabetes research foundation network for pancreatic organ donors with diabetes (nPOD) program: goals, operational model and emerging findings. Pediatr. Diabetes 15, 1–9. [DOI] [PMC free article] [PubMed] [Google Scholar]
- Ramos-Rodríguez M, Raurell-Vila H, Colli ML, Alvelos MI, Subirana-Granés M, Juan-Mateu J, Norris R, Turatsinze JV, Nakayasu ES, Webb-Robertson BM, et al. (2019). The impact of proinflammatory cytokines on the β-cell regulatory landscape provides insights into the genetics of type 1 diabetes. Nat. Genet 51, 1588–1595. [DOI] [PMC free article] [PubMed] [Google Scholar]
- Ravassard P, Hazhouz Y, Pechberty S, Bricout-Neveu E, Armanet M, Czernichow P, and Scharfmann R (2011). A genetically engineered human pancreatic β cell line exhibiting glucose-inducible insulin secretion. J. Clin. Invest 121, 3589–3597. [DOI] [PMC free article] [PubMed] [Google Scholar]
- Ritchie ME, Phipson B, Wu D, Hu Y, Law CW, Shi W, and Smyth GK (2015). limma powers differential expression analyses for RNA-sequencing and microarray studies. Nucleic Acids Res. 43, e47. [DOI] [PMC free article] [PubMed] [Google Scholar]
- Santin I, Moore F, Colli ML, Gurzov EN, Marselli L, Marchetti P, and Eizirik DL (2011). PTPN2, a candidate gene for type 1 diabetes, modulates pancreatic β-cell apoptosis via regulation of the BH3-only protein Bim. Diabetes 60, 3279–3288. [DOI] [PMC free article] [PubMed] [Google Scholar]
- Scharfmann R, Pechberty S, Hazhouz Y, von Bülow M, Bricout-Neveu E, Grenier-Godard M, Guez F, Rachdi L, Lohmann M, Czernichow P, and Ravassard P (2014). Development of a conditionally immortalized human pancreatic β cell line. J. Clin. Invest 124, 2087–2098. [DOI] [PMC free article] [PubMed] [Google Scholar]
- Schiegnitz E, Kämmerer PW, Koch FP, Krüger M, Berres M, and Al-Nawas B (2012). GDF 15 as an anti-apoptotic, diagnostic and prognostic marker in oral squamous cell carcinoma. Oral Oncol. 48, 608–614. [DOI] [PubMed] [Google Scholar]
- Sedlyarov V, Fallmann J, Ebner F, Huemer J, Sneezum L, Ivin M, Kreiner K, Tanzer A, Vogl C, Hofacker I, and Kovarik P (2016). Tristetraprolin binding site atlas in the macrophage transcriptome reveals a switch for inflammation resolution. Mol. Syst. Biol 12, 868. [DOI] [PMC free article] [PubMed] [Google Scholar]
- Suk K, Kim S, Kim YH, Kim KA, Chang I, Yagita H, Shong M, and Lee MS (2001). IFN-gamma/TNF-alpha synergism as the final effector in autoimmune diabetes: a key role for STAT1/IFN regulatory factor-1 pathway in pancreatic beta cell death. J. Immunol 166, 4481–4489. [DOI] [PubMed] [Google Scholar]
- Sun Y, Ikrar T, Davis MF, Gong N, Zheng X, Luo ZD, Lai C, Mei L, Holmes TC, Gandhi SP, and Xu X (2016). Neuregulin-1/ErbB4 signaling regulates visual cortical p/lasticity. Neuron 92, 160–173. [DOI] [PMC free article] [PubMed] [Google Scholar]
- Syed I, Rubin de Celis MF, Mohan JF, Moraes-Vieira PM, Vijayakumar A, Nelson AT, Siegel D, Saghatelian A, Mathis D, and Kahn BB (2019). PAHSAs attenuate immune responses and promote β cell survival in autoimmune diabetic mice. J. Clin. Invest 129, 3717–3731. [DOI] [PMC free article] [PubMed] [Google Scholar]
- Taverner T, Karpievitch YV, Polpitiya AD, Brown JN, Dabney AR, Anderson GA, and Smith RD (2012). DanteR: an extensible R-based tool for quantitative analysis of -omics data. Bioinformatics 28, 2404–2406. [DOI] [PMC free article] [PubMed] [Google Scholar]
- Templin AT, Maier B, Tersey SA, Hatanaka M, and Mirmira RG (2014). Maintenance of Pdx1 mRNA translation in islet b-cells during the unfolded protein response. Mol. Endocrinol 28, 1820–1830. [DOI] [PMC free article] [PubMed] [Google Scholar]
- Tersey SA, Colvin SC, Maier B, and Mirmira RG (2014). Protective effects of polyamine depletion in mouse models of type 1 diabetes: implications for therapy. Amino Acids 46, 633–642. [DOI] [PMC free article] [PubMed] [Google Scholar]
- Tiedje C, Diaz-Muñoz MD, Trulley P, Ahlfors H, Laaß K, Blackshear PJ, Turner M, and Gaestel M (2016). The RNA-binding protein TTP is a global post-transcriptional regulator of feedback control in inflammation. Nucleic Acids Res. 44, 7418–7440. [DOI] [PMC free article] [PubMed] [Google Scholar]
- Tsai VW, Lin S, Brown DA, Salis A, and Breit SN (2016). Anorexia-cachexia and obesity treatment may be two sides of the same coin: role of the TGF-β superfamily cytokine MIC-1/GDF15. Int. J. Obes 40, 193–197. [DOI] [PubMed] [Google Scholar]
- Tyanova S, Temu T, and Cox J (2016). The MaxQuant computational platform for mass spectrometry-based shotgun proteomics. Nat. Protoc 11, 2301–2319. [DOI] [PubMed] [Google Scholar]
- Unsicker K, Spittau B, and Krieglstein K (2013). The multiple facets of the TGF-β family cytokine growth/differentiation factor-15/macrophage inhibitory cytokine-1. Cytokine Growth Factor Rev. 24, 373–384. [DOI] [PubMed] [Google Scholar]
- Wang H, Qian WJ, Mottaz HM, Clauss TR, Anderson DJ, Moore RJ, Camp DG 2nd, Khan AH, Sforza DM, Pallavicini M, et al. (2005). Development and evaluation of a micro- and nanoscale proteomic sample preparation method. J. Proteome Res 4, 2397–2403. [DOI] [PMC free article] [PubMed] [Google Scholar]
- Wang Y, Yang F, Gritsenko MA, Wang Y, Clauss T, Liu T, Shen Y, Monroe ME, Lopez-Ferrer D, Reno T, et al. (2011). Reversed-phase chromatography with multiple fraction concatenation strategy for proteome profiling of human MCF10A cells. Proteomics 11, 2019–2026. [DOI] [PMC free article] [PubMed] [Google Scholar]
- Wang J, Webb-Robertson BJ, Matzke MM, Varnum SM, Brown JN, Riensche RM, Adkins JN, Jacobs JM, Hoidal JR, Scholand MB, et al. (2013). A semiautomated framework for integrating expert knowledge into disease marker identification. Dis. Markers 35, 513–523. [DOI] [PMC free article] [PubMed] [Google Scholar]
- Webb-Robertson BJ, Matzke MM, Jacobs JM, Pounds JG, and Waters KM (2011). A statistical selection strategy for normalization procedures in LC-MS proteomics experiments through dataset-dependent ranking of normalization scaling factors. Proteomics 11, 4736–4741. [DOI] [PMC free article] [PubMed] [Google Scholar]
- Whitson RJ, Lucia MS, and Lambert JR (2013). Growth differentiation factor-15 (GDF-15) suppresses in vitro angiogenesis through a novel interaction with connective tissue growth factor (CCN2). J. Cell. Biochem 114, 1424–1433. [DOI] [PubMed] [Google Scholar]
- Yang L, Chang CC, Sun Z, Madsen D, Zhu H, Padkjær SB, Wu X, Huang T, Hultman K, Paulsen SJ, et al. (2017). GFRAL is the receptor for GDF15 and is required for the anti-obesity effects of the ligand. Nat. Med 23, 1158–1166. [DOI] [PubMed] [Google Scholar]
- Yu J, Yin P, Yin J, Liu F, Zhu X, Cheng G, Guo K, Yin Y, and Xu J (2010). Involvement of ERK1/2 signalling and growth-related molecules’ expression in response to heat stress-induced damage in rat jejunum and IEC-6 cells. Int. J. Hyperthermia 26, 538–555. [DOI] [PubMed] [Google Scholar]
Associated Data
This section collects any data citations, data availability statements, or supplementary materials included in this article.
Supplementary Materials
Data Availability Statement
The raw LC-MS/MS proteomics data files were deposited in the ProteomeXchange-associated Pride data repository under the accession number PXD009131.