


Abstract
Biological processes (like microbial growth & physiological response) are usually dynamic and require the monitoring of metabolic variation at different time-points. Moreover, there is clear shift from case-control (N=2) study to multi-class (N>2) problem in current metabolomics, which is crucial for revealing the mechanisms underlying certain physiological process, disease metastasis, etc. These time-course and multi-class metabolomics have attracted great attention, and data normalization is essential for removing unwanted biological/experimental variations in these studies. However, no tool (including NOREVA 1.0 focusing only on case-control studies) is available for effectively assessing the performance of normalization method on time-course/multi-class metabolomic data. Thus, NOREVA was updated to version 2.0 by (i) realizing normalization and evaluation of both time-course and multi-class metabolomic data, (ii) integrating 144 normalization methods of a recently proposed combination strategy and (iii) identifying the well-performing methods by comprehensively assessing the largest set of normalizations (168 in total, significantly larger than those 24 in NOREVA 1.0). The significance of this update was extensively validated by case studies on benchmark datasets. All in all, NOREVA 2.0 is distinguished for its capability in identifying well-performing normalization method(s) for time-course and multi-class metabolomics, which makes it an indispensable complement to other available tools. NOREVA can be accessed at https://idrblab.org/noreva/.
INTRODUCTION
Unwanted experimental or biological variation is inevitable in metabolomics-based case-control studies, and adversely affects the validity of metabolic profiling (1–4). A variety of normalization methods have been developed to address this critical problem (5–7), but their performances differ greatly (7,8) and depend heavily on the nature of the analyzed data (9). NOREVA 1.0 (10) was, therefore, designed to (a) enable the identification of well-performing methods by collectively considering multiple criteria, (b) achieve the removal of overall unwanted variations using internal standards (ISs) and quality control metabolites (QCMs) and (c) allow signal drift correction based on quality control samples (QCSs), which is followed by data normalization (10). Due to these unique functions, NOREVA has become an indispensable complement to available tools (11–20) that are popular in metabolomics-based case-control studies.
However, there is a clear shift in current metabolomics from case-control (N=2) studies to multi-class (N>2) problems (21–24), which has revealed the relative abundance of bile acids in multiple cancerous sites (21), differentiated the presence of succinate among diverse adipose tissues (22), and discovered the variation in amino acids across different cell lines (24). Moreover, biological processes (such as physiological response and microbial growth) are usually dynamic and require the monitoring of metabolic variation at different time-points to uncover the time dependency of metabolic network (25), measure the accumulation of sterilization effects in microorganisms (26), and depict the dynamics of soil metabolite (27). Compared with case-control studies, multi-class and time-course studies are much more complicated in terms of their unwanted variations, which therefore requires a marked improvement in the performance of data normalization (28–31).
To date, ∼20 normalization methods (6,32) have been developed and considered an integral part of metabolomics data processing (Supplementary Table S1), which include 12 sample-, 6 metabolite-, 1 sample & metabolite- and 4 internal standard-based methods (2,32,33). It remains elusive whether these methods are effective enough to remove unwanted variations from the data of time-course and multi-class metabolomics (6). When it comes to the further consideration of multiple criteria in performance evaluation (10), the successful identification of effective method would be even harder. Thus, it is essential to first improve the quantity and quality of the methods available to choose, and then identify the well-performing method by strict assessment (8,10). A recent work discovered that a combination of sample- and metabolite-based methods may greatly enhance normalization performance, which led to 144 additional methods (6). As a result of the significant increase in the number of methods, it is now possible (and of great interest) to have a tool that can discover well-performing method(s) by comprehensive evaluation (8,10).
Several valuable online tools have been constructed as metabolomic pipelines, and normalization methods are provided as a step in the analysis chain. These tools include XCMS (11), MetaboAnalyst (12), NormalyzerDE (14), Metabolomics workbench (15), Workflow4metabolomics (34), MetaboGroup S (35), pseudoQC (36), metaX (37), MetaDB (38), Metandem (39), Metflow (40) and WebSpecmine (41). Most tools focus on normalizing raw metabolomic dataset, but offer no performance evaluation. NormalyzerDE (14), MetaboGroup S (35), pseudoQC (36) and metaX (37) can evaluate normalization outcomes, but none of them has employed multiple criteria (10) to assess normalization performances for time-course/multi-class metabolomics. Moreover, these web servers all utilize fewer than 15 methods for data normalization, which seriously limits the ability of identifying a well-performing method. Therefore, it is essential to have an online tool that not only gives a large number of normalization methods for the time-course and multi-class metabolomics but can also discover well-performing method(s) through comprehensive assessment. However, no such tool is yet available.
Here, NOREVA 2.0 was thus constructed (Figure 1 and Table 1) by (i) realizing normalization & evaluation of the time-course and multi-class metabolomics, (ii) integrating 144 normalization methods of a recently reported combination strategy (6) and (iii) identifying the well-performing methods by comprehensively assessing the largest set of normalizations to date (168 methods in total, significantly larger than the 24 in NOREVA 1.0 (10)). Because of the rapidly accumulating research interest in time-course and multi-class metabolomics, this study would make NOREVA unique in assessing normalization for this emerging field and could further enhance its popularity in metabolomics. NOREVA is freely accessible at https://idrblab.org/noreva/.
Figure 1.

Key features added to NOREVA 2.0 which realize the normalization and evaluation of both time-course and multi-class metabolomic data (left panel), integrate the normalization methods of combination strategy proposed by recent publication (6) (right panel), and identifying the well-performing methods by assessing the largest set of normalizations to date (168 in total, significantly larger than the 24 methods in NOREVA 1.0, middle panel).
Table 1.
Summarization of and comparison between the functions provided in NOREVA 2.0 and 1.0. The check mark (√) indicated that the corresponding function(s) had been available for using, while the cross (×) denoted the non-existence of such function
| No. | The unique functions provided | NOREVA 2.0 | NOREVA 1.0 |
|---|---|---|---|
| 1 | Identifying the well-performing normalizations using multiple criteria | √ | √ |
| 2 | Removing the overall unwanted variations using ISs/QCMs | √ | √ |
| 3 | Correcting the signal drifts based on QCSs and subsequent data normalization | √ | √ |
| 4 | Realizing the normalization and performance evaluation for time-course metabolomics | √ | × |
| 5 | Enabling the normalization and performance evaluation for multi-class metabolomics | √ | × |
| 6 | Integrating over one hundred novel normalization methods of the combination strategy | √ | × |
| 7 | Discovering the best ones by comprehensively assessing the largest set of methods | √ | × |
MATERIALS AND METHODS
Comprehensive Collection of Normalization Methods
Over 20 normalization methods frequently used in current metabolomics were collected and integrated in NOREVA, which included 12 sample-, 6 metabolite-, 1 sample & metabolite- and 4 internal standard-based methods (2,32,33). Some methods are frequently named by terminological studies (7,42) as ‘scaling’ (metabolite-based method/column-wise normalization) and ‘normalization’ (sample-based method/row-wise normalization). To be consistent with the publication (6) describing the new methods of combination strategy, the definition of the method class and which class each method belongs to are provided in Supplementary Table S1 and that report (6). As shown, an abbreviation (Abbr.) was assigned to each normalization method and is adopted to represent the corresponding method throughout the manuscript. In the meantime, 144 methods that combined 12 sample- and 6 metabolite-based methods were integrated. These new methods are also indicated by their abbreviations throughout the paper. For example, the method sequentially applying Cubic Splines and Power Scaling is depicted as CUB+POW. In total, 168 methods for normalizing the time-course and multi-class metabolomic data were fully provided and could be evaluated in NOREVA. To the best of our knowledge, these 168 constitute the largest set of normalization methods that has been provided by available tools so far.
Furthermore, signal drifts and batch effects are frequently encountered in the metabolic profiling, especially in the long-term and large-scale ones whose time spans are usually several months or even years (43,44). In such cases, data normalization is fundamental, but have to be coupled with a careful organization of the analytical run (43). Thus, a series of quality control samples (QCSs) over the entire time course of a large-scale study has been adopted to concatenate data of multiple analytical blocks into single dataset (45,46), and been considered as an essential measurement in preprocessing large-scale metabolomics data (19). In other words, the best result of metabolomic data processing should be achieved through applying the optimal normalization strategy to a set of data acquired in a well-designed analytical sequence (47). In NOREVA, a univariate approach termed the QCS-based robust LOESS signal correction (QCS-RLSC) for correcting signal drifts and removing batch effects from a given large-scale metabolomic dataset (43), was provided by integrating statTarget package (19). Such function can be utilized by NOREVA users by simply indicating the type of their uploaded dataset as ‘Data with Quality Control Samples’. Particularly, the users should carefully design the analytical sequence, and then provide the injection order in their uploaded data by strictly following the sequence of their experiment (injection order should be provided in the uploaded file as described in the last section of Materials and Methods).
Multiple Criteria Ensuring Collective Assessment
Performance assessment of each normalization method in this study was achieved using the same list of criteria (five well-established criteria in total) as those in NOREVA 1.0 (10), but the specific measures under each criterion were systematically modified and enhanced to meet the needs of time-course and multi-class metabolomic analyses. Moreover, under each criterion, one measure was selected to be representative, and a variety of well-defined cutoffs of this measure were used to categorize the normalization performance into Superior, Good and Poor.
Criterion Ca: Method's Ability to Reduce Intragroup Variation among Samples (9)
This criterion is the most widely applied and has been used by a number of available tools, such as NormalyzerDE (14), MetaboGroup S (35), pseudoQC (36) and metaX (37). Herein, the measures used under this criterion are similar to those in NOREVA 1.0 (10), which included: (i) Pooled Median Absolute Deviation (PMAD) & Pooled Estimate of Variance (PEV) (a lower value means a more thorough removal of experimentally induced noise and indicates a better normalization) (8); (ii) principal component analysis (PCA), visualizing the differences among multiple time-points/classes (the more distinct the differences, the better the performances of the applied method) (9); (iii) relative log abundance (RLA) plots, illustrating the tightness of samples across or within multiple time-points/classes (the median in the plots would be close to zero, and the variation around the median would be low) (32).
PMAD was selected to be the representative measure under Criterion Ca, and its value was larger than 0. PMAD is one of the most popular measures for evaluating the capacity of a method in reducing the intragroup variation among samples (6). A lower value of PMAD denotes a more thorough removal of unwanted variation (8). PMAD within the ranges of ≤0.3, ≤0.7 & >0.3 and >0.7 indicates Superior, Good and Poor performances, respectively (8,9,48).
Criterion Cb: Method's Effect on Differential Metabolic Analysis (10)
To meet the requirements of the time-course and multi-class metabolomic analysis, the clustering dendrogram and heatmap plot provided in NOREVA 1.0 (10) are completely replaced by the K-means plot (where K denotes the total number of time-points/classes in the studied dataset. K=2 for case-control studies). For time-course metabolomics, multivariate empirical Bayes statistics is first applied by running the mb.long function in timecourse R package (49). The metabolic biomarkers are then ranked and identified using HotellingT2 statistics (50). For multi-class data, the orthogonal partial least squares-discriminant analysis (OPLS-DA) was first used via running the opls function in the ropls R package (51), which was optimized by calculating the number of orthogonal components using cross-validation (51). Particularly, parameters ‘orthoI’, ‘crossvalI’ and ‘predI’ in opls function of ropls R package were set to ‘NA’, ‘2’ and ‘1’, respectively, which made the number of orthogonal components automatically computed and optimized based on 2-fold cross-validation and one predictive component (51). The above strategy has been frequently applied in current metabolomics (51–53). The metabolites with value of Variable Influence on Projection (VIP) larger than 1 are then identified as differential metabolic markers among K classes (28). Based on these markers identified from time-course/multi-class metabolomics data, K-means clustering is adopted to describe the level of differentiation among time-points/classes (54), and a method is considered well-performing when obvious differentiation among time-points/classes in the clustering outcome was observed.
In order to assess the level of differentiation among time-points/classes, a well-established index (purity) was calculated and selected to be the representative measure under Criterion Cb. Purity is an effective and transparent measure for evaluating the clustering quality (55,56). A clustering outcome of bad quality has a purity value close to 0, while a perfect clustering results in a purity of 1 (55,56). Purity within the ranges of >0.8, ≤0.8 & >0.5 and ≤0.5 denoted Superior, Good and Poor performances, respectively (56,57).
Criterion Cc: Method's Consistency in Markers Discovered from Different Datasets (58)
The low reproducibility among multiple sets of markers identified from different metabolomics datasets for the same research issue can raise doubt about reliability (59). The underlying reason for this lack of reproducibility might be attributed to the inconsistency of the applied processing methods (especially normalization) (58). Thus, the consistency in the sets of markers discovered from different datasets is considered to be an essential criterion for evaluating the normalization performance (10). Under this criterion, time-course/multi-class data are first divided evenly into three sub-datasets using the stratified random selection (60,61). Stratified random sampling (SRS) is a sampling method that involves the division of all samples into multiple subgroups known as strata (multiple classes for multi-class metabolomics, multiple time-points for time-course ones), and the random samples are then selected from each stratum and combined among different strata to construct three subgroups (60,61). In NOREVA, the strata function in the sampling R package was applied to perform SRS by setting parameter ‘stratanames’ (vector of stratification variables) and ‘size’ (number of samples in each subgroup for a studied stratum) to ‘the label of class/time-point’ and ‘N/3’ (62), respectively. The N denoted the total number of samples in studied stratum, and the number ‘3’ indicated the three subgroups. After the subgroup selection, the same strategy for identifying the differential metabolic markers as that described in Criterion Cb is applied to each sub-dataset. Based on the three marker sets identified from these three sub-datasets, a powerful measure relative weighted consistency (CWrel) is finally used to quantitatively evaluate the level of consistency among three sets of identified metabolic markers (63). Moreover, the reason why the studied dataset was divided into only three subgroups is due to the following. First, the CWrel was reported as subset-size-unbiased, which made it insensitive to the number of subgroups (63). Second, as provided in MetaboLights (64), a large number of metabolomic studies were of relatively small sample size. With the increase of the number of sub-datasets, the applicability of NOREVA can be significantly limited. For example, if the number of sub-datasets was set to 3, the minimum sample number of each class/time-point, considering the 2-fold cross-validation in marker selection, should equal to 6. In other words, the dataset with less than six samples in each class/time-point cannot be analyzed in NOREVA.
Compared with the well-established measure: weighted consistency (CW), CWrel is found to be powerful in avoiding the subset-size-biased problem (63). Particularly, CWrel counts the number of times every single metabolite appears in every single set of markers to represent the robustness among marker sets from an overall perspective (63). As the representative measure of Criterion Cc, CWrel is between 0 and 1. CWrel close to 1 referred to the highest robustness of the identified markers, and CWrel within the ranges of >0.3, ≤0.3 & >0.15 and ≤0.15 indicates Superior, Good and Poor performances, respectively (65).
Criterion Cd: Method's Influence on Classification Accuracy (66)
The prime goal of the time-course/multi-class analysis is to discover and validate a set of markers that could be employed to describe biological dynamics or differentiate multiple classes (29,31). The classification accuracy of the model constructed based on a certain normalization method is thus assessed using area under the curve (AUC) value and receiver operating characteristic (ROC) analysis, under this criterion (66). First, the same strategy for identifying the differential markers as that described in Criterion Cb is applied to a studied time-course/multi-class dataset. Second, a multiple classification model was constructed using the support vector machine (SVM) method via running the svm function in the e1071 R package (67), and the parameter ‘type’, ‘kernel’ and ‘cross’ were set to ‘C-classification’, ‘radial basis’ and ‘5’, respectively. In other words, an RBF-kernel SVM based on 5-fold cross validation was applied in this study to control the problem of overfitting (68). The parameters ‘cost’ and ‘gamma’ in svm function were optimized by applying the tune function in e1071 R package based on a grid search over supplied parameter ranges (69). Finally, AUC value for this multiple classification is calculated using the multi_roc function in multiROC R package (67). As the representative measure of Criterion Cd, the AUC is between 0 and 1. If a classifier achieves high classification performance on the studied time-course/multi-class data, it would yield large AUC value (close to 1). An AUC value in the range of >0.9, ≤0.9 & >0.7 and ≤0.7 represents Superior, Good, and Poor performances, respectively (70,71).
Criterion Ce: Level of Correspondence between Normalized and Reference Data (8)
The measure applied under this criterion is similar to that in NOREVA 1.0 (10). Log fold changes (logFCs) of the concentrations between any two classes of a time-course/multi-class dataset are calculated, and the degree of correspondence between the normalized data and references is then estimated. In case of the spike-in data, the relative levels of multiple spike-in metabolites can be used as references. Thus, the level of correspondence between the normalized data and references (spike-in metabolites) can be utilized as criterion for assessing normalization performance (8,66). The performance of each method is reflected by how well the logFCs of the means of normalized data corresponded to that of references (8). A boxplot illustrating the variations between any two classes is used as a representative measure of the Criterion Ce, and the preferred medians in the boxplot would equal to zero with the minimized variations (10,72). Moreover, the logFC of the means alone is not sufficient due to its overlook of data variability. Thus, in NOREVA, the logFC of standard deviations is calculated. Performances of each method can be reflected by how well this logFC of the normalized data corresponded to that of the references. A boxplot showing the variation between classes is further adopted as another measure of this criterion, and the preferred medians in the boxplot would equal to zero with the minimized variations.
Comprehensive Assessment from Multiple Perspectives
NOREVA enabled the comprehensive assessment of normalization performances by a collective ranking from multiple perspectives, which were based on the representative measures of different criteria discussed above. Particularly, these measures included the PMAD, purity, CWrel, and AUC value. Based on these measures, the performances of all 168 methods could be ranked separately, and four ranking numbers were assigned to each method by the four corresponding criteria. Due to the independent nature of the four criteria (10), the collective consideration of multiple criteria was proposed in this study and realized in NOREVA for providing the overall ranking to all 168 methods. Particularly, the overall ranking of a given method was defined by the sum of multiple ranking numbers under multiple criteria (the smaller the sum is, the higher a method ranks). To realize comprehensive performance assessment, a local version of NOREVA was constructed. It can be downloaded to and run on user's own computer. Particularly, three sequential steps should be followed. First, install the R and RStudio environment. Second, download the local NOREVA. Third, run NOREVA by executing the R commands in User Manual. Exemplar input/output files could be downloaded directly from the NOREVA website (https://idrblab.org/noreva/).
Time-course and Multi-class Benchmarks Collected
Eight benchmark datasets were collected from MetaboLights (64) to assess the performance of NOREVA, which included four time-course together with another four multi-class benchmarks. As shown in Table 2, these four time-course datasets consisted of MTBLS665 (73), MTBLS518 (74), MTBLS319 (75), and MTBLS656 (76). MTBLS665 contains untargeted metabolomic data from 18 samples with an observation from hree time-points (T0: before Plasmodium vivax infection; T1: on the day of diagnosis; T2: three-weeks after treatment); MTBLS518 presents longitudinal untargeted metabolomic data from 15 monkeys with observations from three time-points (T0: on the day of Plasmodium sporozoites infection; T1: 21 days after infection; T2: 90 days after infection); MTBLS319 includes untargeted data from eight samples of Pseudomonas putida mutation strains at three time-points (T0: at the time of toluene shock; T1: 10 mins after the toluene shock; T2: 60 min after the toluene shock); and MTBLS656 gives targeted metabolomic data from saliva of healthy volunteers of a consecutive sample collection from three time-points (T0: 0 hour in the morning; T1: 12 h in the evening; T2: 24 h in the morning). Meanwhile, four multi-class datasets were collected from MTBLS59 (72), MTBLS520 (77), and MTBLS370 (78). Particularly, MTBLS59 has 10 control samples of apple extract and three spiked sets of the same size (10 samples in each set, where nine compounds were spiked in various concentrations); MTBLS520 is composed of nine bryophyte species (12 samples for each species); and the remaining two datasets are all collected from MTBLS370 (one untargeted set of data consists of 885 extracellular metabolites from fresh medium, C. albicans spent media, S. aureus spent media & co-culture spent media and 6 samples for each media; one targeted dataset includes 72 extracellular metabolites from the same classes, and also six samples for each class). MTBLS665 and MTBLS59 contain no quality control sample (QCS) and internal standard (IS), MTBLS518 and MTBLS520 consist of QCS, MTBLS319 and the untargeted MTBLS370 include ISs, and MTBLS656 and targeted MTBLS370 give targeted metabolomic data without QCS and IS.
Table 2.
Eight benchmark datasets collected for case study analysis. Particularly, four time-course & four multi-class metabolomic benchmarks were collected. The number of time-points/classes in each benchmark was provided and described. GC–MS: gas chromatography–mass spectrometry; IS: internal standard; LC–MS: liquid chromatography–mass spectrometry; QCS: quality control sample
| Dataset ID & Platform | Remarks on Each Dataset | Dataset Description |
|---|---|---|
| MTBLS665 (73) Time-course LC-MS (positive mode) | Untargeted metabolomic dataset of 3 time-points without QCS & IS | 4,236 metabolites from people before P. vivax infection, on the day of positive blood smear, and three-weeks after treatment |
| MTBLS518 (74) Time-course LC-MS (positive mode) | Untargeted metabolomic dataset of 7 time-points with QCS | 14,339 metabolites from M. mulatta (rhesus monkey) after infecting P. sporozoites at days 0, 21, 27, 52, 59, 90, and 98 |
| MTBLS319 (75) Time-course GC-MS (time-of-flight) | Untargeted metabolomic dataset of 3 time-points with IS | 116 metabolites from the mutation strains of P. putida after the toluene shock at 0 min, 10 mins and 60 mins |
| MTBLS656 (76) Time-course LC-MS (ion-switching) | Targeted metabolomic dataset of 3 time-points without QCS & IS | 259 metabolites from the healthy volunteers of a time-series consecutive sample collections at 0 hr, 12 hrs, and 24 hrs |
| MTBLS59 (72) Multi-class LC-MS (positive mode) | Untargeted metabolomic dataset of 4 classes without QCS & IS | 1,632 metabolites from 4 types of apple extracts (control, other 3 spiked with nine compounds of different concentrations) |
| MTBLS520 (77) Multi-class LC-MS (positive mode) | Untargeted metabolomic dataset of 9 classes with QCS | 4,172 metabolites from 9 different bryophytes (B. rutabulum, C. cuspidata, F. taxifolius, G. pulvinata, etc.) |
| MTBLS370 (78) Multi-class GC-MS (Q exactive) | Untargeted metabolomic dataset of 4 classes with IS | 885 extracellular metabolites from fresh medium, C. albicans spent media, S. aureus spent media and co-culture spent media |
| MTBLS370 (78) Multi-class GC-MS (Q exactive) | Targeted metabolomic dataset of 4 classes without QCS & IS | 72 extracellular metabolites from fresh medium, C. albicans spent media, S. aureus spent media and co-culture spent media |
Server Implementation Details and Required File Format
NOREVA is deployed on a web server running Cent OS Linux v6.5, Apache HTTP web server v2.2.15 and Apache Tomcat servlet container. Its web interface was developed by R v3.2.2 and Shiny v0.13.1 running on Shiny-server v1.4.1.759. Various R packages were utilized in the background processes. NOREVA can be readily accessed by all users with no login requirement, and by diverse and popular web browsers including: Google Chrome, Mozilla Firefox, Safari and Internet Explorer 10 (or later).
A file consisting of a sample-by-feature matrix (samples in rows and features in columns) in csv format is required as input. For analyzing time-course metabolomic data, the first row of the first 5 columns should be sequentially labelled as ‘sample’, ‘batch’, ‘class’, ‘order’ and ‘time’, which indicate sample ID, batch ID, class of sample, injection order, and time-point, respectively. The sample ID should be unique among all samples; the batch ID refers to different analytical blocks or batches, which should be labeled with an ordinal number (e.g. 1, 2, 3, …); the class of samples indicates the QC sample (labeled as ‘NA’); the injection order strictly follows the sequence of the experiment; and the time-point refers to explicit time-points (T0, T1, T2, …) for each sample. The remaining columns give the mass-to-charge ratios and retention times of all metabolites. For analyzing multi-class data, the first row of the first 4 columns should be sequentially labelled as ‘sample’, ‘batch’, ‘class’ and ‘order’, which represent sample ID, batch ID, class of sample, and injection order, respectively. The sample ID should be unique among all samples; the batch ID indicates different analytical blocks or batches; the class of samples denotes QC sample (labeled as ‘NA’); and the injection order strictly follows the experiment. Detail file format requirements for data with/without IS/QCS are the same as that of NOREVA 1.0. Moreover, an additional file containing the reference metabolite data required in evaluating Criterion Ce must be in the same format as that in NOREVA 1.0 (10). Various exemplar files strictly following these requirements are fully provided and can be directly downloaded from the NOREVA website.
RESULTS AND DISCUSSION
Exploration of Time-course Metabolomics by NOREVA
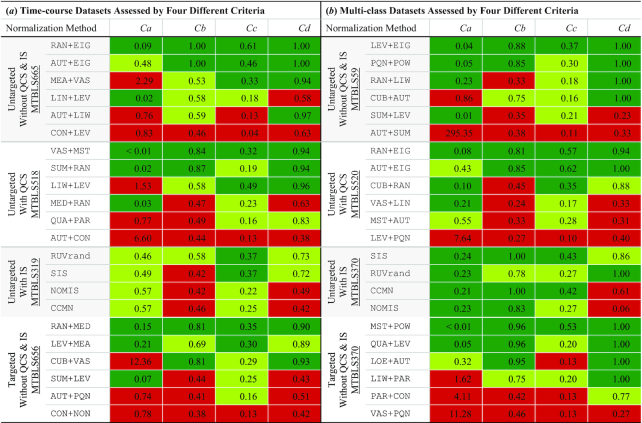
To evaluate the capability of NOREVA to identify well-performing method(s), three time-course datasets were collected: MTBLS665 (73), MTBLS518 (74) and MTBLS656 (76). These datasets were employed for demonstrating the performance of NOREVA on (i) processing the untargeted metabolomic data without quality control sample (QCS) & internal standard (IS), (ii) correcting the signal drifts in untargeted metabolomics based on QCS and (iii) normalizing the targeted data. Table 3A showed the performances of six representative normalization methods on each of those three benchmark datasets (collectively evaluated by four different criteria). For all three datasets, the performances of different normalizations varied substantially. Particularly, the performances of some methods were consistently Superior (such as: RAN+EIG, VAS+MST, and RAN+MED, highlighted by the green background under all criteria in Table 3A); the performances of another some were found as consistently Poor for all criteria (CON+LEV, AUT+CON and CON+NON, highlighted in red in Table 3A); the majority of these representative methods showed Good (light green in Table 3A) or Superior performance under some criteria but exhibited Poor performance under the others. Thus, it is highly possible that a certain method is poorly-performing under one or more criteria for a time-course dataset, and it is key to systematically evaluate the performance of the studied method based on the multiple criteria proposed in NOREVA. Moreover, four well-known IS-based methods (CCMN, NOMIS, RUV-random and SIS in Supplementary Table S1) were assessed using MTBLS319 (75). As shown in Table 3A, the performances of these methods differed substantially, which denoted that they should also be assessed by multiple criteria.
Table 3.
The performances of representative normalization methods on different types of benchmarks (collectively assessed by four different criteria). (a) assessing results for three untargeted time-course benchmarks: without QCS & IS (73), with QCS (74), with IS (75) and one targeted time-course benchmark (76); (b) assessing results for three untargeted multi-class benchmarks: without QCS & IS (72), with QCS (77) and with IS (78) and one targeted multi-class benchmark (78). Based on the ‘Superior’, ‘Good’, and ‘Poor’ performances defined in the second section of MATERIALS AND METHODS, the background of each assessment result was colored in green, light green, and red for the ‘Superior’, ‘Good’, and ‘Poor’ performances, respectively. The abbreviations of normalization methods were described in Supplementary Table S1
|
Proper application of normalization methods could also be reflected by their levels of success in preserving the ‘true’ biological variation (10,79). These true variations, used as the gold standard in performance assessments, include clinically/experimentally well-established markers, spiking compounds, and so on (10,79). As the metabolite of amino acid tryptophan, kynurenine has been reported to be a well-established marker that is elevated in patient plasma after malaria infection and then decline after treatment (80,81). MTBLS665 consisted of the metabolomic data from 18 samples with observations at three time-points: before malaria infection, on the day of diagnosis, and three-weeks after treatment (73). Based on this benchmark, the normalization performances of the different methods are explicitly illustrated in Figure 2. Three normalization methods were assessed: (a) the method (mean) applied in the original study of the MTBLS665 benchmark (73) (its performance was found by NOREVA to be consistently Good under all four criteria), (b) the method (Range Scaling+EigenMS) whose performance was found to be consistently Superior in all criteria (shown in Table 3A) and (c) the method (Contrast+Level Scaling) whose performance was identified as consistently Poor under all criteria (Table 3A). It is clear to see in Figure 2 that both MEA and RAN+EIG could effectively preserve the ‘true’ biological variation of kynurenine (elevated in plasma after malaria infection, and then declined after treatment (80,81)). In contrast, CON+LEV could hardly preserve this variation.
Figure 2.

Comparing the performances of three normalization methods on the time-course benchmark MTBLS665 (73) based on the well-established metabolic marker (kynurenine) elevated in the patient plasma after malaria infection and then declined after treatment (80,81). (A) the normalization method (Mean) applied in the original study of the MTBLS665 benchmark (73); (B) the normalization method (range scaling+EigenMS) identified to be consistently well-performing under all four criteria by NOREVA as shown in Table 3A; (C) the normalization method (contrast+level scaling) identified to be consistently poorly-performing under all four criteria by NOREVA as shown in Table 3A. The violin plots were used to illustrate the concentration distribution of kynurenine among individuals, and the dots indicated the exact concentrations of kynurenine in an individual at certain time-points (T0, T1 and T2). All concentrations were scaled into the range between 0 and 1.
Insights into Multi-class Metabolomics by NOREVA
For multi-class metabolomics, three benchmarks were considered: MTBLS59 (72), MTBLS520 (77) and MTBLS370 (78). These datasets were employed for demonstrating the performance of NOREVA on (i) processing the untargeted multi-class metabolomic data without QCS & IS, (ii) correcting the signal drifts in the untargeted metabolomics using QCSs and (iii) normalizing the targeted multi-class metabolomic data. Table 3B showed the performances of six representative methods on each of these datasets. For all datasets, the performances of different methods varied significantly. Particularly, the performances of some methods (like: LEV+EIG, RAN+EIG and MST+POW) were consistently Superior under all four criteria; the performance of another some (AUT+SUM, LEV+PQN & VAS+PQN) was consistently Poor; the remaining methods showed Good/Superior performance under some criteria but Poor under the others. Moreover, IS-based methods were also assessed based on the multi-class benchmark MTBLS370 (78). As shown in Table 3B, the performances of the methods also differed substantially for this dataset. Therefore, similar to the time-course dataset, the normalization of multi-class metabolomic dataset requires a systematical evaluation based on the multiple criteria.
MTBLS59 (72) consists of a control set of apple extracts and three spiked sets of the same size (where nine spiking compounds were added at different concentrations). These spiking compounds were the ‘true’ biological variations for assessing whether a normalization was properly applied (10,79). Particularly, two spiking compounds (trans-resveratrol & cyanidin-3-galactoside) were not naturally present in the studied extracts, so a constant concentration was spiked for each (0.4 and 0.57 mg/L, respectively); six out of the remaining seven compounds (catechin, epicatechin, phloridzin, quercetin-3-galactoside, quercetin-3-rhamnoside and quercetin-3-glucoside) had been spiked into three groups with a gradual increase in concentration (from control to an increase of 20%, then 40%, and finally 100%); the last compound (quercetin) was spiked into another three groups with different variations in concentration (from control to an increase of 20%, then 40%, and finally 40%) (72). Based on MTBLS59, the performance of different normalization methods was shown in Figure 3. Particularly, two representative normalization methods in Table 3 were assessed (a) a method (Level Scaling+EigenMS) whose performance was consistently Superior under four criteria (Table 3B) and (b) a method (Auto Scaling+Total Sum) whose performance was consistently Poor under all four criteria (Table 3B). It was clear that LEV+EIG could effectively preserve the true biological variations of nine spiking compounds (Figure 3A), but AUT+SUM could hardly preserve this variation for the majority of the spiking compounds (Figure 3B).
Figure 3.

Comparison of two representative normalization methods based on nine spiking compounds. (A) the concentration distribution among four studied groups after the normalization using level scaling+EigenMS (LEV+EIG); (B) the concentration distribution among all studied groups after the normalization via auto scaling+total sum (AUT+SUM). Base on the comprehensive performance assessments of all 168 normalization methods, LEV+EIG demonstrated consistently Superior performance across all criteria, while AUT+SUM was identified to be consistently poorly-performing under all four criteria (as demonstrated in Table 3). Particularly, two out of the nine spiking compounds (trans-resveratrol & cyanidin-3-galactoside) are not naturally present in the studied extract, so the constant concentrations were spiked for each compound (0.4 and 0.57 mg/l, respectively). Six out of the remaining seven compounds (catechin, phloridzin, epicatechin, quercetin-3-galactoside, quercetin-3-rhamnoside & quercetin-3-glucoside) were spiked into three groups with the gradual increase of concentration (from control to an increase of 20%, then 40%, and finally 100%). The last compound (quercetin) was also spiked with a variation of concentration (from control to an increase of 20%, then 40%, and finally 40%).
Comprehensive Performance Assessment by NOREVA
To discover the well-performing normalization methods, NOREVA 2.0 proposes a new strategy that comprehensively assesses the performances of 168 normalization methods. As illustrated in Figure 4 and Supplementary Figure S1, this strategy was applied to 6 benchmarks: MTBLS665 (73), MTBLS518 (74), MTBLS656 (76), MTBLS59 (72), MTBLS520 (77) and MTBLS370 (78) (top-100 ranked methods were illustrated, and the detail results of performance assessments were provided in Supplementary Tables S2–S4. Particularly, the assessing results under each criterion were first calculated and colored into green, light green, and red for Superior, Good, and Poor performances, respectively. Then, all methods were comprehensively ranked by collectively considering the assessment of all criteria. As shown in Figure 4 and Supplementary Figure S1, the capacity of only 5 (3.0%), 2 (1.2%), 1 (0.6%), 4 (2.4%), 1 (0.6%) and 23 (13.7%) out of all 168 methods were discovered as consistently Superior under all criteria for MTBLS665 (73), MTBLS518 (74), MTBLS656 (76), MTBLS59 (72), MTBLS520 (77) and MTBLS370 (78), respectively. A further analyses revealed that all the ‘consistently Superior’ methods were of the combination strategy reported by a recent study (6) and integrated by NOREVA. As reported (6), this strategy was proposed to create novel normalization method(s) through combining a sample-based normalization with a metabolite-based one (shown in Supplementary Table S1) or vice versa. Although it might not be capable of drawing any decisive conclusion using only four datasets, these results above did indicate the necessity of conducting comprehensive performance evaluation on all methods, and those methods of the combination strategy in NOREVA could be the promising candidates of good performance.
Figure 4.

Comprehensive assessment among all normalization methods (the top-100 were shown) based on the collective evaluations using four different criteria. The assessing outcomes for time-course datasets: (A) MTBLS665 without QCS & IS (73) & (B) MTBLS518 with QCS (74), and multi-class benchmarks: (C) MTBLS59 without QCS & IS (72) & (D) MTBLS520 with QCS (77) were comprehensively ranked and colored using performances. Based on the description in the second section of MATERIALS AND METHODS, the background of each evaluation result was shown in green, light green and red for Superior, Good and Poor performance, respectively. The abbreviations of the normalization methods were described in Supplementary Table S1. Criteria Ca, Cb, Cc and Cd were measured by PMAD, purity, CWrel and AUC, respectively.
In the meantime, the performances of 67 (39.9%), 69 (41.1%), 58 (34.5%), 57 (33.9%), 10 (6.0%) and 53 (31.5%) out of the 168 methods were discovered as Good/Superior under all criteria for MTBLS665, MTBLS518, MTBLS656, MTBLS59, MTBLS520 and MTBLS370, respectively. Among the newly identified ‘Good/Superior’ methods, 54 (80.6%), 66 (95.7%), 46 (79.3%), 45 (78.9%), 9 (90.0%) and 48 (90.6%) methods were of the combination strategy. The results above demonstrated that the traditional methods (as provided in Supplementary Table S1) popular in current metabolomics could also be effective in removing the unwanted variation for time-course and multi-class metabolomic datasets, but a systematic assessment based on multiple criteria was required for the discovery of well-performing method(s). Moreover, the methods of combination strategy consisted of the majority of the identified ‘Good/Superior’ methods, which denoted that the combined methods could be promising candidates of good performance for a studied dataset.
CONCLUSIONS AND PERSPECTIVES
This update made NOREVA capable of normalizing and evaluating time-course and multi-class metabolomic data, and identifying well-performing method(s) by comprehensively assessing the largest set of normalizations. The case studies based on benchmark datasets extensively validated the significance and originality of this update. However, the analysis of metabolomic experiment with a small amount of classes (e.g. 3–5 classes) is different from that of relatively diverse classes (e.g. >10 classes). Moreover, the time-course metabolomics are even more complicated than the multi-class one, since it follows a ‘longitudinal’ design where the same sampling unit is followed over time. Because of such complex nature of time-course and multi-class studies, the application of NOREVA may be greatly limited. To assess the level of possible limitation, all datasets (∼700) in MetaboLights (64) were first systematically reviewed, and the datasets, (i) with unnormalized raw data available and (ii) with no less than six samples in each class/time-point, were collected. Among all the collected datasets, two were identified as with the largest number of classes/time-points in MetaboLights, which included MTBLS187 of 14 time-points (82) & MTBLS338 of 19 classes (83). Then, the well-performing normalizations for these two datasets were identified using NOREVA, and their results of comprehensive evaluation were shown in Supplementary Figure S1C (MTBLS187) and Supplementary Figure S1D (MTBLS338). As illustrated, no method was identified to be consistently Superior for either MTBLS187 or MTBLS338, which demonstrated the difficulty of the proposed NOREVA strategy in assessing the two datasets of complex nature. Moreover, it is easy to understand that, with the aggravation of data complexity (the increase of the number of classes/time-points), the ability of NOREVA to identify well-performing methods may be gradually limited. However, as illustrated in Supplementary Figure S1C and D, NOREVA was still capable of identifying the methods of consistently Good performances (light green/green). Considering that the assessed datasets are among the ones of the largest number of classes and time-points in the latest MetaboLights (64), it would be expected that this version of NOREVA could be used for the majority of current time-course/multi-class problems. With the advent of big data era (especially OMIC studies (84–88), precision medicine (89–94), and so on), NOREVA and other available tools could collectively contribute to various aspects of scientific research, such as pathological study, drug discovery and biomarker identification.
Supplementary Material
Contributor Information
Qingxia Yang, College of Pharmaceutical Sciences, Zhejiang University, Hangzhou 310058, China; School of Pharmaceutical Sciences, Chongqing University, Chongqing 401331, China.
Yunxia Wang, College of Pharmaceutical Sciences, Zhejiang University, Hangzhou 310058, China.
Ying Zhang, College of Pharmaceutical Sciences, Zhejiang University, Hangzhou 310058, China.
Fengcheng Li, College of Pharmaceutical Sciences, Zhejiang University, Hangzhou 310058, China.
Weiqi Xia, College of Pharmaceutical Sciences, Zhejiang University, Hangzhou 310058, China.
Ying Zhou, Zhejiang Provincial Key Laboratory for Drug Clinical Research and Evaluation & The First Affiliated Hospital, Zhejiang University, Hangzhou 310000, China.
Yunqing Qiu, Zhejiang Provincial Key Laboratory for Drug Clinical Research and Evaluation & The First Affiliated Hospital, Zhejiang University, Hangzhou 310000, China.
Honglin Li, School of Pharmacy, East China University of Science and Technology, Shanghai 200237, China.
Feng Zhu, College of Pharmaceutical Sciences, Zhejiang University, Hangzhou 310058, China; School of Pharmaceutical Sciences, Chongqing University, Chongqing 401331, China.
SUPPLEMENTARY DATA
Supplementary Data are available at NAR Online.
FUNDING
National Key Research and Development Program of China [2018YFC0910500]; National Natural Science Foundation of China [81872798, U1909208]; Fundamental Research Funds for Central University [2018QNA7023, 10611CDJXZ238826, 2018CDQYSG0007, CDJZR14468801]; Key R&D Program of Zhejiang Province [2020C03010]; Leading Talent of ‘ChinaTen Thousand Plan’ - National High-Level Talents Special Support Plan. Funding for open access charge: National Natural Science Foundation of China [81872798].
Conflict of interest statement. None declared.
REFERENCES
- 1. Giskeodegard G.F., Andreassen T., Bertilsson H., Tessem M.B., Bathen T.F.. The effect of sampling procedures and day-to-day variations in metabolomics studies of biofluids. Anal. Chim. Acta. 2019; 1081:93–102. [DOI] [PubMed] [Google Scholar]
- 2. De Livera A.M., Sysi-Aho M., Jacob L., Gagnon-Bartsch J.A., Castillo S., Simpson J.A., Speed T.P.. Statistical methods for handling unwanted variation in metabolomics data. Anal. Chem. 2015; 87:3606–3615. [DOI] [PMC free article] [PubMed] [Google Scholar]
- 3. De Livera A.M., Olshansky G., Simpson J.A., Creek D.J.. NormalizeMets: assessing, selecting and implementing statistical methods for normalizing metabolomics data. Metabolomics. 2018; 14:54. [DOI] [PubMed] [Google Scholar]
- 4. Rathahao-Paris E., Alves S., Debrauwer L., Cravedi J.P., Paris A.. An efficient data-filtering strategy for easy metabolite detection from the direct analysis of a biological fluid using Fourier transform mass spectrometry. Rapid Commun. Mass Spectrom. 2017; 31:485–494. [DOI] [PubMed] [Google Scholar]
- 5. Boysen A.K., Heal K.R., Carlson L.T., Ingalls A.E.. Best-matched internal standard normalization in liquid chromatography-mass spectrometry metabolomics applied to environmental samples. Anal. Chem. 2018; 90:1363–1369. [DOI] [PubMed] [Google Scholar]
- 6. Yang Q., Hong J., Li Y., Xue W., Li S., Yang H., Zhu F.. A novel bioinformatics approach to identify the consistently well-performing normalization strategy for current metabolomic studies. Brief. Bioinform. 2019; doi:10.1093/bib/bbz137. [DOI] [PMC free article] [PubMed] [Google Scholar]
- 7. Craig A., Cloarec O., Holmes E., Nicholson J.K., Lindon J.C.. Scaling and normalization effects in NMR spectroscopic metabonomic data sets. Anal. Chem. 2006; 78:2262–2267. [DOI] [PubMed] [Google Scholar]
- 8. Valikangas T., Suomi T., Elo L.L.. A systematic evaluation of normalization methods in quantitative label-free proteomics. Brief. Bioinform. 2018; 19:1–11. [DOI] [PMC free article] [PubMed] [Google Scholar]
- 9. Chawade A., Alexandersson E., Levander F.. Normalyzer: a tool for rapid evaluation of normalization methods for omics data sets. J. Proteome Res. 2014; 13:3114–3120. [DOI] [PMC free article] [PubMed] [Google Scholar]
- 10. Li B., Tang J., Yang Q., Li S., Cui X., Li Y., Chen Y., Xue W., Li X., Zhu F.. NOREVA: normalization and evaluation of MS-based metabolomics data. Nucleic Acids Res. 2017; 45:W162–W170. [DOI] [PMC free article] [PubMed] [Google Scholar]
- 11. Forsberg E.M., Huan T., Rinehart D., Benton H.P., Warth B., Hilmers B., Siuzdak G.. Data processing, multi-omic pathway mapping, and metabolite activity analysis using XCMS Online. Nat. Protoc. 2018; 13:633–651. [DOI] [PMC free article] [PubMed] [Google Scholar]
- 12. Chong J., Soufan O., Li C., Caraus I., Li S., Bourque G., Wishart D.S., Xia J.. MetaboAnalyst 4.0: towards more transparent and integrative metabolomics analysis. Nucleic Acids Res. 2018; 46:W486–W494. [DOI] [PMC free article] [PubMed] [Google Scholar]
- 13. Hong J., Luo Y., Zhang Y., Ying J., Xue W., Xie T., Tao L., Zhu F.. Protein functional annotation of simultaneously improved stability, accuracy and false discovery rate achieved by a sequence-based deep learning. Brief. Bioinform. 2019; doi:10.1093/bib/bbz081. [DOI] [PMC free article] [PubMed] [Google Scholar]
- 14. Willforss J., Chawade A., Levander F.. NormalyzerDE: online tool for improved normalization of omics expression data and high-sensitivity differential expression analysis. J. Proteome Res. 2019; 18:732–740. [DOI] [PubMed] [Google Scholar]
- 15. Sud M., Fahy E., Cotter D., Azam K., Vadivelu I., Burant C., Edison A., Fiehn O., Higashi R., Nair K.S. et al.. Metabolomics Workbench: an international repository for metabolomics data and metadata, metabolite standards, protocols, tutorials and training, and analysis tools. Nucleic Acids Res. 2016; 44:D463–D470. [DOI] [PMC free article] [PubMed] [Google Scholar]
- 16. Yang Q., Li B., Tang J., Cui X., Wang Y., Li X., Hu J., Chen Y., Xue W., Lou Y. et al.. Consistent gene signature of schizophrenia identified by a novel feature selection strategy from comprehensive sets of transcriptomic data. Brief. Bioinform. 2019; doi:10.1093/bib/bbz049. [DOI] [PubMed] [Google Scholar]
- 17. Madrid-Gambin F., Oller-Moreno S., Fernandez L., Bartova S., Giner M.P., Joyce C., Ferraro F., Montoliu I., Moco S., Marco S.. AlpsNMR: an R package for signal processing of fully untargeted NMR-based metabolomics. Bioinformatics. 2020; doi:10.1093/bioinformatics/btaa022. [DOI] [PubMed] [Google Scholar]
- 18. Hong J., Luo Y., Mou M., Fu J., Zhang Y., Xue W., Xie T., Tao L., Lou Y., Zhu F.. Convolutional neural network-based annotation of bacterial type IV secretion system effectors with enhanced accuracy and reduced false discovery. Brief. Bioinform. 2019; doi:10.1093/bib/bbz120. [DOI] [PubMed] [Google Scholar]
- 19. Luan H., Ji F., Chen Y., Cai Z.. statTarget: a streamlined tool for signal drift correction and interpretations of quantitative mass spectrometry-based omics data. Anal. Chim. Acta. 2018; 1036:66–72. [DOI] [PubMed] [Google Scholar]
- 20. Peters K., Bradbury J., Bergmann S., Capuccini M., Cascante M., de Atauri P., Ebbels T.M.D., Foguet C., Glen R., Gonzalez-Beltran A. et al.. PhenoMeNal: processing and analysis of metabolomics data in the cloud. Gigascience. 2019; 8:giy149. [DOI] [PMC free article] [PubMed] [Google Scholar]
- 21. Lee C.K., Jeong S.H., Jang C., Bae H., Kim Y.H., Park I., Kim S.K., Koh G.Y.. Tumor metastasis to lymph nodes requires YAP-dependent metabolic adaptation. Science. 2019; 363:644–649. [DOI] [PubMed] [Google Scholar]
- 22. Mills E.L., Pierce K.A., Jedrychowski M.P., Garrity R., Winther S., Vidoni S., Yoneshiro T., Spinelli J.B., Lu G.Z., Kazak L. et al.. Accumulation of succinate controls activation of adipose tissue thermogenesis. Nature. 2018; 560:102–106. [DOI] [PMC free article] [PubMed] [Google Scholar]
- 23. Li Y.H., Li X.X., Hong J.J., Wang Y.X., Fu J.B., Yang H., Yu C.Y., Li F.C., Hu J., Xue W.W. et al.. Clinical trials, progression-speed differentiating features and swiftness rule of the innovative targets of first-in-class drugs. Brief. Bioinform. 2019; doi:10.1093/bib/bby130. [DOI] [PMC free article] [PubMed] [Google Scholar]
- 24. Yan W., Wu X., Zhou W., Fong M.Y., Cao M., Liu J., Liu X., Chen C.H., Fadare O., Pizzo D.P. et al.. Cancer-cell-secreted exosomal miR-105 promotes tumour growth through the MYC-dependent metabolic reprogramming of stromal cells. Nat. Cell Biol. 2018; 20:597–609. [DOI] [PMC free article] [PubMed] [Google Scholar]
- 25. Yurkovich J.T., Zielinski D.C., Yang L., Paglia G., Rolfsson O., Sigurjonsson O.E., Broddrick J.T., Bordbar A., Wichuk K., Brynjolfsson S. et al.. Quantitative time-course metabolomics in human red blood cells reveal the temperature dependence of human metabolic networks. J. Biol. Chem. 2017; 292:19556–19564. [DOI] [PMC free article] [PubMed] [Google Scholar]
- 26. Tiwari S., van Tonder A.J., Vilcheze C., Mendes V., Thomas S.E., Malek A., Chen B., Chen M., Kim J., Blundell T.L. et al.. Arginine-deprivation-induced oxidative damage sterilizes Mycobacterium tuberculosis. Proc. Natl. Acad. Sci. U.S.A. 2018; 115:9779–9784. [DOI] [PMC free article] [PubMed] [Google Scholar]
- 27. Swenson T.L., Karaoz U., Swenson J.M., Bowen B.P., Northen T.R.. Linking soil biology and chemistry in biological soil crust using isolate exometabolomics. Nat. Commun. 2018; 9:19. [DOI] [PMC free article] [PubMed] [Google Scholar]
- 28. Yang Q., Xu L., Tang L.J., Yang J.T., Wu B.Q., Chen N., Jiang J.H., Yu R.Q.. Simultaneous detection of multiple inherited metabolic diseases using GC-MS urinary metabolomics by chemometrics multi-class classification strategies. Talanta. 2018; 186:489–496. [DOI] [PubMed] [Google Scholar]
- 29. Peeters L., Beirnaert C., Van der Auwera A., Bijttebier S., De Bruyne T., Laukens K., Pieters L., Hermans N., Foubert K.. Revelation of the metabolic pathway of hederacoside C using an innovative data analysis strategy for dynamic multiclass biotransformation experiments. J. Chromatogr. A. 2019; 1595:240–247. [DOI] [PubMed] [Google Scholar]
- 30. Li F., Zhou Y., Zhang X., Tang J., Yang Q., Zhang Y., Luo Y., Hu J., Xue W., Qiu Y. et al.. SSizer: determining the sample sufficiency for comparative biological study. J. Mol. Biol. 2020; doi:10.1016/j.jmb.2020.01.027. [DOI] [PubMed] [Google Scholar]
- 31. Peters S., Janssen H.G., Vivo-Truyols G.. Trend analysis of time-series data: a novel method for untargeted metabolite discovery. Anal. Chim. Acta. 2010; 663:98–104. [DOI] [PubMed] [Google Scholar]
- 32. De Livera A.M., Dias D.A., De Souza D., Rupasinghe T., Pyke J., Tull D., Roessner U., McConville M., Speed T.P.. Normalizing and integrating metabolomics data. Anal. Chem. 2012; 84:10768–10776. [DOI] [PubMed] [Google Scholar]
- 33. Warrack B.M., Hnatyshyn S., Ott K.H., Reily M.D., Sanders M., Zhang H., Drexler D.M.. Normalization strategies for metabonomic analysis of urine samples. J. Chromatogr. B. 2009; 877:547–552. [DOI] [PubMed] [Google Scholar]
- 34. Guitton Y., Tremblay-Franco M., Le Corguille G., Martin J.F., Petera M., Roger-Mele P., Delabriere A., Goulitquer S., Monsoor M., Duperier C. et al.. Create, run, share, publish, and reference your LC-MS, FIA-MS, GC-MS, and NMR data analysis workflows with the Workflow4Metabolomics 3.0 Galaxy online infrastructure for metabolomics. Int. J. Biochem. Cell Biol. 2017; 93:89–101. [DOI] [PubMed] [Google Scholar]
- 35. Wang S., Chen X., Dan D., Zheng W., Hu L., Yang H., Cheng J., Gong M.. MetaboGroup S: a group entropy-based web platform for evaluating normalization methods in blood metabolomics data from maintenance hemodialysis patients. Anal. Chem. 2018; 90:11124–11130. [DOI] [PubMed] [Google Scholar]
- 36. Wang S., Yang H.. pseudoQC: a regression-based simulation software for correction and normalization of complex metabolomics and proteomics datasets. Proteomics. 2019; 19:e1900264. [DOI] [PubMed] [Google Scholar]
- 37. Wen B., Mei Z., Zeng C., Liu S.. metaX: a flexible and comprehensive software for processing metabolomics data. BMC Bioinformatics. 2017; 18:183. [DOI] [PMC free article] [PubMed] [Google Scholar]
- 38. Franceschi P., Mylonas R., Shahaf N., Scholz M., Arapitsas P., Masuero D., Weingart G., Carlin S., Vrhovsek U., Mattivi F. et al.. MetaDB a data processing workflow in untargeted MS-based metabolomics experiments. Front. Bioeng. Biotechnol. 2014; 2:72. [DOI] [PMC free article] [PubMed] [Google Scholar]
- 39. Hao L., Zhu Y., Wei P., Johnson J., Buchberger A., Frost D., Kao W.J., Li L.. Metandem: an online software tool for mass spectrometry-based isobaric labeling metabolomics. Anal. Chim. Acta. 2019; 1088:99–106. [DOI] [PMC free article] [PubMed] [Google Scholar]
- 40. Shen X., Zhu Z.J.. MetFlow: an interactive and integrated workflow for metabolomics data cleaning and differential metabolite discovery. Bioinformatics. 2019; 35:2870–2872. [DOI] [PubMed] [Google Scholar]
- 41. Cardoso S., Afonso T., Maraschin M., Rocha M.. WebSpecmine: a website for metabolomics data analysis and mining. Metabolites. 2019; 9:E237. [DOI] [PMC free article] [PubMed] [Google Scholar]
- 42. Xia J., Wishart D.S.. Web-based inference of biological patterns, functions and pathways from metabolomic data using MetaboAnalyst. Nat. Protoc. 2011; 6:743–760. [DOI] [PubMed] [Google Scholar]
- 43. Dunn W.B., Broadhurst D., Begley P., Zelena E., Francis-McIntyre S., Anderson N., Brown M., Knowles J.D., Halsall A., Haselden J.N. et al.. Procedures for large-scale metabolic profiling of serum and plasma using gas chromatography and liquid chromatography coupled to mass spectrometry. Nat. Protoc. 2011; 6:1060–1083. [DOI] [PubMed] [Google Scholar]
- 44. Zelena E., Dunn W.B., Broadhurst D., Francis-McIntyre S., Carroll K.M., Begley P., O’Hagan S., Knowles J.D., Halsall A., Consortium H. et al.. Development of a robust and repeatable UPLC-MS method for the long-term metabolomic study of human serum. Anal. Chem. 2009; 81:1357–1364. [DOI] [PubMed] [Google Scholar]
- 45. van der Kloet F.M., Bobeldijk I., Verheij E.R., Jellema R.H.. Analytical error reduction using single point calibration for accurate and precise metabolomic phenotyping. J. Proteome Res. 2009; 8:5132–5141. [DOI] [PubMed] [Google Scholar]
- 46. Brunius C., Shi L., Landberg R.. Large-scale untargeted LC-MS metabolomics data correction using between-batch feature alignment and cluster-based within-batch signal intensity drift correction. Metabolomics. 2016; 12:173. [DOI] [PMC free article] [PubMed] [Google Scholar]
- 47. Gagnebin Y., Tonoli D., Lescuyer P., Ponte B., de Seigneux S., Martin P.Y., Schappler J., Boccard J., Rudaz S.. Metabolomic analysis of urine samples by UHPLC-QTOF-MS: impact of normalization strategies. Anal. Chim. Acta. 2017; 955:27–35. [DOI] [PubMed] [Google Scholar]
- 48. Fu J., Tang J., Wang Y., Cui X., Yang Q., Hong J., Li X., Li S., Chen Y., Xue W. et al.. Discovery of the consistently well-performed analysis chain for SWATH-MS based pharmacoproteomic quantification. Front. Pharmacol. 2018; 9:681. [DOI] [PMC free article] [PubMed] [Google Scholar]
- 49. Tai Y.C., Speed T.P.. On gene ranking using replicated microarray time course data. Biometrics. 2009; 65:40–51. [DOI] [PubMed] [Google Scholar]
- 50. Li P., Tang H., Shi C., Xie Y., Zhou H., Xia B., Zhang C., Chen L., Jiang L.. Untargeted metabolomics analysis of Mucorracemosus Douchi fermentation process by gas chromatography with time-of-flight mass spectrometry. Food Sci. Nutr. 2019; 7:1865–1874. [DOI] [PMC free article] [PubMed] [Google Scholar]
- 51. Thevenot E.A., Roux A., Xu Y., Ezan E., Junot C.. Analysis of the human adult urinary metabolome variations with age, body mass index, and gender by implementing a comprehensive workflow for univariate and OPLS statistical analyses. J. Proteome Res. 2015; 14:3322–3335. [DOI] [PubMed] [Google Scholar]
- 52. Hu D.Y., Luo Y., Li C.B., Zhou C.Y., Li X.H., Peng A., Liu J.Y.. Oxylipin profiling of human plasma reflects the renal dysfunction in uremic patients. Metabolomics. 2018; 14:104. [DOI] [PubMed] [Google Scholar]
- 53. Yuan F., Cheng K., Gao J., Pan S.. Characterization of cultivar differences of blueberry wines using GC-QTOF-MS and metabolic profiling methods. Molecules. 2018; 23:2376. [DOI] [PMC free article] [PubMed] [Google Scholar]
- 54. Jacob S., Nodzenski M., Reisetter A.C., Bain J.R., Muehlbauer M.J., Stevens R.D., Ilkayeva O.R., Lowe L.P., Metzger B.E., Newgard C.B. et al.. Targeted metabolomics demonstrates distinct and overlapping maternal metabolites associated with BMI, glucose, and insulin sensitivity during pregnancy across four ancestry groups. Diabetes Care. 2017; 40:911–919. [DOI] [PMC free article] [PubMed] [Google Scholar]
- 55. Jiang H., Sohn L.L., Huang H., Chen L.. Single cell clustering based on cell-pair differentiability correlation and variance analysis. Bioinformatics. 2018; 34:3684–3694. [DOI] [PubMed] [Google Scholar]
- 56. Huang S., Cheng Y., Lang D., Chi R., Liu G.. A formal algorithm for verifying the validity of clustering results based on model checking. PLoS One. 2014; 9:e90109. [DOI] [PMC free article] [PubMed] [Google Scholar]
- 57. Huang A. Similarity measures for text document clustering. Proc. N Z Comput. Sci. Res. Stud. Conf. 2008; 2008:49–56. [Google Scholar]
- 58. Wang X., Gardiner E.J., Cairns M.J.. Optimal consistency in microRNA expression analysis using reference-gene-based normalization. Mol. Biosyst. 2015; 11:1235–1240. [DOI] [PubMed] [Google Scholar]
- 59. Wang Y., Klijn J.G., Zhang Y., Sieuwerts A.M., Look M.P., Yang F., Talantov D., Timmermans M., Meijer-van Gelder M.E., Yu J. et al.. Gene-expression profiles to predict distant metastasis of lymph-node-negative primary breast cancer. Lancet. 2005; 365:671–679. [DOI] [PubMed] [Google Scholar]
- 60. Onderwater G.L.J., Ligthart L., Bot M., Demirkan A., Fu J., van der Kallen C.J.H., Vijfhuizen L.S., Pool R., Liu J., Vanmolkot F.H.M. et al.. Large-scale plasma metabolome analysis reveals alterations in HDL metabolism in migraine. Neurology. 2019; 92:1899–1911. [DOI] [PMC free article] [PubMed] [Google Scholar]
- 61. Setia M.S. Methodology series module 5: sampling strategies. Indian J. Dermatol. 2016; 61:505–509. [DOI] [PMC free article] [PubMed] [Google Scholar]
- 62. Huber W., Carey V.J., Gentleman R., Anders S., Carlson M., Carvalho B.S., Bravo H.C., Davis S., Gatto L., Girke T. et al.. Orchestrating high-throughput genomic analysis with Bioconductor. Nat. Methods. 2015; 12:115–121. [DOI] [PMC free article] [PubMed] [Google Scholar]
- 63. Somol P., Novovicova J.. Evaluating stability and comparing output of feature selectors that optimize feature subset cardinality. IEEE Trans. Pattern Anal. Mach. Intell. 2010; 32:1921–1939. [DOI] [PubMed] [Google Scholar]
- 64. Haug K., Cochrane K., Nainala V.C., Williams M., Chang J., Jayaseelan K.V., O’Donovan C.. MetaboLights: a resource evolving in response to the needs of its scientific community. Nucleic Acids Res. 2020; 48:D440–D444. [DOI] [PMC free article] [PubMed] [Google Scholar]
- 65. Song X., Waitman L.R., Hu Y., Yu A.S.L., Robins D., Liu M.. Robust clinical marker identification for diabetic kidney disease with ensemble feature selection. J. Am. Med. Inform. Assoc. 2019; 26:242–253. [DOI] [PMC free article] [PubMed] [Google Scholar]
- 66. Risso D., Ngai J., Speed T.P., Dudoit S.. Normalization of RNA-seq data using factor analysis of control genes or samples. Nat. Biotechnol. 2014; 32:896–902. [DOI] [PMC free article] [PubMed] [Google Scholar]
- 67. Ihaka R., Gentleman R.. R: a language for data analysis and graphics. J. Comput. Graph. Stat. 1995; 5:299–314. [Google Scholar]
- 68. Jia Z. Controlling the overfitting of heritability in genomic selection through cross validation. Sci. Rep. 2017; 7:13678. [DOI] [PMC free article] [PubMed] [Google Scholar]
- 69. Cinelli M., Sun Y., Best K., Heather J.M., Reich-Zeliger S., Shifrut E., Friedman N., Shawe-Taylor J., Chain B.. Feature selection using a one dimensional naive Bayes' classifier increases the accuracy of support vector machine classification of CDR3 repertoires. Bioinformatics. 2017; 33:951–955. [DOI] [PMC free article] [PubMed] [Google Scholar]
- 70. Jiang J., Yin X.Y., Song X.W., Xie D., Xu H.J., Yang J., Sun L.R.. EgoNet identifies differential ego-modules and pathways related to prednisolone resistance in childhood acute lymphoblastic leukemia. Hematology. 2018; 23:221–227. [DOI] [PubMed] [Google Scholar]
- 71. Gillis J., Pavlidis P.. The role of indirect connections in gene networks in predicting function. Bioinformatics. 2011; 27:1860–1866. [DOI] [PMC free article] [PubMed] [Google Scholar]
- 72. Franceschi P., Masuero D., Vrhovsek U., Mattivi F., Wehrens R.. A benchmark spike-in data set for biomarker identification in metabolomics. J. Chemom. 2012; 26:16–24. [Google Scholar]
- 73. Gardinassi L.G., Arevalo-Herrera M., Herrera S., Cordy R.J., Tran V., Smith M.R., Johnson M.S., Chacko B., Liu K.H., Darley-Usmar V.M. et al.. Integrative metabolomics and transcriptomics signatures of clinical tolerance to Plasmodium vivax reveal activation of innate cell immunity and T cell signaling. Redox. Biol. 2018; 17:158–170. [DOI] [PMC free article] [PubMed] [Google Scholar]
- 74. Lee K.J., Yin W., Arafat D., Tang Y., Uppal K., Tran V., Cabrera-Mora M., Lapp S., Moreno A., Meyer E. et al.. Comparative transcriptomics and metabolomics in a Rhesus macaque drug administration study. Front. Cell Dev. Biol. 2014; 2:54. [DOI] [PMC free article] [PubMed] [Google Scholar]
- 75. Sayqal A., Xu Y., Trivedi D.K., AlMasoud N., Ellis D.I., Muhamadali H., Rattray N.J., Webb C., Goodacre R.. Metabolic analysis of the response of Pseudomonas putida DOT-T1E strains to toluene using Fourier transform infrared spectroscopy and gas chromatography mass spectrometry. Metabolomics. 2016; 12:112. [DOI] [PMC free article] [PubMed] [Google Scholar]
- 76. Skarke C., Lahens N.F., Rhoades S.D., Campbell A., Bittinger K., Bailey A., Hoffmann C., Olson R.S., Chen L., Yang G. et al.. A pilot characterization of the human chronobiome. Sci. Rep. 2017; 7:17141. [DOI] [PMC free article] [PubMed] [Google Scholar]
- 77. Peters K., Gorzolka K., Bruelheide H., Neumann S.. Seasonal variation of secondary metabolites in nine different bryophytes. Ecol. Evol. 2018; 8:9105–9117. [DOI] [PMC free article] [PubMed] [Google Scholar]
- 78. Weidt S., Haggarty J., Kean R., Cojocariu C.I., Silcock P.J., Rajendran R., Ramage G., Burgess K.E.. A novel targeted/untargeted GC-Orbitrap metabolomics methodology applied to Candidaalbicans and Staphylococcus aureus biofilms. Metabolomics. 2016; 12:189. [DOI] [PMC free article] [PubMed] [Google Scholar]
- 79. Li B., Tang J., Yang Q., Cui X., Li S., Chen S., Cao Q., Xue W., Chen N., Zhu F.. Performance evaluation and online realization of data-driven normalization methods used in LC/MS based untargeted metabolomics analysis. Sci. Rep. 2016; 6:38881. [DOI] [PMC free article] [PubMed] [Google Scholar]
- 80. Dos Santos R.O., Goncalves-Lopes R.M., Lima N.F., Scopel K.K.G., Ferreira M.U., Lalwani P.. Kynurenine elevation correlates with T regulatory cells increase in acute Plasmodium vivax infection: a pilot study. Parasite Immunol. 2019; 42:e12689. [DOI] [PubMed] [Google Scholar]
- 81. Hunt N.H., Too L.K., Khaw L.T., Guo J., Hee L., Mitchell A.J., Grau G.E., Ball H.J.. The kynurenine pathway and parasitic infections that affect CNS function. Neuropharmacology. 2017; 112:389–398. [DOI] [PubMed] [Google Scholar]
- 82. Kim Y.M., Nowack S., Olsen M.T., Becraft E.D., Wood J.M., Thiel V., Klapper I., Kuhl M., Fredrickson J.K., Bryant D.A. et al.. Diel metabolomics analysis of a hot spring chlorophototrophic microbial mat leads to new hypotheses of community member metabolisms. Front. Microbiol. 2015; 6:209. [DOI] [PMC free article] [PubMed] [Google Scholar]
- 83. Monchgesang S., Strehmel N., Trutschel D., Westphal L., Neumann S., Scheel D.. Plant-to-plant variability in root metabolite profiles of 19 Arabidopsis thaliana accessions is substance-class-dependent. Int. J. Mol. Sci. 2016; 17:E1565. [DOI] [PMC free article] [PubMed] [Google Scholar]
- 84. Lee E.M., Park S.J., Lee J.E., Lee B.M., Shin B.K., Kang D.J., Choi H.K., Kim Y.S., Lee D.Y.. Highly geographical specificity of metabolomic traits among Korean domestic soybeans (Glycine max). Food Res. Int. 2019; 120:12–18. [DOI] [PubMed] [Google Scholar]
- 85. Tang J., Fu J., Wang Y., Luo Y., Yang Q., Li B., Tu G., Hong J., Cui X., Chen Y. et al.. Simultaneous improvement in the precision, accuracy, and robustness of label-free proteome quantification by optimizing data manipulation chains. Mol. Cell. Proteomics. 2019; 18:1683–1699. [DOI] [PMC free article] [PubMed] [Google Scholar]
- 86. Werner A., Broeckling C.D., Prasad A., Peebles C.A.M.. A comprehensive time-course metabolite profiling of the model cyanobacterium Synechocystissp. PCC 6803 under diurnal light:dark cycles. Plant J. 2019; 99:379–388. [DOI] [PubMed] [Google Scholar]
- 87. Tang J., Fu J., Wang Y., Li B., Li Y., Yang Q., Cui X., Hong J., Li X., Chen Y. et al.. ANPELA: analysis and performance assessment of the label-free quantification workflow for metaproteomic studies. Brief. Bioinform. 2019; doi:10.1093/bib/bby127. [DOI] [PMC free article] [PubMed] [Google Scholar]
- 88. Habchi B., Alves S., Jouan-Rimbaud Bouveresse D., Appenzeller B., Paris A., Rutledge D.N., Rathahao-Paris E.. Potential of dynamically harmonized Fourier transform ion cyclotron resonance cell for high-throughput metabolomics fingerprinting: control of data quality. Anal. Bioanal. Chem. 2018; 410:483–490. [DOI] [PubMed] [Google Scholar]
- 89. Attard G., Beltran H.. Prioritizing precision medicine for prostate cancer. Ann. Oncol. 2015; 26:1041–1042. [DOI] [PubMed] [Google Scholar]
- 90. Wang Y., Zhang S., Li F., Zhou Y., Zhang Y., Wang Z., Zhang R., Zhu J., Ren Y., Tan Y. et al.. Therapeutic target database 2020: enriched resource for facilitating research and early development of targeted therapeutics. Nucleic Acids Res. 2020; 48:D1031–D1041. [DOI] [PMC free article] [PubMed] [Google Scholar]
- 91. Lee N.Y., Yoon S.J., Han D.H., Gupta H., Youn G.S., Shin M.J., Ham Y.L., Kwak M.J., Kim B.Y., Yu J.S. et al.. Lactobacillus and Pediococcus ameliorate progression of non-alcoholic fatty liver disease through modulation of the gut microbiome. Gut Microbes. 2020; doi:10.1080/19490976.2020.1712984. [DOI] [PMC free article] [PubMed] [Google Scholar]
- 92. Yin J., Sun W., Li F., Hong J., Li X., Zhou Y., Lu Y., Liu M., Zhang X., Chen N. et al.. VARIDT 1.0: variability of drug transporter database. Nucleic Acids Res. 2020; 48:D1042–D1050. [DOI] [PMC free article] [PubMed] [Google Scholar]
- 93. Xue W., Yang F., Wang P., Zheng G., Chen Y., Yao X., Zhu F.. What contributes to serotonin-norepinephrine reuptake inhibitors' dual-targeting mechanism? The key role of transmembrane domain 6 in human serotonin and norepinephrine transporters revealed by molecular dynamics simulation. ACS Chem. Neurosci. 2018; 9:1128–1140. [DOI] [PubMed] [Google Scholar]
- 94. Gupta H., Youn G.S., Shin M.J., Suk K.T.. Role of gut microbiota in hepatocarcinogenesis. Microorganisms. 2019; 7:E121. [DOI] [PMC free article] [PubMed] [Google Scholar]
Associated Data
This section collects any data citations, data availability statements, or supplementary materials included in this article.