


Abstract
Arm selection, the preferential expression of a 3′ or 5′ mature microRNA (miRNA), is a highly dynamic and tissue-specific process. Time-dependent expression shifts or switches between the arms are also relevant for human diseases. We present miRSwitch, a web server to facilitate the analysis and interpretation of arm selection events. Our species-independent tool evaluates pre-processed small non-coding RNA sequencing (sncRNA-seq) data, i.e. expression matrices or output files from miRNA quantification tools (miRDeep2, miRMaster, sRNAbench). miRSwitch highlights potential changes in the distribution of mature miRNAs from the same precursor. Group comparisons from one or several user-provided annotations (e.g. disease states) are possible. Results can be dynamically adjusted by choosing from a continuous range of highly specific to very sensitive parameters. Users can compare potential arm shifts in the provided data to a human reference map of pre-computed arm shift frequencies. We created this map from 46 tissues and 30 521 samples. As case studies we present novel arm shift information in a Alzheimer’s disease biomarker data set and from a comparison of tissues in Homo sapiens and Mus musculus. In summary, miRSwitch offers a broad range of customized arm switch analyses along with comprehensive visualizations, and is freely available at: https://www.ccb.uni-saarland.de/mirswitch/.
INTRODUCTION
The non-coding parts of mammalian genomes play a major role in shaping the gene regulatory landscape (1,2). Still, these mechanisms are only understood to a limited extent. Among the many different classes of small or long non-coding RNA elements (3), which modulate the expression of genes on a transcriptional or translational level, microRNAs (miRNAs) seem to play a key role (4,5). In the biogenesis of miRNAs, from nascent pri-miRNAs to mature forms, the precursor hairpin molecules are processed by the enzymes DROSHA and DICER (6). The product of the second cleavage is an approximately 22-nucleotide long RNA duplex structure. Frequently, one arm of the RNA duplex is preferentially accumulated while the other is predominantly degraded (7). For most hairpins the dominant mature miRNA is assumed to be the functional product. Gene regulation is carried out by the association of the major form with AGO proteins for RNA-induced silencing complex (RISC) formation and successive binding to reverse complementary target sites in mRNAs, mostly within 3’-untranslated regions (8).
High-throughput data from different tissues (9), aging time-points, developmental stages, and physiological conditions (10,11) indicate, a minor proportion of mature miRNAs from the opposite arm to originate nonetheless. Formerly, these sequences have been denoted as the miR* sequence. Thermodynamic and structural properties have been postulated as drivers for the selection of the dominant arm from the processed duplex (12). Previous work also demonstrates that arm shifts are specific for tissue types and the distribution of the dominant mature and the miR* sequence can change (13,14). For several precursor hairpins, significant quantities of mature miRNAs from both arms are known (15) and both of them are biologically functional. The dominant arm represses translation by means of AGO1 and the miR* sequence by means of AGO2 (16). Currently, miRNAs are not annotated as miR* and dominant mature form anymore but precisely denoted as the −3p and −5p mature miRNA. Beyond these observations, earlier studies describe the process of selective arm switches in multiple pathological conditions (e.g. (17–22)). In 2011, Griffith-Jones et al. found that arm usage is encoded in the primary miRNA sequence, but outside the mature miRNA duplex, by analysing the miR-100/10 family in different species (16). The group also provided evidence for functional shifts in insect miRNA evolution (23). Arm switches have also been correlated to human pathologies such as breast cancer and other severe disorders (18).
Still, a systematic analysis of arm shift or switch events from high-throughput data has not been proposed yet. Here, we introduce miRSwitch, a tool to find differential arm expression from pre-processed high-throughput expression data. In the context of miRSwitch an arm shift is a significant enrichment of the 3′ or 5′ arm in one compared to another condition, while still preserving the identity of the dominant form. An arm switch denotes a more extreme scenario where in one condition either arm is the dominant and vice versa in the other condition. The supported type of input of miRSwitch ranges from expression matrices over result files from common high-throughput tools such as miRDeep2 (24), miRMaster (25) or sRNAbench (26) to prominent data sources like The Cancer Genome Atlas (TCGA). Users can upload annotation files or manually annotate the samples before running an analysis. To provide even further insights into arm shift events we facilitate a comparison to a background (reference) map of curated arm switch events in Homo sapiens. We generated this map from 38 252 human sncRNA-seq data sets comprising 556 billion (5.556 × 10¹¹) reads from 46 different tissues. To demonstrate the functionality of miRSwitch we evaluate an Alzheimer’s disease data set. As second case study, we compare the frequency of arm switches in human and mouse tissues to test the hypothesis whether arm switches might be conserved across species.
MATERIALS AND METHODS
Differential arm expression detection
In a first step, miRNA-precursor pairs of the uploaded expression files are converted to their miRBase v22.1 (27) identifier using the miRBaseConverter R package (28) (v1.10.0). Next, the precursors are filtered, such that only precursors that have a miRBase identifier and two annotated miRNA arms remain. Then, we remove precursors with no miRNA exceeding a user specified threshold for the minimal number of reads. We compute the 5′ − 3′ ratio difference for every precursor in every sample. Statistical significance between two levels of one annotation variable is calculated with the Wilcoxon-rank sum and for three or more levels using a Kruskal-Wallis test. In all cases, P-values are corrected for multiple hypothesis testing using the Benjamini–Hochberg correction for controlling the false discovery rate. For annotation variables with two levels we also compute the area under the receiver operating characteristic curve (AUC) as effect size. Given a precursor with a 5′ miRNA expression value of e5 and a 3′ miRNA expression value of e3, we define e = max(e5, e3) and  as arm ratio. Also, let R be the minimum arm ratio threshold and X be the minimum miRNA reads threshold. Precursors are classified as 5′ dominant in one sample, if a ≥ R and e ≥ X and e5 > e3, 3′ dominant if a ≥ R and e ≥ X and e5 < e3, not dominant if a < R and e ≥ X, and not expressed if e < X. Arm switch candidates can be queried by defining an additional threshold S, requiring 5′ and 3′ dominant precursors in at least S samples.
Web server implementation
We implemented miRSwitch using a dockerized Django Web Framework (v2.2) with a MonetDB database backend (v11.35.19). As job scheduler we used the celery software (v4.3.0). To build a user frontend we used Webpack (v4.41.2) in combination with React JS (v16.12.0), Dev Extreme React Grid (v2.3.2), fornac (v1.1.0), Plotly (v1.51.3), and Highcharts (v7.2.1). The specificity and sensitivity trade-off for potential arm shift/switch candidates can be controlled by adjusting three parameters. These are the minimum arm shift ratio R, the minimal number of samples S where the threshold R needs to be exceeded and the minimal number of reads X of one miRNA arm required to compute the 5′ to 3′ ratio.
Human reference map of differential arm expression
To generate a reference map of human arm shift / switch events we collected 38 252 human sncRNA-seq samples. The data set was compiled from three different sources, the Sequence Read Archive (SRA) (29) (16,415), TCGA (30) (10 999), and samples that were made accessible by anonymous users of miRMaster (25) and who provided consent for aggregated secondary usage (10 838). Subsequently, we removed duplicated data sets that occurred after pooling the SRA and miRMaster samples. All samples were processed as previously described (31). Briefly, samples were mapped against the human genome (hg38) and discarded from further analyses in case less than  of reads could be aligned with Bowtie (v1.1.2) (32) while allowing no mismatches. We also discarded samples for which either at least
  of reads mapped to coding regions or fewer than 1 million total reads were detected. After applying all filtering steps, 30 521 samples remained for consideration. For the samples from SRA, TCGA, and a subset of the miRMaster samples for which annotations were known, the annotation metadata was included in the web server. Other samples for which no tissue annotation was available were labelled as ‘Unknown’. The final map is consistent with the most recent release of miRBase v22.1 and contains 961 human precursors, which are all annotated with two mature forms.
Case studies
To demonstrate the functionality of miRSwitch we performed two case studies; a human liquid biopsy biomarker study and a consideration of arm switches in human compared to mouse tissues. Previously, we obtained sncRNA-seq data from blood of Alzheimer’s disease patients and controls, and validated the data using RT-qPCR (33–35). For 70 samples, reads were mapped and miRNA counts for miRBase v21 entries were quantified using miRDeep2. This case study is linked as example data set on the miRSwitch analysis page. As second case study we investigate arm switch events of the same tissues between mouse and human (doi:10.1101/430561).
RESULTS
In its essence, miRSwitch allows to search for differential miRNA arm expression between any kind of biological condition. In the following, the basic workflow as well as details and examples on the individual steps are described. The results are concluded with two case studies to demonstrate the features on real-world scenarios where new biological insights can be inferred.
Workflow of miRSwitch
The workflow of a miRSwitch analysis entails four steps, (1) the input specification; (2) the main analysis functionality; (3) an optional comparison to the human reference map and (4) the representation and export of results (Figure 1). Each of the steps is described below in more detail. In-depth guidance using illustrated online tutorials as well as video tutorials is accessible from the miRSwitch website.
Figure 1.
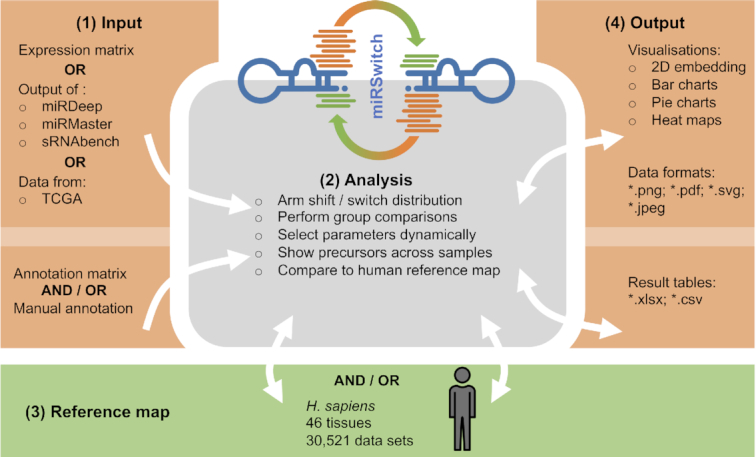
The miRSwitch workflow. miRSwitch consists of four steps (modules), (1) input, (2) miRSwitch analysis core, (3) reference map and (4) output. The arrows denote possible interactions between those. From the input module data are transferred unidirectional to the core module. Between the core and the background map as well as results module bidirectional communication allows to adjust the results dynamically if parameters to define arm switches are changed by the user. All obtained results are easily exportable in common data table formats and plot graphics.
Step 1: Input specification
As the first step, miRSwitch provides a very flexible user interface to transfer data to the server. For example, the user provides miRNA expression data and an annotation matrix file (.csv, .tsv). The expression data can be uploaded either as a expression matrix file or the plain output from common miRNA discovery and quantification tools applied up-stream. The supported pre-processing tools include miRDeep2, miRMaster and sRNAbench. Unmodified data files from TCGA can be uploaded as well. Next, the interface automatically extracts metadata from the uploaded file(s) to be displayed in an interactive sample table. Finally, the user can check and modify any derived annotations. In any case, annotation files are optional and annotation variables can be entered manually instead. Most importantly, the first column is expected to match the sample IDs exactly. In addition to an example study that can be executed from the analysis tab, a template expression matrix and miRDeep2 project files are provided in the tutorial section.
Step 2: Arm expression analysis
From an expression matrix, 5′ and 3′ ratios are computed for each miRNA precursor with two mature forms mapped. Also, the main parameters defining the strength and frequency of arm shift/switch events can be modified. These include the threshold ratio of the 5′ or 3′ arm, the number of reads that have to match to at least one corresponding mature form for each observation and the number of samples that show a respective ratio. Interactive charts and a table of precursors and their classification with respect to the arm dominance are shown on the general analysis page.
Given sample annotations, miRSwitch also performs group comparisons. The user can access the respective results from the ‘Annotation’ tab (for convenience reasons the tab is always named according to the information provided by the user) on the main results page. This tab presents significance values and AUCs for the group comparisons, as well as embeddings of the samples from dimension reduction methods, highlighted according to their group. miRSwitch then computes graphical representations and spreadsheets for all results (see module 4). Since the parameter choice is overall crucial and researchers may want to use their own specific or sensitive parameters to determine whether a miRNA is able to perform an arm switch, we enable real-time parameter selection and filtering of the respective miRNAs in the web interface.
Step 3: Reference map
To provide further insights into arm shifts in H. sapiens we integrated a reference map of arm shift events in different solid tissues and bio fluids. We collected 38,252 sncRNA data sets from three different sources (SRA (29), TCGA (30) and data collected by our tool miRMaster (25)). These data sets contain a total of 556 billion (5.556 × 10¹¹) sequencing reads and can be annotated for 46 different tissue types. After a stringent quality filtering to exclude data with almost no reads mapping to Homo sapiens or containing other sequences but not sncRNAs, a total of 30 521 remained.
Three scenarios from the human reference map demonstrate the importance of the main analysis parameters (cf. Materials and Methods & Results, Step 2). First, to obtain a very specific view, we set the arm ratio of 3′ or 5′ to be at least  , at least one miRNA needs to express 1000 reads and at least 200 experiments have to show a dominant 5′ expression and another 200 a dominant 3′ expression for the mature miRNAs. For this parameter set (80, 1000, 200), 52 precursors that perform an arm switch are identified, with the most variable being hsa-mir-193a, hsa-mir-30e, hsa-let-7d, hsa-mir-144, hsa-mir-361 and hsa-mir-423. If we alter the parameter set to be less specific (70, 500, 100), already 108 precursors with potential arm switches are identified. Finally, we test a very sensitive parameter set (60, 200, 20). Here, miRSwitch reports 256 precursors with potential arm switches.
Step 4: Results representation and export
The fourth module is the representation of results generated by the analysis step (2) or extracted from the reference map in step (3). Generally, three different types of results pages are available. Two of them for user provided input and one for the background map. Additionally, detailed results for individual precursors can be viewed in both modules. If an own data set is evaluated the first tab covers general aspects. Aggregated information on how many samples and which annotations were processed, how many precursors were expressed, and how many reads per sample were available. Bubble plots represent how many miRNAs per annotation on the two arms were found and the arm distribution across samples is shown as heat map. Following this general information the user can adjust the parameters for defining arm shift events. The following bar graphs and tables are adjusted dynamically. Here, users can filter or sort the precursors. From the table, single precursors can be selected and detailed information for these candidates are provided. These include links to external databases (miRBase (27) and miRCarta (15)), the sequence and structure, a pie chart on the arm distribution and detailed distribution per annotation group. All information can be displayed either as percentages or absolute values in the bar diagrams. Finally, the information in which samples the miRNA precursor was expressed on both arms is available as interactive table. Next, the annotation tab contains more details about the comparisons of annotation variables. First, sample embeddings from Uniform Manifold Approximation and Projection (UMAP) (arXiv:1802.03426) and Principal Components Analysis (PCA) (36) of the 5′ − 3′ ratio matrix are provided. Here, color and shape of the points represent the annotation levels for the respective samples. Then, P-values for the difference of the 3′ and 5′ ratio are computed and provided as raw- and adjusted significance values. Another output in the interactive result table that allows sorting and filtering is the AUC value. For each miRNA, the 3′ and 5′ distribution per annotation group is available as dodged violin plot.
Finally, the human reference tab contains all data collected for the background map. The representation is similar to the general results obtained after starting a custom arm ratio analysis. This facilitates an easy comparison. For each precursor, the 5′ and 3′ miRNA expression overall and per tissue are shown. The detailed information for each miRNA precursor is then identical to the results provided by the analysis of own data. Moreover, distribution plots, pie charts and bar charts are computed to get insights into the distribution of the two mature arms of detected precursors. Figure 2 presents a typical example for a 5′ dominant miRNA precursor (mir-142) and a 3′ dominant miRNA precursor (mir-144).
Figure 2.

Example results from the human samples in the background map of arm shift and arm switch events. (A) For hsa-mir-142 the distribution of 3′ dominant, 5′ dominant, no dominance, and not expressed are presented for all samples as bar and pie chart. The same classification is also presented for each tissue. For ileal mucosa or blood, the 5′ form is clearly dominant, for thymus or pleura, the 3′ form dominates. (B) For hsa-mir-144 the 5′ mature form is clearly more abundant as compared to the 3′ form but in several tissues such as the muscle, no form is dominant.
miRSwitch aims to provide broad export flexibility for further down-stream usage. This includes the support of the most relevant image formats covering vector graphics and raster graphics (jpeg, svg, pdf and png). Furthermore detailed result files are also available as spreadsheets. This covers the excel data format as well as the tsv plain text file format.
Case study 1: Alzheimer’s disease
In the first case study we consider previously published sncRNA-seq data from whole-blood samples of Alzheimer’s disease patients and controls. The case study is also provided as example analysis on the miRSwitch homepage. A total of 70 sample files from miRDeep2 are processed in real-time when loading the example and results are available after ∼20 s. As first result the web server reports 2784 miRNAs and 1855 precursors in miRBase v22.1 of which 748 are expressed with at least one read and have two known mature forms. From the annotation metadata the ‘Alzheimer’ and ‘Control’ labels were identified. Using the default parameter set, our tool reports 10 candidates with arm shift and 3′ dominance as well as three candidates with 5′ dominance. Further, the results view indicates that in Alzheimer’s disease fewer 5′ and more 3′ mature miRNAs are expressed as compared to controls (Figure 3A). The heat map points to one potential outlier sample (SRR837506, data not shown). With the parameter set (80, 5, 3), miRSwitch identifies 7 precursors with 3′ dominant arm (mir-340, mir-199b, mir-29c, mir-6859-1, mir-6859-2, mir-6859-3 and mir-6859-4) and one with a 5′ dominant arm (mir-548h-4). For mir-340,  of the samples don’t show an expression,
  do not show a dominant arm,
  are 3′ dominant and
  are 5′ dominant (Figure 3B). Dividing this into the two groups of patients and controls we find that except for one sample all samples with 3′ dominant mir-340 come from Alzheimer’s disease patients while control samples are enriched for 5′ dominant mir-340 expression (Figure 3C). The distribution plot that shows the difference in ratios for controls (left) and patients (right) confirms this on a per sample basis (Figure 3D). Ultimately, the dodged violin distribution plot demonstrates that in case of mir-340 not only an arm shift but an arm switch between the two groups of samples can be observed (Figure 3E).
Figure 3.

Results of the Alzheimer’s disease case study. (A) Bubble plot showing the number of detected mature miRNAs from both arms and for each annotation. (B) Representative pie chart for mir-340 showing in how many samples it is not expressed, shows no arm preference, or is 3′ or 5′ dominant. Plots on the results page are interactive and by hovering over details are displayed. (C) Bar chart that splits the information from the pie chart in panel (B) into the annotation levels. (D) Distribution chart presenting details on the 5′ − 3′ difference for the provided groups of samples, here controls (left) and Alzheimer’s disease patients (right). For the latter, a strong enrichment of the 3′ mature form is visible. (E) Back-to-back distribution of the arm expression in the provided annotation groups. mir-340 is an arm switch miRNA in Alzheimer’s disease. In the disease it displays higher expression of the 3′ arm while in controls the 5′ arm is more abundant.
Case study 2: Arm shift events in M. musculus and H. sapiens
As second case study we analysed miRNAs from a mouse sncRNA tissue atlas (doi:10.1101/430561) to assess the potential (dis-)similarity of arm shifts in mice and human. To this end, we showcase the value of the human reference map feature to perform the species comparison. We restricted the focus to solid organs included in both data sets. For example, mir-141 is 3′ dominant in both species, but a higher expression of the 5′ arm was observed for both organisms in testis. Also, mir-26b was largely 5′ dominant in M. musculus, only the bone marrow showed expression of both arms. Interestingly, also the human data showed this pattern, although with lower 3′ expression ratios. For mir-106b both organism indicated expression of both arms. In this case, however, a dominant 5′ arm in the human heart was not discovered in mouse samples. mir-337 was mostly 3′ dominant. Brain samples of both organisms however indicate an increased 5′ expression. Although the direct comparison of the mouse tissue data set and the human reference map is biased in its nature, since the latter contains three orders of magnitude more samples from different conditions, we found evidence for many human miRNA arm selection events also in the mice.
DISCUSSION
Arm shifts and arm switch events have a high impact in many research scenarios, while possible down-stream effects are still underestimated. For example, previous results demonstrate an altered arm distribution between affected and unaffected individuals. Such events have been observed, e.g. for breast cancer (18), gastric cancer (22) or prostate cancer (37). Also the cause of the differences in arm distribution between cell types, developmental stages, and in diseases have been explored only to a limited extent (38,39). One likely reason that arm switches have been widely neglected so far, is the missing functionality for arm switch tailored analyses in many standard tools, including our own sncRNA-seq analysis tool miRMaster. The primary goal of this work was to make comprehensive arm switch analyses for any kind of experiment like microarrays, high-throughput sequencing, and RT-qPCR data available to a broader research community. Additionally, well interpretable output is delivered back to the user as interactive graphics and tables. Moreover, miRSwitch was designed to scale well with an increasing number of samples. The example provided online (70 samples) is analysed in approximately 20 seconds. We further tested our tool on one of the currently largest sequencing studies, profiling of almost 4,400 miRNA samples from the Parkinson’s Progression Markers Initiative (PPMI) for which the job results were obtained in ∼10 min. Still, one limiting step might be the data upload that heavily depends on the connection quality. Nevertheless, the matrix format is very efficient and can be recommended in case the internet connection transfer rate is a bottleneck.
A challenging task of the custom arm switch analysis functionality is to calculate a measure of accuracy of predicted events. In fact, the accuracy depends on several aspects, for example the quantity and quality of samples provided by the user, or whether candidate arm shifts in the considered scenarios occur frequently or only exist barely. Typically encountered for high-throughput studies, this calls for dedicated validation experiments, either with a second independent high-throughput data set or with a specific low-throughput validation assay. Since this would impose an effort for potential users not to be neglected, we implemented a reference map containing arm switch events for human, as it is currently in the focus of research on differential miRNA arm expression. Here, users can check whether their results have already been discovered in any of the previously screened tissues. We consider the map as on-going effort and which will be developed towards a more complete database of arm shift events. Future extensions should cover three main aspects: First, we will include more samples for H. sapiens to cover more tissues and add data from other sequencing technologies like cPAS Sequencing By Synthesis (40). Second, we will enlarge the set of miRNAs with two annotated forms using novel miRNA candidates. As a third extension we plan to support other organisms, e.g. mouse or rat.
Proper annotation of miRNAs is still a challenging issue. However, not all mature miRNAs might be available in public databases. Several studies pointed out the erroneous nature of many mature miRNAs in miRBase (15,31,41,42). The current human reference map is consistent with miRBase v22.1. We aim to augment this setup by offering three types of miRNA annotations. First, a very specific set could be high-confidence annotations from miRBase. The second one could comprise all annotations from miRBase and the third novel miRNA candidates from other databases, e.g. miRCarta. For the custom analysis functionality, this extension could facilitate the discovery of de novo arm switching events, e.g. in a disease context as demonstrated previously for gastric cancer (43). Another challenge is the underlying technology. It is well known that detection of miRNAs, similar to other non coding RNAs, mRNAs or proteins, varies depending on the experimental techniques and protocols (15,40–42). Most of the data sets used in the reference map stem from Illumina Sequencing By Synthesis instruments, which may show e.g. a ligation bias (44). As a consequence, not all potential arm shift events will be discovered due to respective bias. Secondly, the comparison between the user data set and the uploaded data might be compromised and detected differences might occur due to the difference in technologies. To assess this issue, we plan to grow the reference map further in the directions outlined above, to promote a less biased comparison and evaluation procedure.
In conclusion, we herein present a very comprehensive web server that facilitates the evaluation of arm shift and arm switch events across different species.
DATA AVAILABILITY
miRSwitch is freely available at https://www.ccb.uni-saarland.de/mirswitch. No login is required. The data for the case studies are available from the Gene Expression Omnibus (GEO) under accession numbers GSE46579 and GSE119661.
ACKNOWLEDGEMENTS
We acknowledge the work of the Meese Lab, generating the data set on Alzheimer’s disease.
Contributor Information
Fabian Kern, Chair for Clinical Bioinformatics, Saarland University, 66123 Saarbrücken, Germany.
Jeremy Amand, Chair for Clinical Bioinformatics, Saarland University, 66123 Saarbrücken, Germany.
Ilya Senatorov, Chair for Clinical Bioinformatics, Saarland University, 66123 Saarbrücken, Germany.
Alina Isakova, Department of Bioengineering, Stanford University, Stanford, CA 94305, USA.
Christina Backes, Chair for Clinical Bioinformatics, Saarland University, 66123 Saarbrücken, Germany.
Eckart Meese, Department of Human Genetics, Saarland University, 66421 Homburg, Germany.
Andreas Keller, Chair for Clinical Bioinformatics, Saarland University, 66123 Saarbrücken, Germany; School of Medicine Office, Stanford University, Stanford, CA 94305, USA; Department of Neurology and Neurological Sciences, Stanford University, Stanford, CA 94304, USA.
Tobias Fehlmann, Chair for Clinical Bioinformatics, Saarland University, 66123 Saarbrücken, Germany.
FUNDING
Michael J. Fox foundation [14446]; the development of the miRSwitch resource has been funded by Saarland University and the state government. Funding for open access charge: Michael J. Fox Foundation for Parkinson's Research.
Conflict of interest statement. None declared.
REFERENCES
- 1. Morris K.V., Mattick J.S.. The rise of regulatory RNA. Nat. Rev. Genet. 2014; 15:423–437. [DOI] [PMC free article] [PubMed] [Google Scholar]
- 2. Mattick J.S., Makunin I.V.. Non-coding RNA. Hum. Mol. Genet. 2006; 15:R17–R29. [DOI] [PubMed] [Google Scholar]
- 3. Costa F.F. Non-coding RNAs: Meet thy masters. BioEssays. 2010; 32:599–608. [DOI] [PubMed] [Google Scholar]
- 4. Ambros V. The functions of animal microRNAs. Nature. 2004; 431:350–355. [DOI] [PubMed] [Google Scholar]
- 5. He L., Hannon G.J.. MicroRNAs: Small RNAs with a big role in gene regulation. Nat. Rev. Genet. 2004; 5:522–531. [DOI] [PubMed] [Google Scholar]
- 6. Bartel D.P. MicroRNAs: genomics, biogenesis, mechanism, and function. Cell. 2004; 116:281–297. [DOI] [PubMed] [Google Scholar]
- 7. Hutvagner G. Small RNA asymmetry in RNAi: Function in RISC assembly and gene regulation. FEBS Lett. 2005; 579:5850–5857. [DOI] [PubMed] [Google Scholar]
- 8. Valencia-Sanchez M.A., Liu J., Hannon G.J., Parker R.. Control of translation and mRNA degradation by miRNAs and siRNAs. Gene. Dev. 2006; 20:515–524. [DOI] [PubMed] [Google Scholar]
- 9. Ludwig N., Leidinger P., Becker K., Backes C., Fehlmann T., Pallasch C., Rheinheimer S., Meder B., Stähler C., Meese E. et al.. Distribution of miRNA expression across human tissues. Nucleic Acids Res. 2016; 44:3865–3877. [DOI] [PMC free article] [PubMed] [Google Scholar]
- 10. Keller A., Leidinger P., Bauer A., Elsharawy A., Haas J., Backes C., Wendschlag A., Giese N., Tjaden C., Ott K. et al.. Toward the blood-borne miRNome of human diseases. Nat. Methods. 2011; 8:841–843. [DOI] [PubMed] [Google Scholar]
- 11. Hecksteden A., Leidinger P., Backes C., Rheinheimer S., Pfeiffer M., Ferrauti A., Kellmann M., Sedaghat F., Meder B., Meese E. et al.. miRNAs and sports: Tracking training status and potentially confounding diagnoses. J. Transl. Med. 2016; 14:219. [DOI] [PMC free article] [PubMed] [Google Scholar]
- 12. Meijer H.A., Smith E.M., Bushell M.. Regulation of miRNA strand selection: follow the leader. Biochem. Soc. Trans. 2014; 42:1135–1140. [DOI] [PubMed] [Google Scholar]
- 13. Guo L., Lu Z.. Global expression analysis of miRNA gene cluster and family based on isomiRs from deep sequencing data. Comput. Biol. Chem. 2010; 34:165–171. [DOI] [PubMed] [Google Scholar]
- 14. Kuo W.T., Su M.W., Lee Y.L., Chen C.H., Wu C.W., Fang W.L., Huang K.H., Lin W.C.. Bioinformatic Interrogation of 5p-arm and 3p-arm Specific miRNA Expression Using TCGA Datasets. J. Clin. Med. 2015; 4:1798–1814. [DOI] [PMC free article] [PubMed] [Google Scholar]
- 15. Backes C., Fehlmann T., Kern F., Kehl T., Lenhof H.P., Meese E., Keller A.. MiRCarta: a central repository for collecting miRNA candidates. Nucleic Acids Res. 2018; 46:D160–D167. [DOI] [PMC free article] [PubMed] [Google Scholar]
- 16. Griffiths-Jones S., Hui J.H., Marco A., Ronshaugen M.. MicroRNA evolution by arm switching. EMBO Rep. 2011; 12:172–177. [DOI] [PMC free article] [PubMed] [Google Scholar]
- 17. Lin M.H., Chen Y.Z., Lee M.Y., Weng K.P., Chang H.T., Yu S.Y., Dong B.J., Kuo F.R., Hung L.T., Liu L.F. et al.. Comprehensive identification of microRNA arm selection preference in lung cancer: MiR-324-5p and -3p serve oncogenic functions in lung cancer. Oncol. Lett. 2018; 15:9818–9826. [DOI] [PMC free article] [PubMed] [Google Scholar]
- 18. Tsai K.W., Leung C.M., Lo Y.H., Chen T.W., Chan W.C., Yu S.Y., Tu Y.T., Lam H.C., Li S.C., Ger L.P. et al.. Arm selection preference of MicroRNA-193a varies in breast cancer. Sci. Rep.-UK. 2016; 6:28176. [DOI] [PMC free article] [PubMed] [Google Scholar]
- 19. Guo L., Yu J., Yu H., Zhao Y., Chen S., Xu C., Chen F.. Evolutionary and expression analysis of miR-#-5p and miR-#-3p at the miRNAs/isomiRs levels. Biomed. Res. Int. 2015; 2015:168358. [DOI] [PMC free article] [PubMed] [Google Scholar]
- 20. Hu W., Wang T., Yue E., Zheng S., Xu J.H.. Flexible microRNA arm selection in rice. Biochem. Biophys. Res. Commun. 2014; 447:526–530. [DOI] [PubMed] [Google Scholar]
- 21. Guo L., Zhang H., Zhao Y., Yang S., Chen F.. Selected isomiR expression profiles via arm switching. Gene. 2014; 533:149–155. [DOI] [PubMed] [Google Scholar]
- 22. Li S.C., Liao Y.L., Ho M.R., Tsai K.W., Lai C.H., Lin W.C.. MiRNA arm selection and isomiR distribution in gastric cancer. Ser. Adv. Bioinformatics Computat. Biol. 2012; 13:S13. [DOI] [PMC free article] [PubMed] [Google Scholar]
- 23. Marco A., Hui J.H., Ronshaugen M., Griffiths-Jones S.. Functional shifts in insect microRNA evolution. Genome Biol. Evol. 2010; 2:686–696. [DOI] [PMC free article] [PubMed] [Google Scholar]
- 24. Friedländer M.R., Mackowiak S.D., Li N., Chen W., Rajewsky N.. miRDeep2 accurately identifies known and hundreds of novel microRNA genes in seven animal clades. Nucleic Acids Res. 2011; 40:37–52. [DOI] [PMC free article] [PubMed] [Google Scholar]
- 25. Fehlmann T., Backes C., Kahraman M., Haas J., Ludwig N., Posch A.E., Wurstle M.L., Hubenthal M., Franke A., Meder B. et al.. Web-based NGS data analysis using miRMaster: a large-scale meta-analysis of human miRNAs. Nucleic Acids Res. 2017; 45:8731–8744. [DOI] [PMC free article] [PubMed] [Google Scholar]
- 26. Aparicio-Puerta E., Lebrón R., Rueda A., Gómez-Martín C., Giannoukakos S., Jaspez D., Medina J.M., Zubkovic A., Jurak I., Fromm B. et al.. sRNAbench and sRNAtoolbox 2019: intuitive fast small RNA profiling and differential expression. Nucleic Acids Res. 2019; 47:W530–W535. [DOI] [PMC free article] [PubMed] [Google Scholar]
- 27. Kozomara A., Birgaoanu M., Griffiths-Jones S.. MiRBase: From microRNA sequences to function. Nucleic Acids Res. 2019; 47:D155–D162. [DOI] [PMC free article] [PubMed] [Google Scholar]
- 28. Xu T., Su N., Liu L., Zhang J., Wang H., Zhang W., Gui J., Yu K., Li J., Le T.D.. miRBaseConverter: an R/Bioconductor package for converting and retrieving miRNA name, accession, sequence and family information in different versions of miRBase. BMC Bioinformatics. 2018; 19:514. [DOI] [PMC free article] [PubMed] [Google Scholar]
- 29. Leinonen R., Sugawara H., Shumway M International Nucleotide Sequence Database Collaboration . The Sequence Read Archive. Nucleic Acids Res. 2010; 39:D19–D21. [DOI] [PMC free article] [PubMed] [Google Scholar]
- 30. Weinstein J.N., Collisson E.A., Mills G.B., Shaw K.R., Ozenberger B.A., Ellrott K., Sander C., Stuart J.M., Chang K., Creighton C.J. et al.. The cancer genome atlas pan-cancer analysis project. Nat. Genet. 2013; 45:1113–1120. [DOI] [PMC free article] [PubMed] [Google Scholar]
- 31. Fehlmann T., Backes C., Alles J., Fischer U., Hart M., Kern F., Langseth H., Rounge T., Umu S.U., Kahraman M. et al.. A high-resolution map of the human small non-coding transcriptome. Bioinformatics. 2018; 34:1621–1628. [DOI] [PubMed] [Google Scholar]
- 32. Langmead B. Aligning short sequencing reads with bowtie. Curr. Protoc. Bioinformatics. 2010; doi:10.1002/0471250953.bi1107s32. [DOI] [PMC free article] [PubMed] [Google Scholar]
- 33. Ludwig N., Fehlmann T., Kern F., Gogol M., Maetzler W., Deutscher S., Gurlit S., Schulte C., von Thaler A.K., Deuschle C. et al.. Machine learning to detect Alzheimer’s disease from circulating non-coding RNAs. Genomics Proteomics Bioinformatics. 2019; 17:430–440. [DOI] [PMC free article] [PubMed] [Google Scholar]
- 34. Leidinger P., Backes C., Deutscher S., Schmitt K., Mueller S.C., Frese K., Haas J., Ruprecht K., Paul F., Stähler C. et al.. A blood based 12-miRNA signature of Alzheimer disease patients. Genome Biol. 2013; 14:R78. [DOI] [PMC free article] [PubMed] [Google Scholar]
- 35. Keller A., Backes C., Haas J., Leidinger P., Maetzler W., Deuschle C., Berg D., Ruschil C., Galata V., Ruprecht K. et al.. Validating Alzheimer’s disease micro RNAs using next-generation sequencing. Alzheimer’s Dementia. 2016; 12:565–576. [DOI] [PubMed] [Google Scholar]
- 36. Pearson K. LIII. On lines and planes of closest fit to systems of points in space. Lond. Edinb. Dublin Philos. Mag. J. Sci. 1901; 2:559–572. [Google Scholar]
- 37. Leung C.M., Li S.C., Chen T.W., Ho M.R., Hu L.Y., Liu W.S., Wu T.T., Hsu P.C., Chang H.T., Tsai K.W.. Comprehensive microRNA profiling of prostate cancer cells after ionizing radiation treatment. Oncol. Rep. 2014; 31:1067–1078. [DOI] [PMC free article] [PubMed] [Google Scholar]
- 38. Kang S.M., Choi J.W., Hong S.H., Lee H.J.. Up-regulation of microRNA* strands by their target transcripts. Int. J. Mol. Sci. 2013; 14:13231–13240. [DOI] [PMC free article] [PubMed] [Google Scholar]
- 39. Starega-Roslan J., Galka-Marciniak P., Krzyzosiak W.J.. Nucleotide sequence of miRNA precursor contributes to cleavage site selection by Dicer. Nucleic Acids Res. 2015; 43:10939–10951. [DOI] [PMC free article] [PubMed] [Google Scholar]
- 40. Fehlmann T., Reinheimer S., Geng C., Su X., Drmanac S., Alexeev A., Zhang C., Backes C., Ludwig N., Hart M. et al.. cPAS-based sequencing on the BGISEQ-500 to explore small non-coding RNAs. Clin. Epigenet. 2016; 8:123. [DOI] [PMC free article] [PubMed] [Google Scholar]
- 41. Ludwig N., Becker M., Schumann T., Speer T., Fehlmann T., Keller A., Meese E.. Bias in recent miRBase annotations potentially associated with RNA quality issues. Sci. Rep. 2017; 7:5162. [DOI] [PMC free article] [PubMed] [Google Scholar]
- 42. Backes C., Sedaghat-Hamedani F., Frese K., Hart M., Ludwig N., Meder B., Meese E., Keller A.. Bias in High-Throughput Analysis of miRNAs and Implications for Biomarker Studies. Anal. Chem. 2016; 88:2088–2095. [DOI] [PubMed] [Google Scholar]
- 43. Kuo W.T., Ho M.R., Wu C.W., Fang W.L., Huang K.H., Lin W.C.. Interrogation of MicroRNAs involved in gastric cancer using 5p-arm and 3p-arm annotated MicroRNAs. Anticancer Res. 2015; 35:1345–1352. [PubMed] [Google Scholar]
- 44. Jackson T.J., Spriggs R.V., Burgoyne N.J., Jones C., Willis A.E.. Evaluating bias-reducing protocols for RNA sequencing library preparation. BMC Genomics. 2014; 15:569. [DOI] [PMC free article] [PubMed] [Google Scholar]
Associated Data
This section collects any data citations, data availability statements, or supplementary materials included in this article.
Data Availability Statement
miRSwitch is freely available at https://www.ccb.uni-saarland.de/mirswitch. No login is required. The data for the case studies are available from the Gene Expression Omnibus (GEO) under accession numbers GSE46579 and GSE119661.