Abstract
Genetics data visualization plays an important role in the sharing of knowledge from cancer genome research. Many types of visualization are widely used, most of which are static and require sufficient coding experience to create. Here, we present Oviz-Bio, a web-based platform that provides interactive and real-time visualizations of cancer genomics data. Researchers can interactively explore visual outputs and export high-quality diagrams. Oviz-Bio supports a diverse range of visualizations on common cancer mutation types, including annotation and signatures of small scale mutations, haplotype view and focal clusters of copy number variations, split-reads alignment and heatmap view of structural variations, transcript junction of fusion genes and genomic hotspot of oncovirus integrations. Furthermore, Oviz-Bio allows landscape view to investigate multi-layered data in samples cohort. All Oviz-Bio visual applications are freely available at https://bio.oviz.org/.
INTRODUCTION
The development of sequencing technology has remarkably accelerated human genome research, especially the cancer studies. Rapid increase in sequencing data and innovative methods for their analysis have allowed unprecedented amounts of biological findings in cancer genome research, greatly enriching our understanding of carcinogenesis. These findings helped to innovate many clinical strategies, such as target therapy on hotspot-activated oncogenic mutations and fusions (1–4), synthetic lethality drugs (5), immunotherapy (6) and liquid biopsy for cancer diagnosis (7). Accurate discovery of mutations and comprehensive analysis of large population cohorts are among the key factors behind these achievements.
Well-designed visualization can provide efficient and integrated knowledge sharing, and even shed light on data patterns that could drive further studies. Several visualizations in the genomics field have become heavily relied upon, for instance, Circos (8), landscape view of multi-layered integrated data (9,10), lollipop-diagram for gene-level view of small scale mutations (11,12), genomic view of focal copy number variations (CNV) (13,14), and linkage heatmap of structural variations (SV) (15). However, the creation of these figures requires sufficient programming experience as well as fine-tuning efforts, adding burden to the biological researcher, and prompting the call for some automation. On the other hand, there is as well a call for more interactivity in the created visualizations, as they would greatly aid in the exploration of genetic data, as exemplified by the UCSC genome browser (16) and Integrative Genomics Viewer (17).
Here, we present Oviz-Bio, a web-based platform that provides interactive and real-time online visualization of mutation analyses that are widely utilized in human cancer study. We implemented eleven prevalent analyses of common cancer mutations (Table 1). Interactive diagrams are generated automatically based on user input file (Supplementary Text S1), either in commonly used data formats (VCF, MAF and BED) or our predefined formats (TSV and CSV). Each visualization web page contains various types of interactions, abundant tooltips and a sidebar editor consisting of diverse options. Users can use them to adjust the displaying layout and appearance, switch datasets and query data details. Furthermore, the real-time diagram could be exported as high-quality figure for publication. Oviz-Bio is freely accessible at https://bio.oviz.org/. All documentation and demo files are also available in the GitHub repository (https://github.com/Nobel-Justin/Oviz-Bio-demo).
Table 1.
Six categories of Oviz-Bio visualizations
| Category | Visualization | Input | Major features of output figures |
|---|---|---|---|
| Small scale mutation | Mut on genes | VCF/MAF/CSV | • annotated mutations |
| • three layers (genome, cDNA, protein) | |||
| • zoomable transcript with protein domains | |||
| SNV context | VCF/MAF/TSV | • 3D LEGO display of SNV contexts | |
| • custom region for mutation density | |||
| SNV signature | CSV | • percentage display of SNV contexts | |
| • Cosine Similarity with COSMIC database | |||
| Signature dist | CSV | • signatures distribution in multiple samples | |
| Copy number variation | CNV haplotype view | Patchwork | • haplotype copy numbers along chromosome |
| • normalized coverage and allele imbalance | |||
| CNV focal cluster | GISTIC | • focal CNV with gene annotations | |
| • g-score and q-value plot | |||
| Structural variation | SV reads support | VCF/BAM | • split-reads alignment to SV junction |
| • zoomable reads display with tooltips | |||
| SV heatmap | VCF/BAM | • reads linkage between SV regions | |
| • gene annotations | |||
| Fusion gene | Fusion trans junction | TSV | • fused transcripts with protein domains |
| Oncovirus | Virus Integ HotSpot | CSV | • zoomable integration hotspot regions |
| • gene and genomic repeats annotations | |||
| Integrated diagram | LandScape | CSV | • multi-layered data integrated display |
| • histograms and gene panels | |||
| • additional panels for clinical and metadata |
MATERIALS AND METHODS
Datasets
Oviz-Bio includes a human genome database with both hg19 and hg38 reference versions for cancer mutation analyses. This database contains reference genome sequences, genetic annotations and additional metadata. The reference genome sequences are indexed by SAMtools faidx (18) for front-end real-time querying. The annotation dataset includes information of genes and transcripts, and protein domains from the Ensembl and Pfam database (19,20). The metadata contains lists of the cytobands, non-N region and genome repeats from the UCSC Genome Browser database (21). All metadata files are indexed by tabix for quick querying (22). For easy access to third-party websites, their links are presented in the visualizations, e.g. gene query at GeneCards database (www.genecards.org) (23), mutation signature references at COSMIC database (https://cancer.sanger.ac.uk/cosmic) (24) and domain query at NCBI’s conserved protein domain database (www.ncbi.nlm.nih.gov/cdd) (25).
Web server
Oviz-Bio is constructed with the Ruby on Rails web framework as well as an in-house visualization kernel called Oviz. Oviz is a front-end framework designed for complicated interactive data visualization (https://oviz.org). The main features provided by Oviz include customizable components, auto-layout system, theming system and reactive data binding. It is capable of rendering graphs to various targets, including HTML5 Canvas and Scalable Vector Graphics (SVG). Oviz-Bio runs on a server (CentOS 7.4, 128GB RAM, 60TB HDD) hosted at City University of Hong Kong. Software packages used to support Oviz-Bio operations include: Apache (version 2.4.18, https://httpd.apache.org), Ruby on Rails (version 5.2, https://rubyonrails.org), PostgreSQL (version 9.2.24, www.postgresql.org). The client-side user interface was implemented using HTML5, the Vue framework (http://vuejs.org) for user interface, the Oviz framework (oviz.org) for visualization and other JavaScript libraries.
All the analyses of Oviz-Bio are available free online without any need of registration. A project is automatically created for each browser session. Each session has access to up to 500 MB temporary file storage. The project and files for a session are deleted if the session has been inactive for 24 h; otherwise, they are kept as long as the session remains valid.
RESULTS
Analyses on cancer genomic data
Oviz-Bio currently supports a total of eleven visualization applications for prevalent analyses in human cancer genome study (Table 1). These analyses are grouped into six categories: (i) genetic annotations and signatures of small scale mutations, (ii) haplotype view and focal clusters of CNV, (iii) split-reads alignment and heatmap view of SV, (iv) transcript junction of fusion genes, (v) genomic hotspot of oncovirus integration, (vi) the well-known landscape diagram.
Input can be specified in any of several file formats commonly used in cancer genomics (Supplementary Text S1). For small mutation analysis, the VCF and MAF file formats are supported. Oviz-Bio also accepts as input the outputs of well-known mutation detection tools, such as PatchWork (13) and GISTIC (14) for CNV, SOAPfuse (26) for fusion gene and SvABA (27) for SV. The platform also provides scripts to generate files locally, for the visualizations that requires additional data. For instance, the split-reads and heatmap view of SV both need to extract sequencing reads and coverage from BAM alignment file.
Small scale mutations
Mutation landscape on gene level
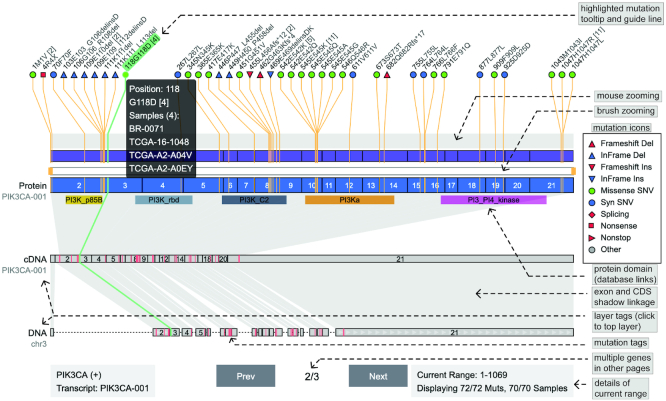
The ‘Mut on Genes’ visualization shows SNVs and InDels with coordinates and function annotations along the gene body (Figure 1) (28,29). Researchers can use this visualization to view the mutational landscape of given genes in cancer samples cohort. There are three layers to display mutations: genome, cDNA and protein. The top layer supports seamless zooming to view densely mutated areas. Mutations of different types and function changes are visualized through the use of colored icons. Coordinates are linked among the three layers to support synchronous highlights of selected mutations or exons. Protein domains are denoted by named color bands with the NCBI CDD database hyperlinks (25). The UI uses tooltips extensively to provide more details of mutations, exons and protein domains. The sidebar contains options for display adjustment, such as changing resolution scales, and switching genes and transcripts. The mutation list of several cancer genes (VHL, PIK3CA and KRAS) are provided for demonstration purpose.
Figure 1.
Demo representation of the ‘Mut On Genes’ visualization and features. Mutations on gene PIK3CA are displayed in three layers (genome, cDNA and protein), which can be switched by clicking layer tags. Mutations are denoted by different icons according to their types and function changes. Icons have tooltips containing related sample list. Exons and mutations are linked among the three layers to support synchronous highlights. Function domains are denoted by colored areas in the protein layer. The mutation list is downloaded from the TumorPortal database (40).
Distribution of SNV contexts
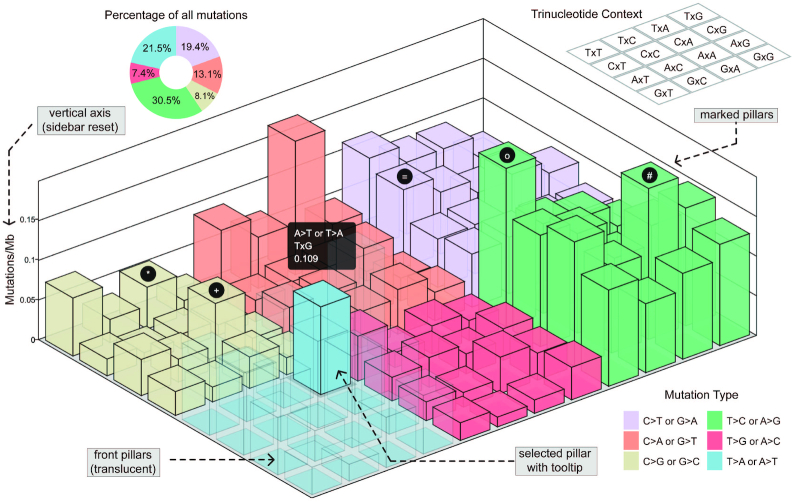
SNV context refers to the bilateral adjacent one-base around the mutated position, which forms a total of 96 possible scenarios. Diverse distribution of somatic SNV contexts has been reported in mutation catalog studies of different cancer types (30–32). Researchers can use the ‘SNV Context’ visualization to view the mutation density of the 96 possible SNV contexts with three-dimensional LEGO design (Figure 2). The input files include the mutation list and an optional BED format custom region file. The mutation density is calculated based on the non-N regions of the human genome (as default) or custom regions. Each LEGO pillar represents a single SNV context, e.g. CxG of ‘A>T or T>A’; the tooltip shows the context content and value. The COSMIC color scheme is applied on the six mutation orientations (24). To help users inspect the pillars hidden at the back, when the mouse pointer hovers one pillar, all pillars in front of it become translucent. The sidebar provides options to switch the vertical axis, reset color and filter mutations. Users can also add a label on the top of the selected LEGO pillar to mark the specific attribute of the relevant SNV context. Demo files with mutation list in VCF and MAF format are provided.
Figure 2.
Demo representation of the ‘SNV context’ visualization and features. Mutation density of totally 96 possible SNV contexts are shown by LEGO pillars which are colored according to six mutation types. The translucent design is applied on all pillars in front of the selected SNV context. Demo labels are added on the top of five pillars. Percentage of six mutation types are denoted by sectors.
Mutation signatures
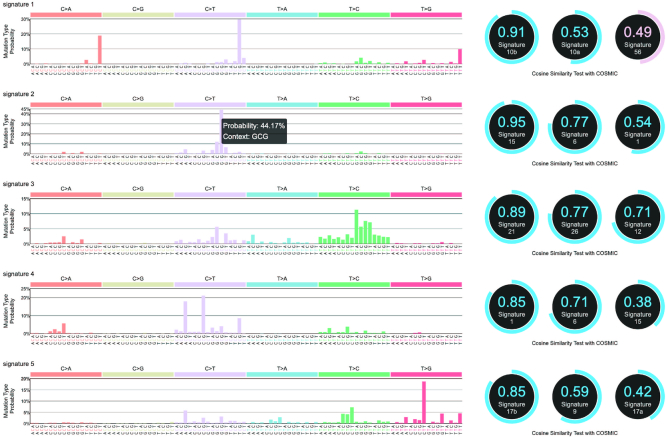
The somatic SNV context is further factorized into the mutation signatures that theoretically correspond to specific mutageneses, such as defective DNA repair and DNA replication infidelity. Many typical mutation signatures have been reported and recorded in the database such as COSMIC (24). Oviz-Bio provides ‘SNV Signature’ and ‘Signature Dist’ to present mutation signature details of single sample and distribution in samples cohort, respectively (Figure 3 and Supplementary Figure S1). In the ‘SNV Signature’ visualization, the Cosine Similarity with COSMIC mutation signature references is calculated, and the three most similar entries are shown with links to the relevant web pages. The ‘Signature Dist’ displays the proportions of each mutation signatures in group samples, and users can reorder the samples in the sidebar. Demo files for both visualizations are provided.
Figure 3.
Demo representation of the ‘SNV Signature’ visualization. Five signatures details are displayed with three most similar entries from COSMIC signature references database (24). Note that, the possible sequencing artifacts in the COSMIC signature references are shown in pink while others in blue.
Copy number variations
Haplotype view of CNV events
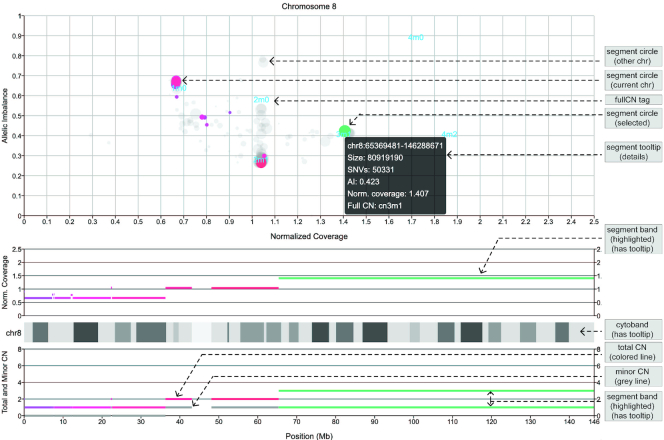
The ‘CNV Haplotype View’ visualization in Oviz-Bio displays haplotype level copy numbers of genomic segments along the chromosome (Figure 4). The visual layout reproduces the final graphical output of Patchwork with interactive features (13). The page shows copy number data of a single chromosome which can be switched in the sidebar. We use three coordinate systems to present the genomic segment information. The first one displays segments with coordinates of allele imbalance and normalized coverage. Segments are represented by circles with a radius proportional to the genomic region size. The other two coordinate systems demonstrate the normalized coverage and copy number of segment bands shown along the chromosome, respectively. The total and minor copy numbers are shown separately. The circle and band of each genomic segment are linked together across the three coordinate systems, so that they can be synchronously highlighted. The tooltips provide more details of the segments, such as genomic interval, heterozygous SNV counts and allele imbalance. A demo file from the Patchwork analysis of one cancer sample is provided.
Figure 4.
Demo representation of the ‘CNV Haplotype View’ visualization. Segments of chromosome 8 are displayed with heterozygous allelic imbalance, normalized coverage and minor/total copy numbers, from Patchwork result (13). Colored circles in top coordinate system represent genomic segments on current chromosome, and grays are from other chromosomes. Positions of ‘fullCN’ tags are calculated from weighted average coordinates of relevant circles. Interactive tooltip and highlights show more information. The ‘fullCN’ represents the total copy number and the minor copy number together.
Focal CNV
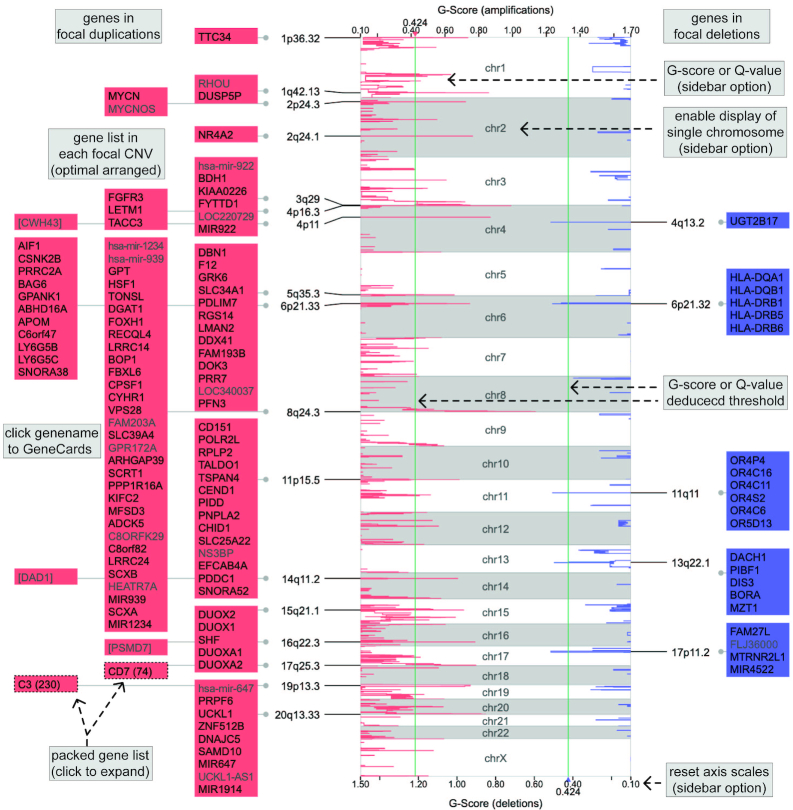
The ‘CNV Focal Cluster’ visualization (Figure 5) is developed to illustratethe results from GISTIC (14), which provides confident localization of focal somatic CNVs across a batch of cancer samples. This visual design reproduces the graphical output of GISTIC. Researchers can use this visualization to systematically examine genes located in focal CNVs. It requires three input files: the GISTIC score (G-score) file, and two list files of significant amplificated and deleted genes. The G-scores are plotted along the chromosomes with green lines representing the cut-off. The focal CNVs are denoted by cytobands and gene blocks, which are arranged bilaterally for amplifications and deletions, respectively. We append the GeneCards database hyperlink to each gene symbol (23). The sidebar provides options to reset axis scales, switch to Q-value plot, and enable the single chromosome view (Supplementary Figure S2). Demo files from the GISTIC analysis of cancer samples cohort are provided.
Figure 5.
Demo representation of the ‘CNV Focal Cluster’ visualization. G-scores of genomic segments are plotted along chromosomes, red for amplifications and blue for deletions. Significant focal CNVs are denoted by cytobands and gene lists shown bilaterally. The cut-off is represented by green line. Gene symbols are appended with hyperlinks to the GeneCards database web page. Some gene lists are packed due to too many gene symbols to display. Sidebar provides options to plot Q-value and reset axis scales.
Structural variations
Split-reads alignment of SV events
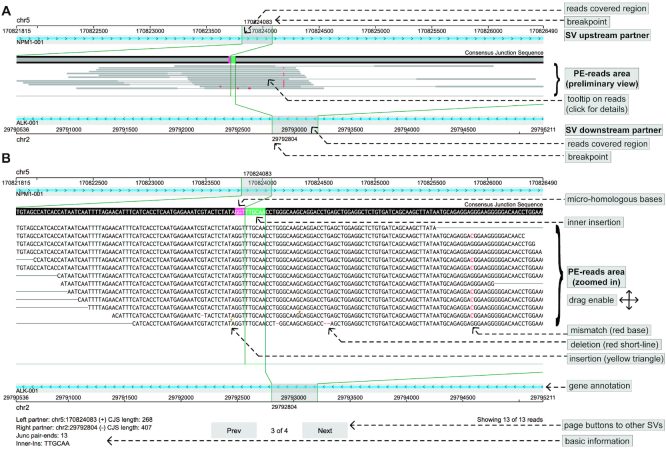
The ‘SV Reads Support’ visualization in Oviz-Bio is for examining how SV can be detected from sequencing reads (Figure 6). Researchers can use this visualization to evaluate the credibility of SV events. A script is provided to extract SV paired-ends from BAM alignment according to the VCF format result of SvABA (27). The top layer displays the consensus junction sequence (CJS), which bilaterally extends to SV genomic regions covered by the supporting reads. The split-reads and the paired ends are aligned base-by-base to the CJS, with small alteration marked, including SNVs and InDels. Similar to the tview function of SAMtools (18), reads sequence can be colored according to the base quality. Micro-homologous bases and inner insertion are also shown at the junction site. Users can drag and zoom in to examine the details of paired-end reads. Additional information, such as the mapped position and small alterations, are provided as tooltips. The upstream and downstream SV genomic regions are shown with local genes at the top and bottom tracks, respectively. The sidebar provides options to sort reads, select genes, show base quality and switch SV cases. Demo input for SV events of well-known fusion genes are provided.
Figure 6.
Demo representation of the ‘SV Reads Support’ visualization. The SV forming fusion NPM1-ALK is displayed with sequencing reads support in (A) preliminary and (B) zoomed in view, respectively. The local genomic regions and gene annotations of the upstream and downstream partners are arranged at top and bottom tracks, respectively. Split-reads and the paired ends are aligned base-by-base to the CJS shown at the top of sequencing reads area. Paired-ends are sorted by positions of split-reads. Micro-homologous bases (in pink) and inner insertion (in green) at the SV junction site are marked on the CJS. Different alteration types on reads are marked: red base for mismatch, red short-line for deletion and yellow triangle for insertion.
Linkage heatmap of SV events
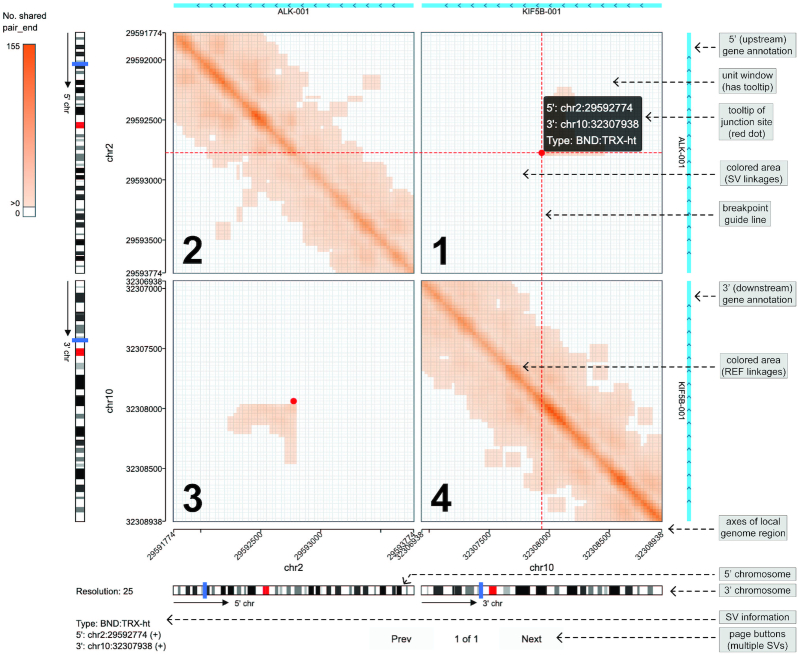
Linkage heatmap is a useful method to visualize diverse SV patterns. We develop the ‘SV Heatmap’ visualization to display the heatmap matrix based on sequencing reads linkage between rearranged genomic regions (Figure 7). A provided script allows users to calculate linkages of paired-end reads and 10× linked-reads barcodes from BAM alignment and SvABA results. The SV local genomic intervals are binned and arranged sequentially to form four quadrants of the linkage heatmap. The first and third quadrants symmetrically show the cross-linkages between SV partners. The second and fourth quadrants display the inner-linkages. The depth of the colors in the heatmap is proportional to the linkage value. Gene annotation information is shown at the top and right side of the heatmap matrix. The sidebar provides options to adjust color scheme, select transcripts and switch SV events. We have prepared demo input for different SV types (Supplementary Figures S3 and 4), including deletion, tandem duplication, translocation and inversion.
Figure 7.
Demo representation of the ‘SV Heatmap’ visualization. The SV forming fusion KIF5B-ALK is displayed by heatmap linkages of paired-end reads that map to the rearranged (SV) and reference (REF) alleles. Junction site is denoted by red dot with guiding lines pointing to the SV breakpoints on the genome axes. The four quadrants are marked by number at the bottom left. Chromosomes are shown with blue blocks representing local genomic regions of the 5-prime and 3-prime SV partners respectively. Gene annotations are shown at the top and right sides.
Fusion gene
Fusion genes are chimeric transcripts consisting of two or more previously separate genes, and is commonly formed by genome rearrangements or read-through transcriptions. We implement the ‘Fusion Trans Junction’ visualization to show the whole structure of the chimeric transcript (Supplementary Figure S5). The reference transcript of each fusion partner is displayed with exons in the top layer. The transcript breakpoint is labeled by the genomic position and linked by a guiding line which connects the fusion junction in the lower layer. The fusion junction contains the exons from the reference transcript according to the extending size. Protein domain is represented using a color band with the fusion junction. In the sidebar, users can select transcripts, reset the extending size and enable the simplified mode. We have prepared demo input of several typical fusion genes.
Hotspot of oncovirus integrations
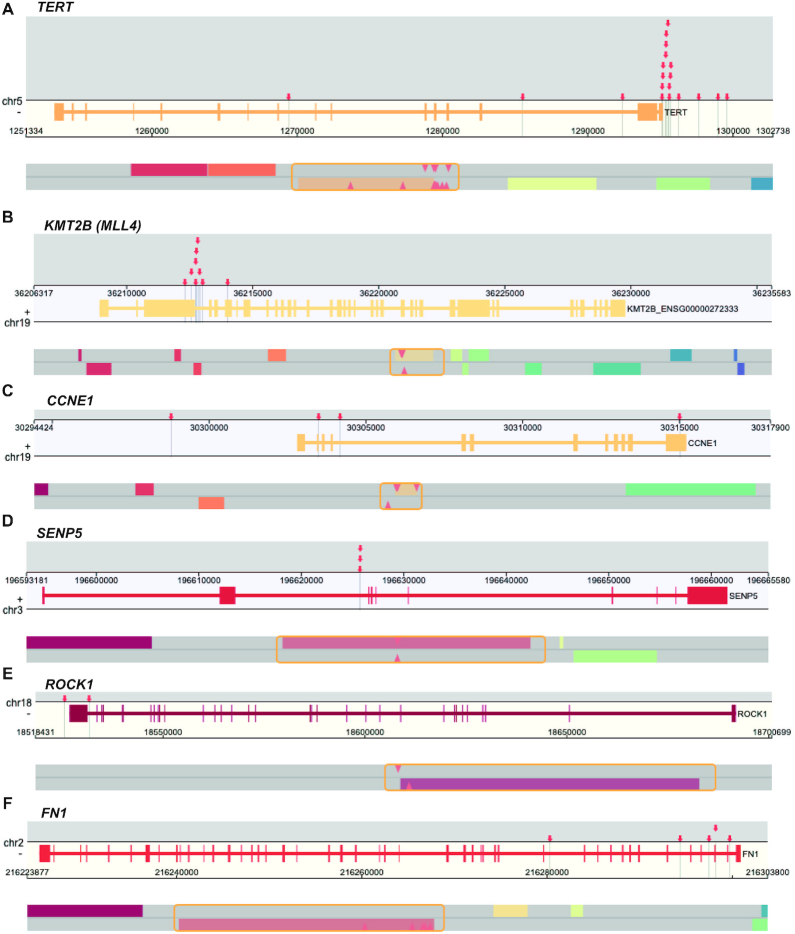
Oncoviruses have been found to integrate into the host genome, such as human papillomavirus (HPV) in cervical carcinoma and hepatitis B virus (HBV) in liver cancer. Such integrations could induce host genome instability and increase cancer risk. Many integration hotspot genes have been reported in oncovirus studies (33,34). The ‘Virus Integ HotSpot’ module in Oviz-Bio is developed to enable visualization of oncovirus integration hotspots of group samples in a genome-browser-liked view (Figure 8). The input file specifies common information of viral integrations, such as sample-ID, genomic position, junction orientation and count of split-reads. Oviz-Bio automatically calculates the hotspot genomic regions to group integrations within given interval size which can be adjusted in the sidebar. We require that each hotspot region to cover integrations from at least two samples. In the view for each hotspot, integrations are denoted by red arrows with guiding lines pointing to the gene annotation track below. The main annotation track contains two layers that show genes from positive and negative sense strands, respectively. Tooltips are available for integration arrows, gene bodies and exons. The bottom layer is a zoomable minimap for sub-region details. The minimap incorporates genes and arrows within a strand-specific layer. We also provide a metadata annotation track to show genome repeats (Supplementary Figure S6). The sidebar provides options to select integrations and genes, show the left-out sites, reset interval size and unify integrations. We have prepared demo input files for both HBV and HPV hotspots from earlier oncovirus studies (33,34).
Figure 8.
Demo representation of the ‘Virus Integ HotSpot’ visualization. Six HBV integration hotspot genes are from published hepatocellular carcinoma study (34). (A) TERT. (B) KMT2B (alias MLL4). (C) CCNE1. (D) SENP5. (E) ROCK1. (F) FN1. HBV integrations are denoted by red arrows with tooltips. Each gene view is zoomed into the local genomic region represented by draggable frame (orange) in the minimap, and only the relevant strand track is remained for conciseness.
Integrative landscape visualization
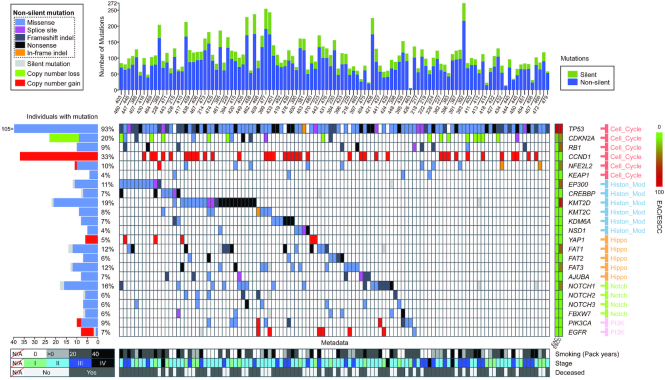
It is common practice to compare multi-layered attributes among cancer samples, such as alteration counts, significantly mutated genes and clinical data. To facilitate such comparison, Oviz-Bio provides a ‘LandScape’ visualization, which provides some of the most widely applied comparisons in cancer studies (Figure 9) (35,36). The input file is to specify a table which record samples and attributes in its rows and columns, respectively. The ‘LandScape’ view contains fixed and additional parts that are stacked vertically with each column representing a sample. The fixed part includes the histogram panel and the mutated gene panel as the basic structure. The histogram by default shows the density of different annotated mutation types. Additional data, such as the mutation frequency, gene pathway and the Q-values of significantly mutated genes, are shown on the left and the right side of the gene panel. The additional part consists of custom panels, which are commonly used to show clinical data, mutated pathways and sample metadata. The sidebar provides options to reorder samples and genes, define mutation category, group attributes and set colors. Demo input based on data from several cancer studies are provided (9,11,33,35–37).
Figure 9.
Demo representation of the ‘LandScape’ visualization. This figure displays landscape data from published esophageal carcinoma study (9). Samples in vertical columns are arranged in gene waterfall mode starting from the EP300 gene. The waterfall mode is always applied for illustration of mutually exclusivity and co-occurrence of mutated genes. The mutation counts are shown in histogram. Mutated genes are denoted by colors corresponding to mutation types. The mutation sample frequency, comments and pathway of genes are shown at bilateral sides of the gene-panel. Metadata panel shows the key clinicopathological characteristics.
DISCUSSION
Genetic data visualization not only plays important role in communicating scientific results, but also act as investigative tools for data exploration. We have developed Oviz-Bio, a web-based platform that provides interactive and real-time cancer genomic data visualizations with a user-friendly graphical interface. Oviz-Bio offers plenty of options to customize the visualization and does not require users to have rich programming experience. We have implemented a series of applications on various mutation types commonly analysed in cancer study, including small scale mutations (SNV and InDel), segmental alterations (CNV and SV), fusion gene and oncovirus integration. In addition, our platform includes the interactive landscape diagram for multi-layered attributes comparison and mutation pattern analysis of cancer samples. All visualizations have detailed documentation and demo input files. Users can also export the visualizations into figures for publication.
Popular online tools focusing on cancer genetic data presentation include cBioPortal (38), OncoPrinter, MutationMapper and MuSiCa (39). cBioPortal is a database-driven web portal of published cancer genomic datasets. It shows data categorized into multiple sections by using tables and charts, and also provides tools for visualizing summarized data (OncoPrinter) and mutation annotations (MutationMapper). Oviz-Bio, on the other hand, is a visualization-first platform that focuses on providing quick and highly customizable interactive visualizations. Powered by the Oviz framework, Oviz-Bio allows more exploratory functions through the use of tooltips, zoom-in and other options. For instance, while both OncoPrinter and Oviz-Bio ‘LandScape’ display genomic and clinical data simultaneously, ‘LandScape’ has the ability to sort samples according to user-specified criteria. Moreover, ‘LandScape’ provides more graphical elements, such as stacked histograms, pathway annotation in gene panel, data interval partition, attributes group and color palettes. As another example, while both MutationMapper and Oviz-Bio ‘Mut On Genes’ display annotated mutations along the gene body with protein domains, ‘Mut On Genes’ could furthermore show mutations on cDNA and genome layer. MuSiCa provides the signature calculation and samples clustering. Oviz-Bio will include these functions in future versions. The ‘SNV Context’ displays the mutational profile in LEGO style, and further filters mutations based on custom region and criteria. Recently, the Clinical Proteomics Tumor Analysis Consortium (CPTAC) has developed a couple of online visualization tools for cancer proteogenomics research. The ProTrack helps users to check multi-omic data in an interactive browser. The ProNetView-ccRCC provides a web-based portal to interactively explore pathway-enriched modules in proteogenomics networks and associations with clinical data. In addition, Oviz-Bio is able to display a more diverse set of graphs, such as the haplotype CNV view, split-reads alignment and linkage heatmap of SV, therefore providing a one-stop solution for cancer genomics mutation visualization.
We plan to enhance Oviz-Bio iteratively in our future work to maintain the platform's relevance. The back-end database will be strengthened with more annotations, such as cancer gene census, dbSNP, OncoKB and cancer hotspots. More interactions will be implemented to improve user experience, including genomic region zooming in CNV haplotype view and displaying of RNA-seq data in SV split-reads alignment view. Enhancements in the backend algorithms could improve data investigations, for instance, prediction of the fusion peptide coding frame, samples hierarchical clustering based on mutation signatures and statistic calculation of mutual exclusion and co-occurrence of mutated genes. The Oviz-Bio web-frame and visualizer kernel will also be continuously upgraded to support the development of new applications and improve user experience.
Supplementary Material
ACKNOWLEDGEMENTS
We thank Dr Yen Kaow Ng for manuscript revision.
Contributor Information
Wenlong Jia, Department of Computer Science, City University of Hong Kong, Kowloon Tong 999077, Hong Kong.
Hechen Li, Department of Computer Science, City University of Hong Kong, Kowloon Tong 999077, Hong Kong.
Shiying Li, Department of Computer Science, City University of Hong Kong, Kowloon Tong 999077, Hong Kong.
Lingxi Chen, Department of Computer Science, City University of Hong Kong, Kowloon Tong 999077, Hong Kong.
Shuai Cheng Li, Department of Computer Science, City University of Hong Kong, Kowloon Tong 999077, Hong Kong; Department of Biomedical Engineering, City University of Hong Kong, Kowloon Tong 999077, Hong Kong.
SUPPLEMENTARY DATA
Supplementary Data are available at NAR Online.
FUNDING
University Grants Committee (UGC) [General Research Fund (GRF) 9042348 (CityU 11257316)]. Funding for open access charge: UGC [GRF 9042348 (CityU 11257316)].
Conflict of interest statement. None declared.
REFERENCES
- 1. Kobayashi S., Boggon T.J., Dayaram T., Janne P.A., Kocher O., Meyerson M., Johnson B.E., Eck M.J., Tenen D.G., Halmos B.. EGFR mutation and resistance of non-small-cell lung cancer to gefitinib. N. Engl. J. Med. 2005; 352:786–792. [DOI] [PubMed] [Google Scholar]
- 2. Bollag G., Tsai J., Zhang J., Zhang C., Ibrahim P., Nolop K., Hirth P.. Vemurafenib: the first drug approved for BRAF-mutant cancer. Nat. Rev. Drug Discov. 2012; 11:873–886. [DOI] [PubMed] [Google Scholar]
- 3. Solomon B.J., Mok T., Kim D.W., Wu Y.L., Nakagawa K., Mekhail T., Felip E., Cappuzzo F., Paolini J., Usari T. et al.. First-line crizotinib versus chemotherapy in ALK-positive lung cancer. N. Engl. J. Med. 2014; 371:2167–2177. [DOI] [PubMed] [Google Scholar]
- 4. Cocco E., Scaltriti M., Drilon A.. NTRK fusion-positive cancers and TRK inhibitor therapy. Nat. Rev. Clin. Oncol. 2018; 15:731–747. [DOI] [PMC free article] [PubMed] [Google Scholar]
- 5. Lord C.J., Ashworth A.. PARP inhibitors: synthetic lethality in the clinic. Science. 2017; 355:1152–1158. [DOI] [PMC free article] [PubMed] [Google Scholar]
- 6. Iwai Y., Ishida M., Tanaka Y., Okazaki T., Honjo T., Minato N.. Involvement of PD-L1 on tumor cells in the escape from host immune system and tumor immunotherapy by PD-L1 blockade. Proc. Natl. Acad. Sci. U.S.A. 2002; 99:12293–12297. [DOI] [PMC free article] [PubMed] [Google Scholar]
- 7. Thierry A.R., Mouliere F., El Messaoudi S., Mollevi C., Lopez-Crapez E., Rolet F., Gillet B., Gongora C., Dechelotte P., Robert B. et al.. Clinical validation of the detection of KRAS and BRAF mutations from circulating tumor DNA. Nat. Med. 2014; 20:430–435. [DOI] [PubMed] [Google Scholar]
- 8. Krzywinski M., Schein J., Birol I., Connors J., Gascoyne R., Horsman D., Jones S.J., Marra M.A.. Circos: an information aesthetic for comparative genomics. Genome Res. 2009; 19:1639–1645. [DOI] [PMC free article] [PubMed] [Google Scholar]
- 9. Gao Y.B., Chen Z.L., Li J.G., Hu X.D., Shi X.J., Sun Z.M., Zhang F., Zhao Z.R., Li Z.T., Liu Z.Y. et al.. Genetic landscape of esophageal squamous cell carcinoma. Nat. Genet. 2014; 46:1097–1102. [DOI] [PubMed] [Google Scholar]
- 10. Ojesina A.I., Lichtenstein L., Freeman S.S., Pedamallu C.S., Imaz-Rosshandler I., Pugh T.J., Cherniack A.D., Ambrogio L., Cibulskis K., Bertelsen B. et al.. Landscape of genomic alterations in cervical carcinomas. Nature. 2014; 506:371–375. [DOI] [PMC free article] [PubMed] [Google Scholar]
- 11. Guo G., Sun X., Chen C., Wu S., Huang P., Li Z., Dean M., Huang Y., Jia W., Zhou Q. et al.. Whole-genome and whole-exome sequencing of bladder cancer identifies frequent alterations in genes involved in sister chromatid cohesion and segregation. Nat. Genet. 2013; 45:1459–1463. [DOI] [PMC free article] [PubMed] [Google Scholar]
- 12. Li X., Wu W.K., Xing R., Wong S.H., Liu Y., Fang X., Zhang Y., Wang M., Wang J., Li L. et al.. Distinct subtypes of gastric cancer defined by molecular characterization include novel mutational signatures with prognostic capability. Cancer Res. 2016; 76:1724–1732. [DOI] [PubMed] [Google Scholar]
- 13. Mayrhofer M., DiLorenzo S., Isaksson A.. Patchwork: allele-specific copy number analysis of whole-genome sequenced tumor tissue. Genome Biol. 2013; 14:R24. [DOI] [PMC free article] [PubMed] [Google Scholar]
- 14. Mermel C.H., Schumacher S.E., Hill B., Meyerson M.L., Beroukhim R., Getz G.. GISTIC2.0 facilitates sensitive and confident localization of the targets of focal somatic copy-number alteration in human cancers. Genome Biol. 2011; 12:R41. [DOI] [PMC free article] [PubMed] [Google Scholar]
- 15. Spies N., Weng Z., Bishara A., McDaniel J., Catoe D., Zook J.M., Salit M., West R.B., Batzoglou S., Sidow A.. Genome-wide reconstruction of complex structural variants using read clouds. Nat. Methods. 2017; 14:915–920. [DOI] [PMC free article] [PubMed] [Google Scholar]
- 16. Kent W.J., Sugnet C.W., Furey T.S., Roskin K.M., Pringle T.H., Zahler A.M., Haussler D.. The human genome browser at UCSC. Genome Res. 2002; 12:996–1006. [DOI] [PMC free article] [PubMed] [Google Scholar]
- 17. Thorvaldsdottir H., Robinson J.T., Mesirov J.P.. Integrative Genomics Viewer (IGV): high-performance genomics data visualization and exploration. Brief. Bioinform. 2013; 14:178–192. [DOI] [PMC free article] [PubMed] [Google Scholar]
- 18. Li H., Handsaker B., Wysoker A., Fennell T., Ruan J., Homer N., Marth G., Abecasis G., Durbin R. 1000 Genome Project Data Processing Subgroup . The sequence alignment/map format and SAMtools. Bioinformatics. 2009; 25:2078–2079. [DOI] [PMC free article] [PubMed] [Google Scholar]
- 19. Cunningham F., Achuthan P., Akanni W., Allen J., Amode M.R., Armean I.M., Bennett R., Bhai J., Billis K., Boddu S. et al.. Ensembl 2019. Nucleic Acids Res. 2019; 47:D745–D751. [DOI] [PMC free article] [PubMed] [Google Scholar]
- 20. El-Gebali S., Mistry J., Bateman A., Eddy S.R., Luciani A., Potter S.C., Qureshi M., Richardson L.J., Salazar G.A., Smart A. et al.. The Pfam protein families database in 2019. Nucleic Acids Res. 2019; 47:D427–D432. [DOI] [PMC free article] [PubMed] [Google Scholar]
- 21. Haeussler M., Zweig A.S., Tyner C., Speir M.L., Rosenbloom K.R., Raney B.J., Lee C.M., Lee B.T., Hinrichs A.S., Gonzalez J.N. et al.. The UCSC genome browser database: 2019 update. Nucleic Acids Res. 2019; 47:D853–D858. [DOI] [PMC free article] [PubMed] [Google Scholar]
- 22. Li H. Tabix: fast retrieval of sequence features from generic TAB-delimited files. Bioinformatics. 2011; 27:718–719. [DOI] [PMC free article] [PubMed] [Google Scholar]
- 23. Safran M., Dalah I., Alexander J., Rosen N., Iny Stein T., Shmoish M., Nativ N., Bahir I., Doniger T., Krug H. et al.. GeneCards Version 3: the human gene integrator. Database (Oxford). 2010; 2010:baq020. [DOI] [PMC free article] [PubMed] [Google Scholar]
- 24. Tate J.G., Bamford S., Jubb H.C., Sondka Z., Beare D.M., Bindal N., Boutselakis H., Cole C.G., Creatore C., Dawson E. et al.. COSMIC: the Catalogue Of Somatic Mutations In Cancer. Nucleic Acids Res. 2019; 47:D941–D947. [DOI] [PMC free article] [PubMed] [Google Scholar]
- 25. Marchler-Bauer A., Derbyshire M.K., Gonzales N.R., Lu S., Chitsaz F., Geer L.Y., Geer R.C., He J., Gwadz M., Hurwitz D.I. et al.. CDD: NCBI’s conserved domain database. Nucleic Acids Res. 2015; 43:D222–D226. [DOI] [PMC free article] [PubMed] [Google Scholar]
- 26. Jia W., Qiu K., He M., Song P., Zhou Q., Zhou F., Yu Y., Zhu D., Nickerson M.L., Wan S. et al.. SOAPfuse: an algorithm for identifying fusion transcripts from paired-end RNA-Seq data. Genome Biol. 2013; 14:R12. [DOI] [PMC free article] [PubMed] [Google Scholar]
- 27. Wala J.A., Bandopadhayay P., Greenwald N.F., O’Rourke R., Sharpe T., Stewart C., Schumacher S., Li Y., Weischenfeldt J., Yao X. et al.. SvABA: genome-wide detection of structural variants and indels by local assembly. Genome Res. 2018; 28:581–591. [DOI] [PMC free article] [PubMed] [Google Scholar]
- 28. Brennan C.W., Verhaak R.G., McKenna A., Campos B., Noushmehr H., Salama S.R., Zheng S., Chakravarty D., Sanborn J.Z., Berman S.H. et al.. The somatic genomic landscape of glioblastoma. Cell. 2013; 155:462–477. [DOI] [PMC free article] [PubMed] [Google Scholar]
- 29. Lin D.C., Hao J.J., Nagata Y., Xu L., Shang L., Meng X., Sato Y., Okuno Y., Varela A.M., Ding L.W. et al.. Genomic and molecular characterization of esophageal squamous cell carcinoma. Nat. Genet. 2014; 46:467–473. [DOI] [PMC free article] [PubMed] [Google Scholar]
- 30. Dulak A.M., Stojanov P., Peng S., Lawrence M.S., Fox C., Stewart C., Bandla S., Imamura Y., Schumacher S.E., Shefler E. et al.. Exome and whole-genome sequencing of esophageal adenocarcinoma identifies recurrent driver events and mutational complexity. Nat. Genet. 2013; 45:478–486. [DOI] [PMC free article] [PubMed] [Google Scholar]
- 31. Scelo G., Riazalhosseini Y., Greger L., Letourneau L., Gonzalez-Porta M., Wozniak M.B., Bourgey M., Harnden P., Egevad L., Jackson S.M. et al.. Variation in genomic landscape of clear cell renal cell carcinoma across Europe. Nat. Commun. 2014; 5:5135. [DOI] [PubMed] [Google Scholar]
- 32. Cancer Genome Atlas Network Genomic classification of cutaneous melanoma. Cell. 2015; 161:1681–1696. [DOI] [PMC free article] [PubMed] [Google Scholar]
- 33. Hu Z., Zhu D., Wang W., Li W., Jia W., Zeng X., Ding W., Yu L., Wang X., Wang L. et al.. Genome-wide profiling of HPV integration in cervical cancer identifies clustered genomic hot spots and a potential microhomology-mediated integration mechanism. Nat. Genet. 2015; 47:158–163. [DOI] [PubMed] [Google Scholar]
- 34. Sung W.K., Zheng H., Li S., Chen R., Liu X., Li Y., Lee N.P., Lee W.H., Ariyaratne P.N., Tennakoon C. et al.. Genome-wide survey of recurrent HBV integration in hepatocellular carcinoma. Nat. Genet. 2012; 44:765–769. [DOI] [PubMed] [Google Scholar]
- 35. Cancer Genome Atlas Research Network Comprehensive genomic characterization of squamous cell lung cancers. Nature. 2012; 489:519–525. [DOI] [PMC free article] [PubMed] [Google Scholar]
- 36. George J., Lim J.S., Jang S.J., Cun Y., Ozretic L., Kong G., Leenders F., Lu X., Fernandez-Cuesta L., Bosco G. et al.. Comprehensive genomic profiles of small cell lung cancer. Nature. 2015; 524:47–53. [DOI] [PMC free article] [PubMed] [Google Scholar]
- 37. Cancer Genome Atlas Research, N Integrated genomic and molecular characterization of cervical cancer. Nature. 2017; 543:378–384. [DOI] [PMC free article] [PubMed] [Google Scholar]
- 38. Gao J., Aksoy B.A., Dogrusoz U., Dresdner G., Gross B., Sumer S.O., Sun Y., Jacobsen A., Sinha R., Larsson E. et al.. Integrative analysis of complex cancer genomics and clinical profiles using the cBioPortal. Sci. Signal. 2013; 6:pl1. [DOI] [PMC free article] [PubMed] [Google Scholar]
- 39. Diaz-Gay M., Vila-Casadesus M., Franch-Exposito S., Hernandez-Illan E., Lozano J.J., Castellvi-Bel S.. Mutational signatures in cancer (MuSiCa): a web application to implement mutational signatures analysis in cancer samples. BMC Bioinformatics. 2018; 19:224. [DOI] [PMC free article] [PubMed] [Google Scholar]
- 40. Lawrence M.S., Stojanov P., Mermel C.H., Robinson J.T., Garraway L.A., Golub T.R., Meyerson M., Gabriel S.B., Lander E.S., Getz G.. Discovery and saturation analysis of cancer genes across 21 tumour types. Nature. 2014; 505:495–501. [DOI] [PMC free article] [PubMed] [Google Scholar]
Associated Data
This section collects any data citations, data availability statements, or supplementary materials included in this article.


