Abstract
Background
Ineffective integration has been recognized as one of the major causes of early orthopedic failure of titanium-based implants. One strategy to address this problem is to develop modified titanium surfaces that promote osteoblast differentiation. This study explored titanium surfaces modified with TiO2 nanotubes (TiO2 NTs) capable of localized drug delivery into bone and enhanced osteoblast cell differentiation.
Materials and Methods
Briefly, TiO2 NTs were subjected to anodic oxidation and loaded with Metformin, a widely used diabetes drug. To create surfaces with sustainable drug-eluting characteristics, TiO2 NTs were spin coated with a thin layer of chitosan. The surfaces were characterized via scanning electron microscopy, atomic force microscopy, and contact angle measurements. The surfaces were then exposed to mesenchymal bone marrow stem cells (MSCs) to evaluate cell adhesion, growth, differentiation, and morphology on the modified surfaces.
Results
A noticeable increase in drug release time (3 days vs 20 days) and a decrease in burst release characteristics (85% to 7%) was observed in coated samples as compared to uncoated samples, respectively. Chitosan-coated TiO2 NTs exhibited a considerable enhancement in cell adhesion, proliferation, and genetic expression of type I collagen, and alkaline phosphatase activity as compared to uncoated TiO2 NTs.
Conclusion
TiO2 NT surfaces with a chitosan coating are capable of delivering Metformin to a bone site over a sustained period of time with the potential to enhance MSCs cell attachment, proliferation, and differentiation.
Keywords: titania nanotubes, titanium, osteogenic differentiation, anodization, mesenchymal bone marrow stem cells, MSCs
Introduction
In conventional drug delivery systems (oral, parenteral, etc.) drugs are distributed to the whole body and not to the specific site of interest. There also limitations associated with these delivery routes such as poor bio-distribution, toxicity, undesired side effects, drug solubility and unfavorable pharmacokinetics.1 To mitigate these effects, local application at the implant and tissue interface is a potential drug delivery solution. Proper biocompatibility, low density, desirable mechanical properties, and excellent corrosion resistance make titanium (Ti)-based implants an excellent candidate for use in orthopedic applications.2 Despite successful outcomes in tissue engineering studies, pure Ti has seen limited use in clinical applications. The bioactivity of unmodified Ti surfaces is not sufficient to provide immediate osseointegration, which is essential for ensuring initial stability and long-term durability of implants.3
Since the surface properties of an implant can impact its biological response, various surface modification strategies have been employed on Ti surfaces including4 plasma spraying,5 Nd-YAG laser cladding,6 micro-arc oxidation,7 and the deposition of surface oxide layers.8 Previous studies have shown that porous structures on implant surfaces can enhance implant-tissue integration by providing a surface topography with more defined, reproducible and reliable roughness.9 Moreover, porous structures can be excellent drug loading and delivery platforms for slow drug elution over extended time periods from several days to several weeks.10
The synthesis of vertically aligned titanium oxide nanotube arrays (TiO2 NTs) as a porous layer on Ti surfaces has been well received as a promising strategy for new implantable drug delivery systems. TiO2 NTs have been widely explored due to their low in vivo immunogenicity, simple preparation, highly controllable morphology, mechanical rigidity, chemical resistivity, high loading capability, and high surface-to-volume ratio.11–13
Various methods have been used to control the drug release behavior of TiO2 NTs including structural changes in diameter and length of the nanotubes, the use of polymer micelles as carrier nanoparticles, and the application of biodegradable polymer coatings.14 The drug releasing strategy presented here is based on the coating of a chitosan layer over the porous TiO2 NT array. By controlling the film thickness, and degradation kinetics one can effectively control the drug elution properties.1 Chitosan was selected as the polymer layer due to its wide use in drug delivery applications. Numerous reports have illustrated the positive effects of chitosan for wound healing and osseointegration using in- vitro studies.1,12 Moreover, chitosan is recognized as highly biocompatible and biodegradable polymer.
To date, many studies have focused on loading hollow TiO2 NTs with different therapeutic agents such as, bone morphogenetic protein 2 (BMP2),15–17 paclitaxel,18 penicillin/streptomycin/dexamethasone,19 indomethacin,12 aspirin/vitamin C,20 indomethacin/itraconazole/gentamicin,21 ibuprofen and vancomycin.22 In this study, Metformin, for the first time, was loaded into TiO2 NTs to investigate the effects of clinically relevant doses of Metformin on osteogenic differentiation. Osteogenic properties of Metformin, a well-tolerated anti-diabetic drug, were recently reported by several studies. These studies suggested that by enhancing preosteoblasts and MSCs differentiation, Metformin may show osteogenic effect. For instance, Smieszek et al23 studied the positive effects of Metformin on in vitro osteogenic differentiation of multipotent stromal cells derived from rat adipose tissue (rASCs). MA et al24 reported that Metformin promotes osteogenic differentiation of human mesenchymal stem cells (hBMSCs) by inhibiting GSK3β. Zhang et al25 showed that Metformin facilitates the in vitro proliferation, migration, and osteogenic differentiation of periodontal ligament stem cells (PDLSCs). Gao et al26 and Molinuevo et al27 found that bone marrow mesenchymal stem cells (BMSCs) cultured in osteogenic conditions and treated with Metformin displayed enhanced proliferative activity, osteogenesis, and bone repair.
In this work, TiO2 NT arrays were deposited onto Ti substrates using anodization. These arrays were loaded with Metformin to stimulate osteogenic differentiation on MSCs. A biocompatible and biodegradable chitosan film was then placed over the TiO2 NTs to achieve a controlled and sustained Metformin release. The release profile of Metformin was assessed using UV–Vis spectrometry. Atomic force microscopy (AFM) and contact-angle measurements were used to evaluate the surface roughness, topography and wettability, respectively. The MSCs cells were then cultured on the substrates to examine cell attachment, proliferation, morphology, alkaline phosphatase activity, total protein content, collagen I gene expression and ALP gene expression in contact with the samples.
Materials and Methods
Animal Care
Six weeks old Wistar rats were obtained from the Animal Science Department, University of Shahid Beheshti Medical Sciences (Tehran, Iran). Rats were kept in an animal house with a 12 hour light/dark cycle, and had access to food and water ad libitum. Experimental procedures were performed according to the Guide for the Care and Use of Laboratory Animals (National Institute of Health Publication, 8th Edition; revised 2011), and were also confirmed by the National Institute for Medical Research Development (NIMAD), Tehran, Iran (IR.SBMU.PHNS.REC.1397.026).
Materials
Commercially available titanium substrates (sheets of Ti–6Al–4V) were purchased from McMaster Carr Company (Los Angeles, CA, USA). Dulbecco’s modified eagle medium (DMEM) and trypsin were purchased from Gibco BRL, France. MTT [3–4,5-dimethylthiazol-2yl (2,5diphenyl-2H-tetrazoliumbromide], Chitosan (medium molecular wight), fetal bovine serum (FBS), bovine 1 serum albumin (BSA), PBS and penicillin/streptomycin (PS) were purchased from Sigma-Aldrich.
Fabrication of Nanotube Arrays
Vertically oriented TiO2 NT arrays were prepared via anodization on Ti substrates with a thickness of 13mm and a diameter of 1 mm. Prior to anodization, Ti substrates were mechanically polished with P800, 1000 and 1500 silicon carbide paper and cleaned in an ultrasound bath with ethanol, acetone, isopropanol and distilled water. An aqueous solution containing ethylene glycol (1.00949, Merck, 99%) and 0.38 wt% ammonium fluoride (NH4F) (1.01164, Merck) dissolved in 2 vol% DI water was used to conduct anodization treatment. The anodization process was performed at voltages of 30, 60, 85, 90.95 and 105 V for 1.5 and 3 h using a DC power supply (PEQ lab (EV843, made in Belgium). All anodization experiments were performed at 4°C. Following anodization, the samples were sequentially rinsed with acetone, ethanol and de-ionized water, and then oven dried.
Metformin Deposition on Nanotube Arrays and Chitosan Coating
Metformin was loaded into Ti nanotubes according to a previous study.20 Firstly, 6.45 mg of Metformin was dissolved into 50 mL FBS. Then, 15μL Metformin solution was dropped onto the surfaces of Ti nanotubes, followed by drying in air at room temperature. This procedure was repeated five times. To retard the release of drugs from TiO2 NTs, chitosan films with varying thicknesses were coated over the anodized substrates. Simply, 2.5 mg of chitosan powder was dissolved into 100 mL of 0.8% acetic acid. After complete dissolution, the Ti disks were spin coated with chitosan solution for 60 s at 1000 rpm. All operations were performed in the super clean worktable at room temperature and dried in air. These samples will be referred to as T (Ti), TA (anodized Ti) and TAmc (anodized Ti loaded with Metformin and coated with chitosan).
Characterization of the Samples
The samples were gold-sputtered, and their surface morphology was characterized by SEM (S160, Cambridge, UK) at an accelerating voltage of 15 kV in high vacuum mode. Sessile-drop contact angle method (OCA 15 plus; Data physics) at room temperature was used to characterize surface wettability of the Ti samples. Small droplets (0.4 μL) of deionized water was used to measure the contact angle. The angle between the droplet and surface was measured for five seconds. An average value of the contact angle was made from five drops on each sample. Surface roughness of the samples was analyzed by AFM (AFM, Veeco Instruments Inc, Woodbury, NY, USA), and processed using Nano Scope. Chemical analysis of all chitosan components was performed by attenuated total reflectance-Fourier transform infrared (ATR-FTIR) spectroscopy over a range of 0 and 4500 cm−1.
Metformin Release
Maximum absorption of Metformin was measured using a full wavelength UV–Vis spectrometer) Lambda 900, PerkinElmer, USA). Every sample was immersed into 100 mL of double-distilled water (DDW) at 37 °C. At a desired time interval, 400 μL of solution was taken out and measured with high-performance liquid chromatography (HPLC/Sephadex-G50). After collecting 20 samples of 500 microliters from the chromatography column, Metformin release was measured by spectrophotometer at 233 nm after 6 hours, 24 hours, 72 hours, 7 days, 14 days and 21 days of loading respectively.
MSCs Isolation and Primary Culture
Rat MSCs were prepared according to the Animal Ethics Committee Approval and was MSCs approved by the Ethics Committee of the University of Tehran. As described previously,28 briefly, MSCs were isolated from long bones (ie femur and tibia) of 6 weeks old male Wistar rats (Animal Science Department, University of Shahid Beheshti Medical Sciences). Following euthanasia using pentobarbital 20% (v/v), the bones were aseptically dissected, cleaned of soft tissue and washed with PBS. The ends of the bones were cut and marrow was flushed out from the tibiae and femora with 5 mL of DMEM supplemented with 10% FBS and 1% penicillin/streptomycin at 37 °C in a 5% CO2 atmosphere using a 23-gauge needle and syringe. The cells were centrifuged (1000 rpm, 5 min) and resuspended in fresh DMEM. Cells were seeded in a 25 cm2 flask, and incubated at 37 °C in 5% CO2 and 90% humidity. After 24 h, non-adherent cells were discarded and medium was exchanged. The adherent cells were detached with 0.25% trypsin/EDTA at day 7. Following cultures were passaged at 5–7 day intervals and expanded to 3 passages for further experiments.
Flow Cytometric Analysis of CD Markers
The cells were washed using PBS and treated with 0.05% Trypsin–EDTA (Gibco). The harvested cells were centrifuged and re-suspended in PBS for flow cytometry analysis (BD FACS Calibur, USA). The data were analyzed by Flowjo 7.6.1 software.
Cell Attachment and Proliferation
An MTT assay was used to study the attachment and proliferation of MSCs on the T, TA and TAmc samples. The samples were sterilized with UV light for 20 minutes and placed in a 48-well culture plate. The samples were then seeded with 8000 cell/mL for adhesion studies and 10,000 cell/mL for proliferation studies and incubated for different time points for each test (2, 4 and 6 h for adhesion, 1, 3 and 7 days for proliferation). The culture plate was used as a control substrate. The samples were then moved into a new culture plate and washed with PBS to remove the unattached cells after each time point. To make a final volume of 100 µL, freshly prepared media of complete DMEM and 10 µL of MTT solution (5 mg/mL stock in 1 × fresh medium) were added into each well. The plate was placed in a CO2 incubator for 3 h to form purple formazan crystals. The formazan crystals were then dissolved in solubilizing solution and transferred into a 96-well plate. The absorbance of was measured at a wavelength of 570 nm with subtraction of 650 nm background using a UV–Vis spectrophotometer. To estimate the cell number, a standard curve was drawn.
Cell Morphology
Sterilized samples were placed and seeded in 48-well culture plates with 4 × 10³ cells and incubated for 2 days. The samples were then rinsed with PBS three times and fixed with 2.5% glutaraldehyde, and dehydrated with gradient concentrations of ethanol (30, 40, 50, 60, 70, 80, 90 and 100%). For investigating cell morphology, they were air-dried overnight, sputter-coated with gold and examined with SEM.
Osteogenic Differentiation of MSCs
ALP activity, type I collagen production, type I collagen expression, and ALP expression were measured to evaluate osteoblastic differentiation. T, TA and TAmc samples were washed with PBS and lysed with 200 mL 0.1% Triton-X100 after 15 days of osteogenic differentiation. To evaluate ALP activity, a 100 mL aliquot of the lysate was used by the hydrolysis of p-nitrophenylphosphate (p-NPP) into p-nitrophenol (p-NP) at 37°C for 1 hour. The absorbance of p-NP was recorded at 405 nm. Aliquots of the same extract were used for protein determination by Bradford’s technique. Type I collagen production was evaluated as reported previously. Briefly, after 21 days of osteogenic differentiation, cell monolayers on the T, TA and TAmc samples were fixed with Bouin’s solution and stained with Sirius red dye for1 hour. The stained material was dissolved in 1mL 0.1 N sodium hydroxide, and the absorbance of the solution was recorded at 550 nm. The expression levels of ALP and type I collagen after 14 and 21 days of culture on the samples were analyzed by reverse transcription polymerase chain reaction (RT-PCR). The samples were seeded in 24-well culture plate with 5 × 10³ cells and incubated for 14 (for ALP) and 21 (for Collagen I) days. After the incubation period, the samples were rinsed with PBS and DNA content of cells was isolated with lysis buffer (10%Triton X-100, 5% Tween 20, 100 m mol−1 Tris–HCl (pH 8), 10 mmol−1 EDTA). A NanoDrop 1000 spectrophotometer (Thermofisher, USA) was used to calculate the total DNA content of cells based on the absorbance wavelength of 260 nm.
Statistical Analysis
All data are presented as the mean ± SD of at least three experiments. Statistical analysis was performed with GraphPad Prism software (GraphPad, San Diego, CA, USA) using a two-way ANOVA followed by Tukey’s multiple comparison test. The results were considered statistically significant when p < 0.05.
Results and Discussion
Morphology of TiO2 Nanotubes
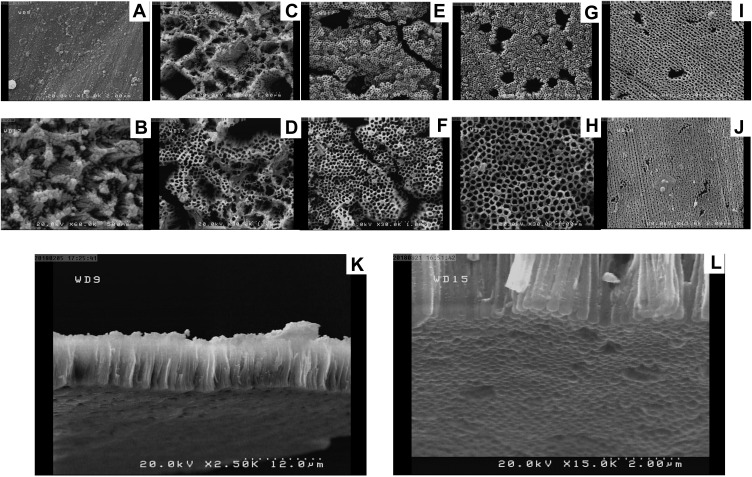
Figure 1 shows SEM images of the nanotube array surface microstructures prepared with varying voltage and oxidation time. Previous studies have confirmed that by varying anodizing conditions such as the voltage, time, and temperature, different TiO2 NT pore sizes can be obtained.29,30 At the lowest applied voltage (30 V) no significant morphological changes were observed between oxidation times of 1.5 h and 3 h (Figure 1A and B). After increasing the voltage to 60 V, a porous structure begins to form on the surface of the substrate. (Figure 1C and D). When the anodizing voltage increases to 85 V, a compact TiO2 layer forms on the surface of Ti substrate and a time dependence on TiO2 layer thickness is observed. (Figure 1E and F). At 95 V and 1.5 h, the sample surface was covered with a layer of TiO2 NTs (Figure 1G). The nanotubes are only observed when the supplied anodizing voltage is 95 V (3 h). Pores with diameters of 160 ± 20 nm were observed on the top of nanotubes surface (Figure 1H). With an increase to 105 V the tubular structure becomes severely damaged for both oxidation time scale (Figure 1I and J). Cross sections of the TiO2 NT layer show a vertically ordered and densely packed layer. (Figure 1k). Figure 1l also revealed that the arrays were vertically aligned with closed bottoms. To maximize the drug loading capacity the anodizing conditions of 95 V and 3 h were used to prepare the nanotubes for this study.
Figure 1.
Series of SEM images of the pore surface of TiO2 nanotube film using different anodizing times and voltages of (A) 30 V, 1.5 h; (B) 30 V, 3 h; (C) 60 V, 1.5 h; (D) 60 V, 3 h; (E) 85 V, 1.5 h; (F) 85 V, 3 h; (G) 95 V, 1.5 h; (H) 95 V, 3 h; (I) 105 V, 1.5 h; (J) 105 V, 3 h. SEM images of TiO2 nanotube structures fabricated by electrochemical anodization in NH4F/ethylene glycol electrolyte. (K) Typical cross-sectional image of self-supporting TiO2 nanotube layer and the entire structure (nanotube film) on the Ti substrate. (L) The bottom surface showing the nanotube structures detached from underlying Ti substrate.
ATR-FTIR
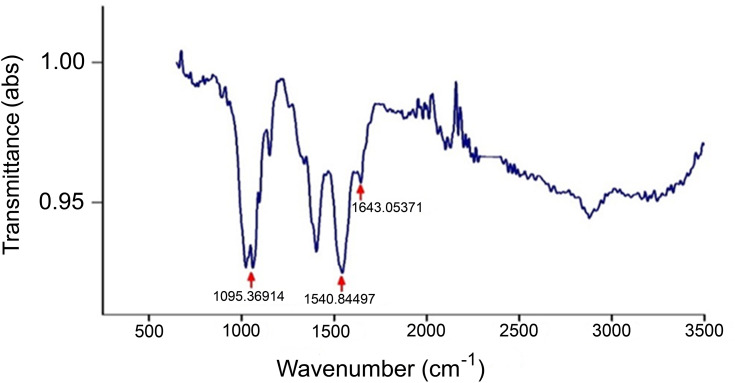
To confirm the presence of chitosan coating on the surface of TiO2 NTs, ATR-FTIR was performed and the results are presented in Figure 2. The absorption peak at 3360 cm−1 is associated with -OH group and the absorption peaks at 1643 and 1540 cm−1 are assigned to the NHCOCH3 (amide I) and NH2 groups (amide II), respectively. This spectra is consistent with previous reports,31,32 confirming the presence of chitosan on the surface of TiO2 NTs.
Figure 2.
FTIR spectra of the TAmc sample.
Surface Roughness and Wettability
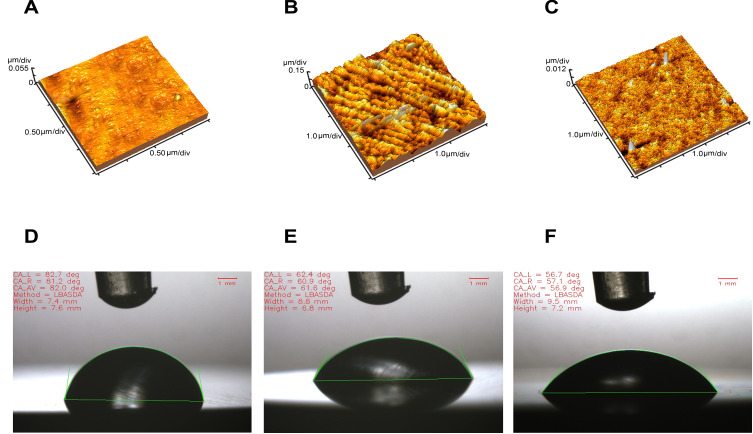
The hydrophilicity of all samples was studied by contact angle measurement as shown in Figure 3A–C. After chitosan coating, the contact angles of samples significantly decreased from 82°± 0.54 for bare Ti surfaces to 56.9° ±0.34 for the TAmc surface. This data is also shown numerically in Table 1.
Figure 3.
Water contact angle measurements of samples T (A), TA (B), and TAmc (C). AFM images of T (D), TA (E), and TAmc (F). The samples were measured in the dry state.
Table 1.
Roughness and Contact Angle Measurement of Samples
| Sample | Angle (°) | Ra (nm) |
|---|---|---|
| T | 82 ±0.54 | 4.660 ± 1.2 |
| TA | 61.6 ± 0.15 | 25.17 ± 1.2 |
| TAmc | 56.9 ± 0.34* | 0.832 ± 1.2** |
Notes: *P <0.05 compared to other samples, **P <0.05 compared to other samples.
AFM analysis was used to evaluate the surface topography of different samples. AFM images are shown in Figure 3D–F and values for Ra are reported in Table 1. TA substrates display relatively rough morphology as compared to T, and TAmc substrates with a roughness increment of 25.17±1.2 nm. Porous arrays of TiO2 NTs on the substrate surface are also clearly visible. By contrast, the roughness increment was found to be 0.832 ±1.2 nm for TAmc, due to the presence of the chitosan coating.
In general, it has known that drug deposition and cell adhesion on a Ti surface is dependent on the surface roughness and wettability.33 According to the contact angle measurement study and AFM analysis, the lowest contact angle and surface roughness was observed for TAmc (Figure 3). The lower surface roughness suggested that the chitosan coating weakened the rigid valley-like structures of TiO2 NTs substrates. It should be noted that soft chitosan layers can reduce the resolution of AFM measurements. These findings are in agreement with previous reports.34
Drug Release from TiO2 Nanotube in Double-Distilled Water
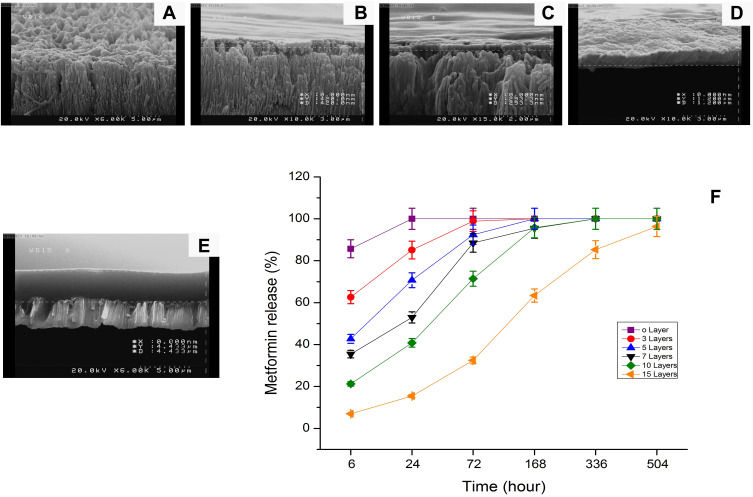
To investigate the effects of chitosan thickness on the release behavior of Metformin from TiO2 NT-Ti coated samples, Ti samples with a TiO2 NT size of 160 nm were chosen. Figure 4 represents typical SEM images of a prepared chitosan layer with thicknesses varying from 1–4.5 µm covering the TiO2 NTs surface. At a thickness of as low as 1 µm a featureless surface is seen on top of TiO2 NTs confirming that pores were covered by the polymer layer. As the number of spin coated layers increases, the thickness of the chitosan layer increases as well; 15 spin coated layers displayed an equivalent thickness of 4.4 µm.
Figure 4.
SEM images of TiO2 NTs after drug loading (Metformin) and spin coating of Chitosan, showing the cross-section of the three (A), five (B), seven (C), ten (D), and fifteen (E) layers of Chitosan. Comparative drug release graph of Metformin from different layers of Chitosan (F).
Comparative drug release profiles of Metformin loaded into TiO2 NTs with and without chitosan film are presented in Figure 4F and release characteristics at various time intervals are listed in Table 2. Compared to the burst release from the non-coated sample, the release rate of Metformin from coated samples is significantly slower. The corresponding release amount of Metformin from coated samples with 3 layers of chitosan is 62% and 85% within 6 h and 1 day, respectively. However, the leaching amount is up to 98% within 3 days due to the rapid degradation of thin chitosan film. The release time of Metformin from TiO2 NT coated samples with 7 layers of chitosan can last about 7 days. When the TiO2 NTs are covered by 15 layers of chitosan, Metformin release time lasts up to almost 21 days. This is due to considerable restriction from polymer chain swelling which slows drug molecule movement and lowers diffusion rates. These results are consistent with previous reports which suggest that by controlling the polymer thickness it is possible to tune drug elution.1
Table 2.
The Release Profile of Metformin from Different Chitosan Layers at Various Time Periods
| Chitosan Layers | 6 h | 24h | 72h | 7 days | 14 days | 21 days |
|---|---|---|---|---|---|---|
| 0 | 85.71 | 100 | 100 | 100 | 100 | 100 |
| 3 | 62.618 | 85.106 | 98.82 | 100 | 100 | 100 |
| 5 | 42.73 | 70.69 | 92.39 | 100 | 100 | 100 |
| 7 | 35.45 | 52.95 | 88.48 | 95.48 | 100 | 100 |
| 10 | 21.23 | 40.83 | 71.42 | 95.74 | 100 | 100 |
| 15 | 6.94 | 15.47 | 32.45 | 63.4 | 85.32 | 96.32 |
Flow Cytometric Analysis of CD Markers
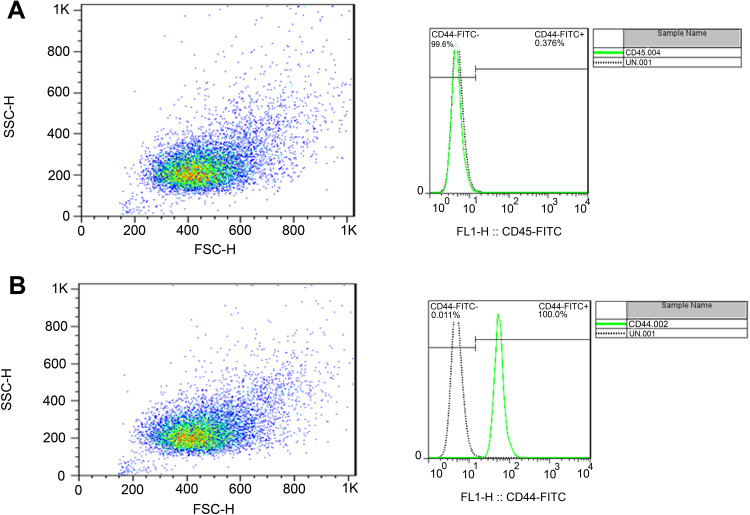
Flow cytometric analysis was performed to test the immunophenotypes of MSC surface markers, and the results are presented in Figure 5. All isolated MSC were negative for CD45 (Figure 5A) while they were positive for CD44 (Figure 5B). These results confirmed that the majority of the bone marrow derived cells were mesenchymal.
Figure 5.
Flow cytometric analysis of rat bone marrow mesenchymal stem cells, the analysis revealed that their expression of surface antigens CD44 (Passage 3) (A) was strongly positive; while CD45 (B) was negative.
Cell Morphology, Attachment, and Proliferation
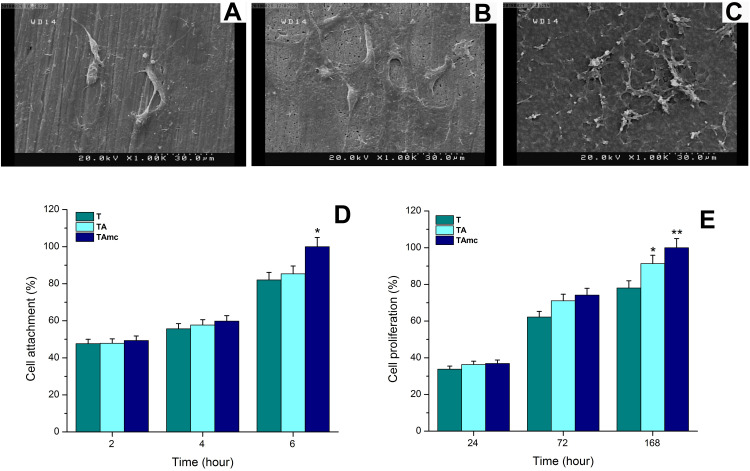
SEM analysis was used to study the cell morphology of attached cells on the substrates after 3 days as shown in Figure 6A–C). More cell contacts and extent of filopodia and lamellipodia was observed on TA (Figure 6B) and TAmc (Figure 6C) as compared to T samples (Figure 6A).
Figure 6.
Scanning electron microscope (SEM) images of MSCs cultured on Ti samples after 3 days of incubation, (A) T, (B) TA, and (C) TAmc, (D) MSCs adhesion on titanium surfaces after 2, 4, and 6 h. Data are presented as mean ± SD; n = 3. *p<0.05 compared to control, **p<0.05 compared to control and TA, (E) Cell proliferation of MSCs cells after 1, 3 and 7 days on titanium surfaces was measured with MTT assay. Each bar represents the mean of cell proliferation ± SD (n=3). *p<0.05 compared to control, and TA.
The attachment of MSCs on the sample surfaces was assessed by MTT assay. The MTT assay confirmed that the cells showed higher affinity for TA and TAmc surfaces as compared to T sample owing to the higher roughness and hydrophilicity of these samples.19 Cell adhesion increased on all samples after 6 h, but the highest adhesion was observed on TAmc owing to the presence of chitosan film (Figure 6D).
Cell proliferation on the samples was also evaluated through MTT assay after cultivation of cells for 1, 3 and 7 days. As shown in (Figure 6E), after 1 day of culture, no difference was observed in the cell proliferation on the samples. After 3 day of culture, lower cells number was observed on T was in comparison with other samples. But after 7 days of culture, the cells number on TAmc was significantly higher than the others.
The highest cell attachment and proliferation were observed on the TAmc sample according to the MTT assay analysis. Previous studies have confirmed the promising effect of chitosan on the cell attachment and proliferation.35 The structural characteristics of chitosan are similar to glycosaminoglycans, particularly hyaluronic acid, a highly polar molecule which is abundant in the extracellular matrix.35–37 The hydrophilicity and biocompatibility of chitosan film and the presence of controlled doses of Metformin causes an increase in the cell proliferation in the TAmc sample. These results are compatible with previous studies which showed that chitosan enhances the formation of ordered bone tissue, as it allows for the growth, replication and cell-shape retention of osteoblasts.12,38,39 As shown in Figure 6B and C) the cells displayed a flat and well-spread morphology on the TA and TAmc. This is an indication of enhanced surface interactions. TAmc substrates exhibit improved cell adhesion due to positively-charged chitosan chains, with a high density of amino groups that attract proteins and promote cell attachment and provide superior biocompatibility for these structures.35
Invitro Effect of Metformin on MSCs Differentiation
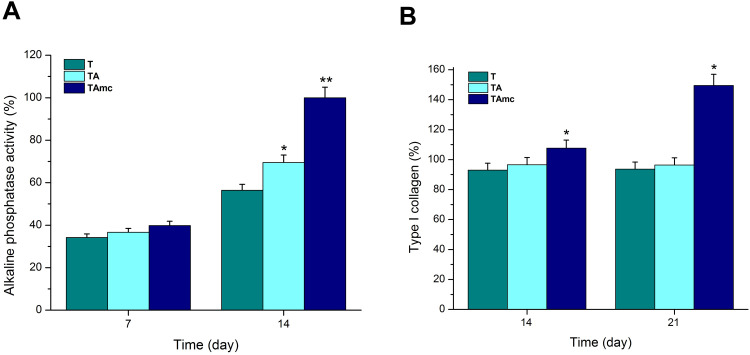
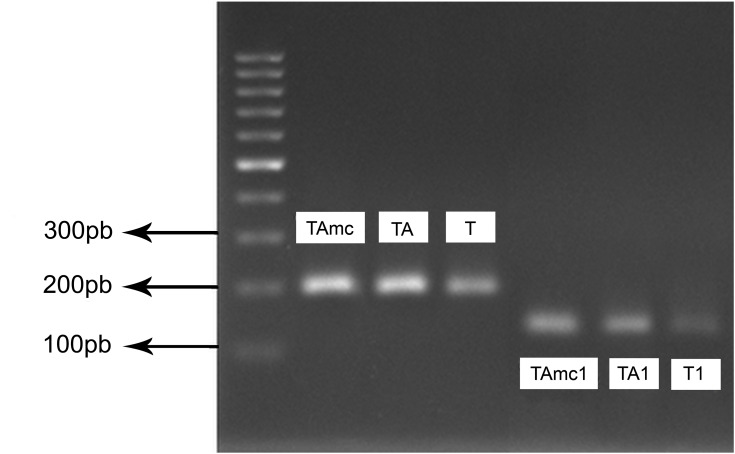
The expression of extracellular type I collagen, and ALP activity after 7, 15, and 21 days of culture was assessed to evaluate osteogenic differentiation, and the results are summarized in Figures 7 and 8. After the first week, there was no observed difference between T, TA and TAmc substrates. After 15 days of differentiation, a significant increase was observed in the ALP activity of TAmc samples (Figure 7A). Production of type I collagen was first qualitatively assessed by Sirius red staining of cell monolayers on sample surface after 14 and 21 days of culture. As shown in Figure 7B, collagen production significantly increased in TAmc samples after 21 days of culture. Additionally, collagen production on TAmc substrates was significantly higher than on T and TA substrates. After 15 days of differentiation, higher levels of MSCs ALP expression was found on TAmc than the others (Figure 8). Likewise, after 21 days of differentiation, a significant increase in Type I collagen was found on TAmc substrates than TA and T substrates.
Figure 7.
Alkaline phosphatase (ALP) activity (normalized to total protein contents) (A) and Type 1 Collagen expression (B) of MSCs on different titanium samples after 7, and14 days. *p<0.05 compared to control, and TA, **p<0.05 compared to control and TA.
Figure 8.
PCR amplification for ALP (TAmc, TA, T) after 14 days and Collagens (TAmc1, TA1, T1) after 21 days of cell culture.
The results showed higher expression level of ALP for early stage differentiation and Type I collagen for late stage differentiation on the TAmc substrate, after 15 days and 21 days of MSCs culture respectively. These results may be ascribed to the osteogenic effects of Metformin. Previous studies have suggested that Metformin can induce commitment of osteoprogenitor cells to the osteoblastic phenotype and bone formation by exerting direct effects on bone cells. These studies revealed that clinical doses of Metformin may increase the expression of osteoblast-specific transcription factor Runx2/Cbfa1 and enhance the phosphorylation of AMPK.27,40,41 In addition, it has been previously reported that Chitosan can also serve as an osteogenic factor in vitro. Chitosan can stimulate RUNX2 transcription, followed by the expression of ALP, COL1A1, and other osteoblast-specific differentiation genes that play roles in bone formation.42
Conclusion
In this study, we report the preparation and characteristics of a drug delivery system on the surface of Ti substrates. This system employed TiO2 NTs as a substrate for loading of Metformin and chitosan multi-layers as efficient coverage for sustained elution of Metformin. The SEM, AFM results and contact angle measurements confirmed the successful fabrication of nanotubular structure and deposition of a multilayer chitosan capping layer. The drug release rate indicated that the 15 layers of chitosan could retard the release of Metformin for up to 21 days. The results of in vitro tests confirmed that loading TiO2 NT arrays with Metformin and subsequently coating with chitosan can promote MSCs attachment, and proliferation. Moreover, a significant increase in the level of ALP activity and collagen I production on TAmc substrates reinforced the positive impact of Metformin on the differentiation of MSCs towards osteoblast cells. The approach presented here may be applied to a wide range of implants (Ti, Ti alloys, stainless steel) and different drugs, which may be suitable for diverse orthopedic applications and bone therapies. Thus, it may have potential implication for the development of medical devices incorporating drugs in the field of implant technology.
Acknowledgments
This study was supported by the Research Council of University of Tehran and authors thankfully respected for financial support.
Disclosure
The authors report no conflicts of interest in this work.
References
- 1.Mohan L, Anandan C, Rajendran N. Drug release characteristics of quercetin-loaded TiO2 nanotubes coated with chitosan. Int J Biol Macromol. 2016;93:1633–1638. doi: 10.1016/j.ijbiomac.2016.04.034 [DOI] [PubMed] [Google Scholar]
- 2.Montazeri M, Hashemi A, Houshmand B, Faghihi S. The effect of bio-conditioning of titanium implants for enhancing osteogenic activity. J Oral Implantology. 2019;45(3):187–195. doi: 10.1563/aaid-joi-D-18-00020 [DOI] [PubMed] [Google Scholar]
- 3.Karaji ZG, Houshmand B, Faghihi S. Surface modification of porous titanium granules for improving bioactivity. Int J Oral Maxillofacial Implants. 2016;31(6):1274–1280. doi: 10.11607/jomi.5246 [DOI] [PubMed] [Google Scholar]
- 4.Chan KH, Zhuo S, Ni M. Priming the surface of orthopedic implants for osteoblast attachment in bone tissue engineering. Int J Med Sci. 2015;12(9):701. doi: 10.7150/ijms.12658 [DOI] [PMC free article] [PubMed] [Google Scholar]
- 5.Vercaigne S, Wolke JG, Naert I, Jansen JA. Bone healing capacity of titanium plasma‐sprayed and hydroxylapatite‐coated oral implants. Clin Oral Implants Res. 1998;9(4):261–271. doi: 10.1034/j.1600-0501.1998.090407.x [DOI] [PubMed] [Google Scholar]
- 6.Safi IN, Hussein BMA, Al Shammari AM, Tawfiq TA. Implementation and characterization of coating pure titanium dental implant with sintered β-TCP by using Nd: YAG laser. Saudi Dental j. 2019;31(2):242–250. doi: 10.1016/j.sdentj.2018.12.004 [DOI] [PMC free article] [PubMed] [Google Scholar]
- 7.Wang Q, Cheng M, He G, Zhang X. Surface modification of porous titanium with microarc oxidation and its effects on osteogenesis activity in vitro. J Nanomater. 2015;2015. [Google Scholar]
- 8.Kung K-C, Chen J-L, Liu Y-T, Lee T-M. Fabrication and characterization of CaP-coated nanotube arrays. Mater Chem Phys. 2015;153:110–116. doi: 10.1016/j.matchemphys.2014.12.042 [DOI] [Google Scholar]
- 9.Roguska A, Pisarek M, Andrzejczuk M, Dolata M, Lewandowska M, Janik-Czachor M. Characterization of a calcium phosphate–TiO2 nanotube composite layer for biomedical applications. Mater Sci Eng C. 2011;31(5):906–914. doi: 10.1016/j.msec.2011.02.009 [DOI] [Google Scholar]
- 10.Arruebo M. Drug delivery from structured porous inorganic materials. Wiley Interdiscip Rev Nanomed Nanobiotechnol. 2012;4(1):16–30. doi: 10.1002/wnan.132 [DOI] [PubMed] [Google Scholar]
- 11.Oh S, Brammer KS, Li YJ, et al. Stem cell fate dictated solely by altered nanotube dimension. Proc National Acad Sci. 2009;106(7):2130–2135. doi: 10.1073/pnas.0813200106 [DOI] [PMC free article] [PubMed] [Google Scholar]
- 12.Gulati K, Ramakrishnan S, Aw MS, Atkins GJ, Findlay DM, Losic D. Biocompatible polymer coating of titania nanotube arrays for improved drug elution and osteoblast adhesion. Acta Biomater. 2012;8(1):449–456. doi: 10.1016/j.actbio.2011.09.004 [DOI] [PubMed] [Google Scholar]
- 13.Losic D, Simovic S. Self-ordered nanopore and nanotube platforms for drug delivery applications. Expert Opin Drug Deliv. 2009;6(12):1363–1381. doi: 10.1517/17425240903300857 [DOI] [PubMed] [Google Scholar]
- 14.Aw MS, Gulati K, Losic D. Controlling drug release from titania nanotube arrays using polymer nanocarriers and biopolymer coating. J Biomater Nanobiotechnol. 2011;2(05):477. doi: 10.4236/jbnb.2011.225058 [DOI] [Google Scholar]
- 15.Hu Y, Cai K, Luo Z, et al. TiO2 nanotubes as drug nanoreservoirs for the regulation of mobility and differentiation of mesenchymal stem cells. Acta Biomater. 2012;8(1):439–448. doi: 10.1016/j.actbio.2011.10.021 [DOI] [PubMed] [Google Scholar]
- 16.Huo K, Zhang X, Wang H, Zhao L, Liu X, Chu PK. Osteogenic activity and antibacterial effects on titanium surfaces modified with Zn-incorporated nanotube arrays. Biomaterials. 2013;34(13):3467–3478. doi: 10.1016/j.biomaterials.2013.01.071 [DOI] [PubMed] [Google Scholar]
- 17.Park J, Bauer S, von der Mark K, Schmuki P. Nanosize and vitality: tiO2 nanotube diameter directs cell fate. Nano Lett. 2007;7(6):1686–1691. doi: 10.1021/nl070678d [DOI] [PubMed] [Google Scholar]
- 18.Cheng Y, Yang H, Yang Y, et al. Progress in TiO 2 nanotube coatings for biomedical applications: a review. J Mater Chem B. 2018;6(13):1862–1886. doi: 10.1039/C8TB00149A [DOI] [PubMed] [Google Scholar]
- 19.Aninwene GE, Ii CY, Webster TJ. Enhanced osteoblast adhesion to drug-coated anodized nanotubular titanium surfaces. Int J Nanomedicine. 2008;3(2):257. [DOI] [PMC free article] [PubMed] [Google Scholar]
- 20.Yang W, Deng C, Liu P, Hu Y, Luo Z, Cai K. Sustained release of aspirin and vitamin C from titanium nanotubes: an experimental and stimulation study. Mater Sci Eng C. 2016;64:139–147. doi: 10.1016/j.msec.2016.03.055 [DOI] [PubMed] [Google Scholar]
- 21.SinnáAw M, Addai-Mensah J, Losic D. A multi-drug delivery system with sequential release using titania nanotube arrays. Chem Commun. 2012;48(27):3348–3350. doi: 10.1039/c2cc17690d [DOI] [PubMed] [Google Scholar]
- 22.Chao C-S, Liu K-H, Tung W-L, Chen S-Y, Liu D-M, Chang Y-P. Bioactive TiO2 ultrathin film with worm-like mesoporosity for controlled drug delivery. Microporous Mesoporous Mater. 2012;152:58–63. doi: 10.1016/j.micromeso.2011.12.006 [DOI] [Google Scholar]
- 23.Śmieszek A, Tomaszewski KA, Kornicka K, Marycz K. Metformin promotes osteogenic differentiation of adipose-derived stromal cells and exerts pro-osteogenic effect stimulating bone regeneration. J Clin Med. 2018;7(12):482. doi: 10.3390/jcm7120482 [DOI] [PMC free article] [PubMed] [Google Scholar]
- 24.Ma J, Zhang Z, Hu X, Wang X, Chen A. Metformin promotes differentiation of human bone marrow derived mesenchymal stem cells into osteoblast via GSK3β inhibition. Eur Rev Med Pharmacol Sci. 2018;22(22):7962–7968. doi: 10.26355/eurrev_201811_16424 [DOI] [PubMed] [Google Scholar]
- 25.Zhang R, Liang Q, Kang W, Ge S. Metformin facilitates the proliferation, migration, and osteogenic differentiation of periodontal ligament stem cells in vitro. Cell Biol Int. 2020;44(1):70–79. doi: 10.1002/cbin.11202 [DOI] [PubMed] [Google Scholar]
- 26.Gao Y, Xue J, Li X, Jia Y, Hu J. Metformin regulates osteoblast and adipocyte differentiation of rat mesenchymal stem cells. J Pharm Pharmacol. 2008;60(12):1695–1700. doi: 10.1211/jpp.60.12.0017 [DOI] [PubMed] [Google Scholar]
- 27.Molinuevo MS, Schurman L, McCarthy AD, et al. Effect of metformin on bone marrow progenitor cell differentiation: in vivo and in vitro studies. J Bone Mineral Res. 2010;25(2):211–221. doi: 10.1359/jbmr.090732 [DOI] [PubMed] [Google Scholar]
- 28.Moradian H, Fasehee H, Keshvari H, Faghihi S. Poly (ethyleneimine) functionalized carbon nanotubes as efficient nano-vector for transfecting mesenchymal stem cells. Colloids Surf B Biointerfaces. 2014;122:115–125. doi: 10.1016/j.colsurfb.2014.06.056 [DOI] [PubMed] [Google Scholar]
- 29.Ainuddin AR, Sulaiman MS Effect of anodizing voltage and annealing temperature on the growth of titanium dioxide nanotube. Paper presented at: AIP Conference Proceedings 2017, Jogjakarta, Indonesia. [Google Scholar]
- 30.Indira K, Mudali UK, Nishimura T, Rajendran N. A review on TiO 2 nanotubes: influence of anodization parameters, formation mechanism, properties, corrosion behavior, and biomedical applications. J Bio Tribo Corros. 2015;1(4):28. doi: 10.1007/s40735-015-0024-x [DOI] [Google Scholar]
- 31.Renoud P, Toury B, Benayoun S, Attik G, Grosgogeat B. Functionalization of titanium with chitosan via silanation: evaluation of biological and mechanical performances. PLoS One. 2012;7(7):e39367. doi: 10.1371/journal.pone.0039367 [DOI] [PMC free article] [PubMed] [Google Scholar]
- 32.Mahmoud Nasef M, El-Hefian EA, Saalah S, Yahaya AH. Preparation and properties of non-crosslinked and ionically crosslinked chitosan/agar blended hydrogel films. J Chem. 2011;8(S1):S409–S419. [Google Scholar]
- 33.Burns K, Yao C, Webster TJ. Increased chondrocyte adhesion on nanotubular anodized titanium. J Biomed Mater Res Part A. 2009;88(3):561–568. doi: 10.1002/jbm.a.31899 [DOI] [PubMed] [Google Scholar]
- 34.Bae IH, Yun KD, Kim HS, et al. Anodic oxidized nanotubular titanium implants enhance bone morphogenetic protein‐2 delivery. J Biomed Mater Res B Appl Biomater. 2010;93(2):484–491. doi: 10.1002/jbm.b.31606 [DOI] [PubMed] [Google Scholar]
- 35.Martin HJ, Schulz KH, Bumgardner JD, Schneider JA. Enhanced bonding of chitosan to implant quality titanium via four treatment combinations. Thin Solid Films. 2008;516(18):6277–6286. doi: 10.1016/j.tsf.2007.12.001 [DOI] [Google Scholar]
- 36.Balasundaram G, Webster TJ. An overview of nano‐polymers for orthopedic applications. Macromol Biosci. 2007;7(5):635–642. doi: 10.1002/mabi.200600270 [DOI] [PubMed] [Google Scholar]
- 37.Smith LJ, Swaim JS, Yao C, Haberstroh KM, Nauman EA, Webster TJ. Increased osteoblast cell density on nanostructured PLGA-coated nanostructured titanium for orthopedic applications. Int J Nanomedicine. 2007;2(3):493. [PMC free article] [PubMed] [Google Scholar]
- 38.Webster TJ, Miller DC, Thapa A, Haberstroh KM In vitro vascular cell adhesion and proliferation on alkaline degraded poly-lactic/glycolic acid polymers. MRS Online Proceedings Library Archive, San Francisco, California, USA 2002;724. [Google Scholar]
- 39.Bumgardner JD, Wiser R, Gerard PD, et al. Chitosan: potential use as a bioactive coating for orthopaedic and craniofacial/dental implants. J Biomater Sci Polym Ed. 2003;14(5):423–438. doi: 10.1163/156856203766652048 [DOI] [PubMed] [Google Scholar]
- 40.Stage TB, Christensen -M-MH, Jørgensen NR, et al. Effects of metformin, rosiglitazone and insulin on bone metabolism in patients with type 2 diabetes. Bone. 2018;112:35–41. doi: 10.1016/j.bone.2018.04.004 [DOI] [PubMed] [Google Scholar]
- 41.Cortizo AM, Sedlinsky C, McCarthy AD, Blanco A, Schurman L. Osteogenic actions of the anti-diabetic drug metformin on osteoblasts in culture. Eur J Pharmacol. 2006;536(1–2):38–46. doi: 10.1016/j.ejphar.2006.02.030 [DOI] [PubMed] [Google Scholar]
- 42.Amir LR, Suniarti DF, Utami S, Abbas B. Chitosan as a potential osteogenic factor compared with dexamethasone in cultured macaque dental pulp stromal cells. Cell Tissue Res. 2014;358(2):407–415. doi: 10.1007/s00441-014-1938-1 [DOI] [PubMed] [Google Scholar]


