Abstract
Internet-derived information has been recently recognized as a valuable tool for epidemiological investigation. Google Trends, a Google Inc. portal, generates data on geographical and temporal patterns according to specified keywords. The aim of this study was to compare the reliability of Google Trends in different clinical settings, for both common diseases with lower media coverage, and for less common diseases attracting major media coverage. We carried out a search in Google Trends using the keywords “renal colic”, “epistaxis”, and “mushroom poisoning”, selected on the basis of available and reliable epidemiological data. Besides this search, we carried out a second search for three clinical conditions (i.e., “meningitis”, “Legionella Pneumophila pneumonia”, and “Ebola fever”), which recently received major focus by the Italian media. In our analysis, no correlation was found between data captured from Google Trends and epidemiology of renal colics, epistaxis and mushroom poisoning. Only when searching for the term “mushroom” alone the Google Trends search generated a seasonal pattern which almost overlaps with the epidemiological profile, but this was probably mostly due to searches for harvesting and cooking rather than to for poisoning. The Google Trends data also failed to reflect the geographical and temporary patterns of disease for meningitis, Legionella Pneumophila pneumonia and Ebola fever.
The results of our study confirm that Google Trends has modest reliability for defining the epidemiology of relatively common diseases with minor media coverage, or relatively rare diseases with higher audience. Overall, Google Trends seems to be more influenced by the media clamor than by true epidemiological burden.
Keywords: Digital epidemiology, Google Trends, Renal colic, Epistaxis, Mushroom poisoning
1. Introduction
Traditional methods of data collection in epidemiological studies need heavy resources in terms of logistics, time, as well as human and material resources, so leading the way to searching alternative strategies for collecting data [1]. Since internet has increasingly become a meaningful health resource for both laypeople and health professionals, internet-derived information has been recognized as a surrogate tool for estimating epidemiology and gathering data about patterns of disease and population behavior [2]. Internet query platforms, which allow to interact with internet-based data, have been considered a source of potentially useful and accessible resources, especially aimed to identify outbreaks and implement intervention strategies [3]. The US Institute of Medicine (IOM) has also recently acknowledged that the use of internet data in health care research holds promise, and may also “complement and extend the data foundations that presently exist”[4].
Google Trends, a free and publically accessible online Alphabet Inc. portal, analyzes a portion of billions daily Google searches, generating data on geographical and temporal patterns according to specified keywords [5]. The usefulness of this search engine has been recognized for investigating epidemiological trends of specific diseases or groups of symptoms [6]. It has also been used in many research publications so far [7–11], but there is limited knowledge about the potential uses and limitations of Google Trends. Moreover, no agreed standards have been established so far for the appropriate use of this freely available search engine. A recent systematic review concluded that “Google Trends is being used to study health phenomena in a variety of topic domains in myriad ways, but poor documentation of methods precludes the reproducibility of the findings” [6].
Therefore, the aim of this study was to compare the reliability of Google Trends data in different clinical settings, in particular for some very common diseases with poor media coverage (i.e., low number of newspaper articles), as well as for other less common diseases attracting major media coverage (i.e., high number of newspaper articles).
2. Methods
Google Trends uses a fraction of searches for a specific term (“keyword” or “search term”), and then analyses the Google search outcome according to a given geographical location and a defined timeframe. A relative search volume (RSV, or Google Trends Index) is then assigned to the keyword, standardizing it from 0 to 100, where 100 represents the highest share of the term over a time series [6,12].
We carried out a search in Google Trends using the Italian equivalents to the English keywords “renal colic” (Italian: “colica renale”), “epistaxis” (Italian: “epistassi”) [along with “nose bleeding” (Italian: “sangue da naso”)], and “mushroom” (Italian: “funghi”) [along with “mushroom poisoning” (Italian: “intossicazione da funghi”)]. We selected these conditions because reliable epidemiological data, specifically associated to microclimate changes and seasonality, have been previously published, based on our Emergency Department (ED) epidemiology [13–15]. The web search was focused on the Parma Province in northern Italy, since the earlier data we have published specifically refers to this geographical area. The time limit of the Google Trends search matched exactly that of published epidemiological data, i.e., years 2002–2010 for renal colics, 2003–2012 for epistaxis and 2007–2016 for mushroom poisoning. The three clinical conditions have very poor media coverage, since no articles have been published in local media about these topics over the same period of time (see below). A second Google Trends search was then carried out for three additional clinical conditions [i.e., “meningitis” (Italian: “meningite”), “Legionella Pneumophila pneumonia” (Italian: “legionella”) and “Ebola fever” (Italian: Ebola)], which recently received large focus by the media. Poor or high media coverage was defined by systematically checking the on-line archives of local newspaper (Gazzetta di Parma) for local epidemiology (i.e., renal colic, epistaxis, mushroom poisoning), and the on-line archives of the local and the three main national newspapers (Corriere della Sera, Repubblica, and La Stampa) for the other topics (i.e., meningitis, Legionella, autism, vaccines, myocardial infarction, and influenza). Meningitis was found to be the most frequent healthcare topic covered by Italian newspapers in 2016, whereas Legionella Pneumophila pneumonia was found to be the most frequent healthcare topic covered in local newspapers (i.e., province of Parma, about 438.000 inhabitants, with an excellent internet connectivity, reaching up to 95% of the territory) in the year 2016, since a small outbreak of disease occurred in town, between September–October 2016. Ebola fever was also found to be one of the most covered topics in Italy during the year 2014 (i.e., the beginning of the African outbreak), despite the fact that the national epidemiological burden of disease was negligible. The entire year 2016 was searched for meningitis and Legionella Pneumophila pneumonia, and the entire year 2014 for Ebola virus fever.
3. Results
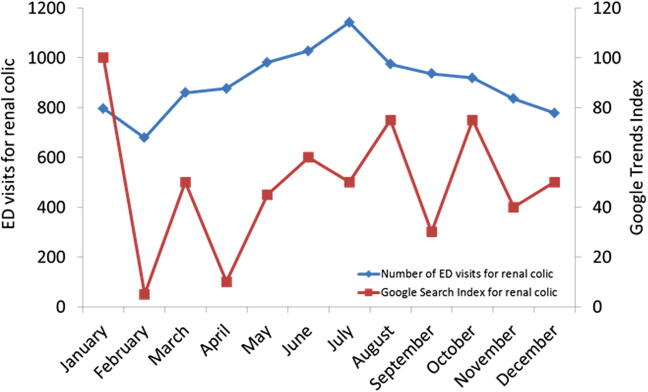
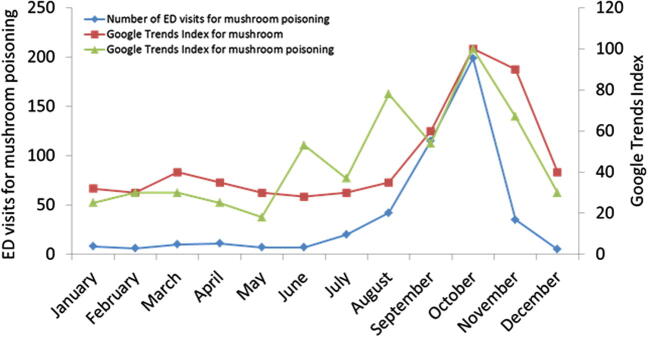
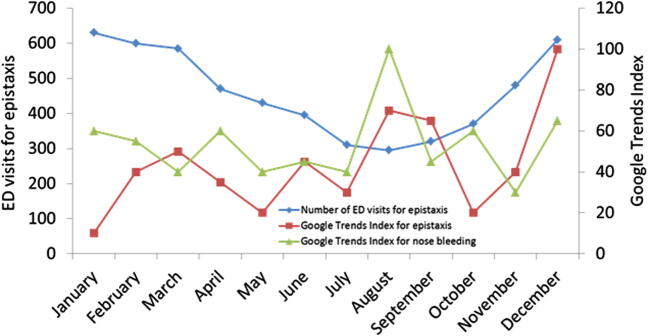
The main results of our study are shown in Figs. 1–3. A negligible overlap was observed between the seasonality of published data and Google Trends results for renal colics, epistaxis and mushroom poisoning (FigS. 1–3). Throughout the different years of analysis, the incidence of renal colics exhibited a considerable increase between May–August and a peak in July. Unlike this real epidemiology data, the information on renal colics obtained searching Google Trends did not show a significant seasonal pattern, but also showed remarkable differences from year to year, with no apparent correlation with local epidemiology information (Fig. 1). Unlike renal colics, the case of epistaxis displayed opposite seasonality in our province, with a peak between December and January. Even in this case Google Trends was not able to capture the true epidemiological pattern, displaying a large annual variability and a rather unpredictable outline (Fig. 2). Different results were obtained with “mushroom”. The Google Trends data displayed a seasonal pattern, almost overlapping with the real epidemiological profile. However, when the keyword “mushroom poisoning” used, Google Trends generated a considerably different pattern (Fig. 3). It is hence likely that the large media coverage for “mushroom” obtained from Google Trend was mostly attributable to information about harvesting and cooking rather than to real cases of mushrooms poisoning.
Fig. 1.
Number of renal colics seen in the ED, and average of Google Trends Index (referred to the Parma Province), calculated monthly, years 2007–2016.
Fig. 3.
Number of mushroom poisonings seen in the ED, and average of Google Trends Index (referred to the Parma Province) (double search, i.e., “mushrooms” and “mushroom poisoning”), calculated monthly, years 2007–2016.
Fig. 2.
Number of epistaxis episodes seen in the ED, and average of Google Trends Index (referred to the Parma Province) (double search, i.e., “epistaxis” and “nose bleeding”), calculated monthly, years 2007–2016.
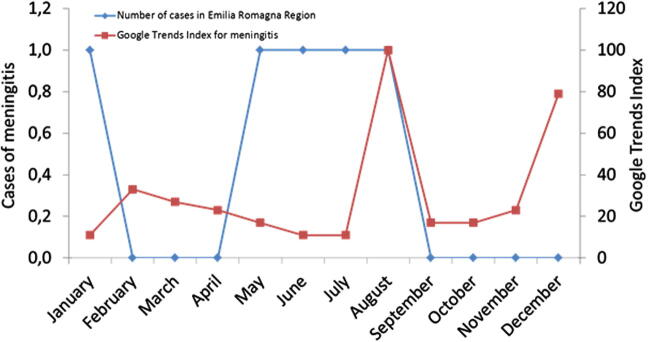
A fairly constant number of ∼190 cases/year of meningococcal meningitis have been recorded in Italy between the years 2011 and 2016, with a modestly increased trend in the Tuscany Region (2015: Tuscany 38 cases, followed by Lombardy, with 34 cases). Nevertheless, the media coverage of these cases was obsessive, often generating misleading information, since meningococcal meningitis was confused with other non-epidemic forms (i.e. Streptococcus Pneumoniae, Hemophilus). Notably, this also contributed to generate a paranoid and unjustified fear of travelling to Tuscany. This is clearly reflected by the peak of Google search data using the keyword “meningitis“ (Fig. 4).
Fig. 4.
Number of meningococcal meningitis in the Emilia Romagna Region, and average of Google Trends Index (referred to the Parma Province) (term “meningitis”), calculated monthly, year 2016.
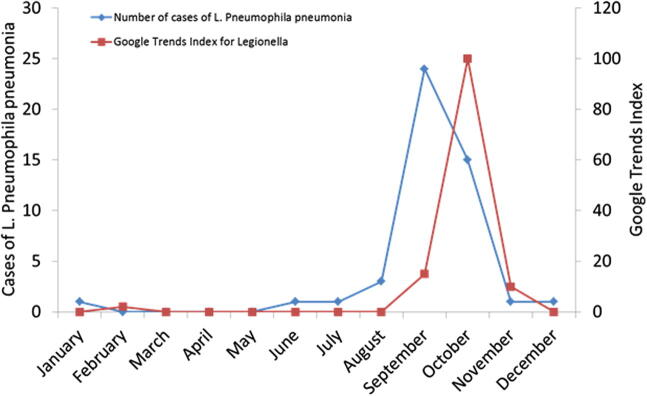
Despite an outbreak of only 41 cases (with 2 deaths in elderly patients, both with several comorbidities) of Legionella Pneumophila occurred in the Province of Parma (438.000 inhabitants) between September and October 2016, a considerable peak of data was generated by Google Trend using the keyword “Legionella“, coinciding with the weeks when the local media published an extraordinary number of articles on this small outbreak (Fig. 5). Even more surprisingly, when the local media published the news of a single case of meningitis due to Legionella Pneumophila pneumonia occurring in a small village of our Province (in February), a new peak of interest was evident in Google Trends.
Fig. 5.
Number of Legionella Pneumophila pneumonia in the Province of Parma, and average of Google Trends Index (referred to the Parma Province) (term “legionella”), calculated monthly, year 2016.
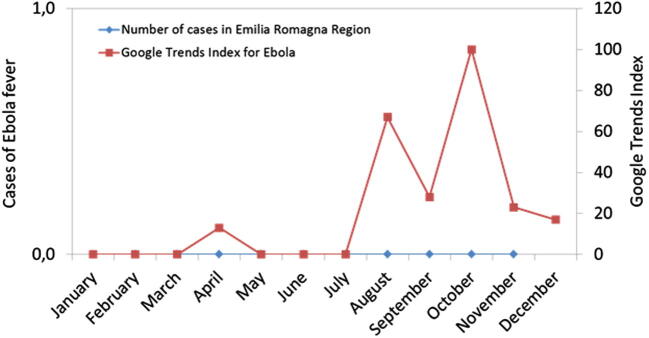
The data about the keywords “Ebola” are even more impressive. Although no single case has ever been recorded in Northern Italy, two peaks emerged from Google Trends, in August and October 2014, corresponding to the largest media coverage of the African epidemics. The Google Trends data failed to reflect the real geographical and temporary pattern of disease, also in this case (Fig. 6).
Fig. 6.
Number of Ebola virus fever in the Emilia Romagna region, and average of Google Trends Index (referred to the Parma Province) (term “Ebola”), calculated monthly, year 2014.
4. Discussion
The terms ‘infodemiology’ and ‘infoveillance’ were coined by Gunther Eysenbach, with the aim of describing a new approach for public health [16,17], based on web data monitoring and data mining, within the conceptual framework of the so-called e-health [18,19].
Despite the use of Google Trends has considerably increased in recent years for investigating the epidemiological trends of some specific diseases or groups of symptoms [6], the reliability of this approach remains largely speculative.
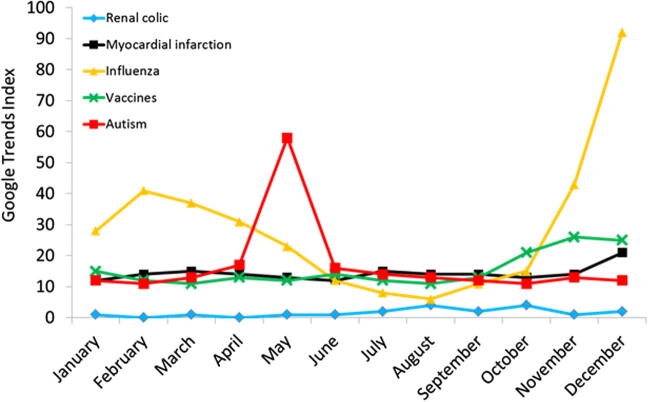
As for its functional algorithm, Google Trends assigns a relative search volume (RSV) comprised between 0 and 100 for a given keyword, where 100 represents the highest share of this keyword over time. This index is hence inherently arbitrary and not absolute [6,12]. For example, an index of “100” generated for “renal colic” when this keyword is searched alone in the year 2016 sharply decreases when the keywords “renal colic”, “myocardial infarction”, “vaccines”, “autism” and “influenza” are searched altogether over the same period of time. Notably, the output of the search term “autism” displays an amazing peak in May, which is obviously unrelated to the real epidemiology of disease, but is possibly due to the fact that April 2 is the world autism awareness day, thus generating transient media coverage. Only using the keyword “influenza” Google Trends and real epidemiology data apparently overlap (Fig 7).
Fig. 7.
Comparison of the average Google Trends Indexes for five different medical terms (i.e., renal colic, myocardial infarction, influenza, vaccines, and autism), Emilia Romagna Region, year 2016.
One important issue that emerges from this data is that Goggle Trends tends to underestimate the real epidemiological burden when the general public has poor knowledge of a given disease. For example, Google Trends underestimated the official surveillance statistics of flue during the first pandemic wave of H1N1 virus in the United States, but mirrored the real epidemiological pattern during the second wave, between the years 2009 and 2010 [20].
The search volumes of Google Trends are frequently found to be increased for conditions with large media coverage or, at least, during periods characterized by a higher burden of disease, so that they are gaining momentum in surveillance studies on several epidemiologically relevant diseases [6]. This is the case, for example, of Ebola fever, which fortunately did not directly involved European countries, but was the focus of large media coverage, so representing “a stew of fear” as defined by an editorial published in the New England Journal of Medicine [21].
It has also been recently suggested that media coverage of health-related news does not disclose costs, risks and conflicts of interest, but often overemphasizes benefits and exaggerates claims [22,23], thus supporting the concept that popular media may be sometimes detrimental rather than really useful for public health [24].
Taken together, the results of our study confirm that Google Trends has very modest reliability for delineating the true population epidemiology of relatively common diseases with poor media coverage or rarer diseases with large audience. Overall, Google Trends seems to be more influenced by media clamor than by the true epidemiological impact of disease, at least in the diseases examined here. Therefore, the real scientific usefulness of the so called “digital epidemiology” remains questionable, at least when using Google Trends.
Although mining the Web is an intriguing perspective, this source of information cannot be taken for granted or even replace the efforts of public health care organizations and clinicians for obtaining “real life” epidemiological data.
Footnotes
Peer review under responsibility of Ministry of Health, Saudi Arabia.
Conflict of interest
None declared.
References
- [1].Ekman A, Litton JE. New times, new needs; e-epidemiology. Eur J Epidemiol. 2007;22:285–92. doi: 10.1007/s10654-007-9119-0. [DOI] [PubMed] [Google Scholar]
- [2].Brownstein JS, Freifeld CC, Madoff LC. Digital disease detection–harnessing the Web for public health surveillance. N Engl J Med. 2009;360:2153–5. doi: 10.1056/nejmp0900702. [DOI] [PMC free article] [PubMed] [Google Scholar]
- [3].Salathé Ml, Bengtsson L, Bodnar TJ, et al. Digital epidemiology. PLoS Comput Biol. 2012;8:e1002616. doi: 10.1371/journal.pcbi.1002616. [DOI] [PMC free article] [PubMed] [Google Scholar]
- [4].Barrett-Connor E, Ayanian JZ, Brown ER, et al. A Nationwide framework for surveillance of cardiovascular and chronic lung diseases. Washington (DC): National Academies Press (US); 2011. [PubMed] [Google Scholar]
- [5].Google Google Trends. Available: < http://www.google.com/trends/>. [Accessed 2017 March 15].
- [6].Nuti SV, Wayda B, Ranasinghe I, et al. The Use of Google Trends in Health Care Research: A Systematic Review. PLoS ONE. 2014;9:e109583. doi: 10.1371/journal.pone.0109583. [DOI] [PMC free article] [PubMed] [Google Scholar]
- [7].Bakker KM, Martinez-Bakker ME, Helm B, et al. Digital epidemiology reveals global childhood disease seasonality and the effects of immunization. PNAS. 2016;113:6689–94. doi: 10.1073/pnas.1523941113. [DOI] [PMC free article] [PubMed] [Google Scholar]
- [8].Scheres LJJ, Lijfering WM, Middeldorp S, Cannegieter SC. Influence of World Thrombosis Day on digital information seeking on venous thrombosis: a Google Trends study. J Thromb Haemost. 2016;14:2325–8. doi: 10.1111/jth.13529. [DOI] [PubMed] [Google Scholar]
- [9].Breyer BN, Sen S, Aaronson DS, et al. Use of google insights for search to track seasonal and geographic kidney stone incidence in the United States. Urology. 2011;78:267–71. doi: 10.1016/j.urology.2011.10.037. [DOI] [PMC free article] [PubMed] [Google Scholar]
- [10].Hassid BG, Day LW, Awad MA. Using search engine query data to explore the epidemiology of common gastrointestinal symptoms. Dig Dis Sci. 2016;62:588–92. doi: 10.1007/s10620-016-4384-y. [DOI] [PubMed] [Google Scholar]
- [11].Seifter A, Schwarzwalder A, Geis K, et al. The utility of “Google Trends” for epidemiological research: lyme disease as an example. Geospat Health. 2010;4:135–7. doi: 10.4081/gh.2010.195. [DOI] [PubMed] [Google Scholar]
- [12].Choi H, Varian H. Predicting the present with google trends. Econ Record. 2012;88:2–9. doi: 10.1111/j.1475-4932.2012.00809.x. [DOI] [Google Scholar]
- [13].Cervellin G, Comelli I, Comelli D, et al. Mean temperature and humidity variations, along with patient age, predict the number of visits for renal colic in a large urban Emergency Department: Results of a 9-year survey. J Epidemiol Global Health. 2012;2:31–8. doi: 10.1016/j.jegh.2012.01.001. [DOI] [PMC free article] [PubMed] [Google Scholar]
- [14].Comelli I, Vincenti V, Benatti M, et al. Influence of air temperature variations on incidence of epistaxis. Am J Rhinol Allergy. 2015;29:1–7. doi: 10.2500/ajra.2015.29.4239. [DOI] [PubMed] [Google Scholar]
- [15].Cervellin G, Comelli I, Rastelli G, et al. Epidemiology and clinics of mushroom poisoning in a Province of Northern Italy: a 21-year retrospective analysis. Hum Exp Toxicol. 2017 doi: 10.1177/0960327117730882. HET-17-0164 [in press] [DOI] [PubMed] [Google Scholar]
- [16].Eysenbach G. Infodemiology and infoveillance: framework for an emerging set of public health informatics methods to analyze search, communication and publication behavior on the Internet. J Med Internet Res. 2009;11:e11. doi: 10.2196/jmir.1157. [DOI] [PMC free article] [PubMed] [Google Scholar]
- [17].Eysenbach G. Infodemiology and infoveillance. Am J Prev Med. 2011;40:S154–8. doi: 10.1016/j.amepre.2011.02.006. [DOI] [PubMed] [Google Scholar]
- [18].Burkow TM, Vognild LK, Krogstad T, et al. An easy to use and affordable home-based personal eHealth system for chronic disease management based on free open source software. Stud Health Technol Inform. 2008;136:83–8. [PubMed] [Google Scholar]
- [19].Giustini D. How Web 2.0 is changing medicine. BMJ. 2006;333:1283–4. doi: 10.1136/bmj.39062.555405.80. [DOI] [PMC free article] [PubMed] [Google Scholar]
- [20].Olson DR, Konty KJ, Paladini M, et al. Reassessing google flu trends data for detection of seasonal and pandemic influenza: a comparative epidemiological study at three geographic scales. PLoS Comput Biol. 2013;9:e1003256. doi: 10.1371/journal.pcbi.1003256. [DOI] [PMC free article] [PubMed] [Google Scholar]
- [21].Mitman G. Ebola in a stew of fear. N Engl J Med. 2014;371:1763–5. doi: 10.1056/nejmp1411244. [DOI] [PubMed] [Google Scholar]
- [22].Iaboli L, Caselli L, Filice A, et al. The unbearable lightness of health science reporting: a week examining Italian print media. PLoS One. 2010;5:e9829. doi: 10.1371/journal.pone.0009829. [DOI] [PMC free article] [PubMed] [Google Scholar]
- [23].Bubela TM, Caulfield TA. Do the print media “hype” genetic research? A comparison of newspaper stories and peer-reviewed research papers. CMAJ. 2004;170:1399–408. doi: 10.1503/cmaj.1030762. [DOI] [PMC free article] [PubMed] [Google Scholar]
- [24].The Lancet (Editorial) Does the media support or sabotage health? Lancet. 2009;373:604. doi: 10.1016/s0140-6736(09)60375-5. [DOI] [PubMed] [Google Scholar]


