Abstract
Motivation
Identifying the genes regulated by a given transcription factor (TF) (its ‘target genes’) is a key step in developing a comprehensive understanding of gene regulation. Previously, we developed a method (CisMapper) for predicting the target genes of a TF based solely on the correlation between a histone modification at the TF’s binding site and the expression of the gene across a set of tissues or cell lines. That approach is limited to organisms for which extensive histone and expression data are available, and does not explicitly incorporate the genomic distance between the TF and the gene.
Results
We present the T-Gene algorithm, which overcomes these limitations. It can be used to predict which genes are most likely to be regulated by a TF, and which of the TF’s binding sites are most likely involved in regulating particular genes. T-Gene calculates a novel score that combines distance and histone/expression correlation, and we show that this score accurately predicts when a regulatory element bound by a TF is in contact with a gene’s promoter, achieving median precision above 60%. T-Gene is easy to use via its web server or as a command-line tool, and can also make accurate predictions (median precision above 40%) based on distance alone when extensive histone/expression data is not available for the organism. T-Gene provides an estimate of the statistical significance of each of its predictions.
Availability and implementation
The T-Gene web server, source code, histone/expression data and genome annotation files are provided at http://meme-suite.org.
Supplementary information
Supplementary data are available at Bioinformatics online.
1 Introduction
The regulation of the transcription of many genes involves the looping of distal chromatin regions bound by transcription factors (TFs) to bring them into contact with the gene’s promoter (Farnham, 2009). This contact activates or inhibits the action of transcriptional machinery at the transcription start site (TSS) the gene. These TF-bound chromatin regions function as ‘regulatory elements’ (REs) in ways that are often unique to a specific cell type, condition, developmental stage or tissue. Defective binding of TFs to REs due to genomic mutations in the TF-binding sites [e.g. ‘regulatory SNPs’ (Macintyre et al., 2010)], or in the TF itself (Ilsley et al., 2017) can cause dysregulation of genes and pathological phenotypes. Because it is difficult and expensive to directly identify the condition-dependent regulatory targets of a TF, computational prediction methods are of great interest.
Our primary goal is to predict the condition-dependent target genes of a TF given the regions where it binds, as determined by an assay, such as ChIP-seq—chromatin immunoprecipitation followed by sequencing (Ouyang et al., 2009)—and given additional, auxiliary information. We previously described a method—CisMapper (O’Connor et al., 2017)—that used only the correlation between histone modifications and gene expression across a panel of tissues or cell types, and showed that it was more accurate than existing methods that use only the distance between the TF-binding site and the TSS of a gene. Our new computational method, T-Gene, combines distance and histone/expression correlation into a single score, and we show that it is substantially more accurate than CisMapper, makes more extensive predictions, produces calibrated statistical estimates and can be used with or without expression and histone data, making it much more widely applicable. Researchers can use T-Gene via its web server or as a downloadable command-line tool, both of which are part of the MEME Suite (found at http://meme-suite.org). When used with TF ChIP-seq peak regions, T-Gene predictions can help answer two questions of significant interest to biologists studying gene regulation. Specifically, T-Gene’s predictions tell the user which genes are most likely to be regulated by the TF, and which of the TF’s binding sites are involved in regulating particular genes.
2 Implementation
The input to T-Gene is a set of putative regulatory region coordinates (e.g. ChIP-seq peaks) for a given organism and an annotation file specifying the TSSes of all known transcripts for the organism, and, optionally, information on histone modification status and gene expression in the organism across a range of conditions. The putative regulatory regions are provided by the user as a BED file, such as are output by ChIP-seq peak-calling programs [e.g. MACS (Zhang et al., 2008)]. The T-Gene website provides the required annotation file for many organisms, as well as histone/expression information for human and mouse.
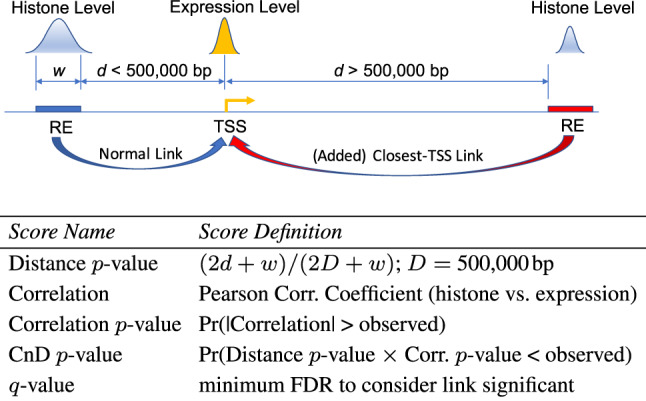
T-Gene constructs a putative regulatory ‘link’ for all (RE, TSS) pairs whose genomic distance satisfies the maximum distance constraint, D ( 500 000 bp by default). T-Gene defines the distance between an RE and a TSS as the distance between the TSS and the closest edge of the RE locus, or 0 if the RE locus overlaps the TSS. T-Gene labels each link as to whether it links the RE locus to its closest-TSS (CT link), links the TSS to its closest-RE locus (CL link) or both (Fig. 1). In the case where an RE or TSS would have no link due to the distance constraint, T-Gene adds a single link to the closest TSS or RE locus , respectively, assuring that every RE and every TSS has at least one link. T-Gene assigns up to five scores to each link (Fig. 1) and outputs its results as both an interactive HTML file and a tab-separated values file suitable for use with spreadsheet programs. The Supplementary Material gives further implementation details.
Fig. 1.

T-Gene link and score definitions. The picture shows a link that obeys the distance constraint d < D between the blue RE locus and the TSS. These links are output by T-Gene if they pass the significance threshold. The link between the red RE locus and the TSS does not obey the distance constraint but will be evaluated by T-Gene if it connects the RE locus to its closest TSS. Note that, the link on the left is also a ‘Closest-Locus’ link, and that a link may be a ‘Closest-TSS’ or ‘Closest-Locus’ link even if it obeys the distance threshold. If no histone/expression panel is provided, only the first and last scores are computed
3 Results
Here, we validate the regulatory links predicted by T-Gene using a set of chromatin contacts predicted by the promoter capture Hi-C (CHiC) assay in GM12878 cells (Mifsud et al., 2015). (In the Supplementary Material, we show further validation of T-Gene using eQTL data.) Our use of chromatin contact data for validating predicted regulatory links is based on the assumption that direct contact between a promoter and a distal chromatin region bound by a TF is required for the TF’s binding to affect expression of the gene. We say that a TF–TSS link predicted by T-Gene is ‘confirmed’ if the TF and TSS overlap the ‘other’ and ‘promoter’ regions in a CHiC chromatin contact. Precision is the fraction of the n best (or randomly chosen) predicted links that are confirmed as true, See the Supplementary Material for further details on our data sources, validation methods and results.
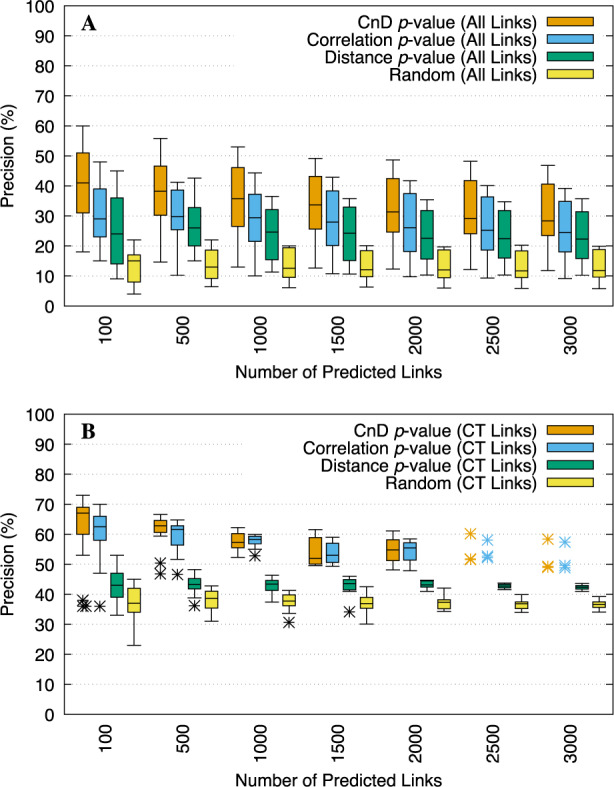
We run T-Gene on each of 23 GM12878 TF ChIP-seq datasets, using auxiliary histone/expression data from eight cell lines. The relative merits of three of T-Gene’s scoring functions are illustrated in Figure 2. Averaged over the 23 sets of predictions made by T-Gene, the accuracy of the top links is substantially greater when links are sorted by CnD P-value, which combines correlation and distance, compared to sorting links by the correlation (CisMapper’s approach) or Distance P-values (Fig. 2A). For example, the median precision for the top 500 links is ∼38% using CnD P-values, and <30% using the other two scores. For comparison, randomly chosen links have a precision of only about 13%.
Fig. 2.

Accuracy of T-Gene scores using the ENCODE eight-cell-line panel. Boxplots show the precision of the top links (A) or top CT links (B) predicted by T-Gene using the CnD, Correlation or Distance P-values, averaged over the 23 GM12878 TF ChIP-seq datasets. The accuracy of randomly selected links (A) or CT links (B) is shown for comparison (‘Random’)
T-Gene achieves substantially higher predictive accuracy when we combine its CT link filter with its scoring functions (see the Supplementary Material for details). For example, using CnD P-values and considering the top 500 links, the median precision for CT links is ∼64% (Fig. 2B) compared with 38% when we consider all predicted links (Fig. 2A).
Funding
This work was supported by the National Institutes of Health [R01 GM103544].
Conflict of Interest: none declared.
Supplementary Material
References
- Farnham P.J. (2009) Insights from genomic profiling of transcription factors. Nat. Rev. Genet., 10, 605–616. [DOI] [PMC free article] [PubMed] [Google Scholar]
- Ilsley M.D. et al. (2017) Krüppel-like factors compete for promoters and enhancers to fine-tune transcription. Nucleic Acids Res., 45, 6572–6588. [DOI] [PMC free article] [PubMed] [Google Scholar]
- Macintyre G. et al. (2010) is-rSNP: a novel technique for in silico regulatory SNP detection. Bioinformatics, 26, i524–i530. [DOI] [PMC free article] [PubMed] [Google Scholar]
- Mifsud B. et al. (2015) Mapping long-range promoter contacts in human cells with high-resolution capture Hi-C. Nat. Genet., 47, 598–606. [DOI] [PubMed] [Google Scholar]
- O’Connor T. et al. (2017) CisMapper: predicting regulatory interactions from transcription factor ChIP-seq data. Nucleic Acids Res., 45, e19. [DOI] [PMC free article] [PubMed] [Google Scholar]
- Ouyang Z. et al. (2009) ChIP-Seq of transcription factors predicts absolute and differential gene expression in embryonic stem cells. Proc. Natl. Acad. Sci. USA, 106, 21521–21526. [DOI] [PMC free article] [PubMed] [Google Scholar]
- Zhang Y. et al. (2008) Model-based analysis of ChIP-Seq (MACS). Genome Biol., 9, R137. [DOI] [PMC free article] [PubMed] [Google Scholar]
Associated Data
This section collects any data citations, data availability statements, or supplementary materials included in this article.


