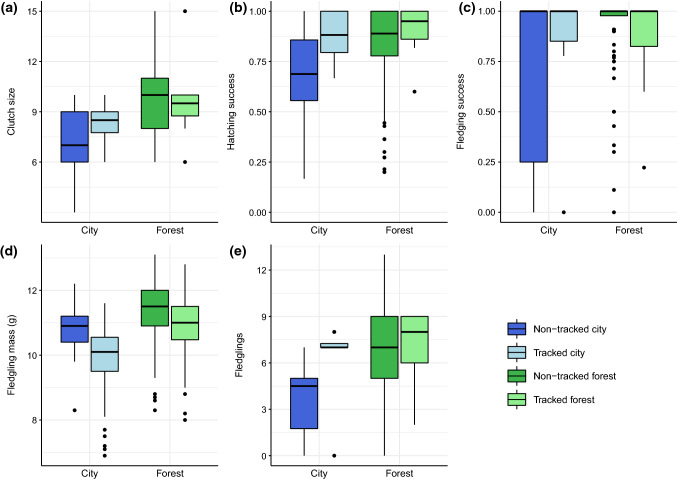
Fig. 3.
Breeding outcomes at the city (blue) and forest (green) sites. a Clutch size, b hatching success, c fledging success, d fledgling body mass, and e number of fledglings. Darker colours represent the non-tracked broods (n = 130), and lighter colours represent tracked broods (i.e. those used for telemetry and provisioning data; n = 16). The bold line within each box indicates the median value; the lower and upper limits of the boxes represent the second and third quartiles, respectively; and the lines extend to the farthest outliers within 1.5 times the interquartile range

