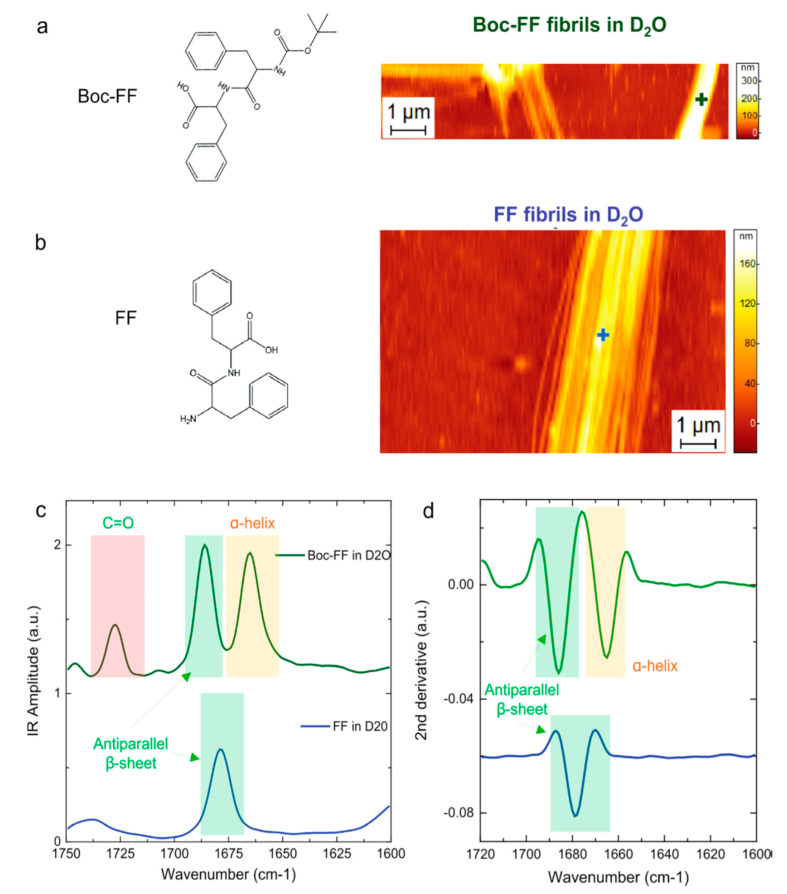
Figure 4.
PTIR structural comparison of FF and Boc-FF fibrils in D2O. Chemical structure and AFM morphology maps of (a) Boc-FF and (b) FF fibrils. (c) Comparison of the fibrils averaged PTIR spectra in the amide I (green and yellow) and C=O stretching vibration (red) spectra ranges. (d) Comparison of the second derivatives spectra in the amide band I region [72].

