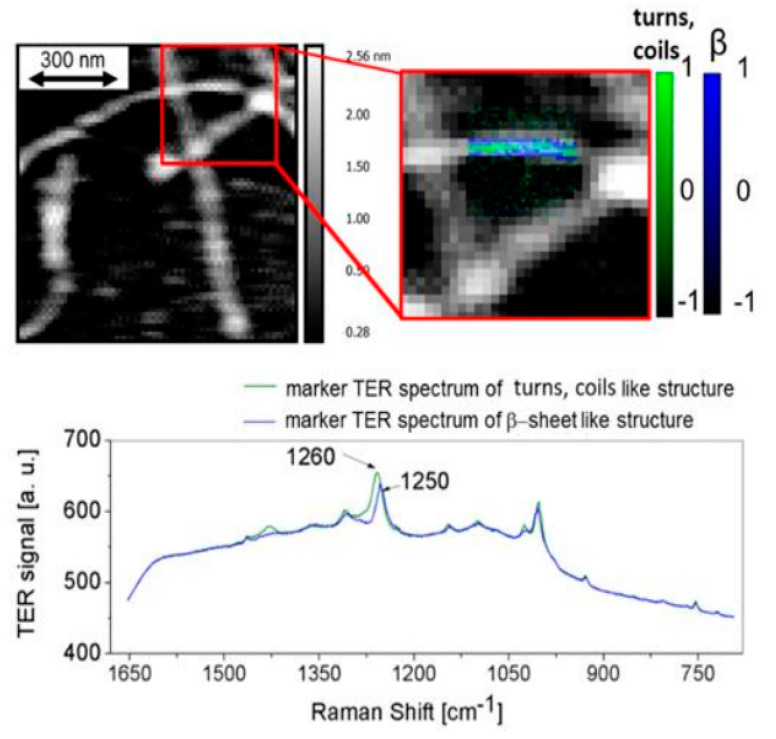
Figure 7.
AFM-TER mapping of Aβ1–42 fixed on gold: AFM topography with overlapped TERS map in zoomed area showing the distribution of β-sheets (blue) and turns/unstructured coils (green) with corresponding averaged TERS spectra, characteristic for both conformations; adapted with permission from [118].

