Abstract
目的
探讨阳性淋巴结比率(LNR)对判断食管癌患者预后的价值。
方法
选取2010年到2015年seer数据库中有完整临床病理资料的862例食管癌患者为研究对象,应用X-tile软件选取LNR的最佳截断点,在进行倾向性评分匹配(PSM)后,运用单因素和多因素COX比例风险模型探讨LNR在食管癌患者预后中的价值。
结果
X-tile 3.6.1软件筛选出LNR的最佳截断点为LNR < 0.16和LNR≥0.16。匹配前LNR < 0.16和LNR≥0.16两组患者的被检淋巴结数、病理类型、T分期和M分期差异有统计学意义;1:1匹配后,两组患者的临床资料和病理学指标差异均无统计学意义。匹配后的单因素和多因素COX回归分析结果显示,LNR、原发部位、M分期均是影响食管癌患者预后的独立危险因素,其中尤以LNR最为显著(LNR < 0.16 vs LNR≥0.16,HR= 1.827,95%CI:1.140~2.929,P=0.000)。LNR < 0.16组患者的中位生存时间为31个月(95%CI:22.556~39.444),LNR≥0.16组为16个月(95%CI:12.989~19.011),LNR < 0.16组患者的预后显著优于LNR≥0.16组,差异有显著统计学意义(Log Rank χ2= 27.392,P < 0.0001)。LNR和N分期对评估预后的准确性分析显示,LNR的ROC曲线下面积为0.617(95%CI:0.567~0.666),N分期的ROC曲线下面积为0.515(95%CI:0.463~0.565),LNR预测预后的价值明显优于N分期(z=3.008,P=0.0026)。
结论
LNR≥0.16是食管癌患者预后的独立危险因素,预后预测价值显著优于传统N分期。
Keywords: seer数据库, 阳性淋巴结比率, 食管癌, 预后
Abstract
Objective
To investigate the value of positive lymph node ratio (LNR) in predicting the prognosis of patients with esophageal cancer.
Methods
We retrieved the data of a total of 862 patients with esophageal cancer with complete clinical pathology data archived in SEER database in 2010 to 2015. The best cutoff point of LNR was selected using X-tile software. Univariate and multivariate COX proportional hazard models were used to assess the value of LNR in predicting the prognosis of patients after propensity score matching (PSM).
Results
The best cut-off point of LNR determined using X-tile 3.6.1 software was 0.16. The patients with LNR < 0.16 and those with LNR≥0.16 showed significant differences in the number of positive lymph nodes, pathological type, T stage and M stage. After 1:1 propensity score matching, the two groups showed no significant difference in the clinical data or pathological parameters. Matched univariate and multivariate COX regression analyses showed that LNR, primary tumor site and M staging were all independent risk factors affecting the prognosis of patients, and among them LNR had the most significant predictive value (LNR < 0.16 vs LNR≥0.16: HR=1.827, 95% CI: 1.140-2.929; P=0.000). The median survival time of patients with LNR < 0.16 was 31 months (95%CI: 22.556-39.444 months), as compared with 16 months (95%CI: 12.989-19.011) in patient with LNR≥0.16 (Log Rank χ2=27.392, P < 0.0001). LNR had a better accuracy than N stage for assessing the patients' prognosis with an area under the ROC curve of 0.617 (95%CI: 0.567-0.666), as compared with 0.515 (95%CI: 0.463-0.565) of N stage (z=3.008, P=0.0026).
Conclusions
LNR≥0.16 is an independent risk factor affecting the prognosis of patients with esophageal cancer and has better prognostic value than N stage.
Keywords: SEER database, positive lymph node ratio, esophageal cancer, prognosis
据最新全球癌症负担状况报告显示,食管癌发病率居第7位,死亡率居第6位[1]。我国是食管癌发病大国,据2019年国家癌症中心公布的最新数据,我国食管癌发病率居第6位,而死亡率高居第4位,仅次于肺癌、肝癌和胃癌[2]。淋巴结转移是影响食管癌患者预后的重要因素之一,并且多项研究表明阳性淋巴结比率(LNR)在预测胃癌、直肠癌、甲状腺癌等多种肿瘤患者预后中更具优势[3-6]。然而之前的研究多集中在胃癌、直肠癌、甲状腺癌等肿瘤,食管癌较少。尽管鲁建亮[3]涉及了对食管癌阳性淋巴结个数的研究,但该研究以及之前所述的阳性淋巴结比率在其他肿瘤中的研究多是只用ROC进行的截断点选取,或者直接参照其他肿瘤中阳性淋巴结比率的截断点,前者没有考虑时序性,后者不同肿瘤又存在明显差异性。因此,本研究运用目前科学的PSM和X-tile统计学方法再加上更大的样本量进行研究分析,更加严谨科学。本研究分析862例食管癌患者的临床病理资料,旨在探讨LNR对食管癌患者预后的价值。
1. 资料和方法
1.1. 一般资料
提取seer数据库2010年1月1日~2015年12月31日被诊断为食管癌的患者为研究对象,随访截止日期为2016年12月31日。纳入和排除标准:筛选标准为患者年龄≤85岁,排除随访时间缺失,临床病理资料不明确、合并有其他肿瘤者且生存时间小于1个月者。共提取出862例符合要求的研究对象,其中男性716例,女性146例。患者组织学类型以ICD-O-3为分类标准。本文共纳入性别、年龄、肿瘤大小、被检淋巴结数、LNR(阳性淋巴结比率)(=淋巴结阳性个数/被检淋巴结个数)、原发部位、肿瘤分级、病理类型、T分期、N分期、M分期、人种等临床相关因素进行分析。
1.2. 统计学方法
本文采用R 3.6.1、X- tile 3.6.1、medcalc和SPSS 21.0统计学软件进行统计分析。其中X-tile 3.6.1用来选取连续型变量的最佳截断点;生存曲线的绘制采用R语言的survminer包进行绘制,倾向性评分匹配(PSM)以及图形的绘制采用R语言的nonrandom包和tableone包完成,其中卡钳值设置为0.02,以1:1进行匹配;使用SPSS 21.0进行单因素和多因素COX回归分析,使用medcalc软件对预后价值进行对比分析。P < 0.05为显著性差异。
2. 结果
2.1. 最佳截断点的选择
使用X-tile 3.6.1软件筛选最佳截断点,其中LNR的最佳截断点为LNR < 0.16和LNR≥0.16,年龄≤72岁和≥73岁,肿瘤大小为≤72 mm和≥73 mm,被检淋巴结数为≤8个和≥9个(图 1为LNR最佳截断点的计算结果,其它略)。
1.

LNR最佳截断点的选择
Selection of the best cut-off point for LNR. A: The colors of the plot represent the strength of correlation, ranging from low (dark, black) to high (green or red). An indirect correlation between a factor and the patients' survival is colored red, and a positive correlation colored green. B: Histogram showing the optimal cutoff point; C: Kaplan-Meier curve corresponding to the cutoff point
2.2. LNR的PSM匹配结果
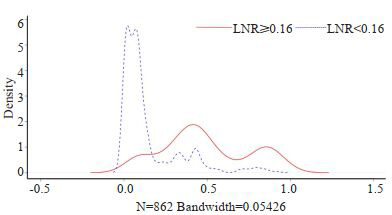
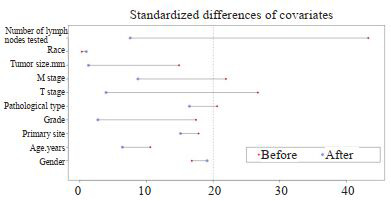
匹配前,LNR < 0.16纳入674例,LNR≥0.16组纳入188例患者,倾向性评分曲线图显示两组评分分布差异大(图 2),两组患者的被检淋巴结数、病理类型、T分期和M分期差异有统计学意义(表 1);1:1匹配后,LNR < 0.16组和LNR≥0.16组各纳入188例患者,单变量标准差散点图示各协变量对应点均落在虚线左侧,说明各变量达到均衡,匹配良好(图 3),两组患者的临床资料和病理学指标差异均无统计学意义(表 1)。
2.

匹配前倾向性评分密度曲线图
Tendency score density curve before matching
1.
倾向性评分匹配前后两组患者临床资料的对比
Comparison of clinical data between the two groups before and after propensity score matching (PSM)
| Variable | Before | After | |||||
| LNR (n) | P | LNR (n) | P | ||||
| < 0.16 (674) | ≥0.16 (188) | < 0.16 (674) | ≥0.16 (188) | ||||
| Gender | 0.067 | 0.089 | |||||
| Male | 551 | 165 | 152 | 165 | |||
| Female | 123 | 23 | 36 | 23 | |||
| Age (year) | 0.232 | 0.643 | |||||
| ≤72 | 604 | 162 | 166 | 162 | |||
| ≥73 | 70 | 26 | 22 | 26 | |||
| Tumor size (mm) | 0.079 | 1.000 | |||||
| ≤72 | 563 | 146 | 147 | 146 | |||
| ≥73 | 111 | 42 | 41 | 42 | |||
| Number of lymph nodes tested | < 0.001 | 0.531 | |||||
| ≤8 | 141 | 76 | 83 | 76 | |||
| ≥9 | 533 | 112 | 105 | 112 | |||
| Primary site | 0.160 | 0.266 | |||||
| Cervical esophagus | 2 | 0 | |||||
| Upper third of esophagus | 9 | 3 | 2 | 3 | |||
| Middle third of esophagus | 93 | 14 | 19 | 14 | |||
| Lower third of esophagus | 525 | 152 | 157 | 152 | |||
| Abdominal esophagus | 7 | 2 | 2 | 2 | |||
| Overlapping lesion of esophagus | 22 | 12 | 3 | 12 | |||
| Thoracic esophagus | 16 | 5 | 5 | 5 | |||
| Grade | 0.094 | 0.314 | |||||
| Ⅰ | 30 | 8 | 5 | 8 | |||
| Ⅱ | 303 | 68 | 73 | 68 | |||
| Ⅲ | 333 | 107 | 109 | 107 | |||
| Ⅳ | 8 | 5 | 1 | 5 | |||
| Pathological type | 0.006 | 0.226 | |||||
| Squamous cell carcinoma | 157 | 24 | 36 | 24 | |||
| Adenocarcinoma | 456 | 147 | 138 | 147 | |||
| Others | 61 | 17 | 14 | 17 | |||
| T stage | 0.006 | 0.522 | |||||
| T1 | 64 | 12 | 8 | 12 | |||
| T2 | 121 | 19 | 21 | 19 | |||
| T3 | 451 | 138 | 146 | 138 | |||
| T4 | 38 | 19 | 13 | 19 | |||
| M stage | 0.004 | 0.527 | |||||
| M0 | 656 | 174 | 178 | 174 | |||
| M1 | 18 | 14 | 10 | 14 | |||
| Race | 0.992 | 0.927 | |||||
| White | 598 | 167 | 165 | 167 | |||
| Black | 35 | 10 | 13 | 10 | |||
| Asian | 35 | 9 | 8 | 9 | |||
| Others | 6 | 2 | 2 | 2 | |||
3.

匹配后单变量标准差散点图
Univariate standard deviation scatter plot after matching
2.3. 单因素和多因素cox回归分析
PSM评价后的单因素和多因素cox回归分析结果显示,LNR、原发部位、M分期均是影响食管癌患者预后的独立危险因素,其中尤以LNR最为显著(LNR < 0.16 vs LNR≥ 0.16,HR=1.827,95%CI:1.140~2.929,P=0.000,表 2)。
2.
PSM评价后的单因素和多因素COX回归分析
Univariate and multivariate COX regression analysis after PSM evaluation
| Variable | cases (n) | Univariate | Multivariate | |||||
| P | HR | 95%CI | P | HR | 95%CI | |||
| Gender | 0.131 | |||||||
| Male | 317 | |||||||
| Female | 59 | 0.750 | 0.517~1.089 | |||||
| Age (year) | 0.696 | |||||||
| ≤72 | 328 | |||||||
| ≥73 | 48 | 1.076 | 0.745~1.553 | |||||
| Primary site | 0.004 | 0.009 | ||||||
| Upper third of esophagus | 5 | |||||||
| Middle third of esophagus | 33 | 1.034 | 0.311~3.435 | 0.997 | 0.300~3.310 | |||
| Lower third of esophagus | 309 | 1.034 | 0.311~3.435 | 0.997 | 0.300~3.310 | |||
| Abdominal esophagus | 4 | 4.199 | 0.932~18.924 | 3.182 | 0.705~14.361 | |||
| Overlapping lesion of esophagus | 15 | 1.153 | 0.321~4.142 | 0.864 | 0.240~3.118 | |||
| Thoracic esophagus | 10 | 0.484 | 0.115~2.033 | 0.445 | 0.106~1.871 | |||
| Grade | 0.410 | |||||||
| Ⅰ | 13 | |||||||
| Ⅱ | 141 | 0.757 | 0.394~1.455 | |||||
| Ⅲ | 216 | 0.821 | 0.432~1.560 | |||||
| Ⅳ | 6 | 1.531 | 0.522~4.489 | |||||
| Pathological type | 0.992 | |||||||
| Squamous cell carcinoma | 60 | |||||||
| Adenocarcinoma | 285 | 0.985 | 0.700~1.386 | |||||
| Others | 31 | 0.968 | 0.565~1.656 | |||||
| T stage | 0.089 | |||||||
| T1 | 20 | |||||||
| T2 | 40 | 0.788 | 0.384~1.619 | |||||
| T3 | 284 | 1.129 | 0.614~2.074 | |||||
| T4 | 32 | 1.649 | 0.807~3.372 | |||||
| M stage | 0.015 | 0.012 | 1.827 | 1.140~2.929 | ||||
| M0 | 352 | |||||||
| M1 | 24 | 1.792 | 1.121~2.865 | |||||
| Tumor size (mm) | 0.230 | |||||||
| ≤72 | 293 | |||||||
| ≥73 | 83 | 1.197 | 0.892~1.607 | |||||
| Race | 0.391 | |||||||
| White | 332 | |||||||
| Black | 23 | 1.471 | 0.930~2.327 | |||||
| Asian | 17 | 0.938 | 0.481~1.831 | |||||
| Others | 4 | 1.417 | 0.352~5.708 | |||||
| LNR | 0.000 | 0.000 | 1.827 | 1.140~2.929 | ||||
| < 0.16 | 188 | |||||||
| ≥0.16 | 188 | 1.917 | 1.917 | |||||
| Number of lymph nodes tested | 0.216 | |||||||
| ≤8 | 159 | 0.854 | 0.665~1.097 | |||||
| ≥9 | 217 | |||||||
2.4. LNR对预后的影响及与N分期预后预测价值的对比
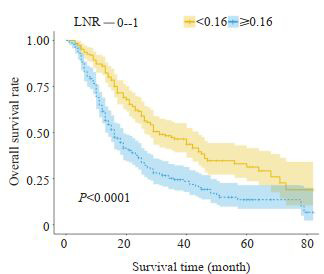
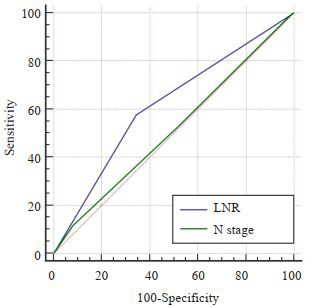
LNR < 0.16组患者的中位生存时间为31个月(95%CI:22.556~39.444),LNR≥0.16组为16个月(95% CI:12.989~19.011),LNR < 0.16组患者的预后显著优于LNR≥0.16组,差异有显著统计学意义(Log Rank χ2= 27.392,P < 0.0001),生存曲线见图 4。LNR和N分期对评估预后的准确性分析显示,LNR的ROC曲线下面积为0.617(95%CI:0.567~0.666),N分期的ROC曲线下面积为0.515(95%CI:0.463~0.565),LNR预测与后的价值明显优于N分期,差异有统计学意义(Z=3.008,P= 0.0026,图 5)。
4.

两组患者的生存曲线
Survival curves of the two groups of patients
5.

LNR与N分期预后预测价值的对比
Comparison of the prognostic value of LNR and N staging
3. 讨论
食管癌的发病率和死亡率逐年攀升,70%左右的食管癌患者首诊即为晚期,丧失手术根治机会[7-8]。近20年来,晚期食管癌的治疗无明显进步,无标准的二线治疗方案,中位生存时间仍约10个月左右[9-10]。积极寻找影响食管癌患者预后的危险因素,提高患者生存率仍是临床上亟待解决的问题[11-12]。
目前临床普遍采用国际抗癌联盟(UICC)/美国癌症联合会(AJCC)联合制定的TNM分期系统进行淋巴结病理分期[13-14]。该方法是根据转移淋巴结数目进行分期,但并未考虑清扫淋巴结总数,当淋巴结清扫数目不足时则可能漏检已转移的淋巴结,因此在评估预后方面存在一定的局限性。LNR即淋巴结转移阳性数占清扫淋巴结总数的百分率,其被认为在食管癌等多种肿瘤中评估患者预后方面的价值优于淋巴结转移状态,然而,目前对食管癌阳性淋巴结比率多是只用ROC进行的截断点选取,或者直接照搬其他肿瘤中阳性淋巴结比率的截断点,前者没有考虑时序性,后者不同肿瘤又存在明显差异性。因此,本研究运用目前科学的PSM和X-tile统计学方法再加上更大的样本量进行研究分析,更加严谨科学[15-17]。此外,鲁建亮[3]研究的为阳性淋巴结对数比,本文为阳性淋巴结比率,计算方法不一样,还有该学者对截断点的选取方法是间隔逐步分析法,也没有运用PSM法。因此研究内容基本不一致。本文的创新点即文章中所运用的统计学方法使结果更加合理科学,且研究结果也表明本文所选择的截断点的临床价值相比于N分期也更大。
X-tile的使用目的与ROC曲线相似,通过寻找最佳的截断点,从而参考某一截断点得出合理临床数据,但其在统计分析时纳入了时间因素,因此结果更加合理、准确[18-20]。倾向性评分匹配是近年国内外广泛应用的统计学方法,是指特定研究对象在特定协变量条件下,接受某种处理的可能性[21-23]。倾向性评分匹配能够有效消除潜在混杂因素产生的潜在偏倚,倾向评分值调整后,除了处理因素和结局变量分布差异外,其它协变量都均衡可比,从而利用非随机分组数据研究试验因素和结局之间的关系,得出可信度更高的研究结果[24]。本文通过X-tile软件选择0.16为LNR最佳的截断点,使用倾向性评分匹配对LNR < 0.16和LNR≥0.16两组患者进行筛选后各入组188例,匹配前两组患者的被检淋巴结数、病理类型、T分期和M分期差异有统计学意义,匹配后两组患者的临床资料和病理学指标差异均无统计学意义,说明消除混杂因素影响后LNR≥0.16确实是影响食管癌患者预后的独立危险因素。另外,LNR < 0.16组患者的预后显著优于LNR≥0.16组,差异有显著统计学意义(Log Rank χ2=27.392,P < 0.0001);LNR ROC曲线下面积大于N分期,说明其预测预测价值明显优于AJCC 7版N分期,差异有统计学意义(z=3.008,P=0.0026)。该结论与国内外相关研究结果基本一致[25-28]。Wei C等[15]以496例食管癌根治性切除术患者为研究对象,单因素分析显示病变部位,肿瘤长度,肿瘤浸润深度,pN和LNR影响预后,多因素分析显示肿瘤浸润深度,pN和LNR是独立的危险因素;ROC分析表明与pN相比,LNR具有更好的预测价值(z=2.275,P=0.029)。ShaoYJ等[29]回顾性分析916例食管癌根治性切除术患者的临床资料,Cox回归分析表明LNR是影响总生存率的独立危险因素,其认为基于LNR的改良分期系统具有很好的预后评价价值。赵芳[30]选择380例行根治术的胸段食管鳞癌患者,结果表明LNR为影响食管癌患者预后的独立预后因素,其评估预后的价值优于pN分期。
综上所述,LNR充分考虑了阳性淋巴结个数和被检淋巴结总数对食管癌患者预后的影响,是一种极具潜力的预后指标,LNR≥0.16是食管癌患者预后的独立危险因素,预后预测价值显著优于传统N分期,临床治疗决策制定时应重视该指标。
Biography
姚文柱,博士,副院长,E-mail: 670868873@qq.com
Funding Statement
陕西省教育厅专项项目(19JK0765)
Contributor Information
姚 文柱 (Wenzhu YAO), Email: 670868873@qq.com.
张 明鑫 (Mingxin ZHANG), Email: zmx3115@163.com.
References
- 1.Bray F, Ferlay J, Soerjomataram I, et al. Global cancer statistics 2018: GLOBOCAN estimates of incidence and mortality worldwide for 36 cancers in 185 countries. CA Cancer J Clin. 2018;68(6):394–424. doi: 10.3322/caac.21492. [Bray F, Ferlay J, Soerjomataram I, et al. Global cancer statistics 2018: GLOBOCAN estimates of incidence and mortality worldwide for 36 cancers in 185 countries[J]. CA Cancer J Clin, 2018, 68(6): 394-424.] [DOI] [PubMed] [Google Scholar]
- 2.郑 荣寿, 孙 可欣, 张 思维, et al. 2015年中国恶性肿瘤流行情况分析. http://d.old.wanfangdata.com.cn/Periodical/zhzl201901008. 中华肿瘤杂志. 2019;41(1):19–28. doi: 10.3760/cma.j.issn.0253-3766.2019.01.005. [郑荣寿, 孙可欣, 张思维, 等. 2015年中国恶性肿瘤流行情况分析[J].中华肿瘤杂志, 2019, 41(1):19-28.] [DOI] [PubMed] [Google Scholar]
- 3.鲁 建亮, 宋 昕, 赵 学科, et al. 阳性淋巴结对数比对食管鳞癌患者术后生存期的影响. http://d.old.wanfangdata.com.cn/Periodical/zlxzz201806011. 肿瘤学杂志. 2018;24(6):580–6. [鲁建亮, 宋昕, 赵学科, 等.阳性淋巴结对数比对食管鳞癌患者术后生存期的影响[J].肿瘤学杂志, 2018, 24(6): 580-6.] [Google Scholar]
- 4.Lee CW, Wilkinson KH, Sheka AC, et al. The log odds of positive lymph nodes stratifies and predicts survival of high-risk individuals among stage III rectal cancer patients. http://www.wanfangdata.com.cn/details/detail.do?_type=perio&id=972c5be3cd30b37242c3bf12f1e655ae. Oncologist. 2016;21(4):425–32. doi: 10.1634/theoncologist.2015-0441. [Lee CW, Wilkinson KH, Sheka AC, et al. The log odds of positive lymph nodes stratifies and predicts survival of high-risk individuals among stage III rectal cancer patients[J]. Oncologist, 2016, 21(4):425-32.] [DOI] [PMC free article] [PubMed] [Google Scholar]
- 5.Qu N, Shi RL, Lu ZW, et al. Metastatic lymph node ratio can further stratify risk for mortality in medullary thyroid cancer patients: a population-based analysis. Oncotarget. 2016;7(40):65937–45. doi: 10.18632/oncotarget.11725. [Qu N, Shi RL, Lu ZW, et al. Metastatic lymph node ratio can further stratify risk for mortality in medullary thyroid cancer patients: a population-based analysis [J]. Oncotarget, 2016, 7(40): 65937-45.] [DOI] [PMC free article] [PubMed] [Google Scholar]
- 6.Liu P, Zhang XB, Shang YR, et al. Lymph node ratio, but not the total number of examined lymph nodes or lymph node metastasis, is a predictor of overall survival for pancreatic neuroendocrine neoplasms after surgical resection. Oncotarget. 2017;8(51):89245–55. doi: 10.18632/oncotarget.19184. [Liu P, Zhang XB, Shang YR, et al. Lymph node ratio, but not the total number of examined lymph nodes or lymph node metastasis, is a predictor of overall survival for pancreatic neuroendocrine neoplasms after surgical resection[J]. Oncotarget, 2017, 8(51): 89245-55.] [DOI] [PMC free article] [PubMed] [Google Scholar]
- 7.Voncken FEM, van der Kaaij RT, Sikorska K, et al. Advanced age is not a contraindication for treatment with curative intent in esophageal cancer. Am J Clin Oncol. 2017;41(9):1. doi: 10.1097/coc.0000000000000390. [Voncken FEM, van der Kaaij RT, Sikorska K, et al. Advanced age is not a contraindication for treatment with curative intent in esophageal cancer [J]. Am J Clin Oncol, 2017, 41(9): 1.] [DOI] [PubMed] [Google Scholar]
- 8.Shi YJ, Chen Y, Li XT, et al. Multidetector CT for restaging locally advanced esophageal squamous cell carcinoma and assessing therapeutic response to neoadjuvant chemotherapy. http://www.wanfangdata.com.cn/details/detail.do?_type=perio&id=zgyxkxyxb201701022. Zhongguo Yi Xue Ke Xue Yuan Xue Bao. 2017;39(1):133–9. doi: 10.3881/j.issn.1000-503X.2017.01.022. [Shi YJ, Chen Y, Li XT, et al. Multidetector CT for restaging locally advanced esophageal squamous cell carcinoma and assessing therapeutic response to neoadjuvant chemotherapy[J]. Zhongguo Yi Xue Ke Xue Yuan Xue Bao, 2017, 39(1): 133-9.] [DOI] [PubMed] [Google Scholar]
- 9.Borggreve AS, Kingma BF, Domrachev SA, et al. Surgical treatment of esophageal cancer in the era of multimodality management. Ann N Y Acad Sci. 2018;1434(1):192–209. doi: 10.1111/nyas.13677. [Borggreve AS, Kingma BF, Domrachev SA, et al. Surgical treatment of esophageal cancer in the era of multimodality management [J]. Ann N Y Acad Sci, 2018, 1434(1): 192-209.] [DOI] [PubMed] [Google Scholar]
- 10.Nishida N, Yamsaki M, Odagiri K, et al. Combination therapy with S-1, oxaliplatin and leucovorin in patients with advanced esophageal squamous cell carcinoma. In Vivo. 2019;33(6):2249–54. doi: 10.21873/invivo.11730. [Nishida N, Yamsaki M, Odagiri K, et al. Combination therapy with S-1, oxaliplatin and leucovorin in patients with advanced esophageal squamous cell carcinoma[J]. In Vivo, 2019, 33(6): 2249-54.] [DOI] [PMC free article] [PubMed] [Google Scholar]
- 11.Wu N, Pang LW, Chen ZM, et al. Tumour length is an independent prognostic factor of esophageal squamous cell carcinomas. http://www.wanfangdata.com.cn/details/detail.do?_type=perio&id=zhcmj201224023. Chin Med J. 2012;125(24):4445–8. [Wu N, Pang LW, Chen ZM, et al. Tumour length is an independent prognostic factor of esophageal squamous cell carcinomas[J]. Chin Med J, 2012, 125(24): 4445-8.] [PubMed] [Google Scholar]
- 12.Treatments an outcomes of older patients with esophageal cancer: Comparison with younger patients[J]. Mol Clin Oncol, 2019, 11(4): 383-9.10.3892/mco.2019.1909
- 13.Kim SH, Jung KH, Kim TY, et al. Prognostic value of axillary nodal ratio after neoadjuvant chemotherapy of doxorubicin/eyclophosphamide followed by docetaxel in breast cancer:a multicenter retrospective cohort study. https://pubmed.ncbi.nlm.nih.gov/27034147/ Cancer Res Treat. 2016;48(4):1373–81. doi: 10.4143/crt.2015.475. [Kim SH, Jung KH, Kim TY, et al. Prognostic value of axillary nodal ratio after neoadjuvant chemotherapy of doxorubicin/eyclophosphamide followed by docetaxel in breast cancer:a multicenter retrospective cohort study[J]. Cancer Res Treat, 2016, 48(4): 1373-81.] [DOI] [PMC free article] [PubMed] [Google Scholar]
- 14.Soran A, Ozmen T, Salamat A, et al. Lymph Node Ratio (LNR): Predicting Prognosis after Neoadjuvant Chemotherapy (NAC) in Breast Cancer Patients. http://d.old.wanfangdata.com.cn/Periodical/zgwcwkzz201104006. Eur J Breast Health. 2019;15(4):249–55. doi: 10.5152/ejbh.2019.4848. [Soran A, Ozmen T, Salamat A, et al. Lymph Node Ratio (LNR): Predicting Prognosis after Neoadjuvant Chemotherapy (NAC) in Breast Cancer Patients [J]. Eur J Breast Health, 2019, 15(4): 249-55.] [DOI] [PMC free article] [PubMed] [Google Scholar]
- 15.Wei C, Deng WY, Li N, et al. Lymph node ratio as an alternative to the number of metastatic lymph nodes for the prediction of esophageal carcinoma patient survival. http://www.wanfangdata.com.cn/details/detail.do?_type=perio&id=3e66e25a156745d52df92731a7fc6ab3. Dig Dis Sci. 2015;60(9):2771–6. doi: 10.1007/s10620-015-3681-1. [Wei C, Deng WY, Li N, et al. Lymph node ratio as an alternative to the number of metastatic lymph nodes for the prediction of esophageal carcinoma patient survival [J]. Dig Dis Sci, 2015, 60(9): 2771-6.] [DOI] [PubMed] [Google Scholar]
- 16.Wang NN, Jia YB, Wang JB, et al. Prognostic significance of lymph node ratio in esophageal cancer. Tumour Biol. 2015;36(4):2335–41. doi: 10.1007/s13277-014-2840-x. [Wang NN, Jia YB, Wang JB, et al. Prognostic significance of lymph node ratio in esophageal cancer [J]. Tumour Biol, 2015, 36(4): 2335-41.] [DOI] [PubMed] [Google Scholar]
- 17.Parnaby CN, Scott NW, Ramsay G, et al. Prognostic value of lymph node ratio and extramural vascular invasion on survival for patients undergoing curative colon cancer resection. http://www.wanfangdata.com.cn/details/detail.do?_type=perio&id=7f4988d357963da05ceb58d71d17cb88. Br J Cancer. 2015;113(2):212–9. doi: 10.1038/bjc.2015.211. [Parnaby CN, Scott NW, Ramsay G, et al. Prognostic value of lymph node ratio and extramural vascular invasion on survival for patients undergoing curative colon cancer resection[J]. Br J Cancer, 2015, 113(2): 212-9.] [DOI] [PMC free article] [PubMed] [Google Scholar]
- 18.Camp RL, Dolled-Filhart M, Rimm DL. X-tile: a new bioinformatics tool for biomarker assessment and outcome-based cutpoint optimization. http://d.old.wanfangdata.com.cn/NSTLQK/NSTL_QKJJ0235085493/ Clin Cancer Res. 2004;10(21):7252–9. doi: 10.1158/1078-0432.CCR-04-0713. [Camp RL, Dolled-Filhart M, Rimm DL. X-tile: a new bioinformatics tool for biomarker assessment and outcome-based cutpoint optimization[J]. Clin Cancer Res, 2004, 10(21): 7252-9.] [DOI] [PubMed] [Google Scholar]
- 19.Sun HL, He BS, Nie ZL, et al. A nomogram based on serum bilirubin and albumin levels predicts survival in gastric cancer patients. Oncotarget. 2017;8(25):41305–18. doi: 10.18632/oncotarget.17181. doi: 10.18632/oncotarget.17181. [Sun HL, He BS, Nie ZL, et al. A nomogram based on serum bilirubin and albumin levels predicts survival in gastric cancer patients [J]. Oncotarget, 2017, 8(25): 41305-18.] [DOI] [PMC free article] [PubMed] [Google Scholar]
- 20.Li XX, Lu H, Xu K, et al. Negative lymph node count is an independent prognostic factor for patients with rectal cancer who received preoperative radiotherapy. BMC Cancer. 2017;17(1):227. doi: 10.1186/s12885-017-3222-8. [Li XX, Lu H, Xu K, et al. Negative lymph node count is an independent prognostic factor for patients with rectal cancer who received preoperative radiotherapy[J]. BMC Cancer, 2017, 17(1): 227.] [DOI] [PMC free article] [PubMed] [Google Scholar]
- 21.Nian H, Yu C, Ding J, et al. Performance evaluation of propensity score methods for estimating average treatment effects with multilevel treatments. https://www.tandfonline.com/doi/abs/10.1080/02664763.2018.1523375. J Appl Stat. 2019;46(5):853–873. doi: 10.1080/02664763.2018.1523375. [Nian H, Yu C, Ding J, et al. Performance evaluation of propensity score methods for estimating average treatment effects with multilevel treatments.[J]J Appl Stat, 2019, 46(5): 853-873.] [DOI] [PMC free article] [PubMed] [Google Scholar]
- 22.Galadima HI, McClish DK. Controlling for confounding via propensity score methods can result in biased estimation of the conditional AUC: a simulation study. Pharm Stat. 2019;18(5):568–82. doi: 10.1002/pst.1948. [Galadima HI, McClish DK. Controlling for confounding via propensity score methods can result in biased estimation of the conditional AUC: a simulation study[J]. Pharm Stat, 2019, 18(5): 568-82.] [DOI] [PubMed] [Google Scholar]
- 23.Cottone F, Anota A, Bonnetain F, et al. Propensity score methods and regression adjustment for analysis of nonrandomized studies with health-related quality of life outcomes. Pharmacoepidemiol Drug Saf. 2019;28(5):690–9. doi: 10.1002/pds.4756. [Cottone F, Anota A, Bonnetain F, et al. Propensity score methods and regression adjustment for analysis of nonrandomized studies with health-related quality of life outcomes[J]. Pharmacoepidemiol Drug Saf, 2019, 28(5): 690-9.] [DOI] [PubMed] [Google Scholar]
- 24.Yang JY, Webster-Clark M, Lund JL, et al. Propensity score methods to control for confounding in observational cohort studies: a statistical primer and application to endoscopy research. Gastrointest Endosc. 2019;90(3):360–9. doi: 10.1016/j.gie.2019.04.236. [Yang JY, Webster-Clark M, Lund JL, et al. Propensity score methods to control for confounding in observational cohort studies: a statistical primer and application to endoscopy research[J]. Gastrointest Endosc, 2019, 90(3): 360-9.] [DOI] [PMC free article] [PubMed] [Google Scholar]
- 25.Yu L, Zhang XT, Guan SH, et al. The number of negative lymph nodes is positively associated with survival in esophageal squamous cell carcinoma patients in China. Open Med (Wars) 2020;15:152–9. doi: 10.1515/med-2020-0023. [Yu L, Zhang XT, Guan SH, et al. The number of negative lymph nodes is positively associated with survival in esophageal squamous cell carcinoma patients in China[J]. Open Med (Wars), 2020, 15: 152-9.] [DOI] [PMC free article] [PubMed] [Google Scholar]
- 26.Yang JX, Lu ZY, Li LT, et al. Relationship of lymphovascular invasion with lymph node metastasis and prognosis in superficial esophageal carcinoma: systematic review and meta-analysis. BMC Cancer. 2020;20(1):176. doi: 10.1186/s12885-020-6656-3. [Yang JX, Lu ZY, Li LT, et al. Relationship of lymphovascular invasion with lymph node metastasis and prognosis in superficial esophageal carcinoma: systematic review and meta-analysis[J]. BMC Cancer, 2020, 20(1): 176.] [DOI] [PMC free article] [PubMed] [Google Scholar]
- 27.Visser E, Markar SR, Ruurda JP, et al. Prognostic value of lymph node yield on overall survival in esophageal cancer patients: a systematic review and meta-analysis. Ann Surg. 2019;269(2):261–8. doi: 10.1097/SLA.0000000000002824. [Visser E, Markar SR, Ruurda JP, et al. Prognostic value of lymph node yield on overall survival in esophageal cancer patients: a systematic review and meta-analysis[J]. Ann Surg, 2019, 269(2): 261-8.] [DOI] [PubMed] [Google Scholar]
- 28.Melis M, Masi A, Pinna A, et al. Does lymph node ratio affect prognosis in gastroesophageal cancer? Am J Surg. 2015;210(3):443–50. doi: 10.1016/j.amjsurg.2014.12.042. [Melis M, Masi A, Pinna A, et al. Does lymph node ratio affect prognosis in gastroesophageal cancer [J]? Am J Surg, 2015, 210(3): 443-50.] [DOI] [PubMed] [Google Scholar]
- 29.Shao YJ, Geng YT, Gu WD, et al. Assessment of lymph node ratio to replace the pN categories system of classification of the TNM system in esophageal squamous cell carcinoma. J Thorac Oncol. 2016;11(10):1774–84. doi: 10.1016/j.jtho.2016.06.019. [Shao YJ, Geng YT, Gu WD, et al. Assessment of lymph node ratio to replace the pN categories system of classification of the TNM system in esophageal squamous cell carcinoma[J]. J Thorac Oncol, 2016, 11(10): 1774-84.] [DOI] [PubMed] [Google Scholar]
- 30.赵芳.淋巴结比率在预测食管癌预后及筛选术后辅助化疗获益人群中的价值[D].天津: 天津医科大学, 2018.http://cdmd.cnki.com.cn/Article/CDMD-10062-1018886546.htm


