

Summary Paragraph
During cell division, remodeling of the nuclear envelope (NE) enables chromosome segregation by the mitotic spindle1. The reformation of sealed nuclei requires Endosomal Sorting Complexes Required for Transport (ESCRTs) and LEM2, a transmembrane ESCRT adapter2–4. Here, we show how LEM2’s ability to condense on microtubules governs ESCRT activation and coordinated spindle disassembly. The LEM motif of LEM2 binds barrier-to-autointegration factor (BAF), conferring affinity for chromatin5,6, while an adjacent low complexity domain (LCD) confers the ability to phase separate. A proline-arginine-rich sequence within the LCD binds microtubules, targeting LEM2 condensation to spindle microtubules traversing the nascent NE. Furthermore, LEM2’s winged-helix (WH) domain activates the ESCRT-II/ESCRT-III hybrid protein, CHMP7, to form co-oligomeric rings. Disrupting these events in cells prevented the recruitment of downstream ESCRTs, compromised spindle disassembly, and led to nuclear integrity defects and DNA damage. We propose that during nuclear reassembly, LEM2 condenses into a liquid-like phase and coassembles with CHMP7 to form a macromolecular O-ring seal at the confluence between membranes, chromatin, and the spindle. The properties of LEM2 described here, and the homologous architectures of related inner nuclear membrane proteins7,8, suggest that phase separation may contribute to other critical envelope functions, including interphase repair8–13 and chromatin organization14–17.
LEM2 phase separates for core clustering
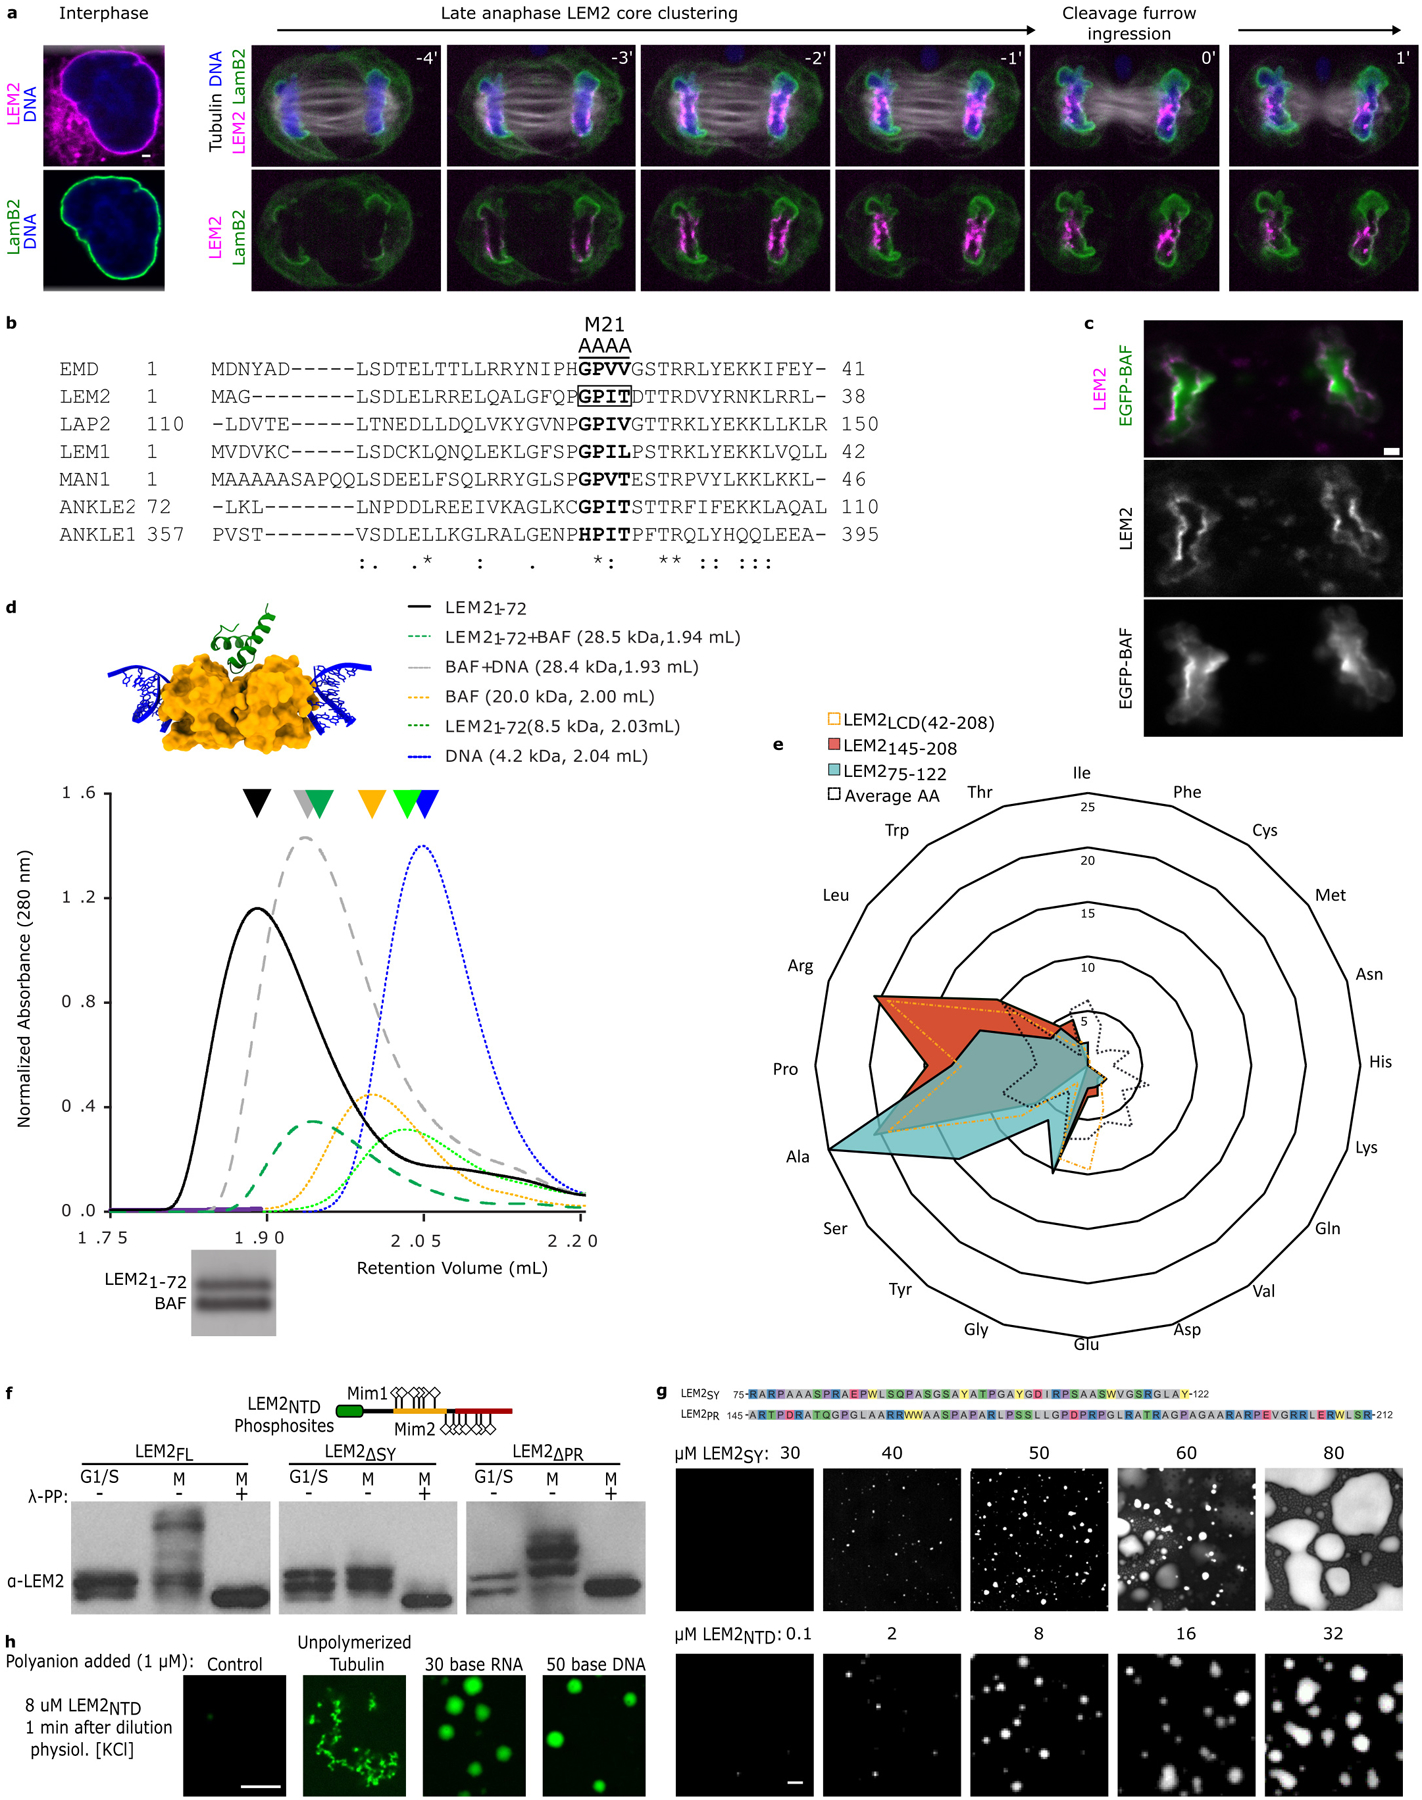
In late anaphase, as the NE surrounds the chromatin disk, LEM2 concentrates at the NE core proximal to spindle microtubules. This is in contrast to the localization pattern of the non-core marker, Lamin B2, and to LEM2’s even distribution around the NE during interphase (Fig. 1a, Extended Data Fig. 1a)18,19. To determine how LEM2 concentrates within the core, we used live-cell imaging to monitor mutant LEM2-mChr constructs alongside GFP-tubulin. Since, as expected, we found that LEM2’s LEM domain bound with high affinity to BAF (Extended Data Fig. 1b–d), we tested a LEM2 construct bearing a four amino acid substitution in the LEM domain (LEM2m21) to disable BAF binding20. This mutation was sufficient to disrupt LEM2 accumulation within the NE and subsequent core enrichment in anaphase cells, consistent with BAF’s role as an early NE reformation factor and a constituent of the core region5 (Extended Data Fig. 1c). Unexpectedly, removing the adjacent low complexity domain (LCD) (LEM2ΔLCD; ΔAA:43–202) also compromised NE enrichment—despite the presence of an intact LEM domain—suggesting that the LEM domain and the LCD are each necessary, but neither is sufficient, for proper targeting (Fig. 1a). By contrast, a large deletion within LEM2’s C-terminal WH domain (LEM2ΔWH; ΔAA:415–485) did not affect LEM2 core localization (Fig. 1a).
Fig. 1 |. LEM2 targeting to the NE core at anaphase chromatin disks depends on BAF binding and a LCD capable of forming liquid-like droplets.
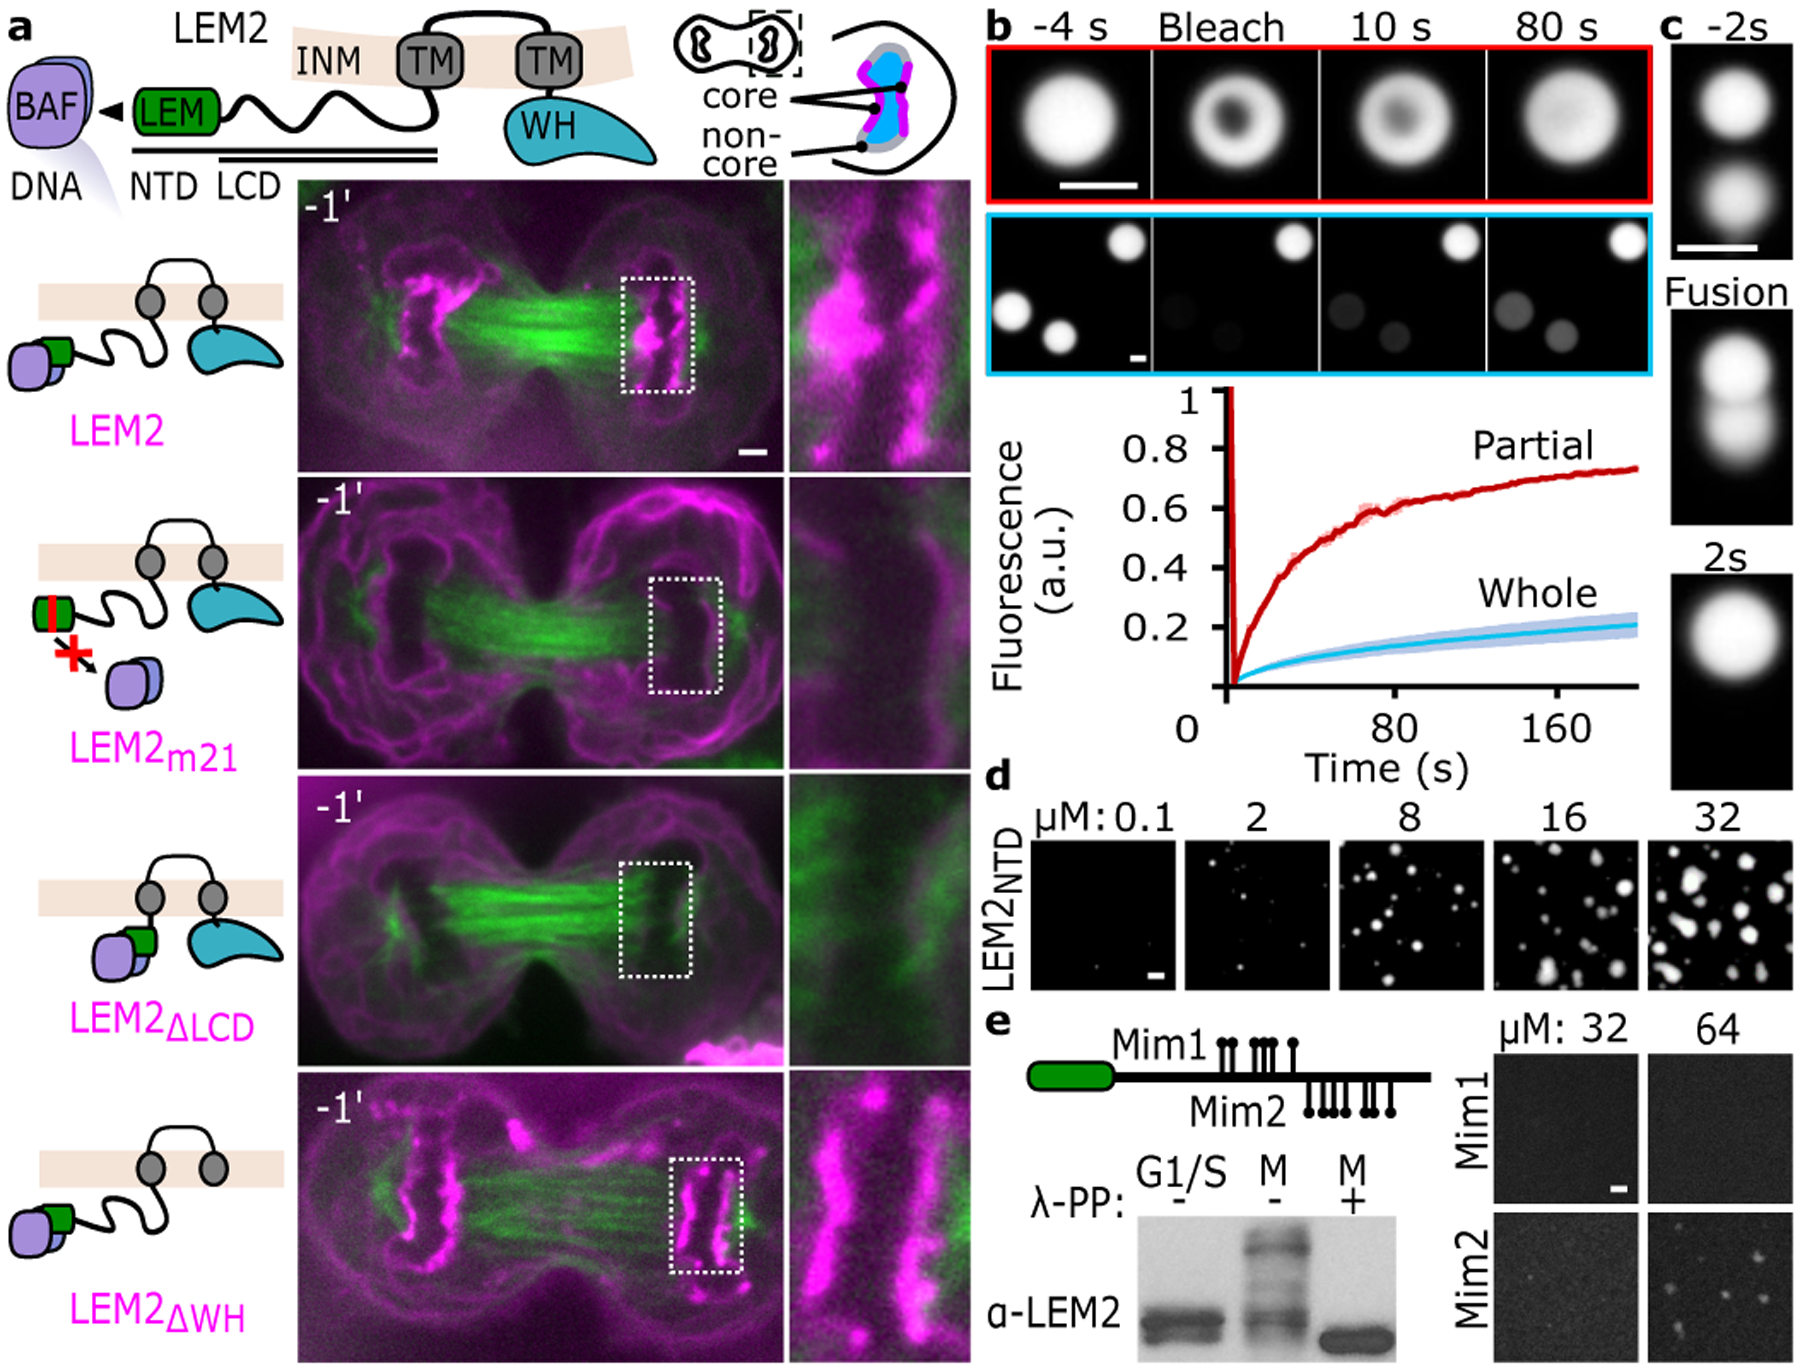
a, Top, cartoon of LEM2 sequence motifs and cellular localization. Transmembrane (TM). Bottom, live cell imaging of GFP-tubulin alongside LEM2-mChr constructs. Time 0 is time of complete cleavage furrow ingression (CFI). Representative of results from 3 biological replicates, except the ΔLCD image is representative of 2 biological replicates. b, Partial and whole droplet fluorescence recovery after photobleaching (FRAP). Mean +/− standard deviation (SD) of n=3 independent samples. c, Real-time fluorescence imaging of LEM2NTD-droplet fusion. Images representative of 2 independent experiments. d, Concentration-dependent droplet formation of purified LEM2NTD. Representative of 3 independent experiments. e, Top, schematic indicating sites of LEM2NTD phosphomimetic mutations in two constructs (Mim1, Mim2). Bottom, LEM2 immunoblot assessing the migration pattern of full-length LEM2-mChr following separation by Phos-tag SDS-PAGE; lysates treated with lambda phosphatase (λ-PP) as indicated. Representative of 2 biological replicates, with 1 and 3 technical replicates per biological replicate. For immunoblot source data, see Supplementary Fig. 1. Right, fluorescence imaging of purified LEM2NTD-phosphomimetic constructs (Mim1, Mim2). Images representative of 2 technical replicates. Scale 2 μm (a-e).
Phase separation by LCDs, or the formation of biomolecular condensates, is a mechanism for organizing dynamic processes through the creation of membraneless, biochemically-specialized compartments21–23. To characterize the properties and roles of LEM2’s LCD in core localization, we purified LEM2’s N-terminal domain (NTD), containing the LEM and LCD domains (LEM2NTD; AA:1–208). The LCD is notable for its basic sequence (pI=11.8) due to overrepresented Arginine (R), in addition to overrepresented Proline (P) and other residues (Extended Data Fig. 1e). After purification, we observed that LEM2NTD spontaneously formed spherical droplets with liquid-like properties in physiological conditions. These LEM2NTD droplets could undergo complete fusion and inter- and intra-droplet diffusion on the timescale of seconds (Fig. 1b–d, Supplementary Video 1).
We next sought to address whether and how cells exploit LEM2’s ability to phase separate in mammalian open mitosis. Phosphorylation regulates both the cell cycle and phase transitions24,25, and LEM2 has several annotated phosphosites within its LCD26. To test whether phosphorylation of LEM2 could be a regulatory mechanism, we arrested cells in G1/S versus mitosis and probed the phosphorylation status of LEM2. As expected, we found that LEM2-mChr appears strongly phosphorylated in mitosis compared to G1/S, reversible with phosphatase treatment (Fig. 1e).
Constructs with deletions of two subregions of the LCD, each harboring annotated phosphosites (an SY-rich and a PR-rich region, LEM2ΔSY-mChr ΔAA:75–123 and LEM2ΔPR-mChr ΔAA:145–213), displayed fewer phospho-LEM2 species, suggesting that mitotic phosphosites lie within these subsequences (Extended Data Fig. 1f). Importantly, phosphomimetic mutations spanning either sub-region prevented purified LEM2NTD from forming droplets near the physiological regime (Fig. 1e)—suggesting that cell-cycle dependent phosphorylation governs LEM2’s ability to condense. Notably, a synthetic peptide from the SY-rich sequence also phase separated, albeit at notably higher concentration than the LCD (Extended Data Fig. 1g). Finally, complex coacervation with polyanions like DNA and RNA also promoted monodisperse LEM2NTD to condense into spherical liquid-like droplets—a property shared with other PR-rich proteins27 (Extended Data Fig. 1h). Thus, LEM2’s LCD promotes anaphase core condensation in cells and exhibits both spontaneous liquid-like phase separation and complex coacervation properties in vitro.
LEM2 forms a liquid-like coat on MTs
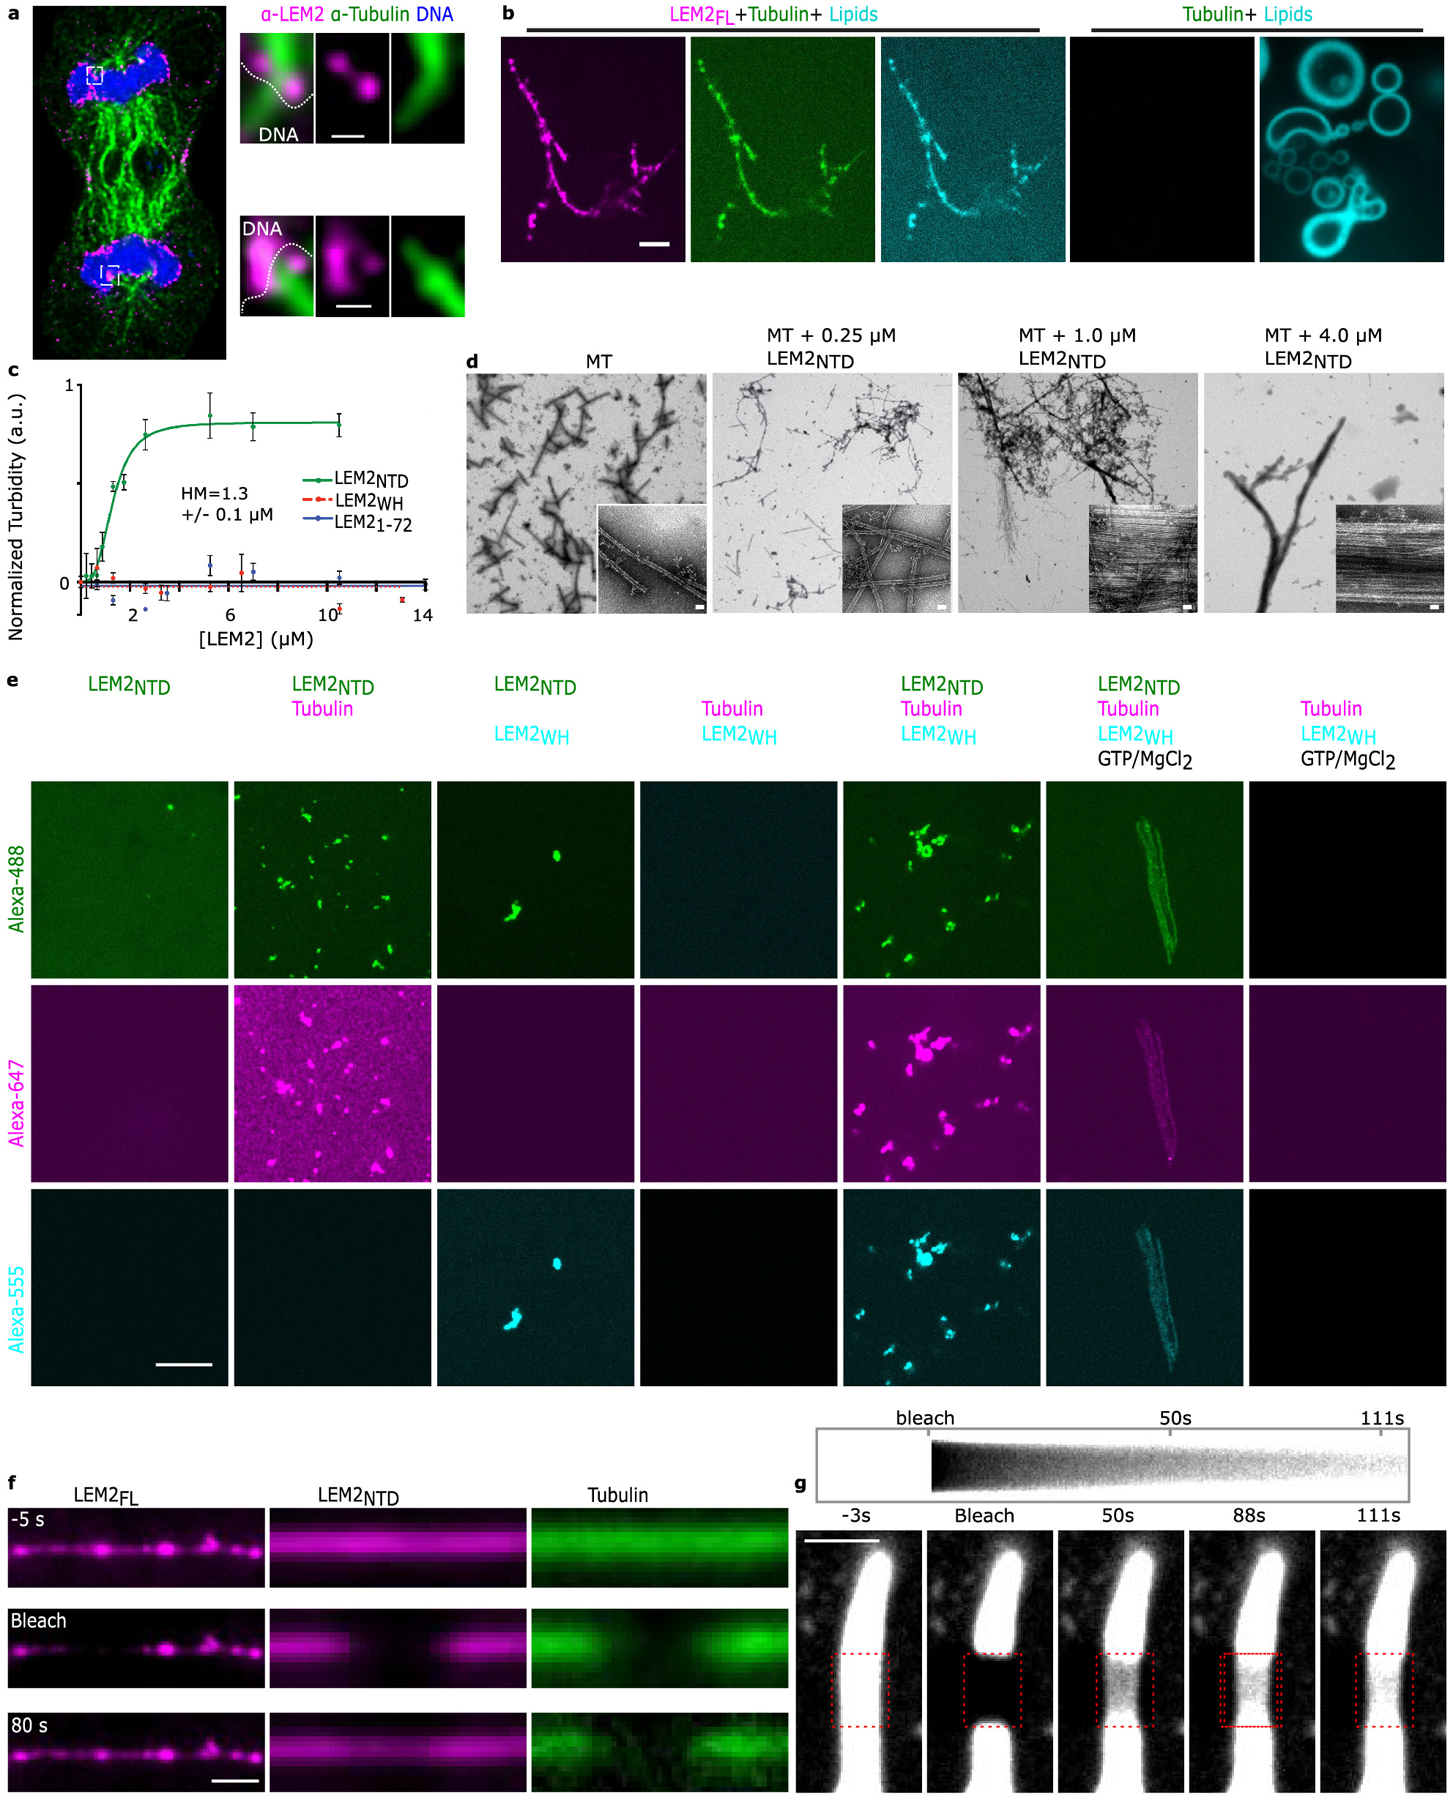
Super-resolution STED imaging of immunostained HeLa cells revealed that endogenous LEM2 enriched specifically in toroid-like shapes around spindle MTs at the chromatin surface (Fig. 2a, Extended Data Fig. 2a). To probe if LEM2 binds MTs directly, we tested binding in vitro with fluorescently labeled proteins and observed that detergent-solubilized full-length LEM2 (LEM2FL) stabilized and bundled MTs in physiological conditions (Fig. 2b). After reconstitution into proteoliposomes, moreover, membrane-embedded LEM2FL retained MT stabilizing and bundling activities (Extended Data Fig. 2b). Finally, we found that the isolated LEM2NTD was sufficient to bundle MTs (Fig. 2b–e; Extended Data Fig. 2c–f). We quantified MT-bundling with light-scattering and corroborated the assay with negative stain electron microscopy (EM). LEM2NTD, containing the LCD, bundled MTs in a concentration-dependent and saturable manner, with a half-maximal scattering concentration, or a Kapparent value, of 1.3 μM (Extended Data Fig. 2c,d). EM revealed that LEM2-bundled MTs lost the characteristic tubulin lattice fine structure, apparently occluded by an amorphous LEM2 coating (Fig. 2e). Furthermore, LEM2NTD droplets could form coacervates with unpolymerized tubulin and form MT-bundles upon addition of GTP and MgCl2 (Extended Data Fig. 2e). These data demonstrate that LEM2’s LCD directly binds MTs to cause bundling in vitro.
Fig. 2 |. LEM2 concentrates around spindle MTs and its LCD forms a liquid-like coating around microtubules.
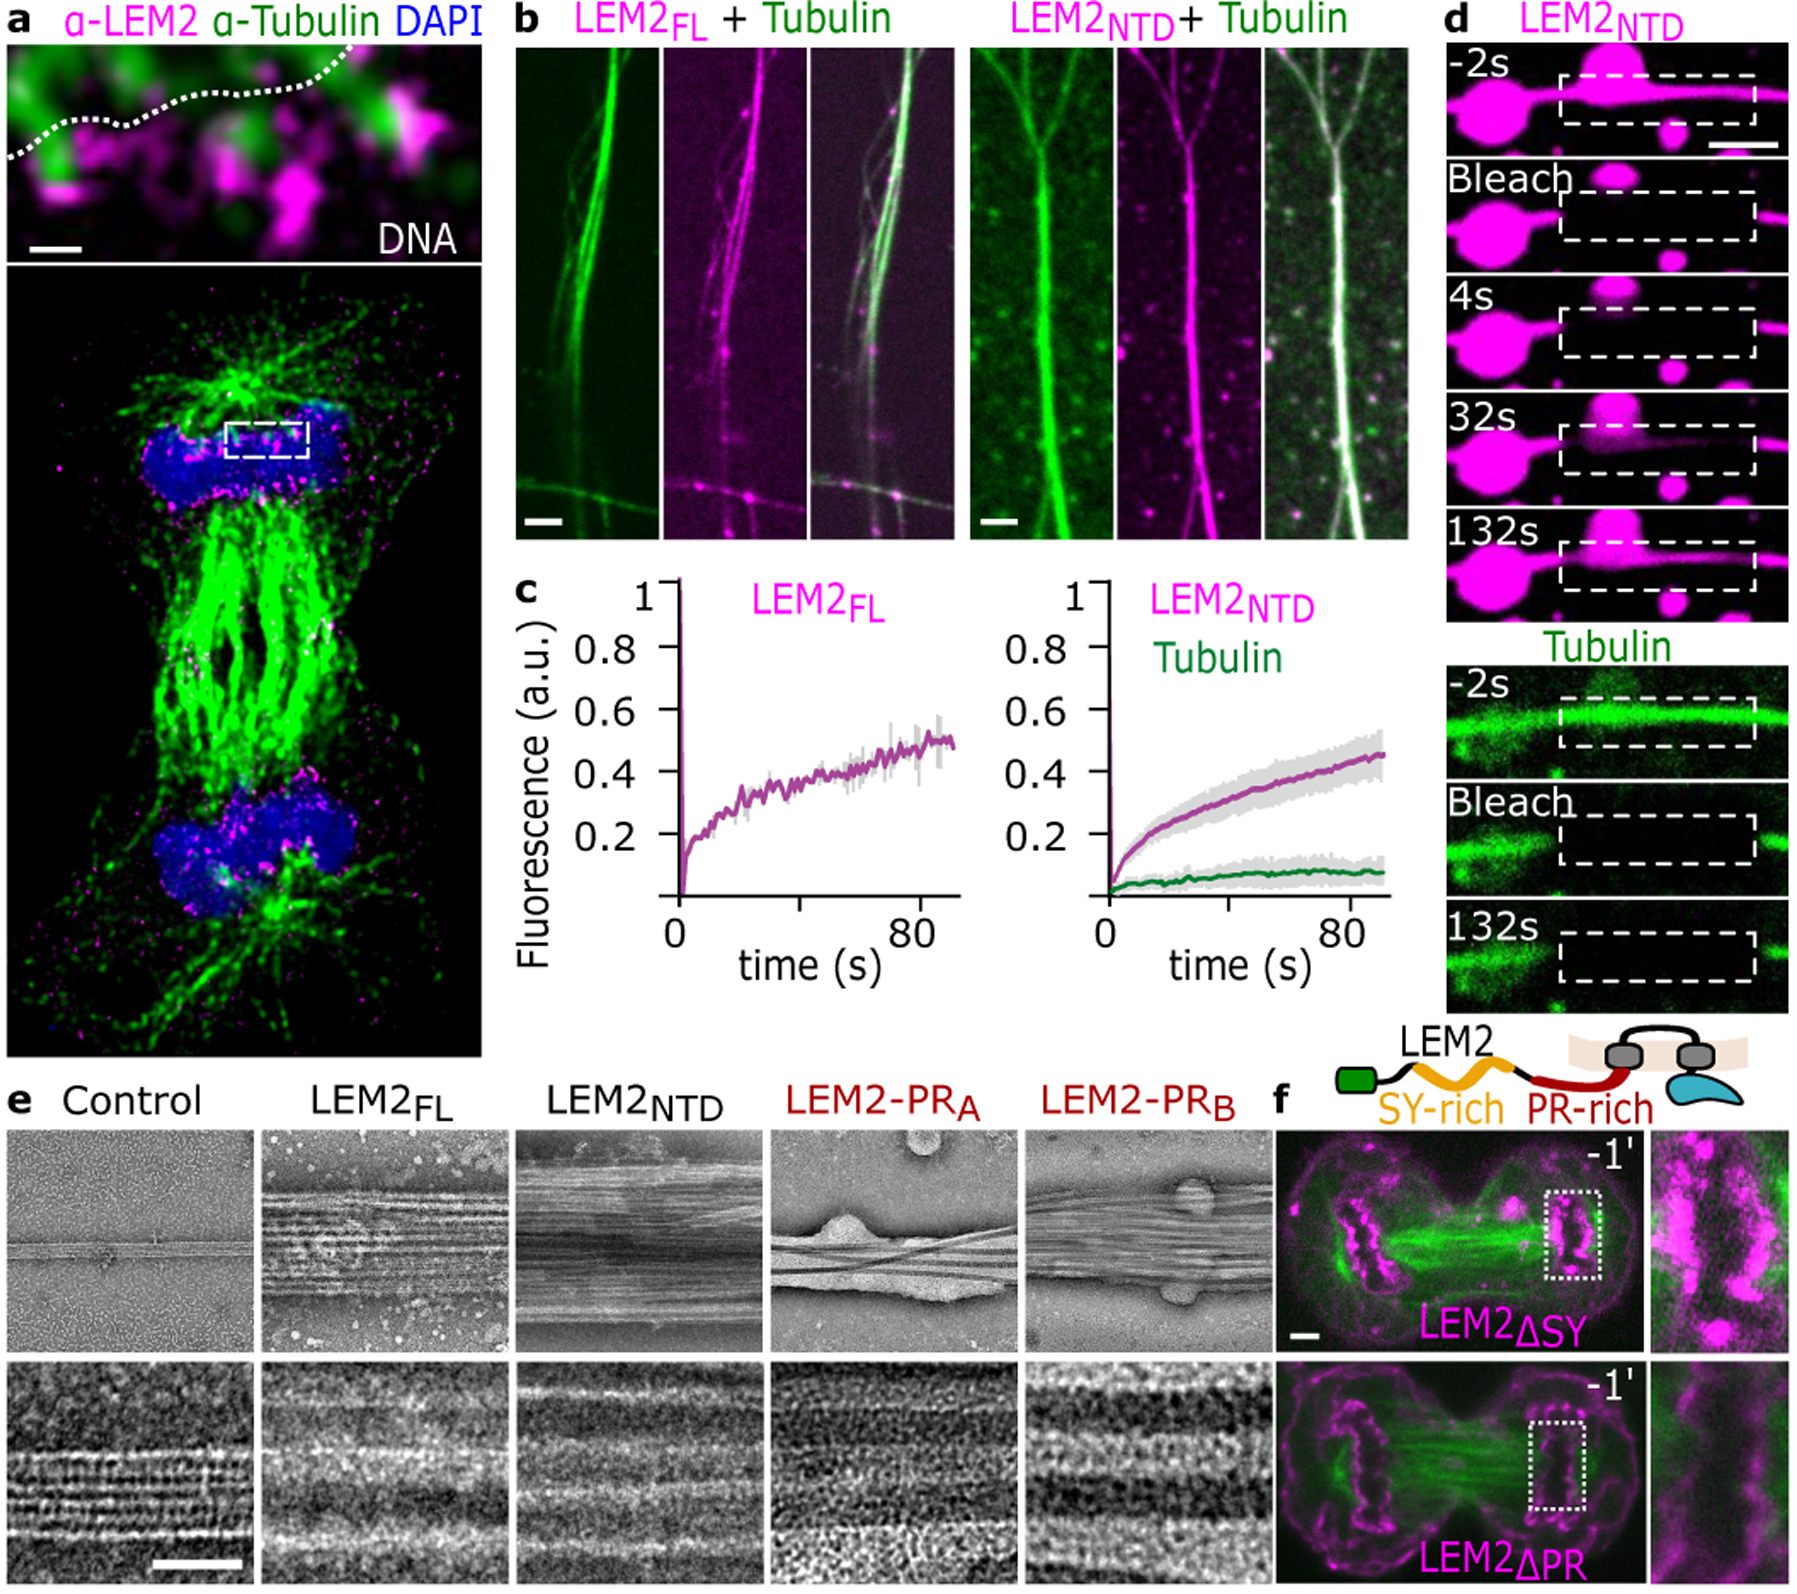
a, STED imaging of endogenous LEM2 in late anaphase. Scale 150 nm. Representative of data from 4 cells. b, Fluorescence imaging of full-length LEM2 (LEM2FL) and MTs. Representative of 2 technical replicates. Fluorescence imaging of LEM2NTD and MTs. Representative of 10 technical replicates. c, FRAP analysis of LEM2FL- and LEM2NTD-coated MT bundles. Data plotted are mean +/− SEM for n=5 independent samples (LEM2FL) or n=17 independent samples (LEM2NTD). d, FRAP analysis of a LEM2NTD-coated MT bundle. Images representative of 2 independent examples. e, Electron micrographs of MT alone or with indicated portions of purified LEM2. LEM2-PRA AA:145–165, LEM2-PRB AA:188–213. Representative of 3 technical replicates. Scale 25 nm. f, Top, schematic architecture of LEM2 highlighting the SY-rich and PR-rich regions. Bottom, live cell imaging of indicated LEM2-mChr deletion constructs and GFP-tubulin. Time 0 refers to time of complete CFI. Representative of 3 biological replicates. Scale 2 μm (b, d, f).
Considering the liquid-like phase separation and complex coacervation properties of LEM2’s LCD, we explored the state of MT-bound LEM2 in vitro. Using video fluorescence microscopy, we observed that both LEM2FL and LEM2NTD bound MT bundles dynamically, recovering fluorescence at similar rates after photobleaching, in contrast to tubulin in the microtubule lattice, which did not recover (Fig. 2c, Extended Data Fig. 2f). Notably, photobleached regions of LEM2NTD on MT bundles recovered fluorescence through coaxial flow, or a liquid-like gradient, rather than in a uniform recovery pattern across the bleached area. (Fig. 2d, Extended Data Fig. 2g and Supplementary Video 2). Thus, LEM2’s LCD coats MTs in a liquid-like phase.
We further identified two peptides within the PR-rich region that were sufficient to induce MT bundling in vitro (Fig. 2e, Extended Data Fig. 3a–c). In vivo, a LEM2 deletion mutant spanning this Pro- and Arg-enriched sequence, LEM2ΔPR-mChr, initially targeted to the nascent NE yet, in contrast with LEM2ΔSY-mChr, failed to enrich at the MT-containing core (Fig. 2f, Extended Data Fig. 3d). Thus, direct MT-binding by this region is required for core-localized LEM2 condensation during anaphase. Finally, and consistent with phosphoregulation, phosphomimetic mutations spanning the MT-interacting PR-rich motif and its flanking region impaired MT bundling in vitro (Extended Data Fig. 3e, f).
A molecular O-ring for early NE sealing
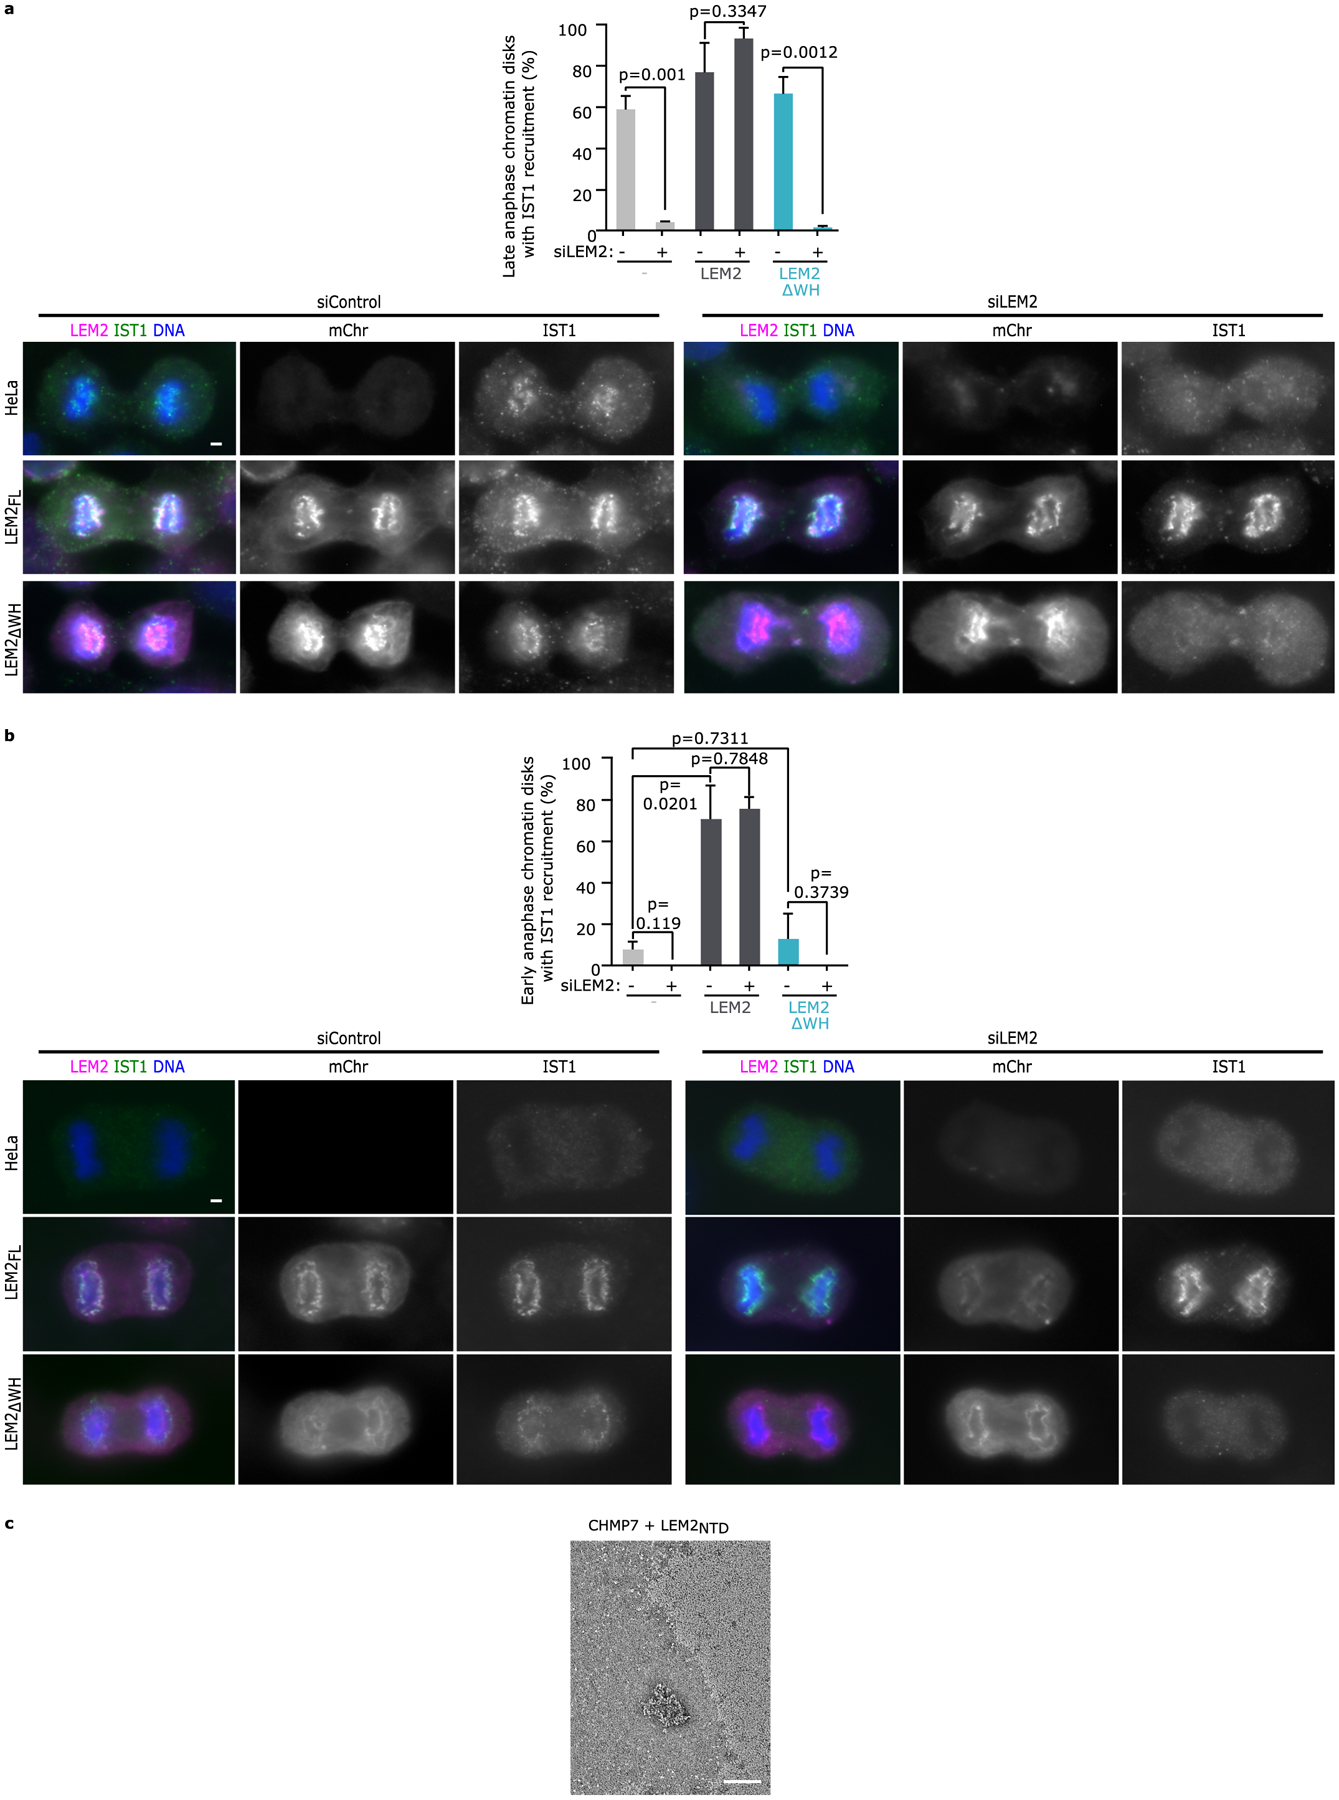
As predicted by direct binding between the WH domain of LEM2 (LEM2WH; AA:395–503) and CHMP74, LEM2ΔWH-mChr was unable to recruit GFP-CHMP7 to the NE (Fig. 3a). Furthermore, following depletion of endogenous LEM2, overexpression of siRNA-resistant LEM2ΔWH-mChr failed to rescue the recruitment of IST1, an ESCRT-III protein downstream of LEM2 and CHMP7 that is required to recruit the spindle MT-severing enzyme, SPASTIN (Extended Data Fig. 4a)2. Overexpression of siRNA-resistant LEM2-mChr led to premature and enhanced recruitment of endogenous IST1 to the nascent NE (Extended Data Fig. 4b)—indicating that LEM2 guides both the spatial and temporal patterns of CHMP7-dependent ESCRT activation.
Fig. 3 |. LEM2 coassembles with CHMP7 to form an O-ring that facilitates early nuclear sealing.
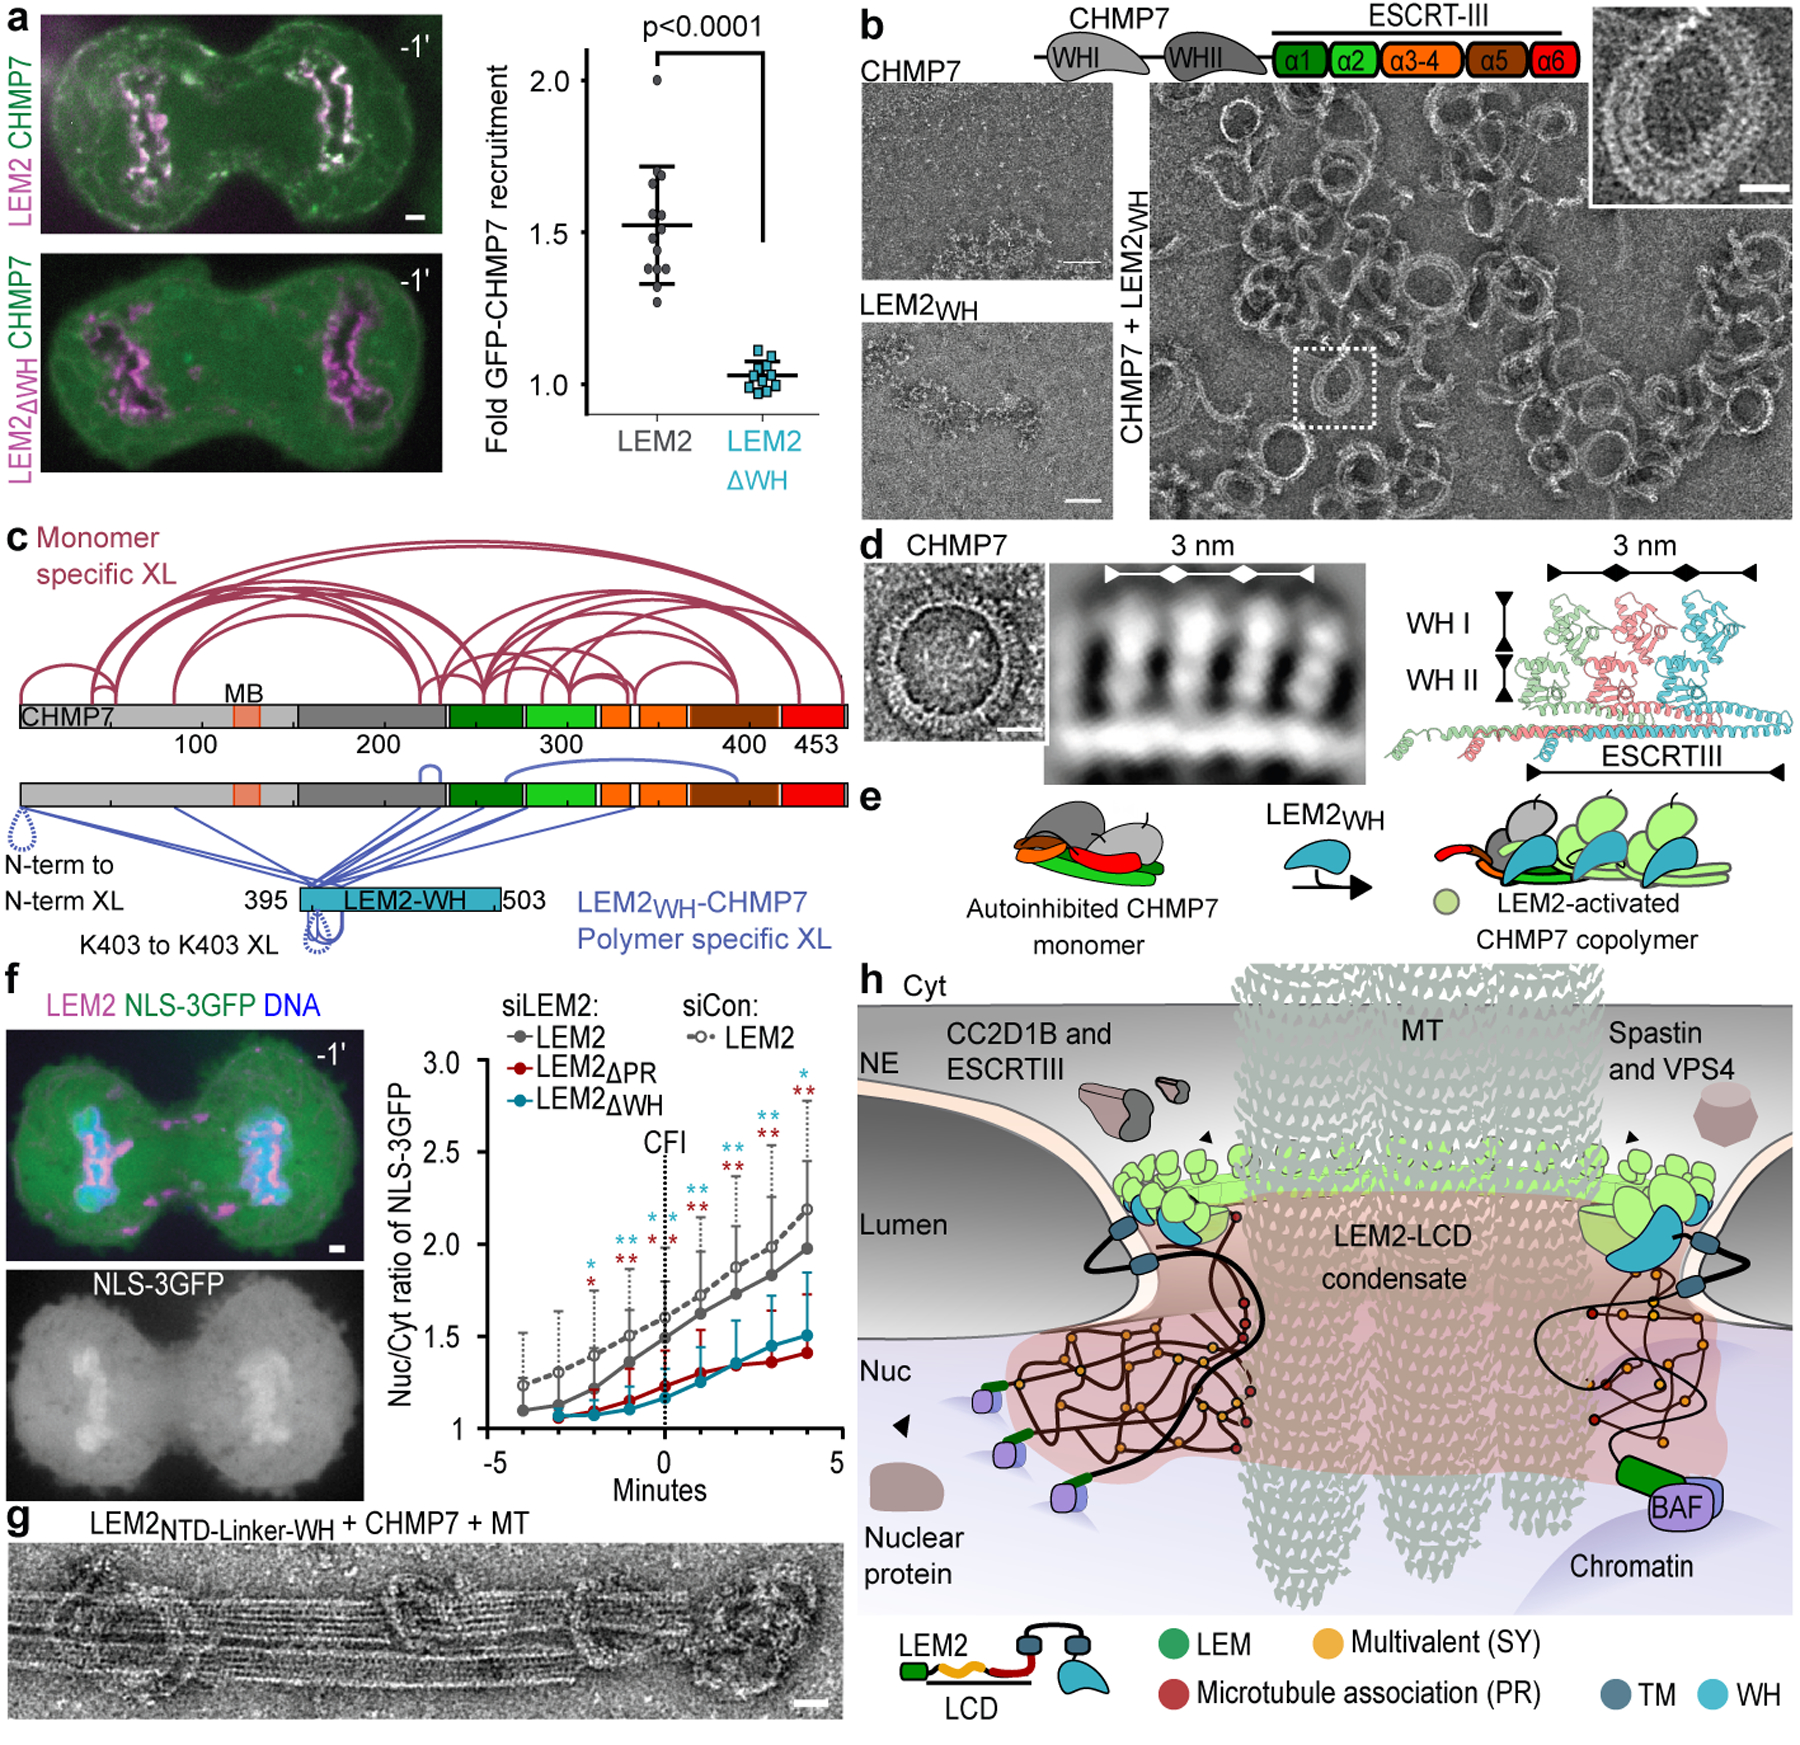
a, Live cell imaging of GFP-CHMP7 and LEM2-mChr versus LEM2ΔWH-mChr (left). Localization was quantified across 4 biological replicates (LEM2-mChr: n=14; LEM2ΔWH-mChr: n=12). Data plotted are mean +/− SD and p-value determined with two-tailed unpaired t-test. b, Top, CHMP7 domain schematic. Bottom, EM of indicated components. Representative of 3 technical replicates. c, XL-MS. BS3 crosslinks enriched more than 4-fold mapped onto the primary structure: monomeric CHMP7 (red) or LEM2WH-CHMP7 polymer (blue). MB, membrane binding. d, Left, EM of polymerized ring of full-length CHMP, image representative of 5 technical replicates, and 2D class average of polymerized CHMP7. Right, homology model of polymeric CHMP7. e, Cartoon of LEM2-mediated CHMP7 activation. f, Left: Representative image of NLS-3GFP localization in cells treated with siRNA and expressing LEM2-mChr. DNA labeled with NucBlue. Time 0 refers to time of complete CFI. Right: Mean ratio of nuclear/cytoplasmic NLS-3GFP throughout late anaphase. Data plotted are mean +/− SD across at least 3 biological replicates (siCon LEM2-LEM2-mChr: n=26; siLEM2–2 LEM2-mChr: n=44; siLEM2–2 LEM2ΔPR-mChr: n=20; siLEM2–2 LEM2ΔWH-mChr: n=16 cells). P-values determined with two-tailed unpaired t-test at each timepoint, comparing full length to each mutant constructs. *P < 0.05; **P < 0.005. No multiple comparisons. Exact p-values in Extended Data Fig. 7b. g, EM of indicated components. Scale 25 nm. Representative of 2 technical replicates. h, Model: The LEM2-CHMP7 macromolecular O-ring.
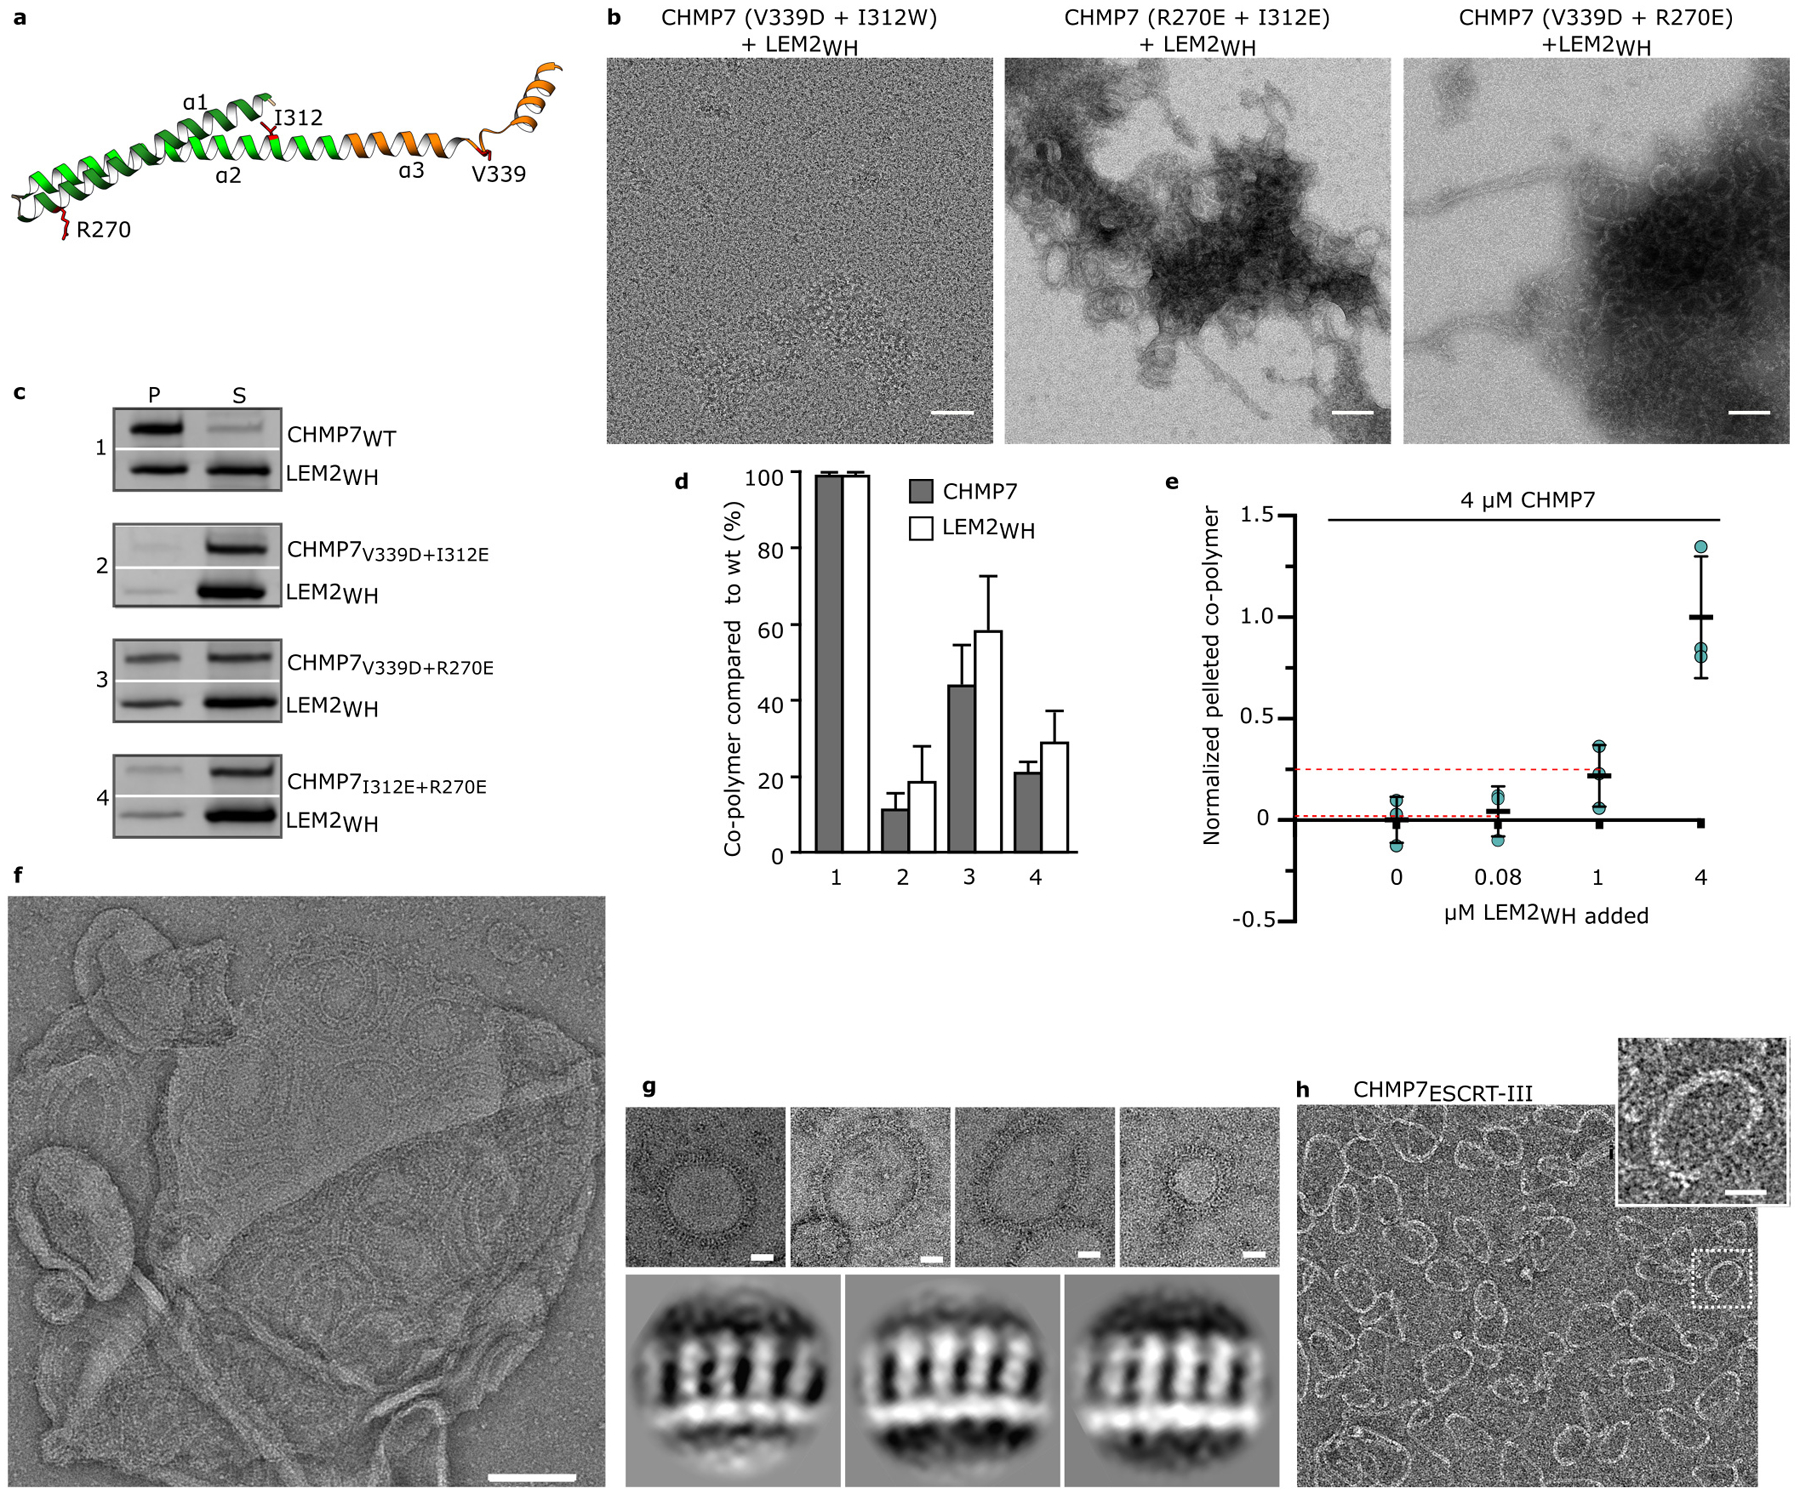
Incubation of monomeric, full-length CHMP7 with LEM2WH, but not with LEM2NTD, triggered the assembly of looping protein polymers with an inner diameter that ranged from 50 to 100 nm (Fig. 3b; Extended Data Fig. 4c). To probe the mechanism of CHMP7 autoinhibition and release by LEM2WH, we employed quantitative cross-linking mass spectrometry (XL-MS), isotopically distinguishing between monomers and LEM2WH-induced polymers (Extended Data Fig. 5a, Supplementary Table 1). We identified 24 cross-links specific to monomeric CHMP7. Hybrid peptide mapping revealed that the N- and C-terminal regions of CHMP7 fold together, bringing the α1-α3 helices of CHMP7’s ESCRT-III domain into proximity with its N-terminal WH domains (Fig. 3c, Extended Data Fig. 5, Supplementary Table 2). These interactions in the monodisperse CHMP7 sample were significantly reduced or absent in LEM2WH-induced CHMP7 polymers (Fig. 3c, Supplementary Tables 1,2), consistent with a conformational change into the open and polymeric state visualized by EM (Fig. 3b). In total, 19 cross-links were enriched in the LEM2WH-induced polymeric sample, mapping to interactions between LEM2WH and α1-α3 helices of CHMP7. Polymer-specific cross-links between N-terminal amines of neighboring CHMP7 molecules, and between adjacent LEM2WH subunits, are consistent with copolymerization of both proteins (Fig. 3c, Extended Data Fig. 5). Corroborating the XL-MS, CHMP7 and LEM2WH co-pellet with a 1:1 stoichiometry, and mutating conserved residues suggested by the hybrid peptides within CHMP7 α1–3 helices impaired LEM2WH-CHMP7 co-polymerization (Extended Data Fig. 6a–e).
Model membranes were also sufficient to trigger polymerization of full-length CHMP7 (Extended Data Fig. 6f). 2D alignment and image averaging of membrane-induced CHMP7 polymers revealed a repeating unit comprised of a continuous, polymeric strand studded with repeating perpendicular spikes (Fig. 3d, Extended Data Fig. 6g). The periodic dimensions of this polymer match those of homologous structures for “open” human CHMP1B and yeast Snf7, suggesting these structures comprise an ESCRT-III filament decorated with protruding ESCRT-II-like tandem WH-domains28–30 (Fig. 3d,e, Extended Data Fig. 5e,f, 6f,g). Consistent with this model, a truncated CHMP7 fragment comprised only of the ESCRT-III domain (CHMP7ESCRT-III; AA:229–453) spontaneously polymerized during purification into rings devoid of perpendicular spikes, but with otherwise comparable dimensions (Extended Data Fig. 6h). The spontaneous polymerization of CHMP7ESCRT-III further supports an auto-inhibitory function for CHMP7’s N-terminal WH domains. In summary, we found that LEM2’s WH domain activates autoinhibited CHMP7 monomers through a domain-replacement mechanism and this triggers their coassembly.
To investigate the roles of the LEM2-CHMP7 partnership at the spindle-chromatin interface, we expressed LEM2 deletion mutants alongside an import cargo (NLS-3GFP) to assess nuclear compartmentalization during anaphase. Cells expressing siRNA-resistant LEM2-mChr first had measurable enrichment of NLS-3GFP in reforming nuclei shortly after LEM2 core localization, when spindle MTs still present barriers to sealing the nuclear membrane (Fig. 1a, Fig. 3f, Extended Data Fig. 1a, 7a,b). Cells expressing LEM2ΔSY-mChr, which concentrated within the core normally, displayed mild defects in compartmentalization (Fig. 2f, Extended Data Fig. 7a,b). By contrast, expression of LEM2ΔPR-mChr, which failed to concentrate within the core, attenuated NLS-3GFP accumulation considerably, pointing to the importance of LEM2’s ability to specifically condense around spindle MTs (Fig. 2f, Fig. 3f, Extended Data Fig. 7a,b). Finally, expression of LEM2ΔWH-mChr also prominently impaired timely NLS-3GFP accumulation, demonstrating a key role for the WH domain in compartmentalization presumably due to its ability to recruit CHMP7 and subsequent ESCRT pathway proteins (Fig. 1a, Fig. 3a,f, Extended Data Fig. 7a,b). Accordingly, depletion of either LEM2 or CHMP7 impaired nuclear compartmentalization for an extended period, with defects persisting at least up to 30 minutes after complete cleavage furrow ingression (Extended Data Fig 7c).
Extended siRNA-mediated LEM2 depletion causes nuclear malformations and is eventually lethal19. To identify whether nuclear morphology defects arise due to errors during mitotic exit, we synchronized cells following LEM2 depletion and imaged their progression from anaphase to late telophase. While LEM2-depleted cells progressed to anaphase without noticeable nuclear defects, a strong nuclear and tubulin-morphology phenotype began to emerge in late anaphase and persisted through telophase (Extended Data Fig. 8a, Supplementary Video 3). Orthogonal views of LEM2-depleted cells revealed that aberrant MT bundles tunnel through the nucleus within a channel lined by NE (Extended Data Fig. 8b). The appearance of DNA damage in telophase U2OS cells depleted of LEM2 underscores the significance of these nuclear integrity phenotypes (Extended Data Fig. 8c).
Finally, to test the central hypothesis that LEM2’s LCD and WH activities cooperate with CHMP7 to self-assemble around spindle MTs, we engineered a simplified LEM2 construct bearing the extra-lumenal domains of LEM2 connected by a flexible linker, LEM2NTD-LINKER-WH. LEM2NTD-LINKER-WH triggered CHMP7 copolymerization and the resulting rings could be seen looping upon and around small MT bundles (Fig. 3g, Extended Data Fig. 8d). Consistently, and underscoring the importance of their functional coordination, disrupting LEM2’s MT-interacting or CHMP7-binding domains led to persistent interphase nuclear morphology phenotypes in cells (Extended Data Fig. 8e–g).
Our results lead to the following model: LEM2 concentrates within the NE core through direct MT binding, where its LCD condenses into a liquid-like phase that wets the surface of spindle MTs. LEM2’s WH domain and CHMP7 then copolymerize to complete the formation of a macromolecular “O-ring” seal that establishes a temporary barrier between the new nucleoplasm and the cytoplasm before triggering complete spindle disassembly and membrane fusion (Fig. 3h, Supplementary Discussion).
Methods
Cytoskeletal proteins
Porcine brain Tubulin reagents were purchased from Cytoskeleton, Inc., including unpolymerized Tubulin (T238P), unpolymerized, HiLyte-647-labeled Tubulin (TL670M), and pre-formed microtubules (MT002).
Purification of His6-SUMO-tagged proteins
All purified proteins in this study, except full length LEM2, were expressed in a pCA528 vector (WISP08–174; DNASU Plasmid Repository) in BL21-(DE3)-RIPL Escherichia coli cells using an N-terminal His6-SUMO affinity tag as described previously4. Full length LEM2 was expressed in a pCA528 vector in C43(DE3) Escherichia coli cells using an N-terminal His6-SUMO affinity tag. All plasmids are listed in Supplementary Table 3. Expression cultures (3- to 4-liter) were grown in ZY-5052 rich auto-induction media containing kanamycin, shaking (220 rpm) for 3 hours at 37°C, then overnight at 19°C. Cells were harvested by centrifugation.
Purification of BAF
Purification of full length, human BAF protein (Uniprot ID O75531) was adapted from a published protocol31,32. The purification was performed as described, except His6-SUMO-BAF was cleaved with His6-Ulp1 protease (30 min, room temperature) to suit the use of the His6-SUMO affinity tag. Ultimately, Superdex 75 16/60 fractions containing BAF dimer were pooled, concentrated, and flash frozen in liquid nitrogen and stored as single use aliquots at −80°C.
Purification of LEM2 proteins
Protein constructs originating from the human LEMD2 protein (Uniprot ID Q8NC56), including LEM21–72, LEM2NTD(1–208), LEM2Mim1(S82D, S90D, S96D, Y98D, T100D, Y104D), LEM2Mim2(Y122D, S134D, S138D, S139D, T147D, S166D, S174D, S175D), LEM2WH(395–503), and LEM2NTD(1–208)-LINKER-WH(395–503) (linker sequence SAAGTGAGSGSAAS), were purified as follows. Harvested cells were resuspended in lysis buffer (5 mL per gram cell pellet) containing 5% glycerol, 10 mM imidazole, pH 8.0, 2 μg/mL DNase1, lysozyme and protease inhibitors, with HEPES and KCl concentrations optimized individually for each LEM2 protein construct (20 mM HEPES, pH 7.0, 500 mM KCl for LEM21–72 and LEM2NTD-LINKER-WH, and 40 mM HEPES, pH 8.0, 350 mM KCl for LEM2WH, LEM2Mim1 and LEM2Mim2). Cells were lysed by sonication on ice, and clarified (10,000g, 30 min, 4°C). Clarified lysate was incubated with Ni-NTA agarose resin (Qiagen) (4 mL bed volume, 1.5 h, 4°C), washed extensively with lysis buffer, and protein was eluted with 5 column volumes of lysis buffer supplemented with 350 mM imidazole, pH 8.0. Eluate was spin-concentrated (Vivaspin 20, 3KDa MWCO, PES) to 5 mL, and dialyzed overnight at 4°C into storage buffer (20 – 40 mM HEPES, pH 7.0 – 8.0, 5% glycerol), with KCl concentrations optimized individually per construct (300 mM for LEM21–72, 500 mM for LEM2NTD-LINKER-WH, and 350 mM for LEM2WH and LEM2Mim1, 110 mM for LEM2Mim2). The His6-SUMO tag was cleaved by incubation with His6-Ulp1 protease during dialysis. LEM2 proteins were further purified by size exclusion chromatography using the Superdex 75 16/60 column (GE Life Sciences) in storage buffer, and LEM2-containing fractions were pooled, spin-concentrated (Vivaspin 6 3KDa MWCO, PES), and aliquoted.
LEM2NTD was purified similarly, including an additional preparative phase separation step. All steps were carried out at room temperature unless otherwise noted. Harvested cells were resuspended in lysis buffer (30 mM HEPES, pH 7.4, 500 mM KCl, 5% glycerol, 10 mM imidazole, pH 8.0, 2 μg/mL DNase1, lysozyme and protease inhibitors), and lysed by sonication with intermittent chilling on ice. Lysate was clarified by centrifugation (10,000g, 30 min), incubated with Ni-NTA agarose resin (4 mL bed volume, 1.5 h, room temperature), and washed extensively with lysis buffer. Protein was eluted with lysis buffer supplemented with 350 mM imidazole, pH 8.0. Droplet formation was induced to enrich for His6-SUMO-LEM2NTD: the imidazole eluate was diluted with ice-cold buffer (40 mM HEPES, pH 7.4, 5% glycerol) to drop the concentration of KCl to 50 mM. After 20 min incubation on ice, protein droplets were pelleted by centrifugation (10,000g, 10 min, 0°C), washed with 2 column volumes of ice-cold low-salt buffer (40 mM HEPES, pH 7.4, 50 mM KCl, 5% glycerol), and pelleted again. The pellet was resuspended in 5 mL of high-salt buffer (40 mM HEPES, pH 7.4, 500 mM KCl, 5% glycerol), to dissolve protein droplets for the remaining purification steps, and incubated with His6-Ulp1 protease (2 h). The mixture was incubated with Ni-NTA resin (2 mL, 1 h). Spin-concentrated, flow-through protein was further purified by size exclusion chromatography using the Superdex 75 16/60 column in high-salt buffer at 4°C. Pooled, spin-concentrated, LEM2-containing fractions were dialyzed overnight into storage buffer (40 mM HEPES, pH 7.4, 350 mM KCl, 5% glycerol), spin-concentrated, and aliquoted.
Concentrated protein aliquots were snap-frozen in liquid nitrogen and stored at −80°C for future experiments. Aliquots were thawed and used only once. Final protein concentrations were 260 μM LEM21–72, ~110 μM LEM2NTD, 30 μM LEM2NTD-LINKER-WH, 14 μM LEM2WH and 190 μM His6-SUMO-LEM2WH, 100 μM LEM2Mim1, and 110 μM LEM2Mim2. Note that concentrations of LEM2WH without the tag were limited, and LEM2WH was more stable with the His6-SUMO tag.
Human, full length LEM2 (LEM2FL) was purified as follows. Harvested cells (6-liters expression culture) were resuspended in lysis buffer (5mL per gram cell pellet) containing 25mM HEPES, pH 7.4, 500mM KCl, 1mM DTT, 5% glycerol, lysozyme, 2μg/mL DNase1, and protease inhibitors. Cells were lysed by sonication on ice and clarified (10,000g, 30 min, 4°C). Membranes were pelleted and collected from clarified lysate by ultracentrifugation (100,000g, 1 hr, 4°C). LEM2FL was extracted from membranes with 1% (w/v) n-dodecyl-B-D-maltopyranoside (DDM, Anatrace D310) with stirring (1 hr, 4°C), and collected in the supernatant following centrifugation (35,000g, 30 min, 4°C). DDM-extracted supernatant was supplemented with 10mM imidazole and incubated with Ni-NTA agarose resin (Qiagen) (4 mL bed volume, 1 hr, 4 °C), washed extensively with lysis buffer containing 0.1% DDM, and protein was eluted with 5 column volumes of lysis buffer containing 0.1% DDM and supplemented with 500mM imidazole, pH 8.0. LEM2FL-rich elution fractions were pooled and dialyzed overnight at 4 °C to remove imidazole. The His6-SUMO tag was cleaved by incubation with His6-Ulp1 protease (30 min, room temp) and removed by reverse Ni-NTA chromatography. Cleaved, DDM-solubilized LEM2FL was used unconcentrated, or spin-column concentrated (Vivaspin20, 100kDa MWCO, PES) without freeze-thaw.
Purification of CHMP7 proteins
Purification procedures for full-length, human CHMP7 (Uniprot ID Q8WUX9) and point mutants CHMP7R270E+I312E, CHMP7R270E+V339D, and CHMP7I312E+V339D were adapted from previously published purifications4. The truncated CHMP7ESCRT-III(229–453) was purified as follows. Harvested cells were resuspended in 5 mL ice-cold lysis buffer (40 mM HEPES, pH 8.0, 800 mM KCl, 5% glycerol, 10 mM imidazole, 2 μg/mL DNase1, 5 mM BME, protease inhibitors, and lysozyme) per gram cell pellet. Cells were lysed by sonication, on ice, and clarified (10,000g, 30 min, room temperature). Clarified CHMP7ESCRT-III lysate was incubated with Ni-NTA agarose resin and spontaneously formed a gel composed of protein polymerized into rings, assayed by negative stain EM. His6-SUMO-CHMP7ESCRT-III rings were eluted with imidazole (350 mM), and the eluate was collected with low-speed spin (1,000g) as a gel phase on top of the resin. The gel was scooped off, washed three times with buffer (40 mM HEPES, pH 8.0, 800 mM KCl, 5% glycerol, 1 mM DTT), and polymers were collected by centrifugation (5,000g) each time. The His6-SUMO tag was cleaved by incubation with His6-Ulp1 protease (2 h, 4°C). Cleaved CHMP7ESCRT-III was washed three times with buffer, collected by centrifugation each time, and soluble His6-SUMO and His6-Ulp1 were discarded in the aqueous supernatant. Cleaved eluate was diluted with buffer to give a final protein concentration of ~60 μM.
Analytical Size Exclusion Chromatography
LEM21–72 binding to BAF or BAF-dsDNA complex was assayed by gel filtration chromatography. DNA duplex was prepared as previously described32. Combinations of purified LEM21–72, BAF dimers, and DNA duplexes were combined in 1:1:2 molar ratio. Following incubation at room temperature for 30 min, 50 μL of reaction mixtures were applied to a Superose 6 3.2/300 column (GE Life Sciences) in buffer (20 mM HEPES, pH 7.5, 150 mM NaCl, 5 mM DTT, and 10% glycerol) equilibrated at 4°C. The flow rate was 40 μL/min for all experiments. Retention volumes for major peaks absorbing at 280 nm (A280) were recorded. The protein contents of peak fractions were assayed by SDS-PAGE.
LEM2 Low Complexity Domain Peptides
Chemically synthesized peptides bearing an N-terminal FITC-Ahx modification (Extended Data Fig. 3a) were purchased from from GenScript (Piscataway, NJ), Peptide stock solutions were prepared in milli-Q H2O except LEM275–122 stocks, which were prepared in DMSO. Phase separation of LEM275–122 was induced by dilution in milli-Q H2O or buffer (25 mM HEPES, pH 7.4, 150 mM KCl) to 0.2 mg/mL stock.
Turbidimetry
Microtubule bundling by LEM2 was quantified by turbidity (absorbance at 340 nm) (Tecan Spark 10M spectrophotometer)33. Reactions (10 μL total volume) of purified LEM2(1–72, NTD, WH, Mim1, or Mim2) protein or chemically synthesized LEM2 peptides, 1 μM αβ-Tubulin heterodimers polymerized into MTs, KCl (75 mM for LEM2 protein reactions, 0.9 mM for LEM2 peptide reactions), 25 mM HEPES, pH 7.4, 0.5 mM MgCl2, 10 μM paclitaxel (Sigma Aldrich), were prepared at room temperature in 384-well non-binding plates (Grendier Bio-One, #781906). Turbidity was measured, with shaking before each read, for reactions in triplicate, and averaged for each condition. Turbidity values for reactions of LEM2 protein/peptide with microtubules were corrected for the turbidity of LEM2 protein/peptide alone, normalized to turbidity of microtubules alone, and plotted (Turbidity a.u.) against [LEM2]. Sigmoidal curve fitting and half-maximum LEM2 concentrations were calculated with GraphPad Prism software. Turbidity of LEM2Mim1 and LEM2Mim2 were normalized to a saturating turbidity value equal to 1.0, for easy comparison of half-maximal values within plot. Turbidity data was corroborated by complementary negative stain electron microscopy. Turbidimetry was not performed for peptides LEM275–122 (LEM2SY) or LEM2145–165 (LEM2-PRA) with MTs, because these peptides were already turbid in the absence of MTs.
Protein labeling for fluorescence imaging
Proteins were fluorescently labeled for microscopy using Microscale Protein Labeling kits from Thermo Scientific: Alexa Fluor™ 488 (A30006), Alexa Fluor™ 555 (A30007) and Alexa Fluor™ 647 (A30009). For imaging experiments, unlabeled protein was supplemented with a minimal amount of fluorescently labeled protein. LEM2NTD contains a single lysine residue and could not be efficiently labeled with primary amine reactive probes. Instead, His6-SUMO-LEM2NTD was labeled with Alexa-488™ for fluorescence microscopy and a minimal amount was used to supplement indicated concentrations of unlabeled LEM2NTD for imaging.
Fluorescence microscopy phase separation, coacervation and microtubule bundling assays
Fluorescently labeled proteins were assayed for phase separation, coacervation and MT-bundling with spinning disk confocal microscopy, performed in glass-bottom 384-well plates (Greiner Bio-One # 7781892). Reactions for confocal microscopy were prepared in tubes and transferred to plates for imaging. LEM2NTD, LEM2Mim1, LEM2Mim2, and LEM275–122 droplets were allowed to settle for 15 min before imaging. LEM2NTD droplet formation was induced at room temperature by reducing the salt concentration to 150 mM KCl, keeping the concentrations of other buffer components the same; droplets were allowed to grow 60 minutes before imaging. LEM2NTD droplet (8 to 24 μM) or detergent-solubilized LEM2FL (8 μM) binding to MTs was tested with the addition of fluorescently labeled MTs (1 μM αβ-Tubulin polymerized into MT). MTs were prepared following the Cytoskeleton, Inc. protocol, in a molar ratio of 1:7 HiLyte647-Tubulin:unlabeled Tubulin, in G-PEM buffer (Cytoskeleton Inc. BST01). Unpolymerized tubulin, 1:7 labeled:unlabeled molar ratio, and Alexa555-labeled LEM2WH were tested for association with LEM2NTD droplets at concentrations of 8 μM each. Note that 150 mM KCl promotes MT depolymerization in the absence of stabilizing proteins. To assay coacervate formation, LEM2NTD (8 μM) was fluorescently imaged directly after reducing the salt concentration for LEM2NTD alone or in presence of 1 μM unpolymerized αβ-Tubulin, 30 bases RNA (5’-GGGCCUCCGCCCCCAGUGAGGGGCCGGCCC-3’), or 50 bases DNA (5’-AATGTATTGGTGGGGGCCTGCTCGGGATTGCGGATACGCCCTTGGATTGC-3’).
Spinning Disk Confocal Microscopy with Fluorescence Recovery After Photobleaching (FRAP)
To assay LEM2NTD droplet dynamics in FRAP and droplet fusion experiments, 384-well glass-bottom plates were PEGylated using PEG-Silane (LAYSAN BIO, MPEG-SIL-5000) followed by passivation with BSA, according to published protocols to prevent droplet association to silica surface34. Spinning disk confocal microscopy with FRAP was carried out using a W1-CSU with a Borealis upgrade (Andor) and ILE Laser Launch (laser lines 405nm, 488nm, 561nm, 647nm; Andor) on a Nikon Eclipse Ti microscope (Nikon Instruments, Inc.) equipped with a Rapp Optoelectronic UGA-40 (Rapp OptoElectronic) photobleaching unit and operated with MicroManager 2.0beta (Open Imaging). Fluorescence images were collected with an Andor Zyla 4.2 cMOS Camera (Oxford Instruments). Samples were imaged using a CFI Plan Apochromat VC 100X Oil NA 1.4 objective (Nikon Instruments, Inc.). Excitation wavelengths were: 488 nm for Alex488TM or FITC; 561 nm for Alex555TM; 640 nm for Alex-647. Photobleaching for FRAP experiments was done with a 473 nm laser (Vortran) for 200 ms per bleach event. Images were recorded with a frequency of 1 Hz, starting with at least one image recorded pre-bleach, including the bleach event, and up to 240 s post-bleaching. The ratio of the intensity within bleached regions of interest to background were calculated with ImageJ for each time point and normalized to the intensity at the time of bleaching. Replicates are aligned to the time of bleaching, averaged, and plotted ± standard deviation.
Negative stain electron microscopy
Continuous carbon grids (200–400 mesh copper, Quantifoil) were glow-discharged (PELCO EasiGlow, 15 mA, 0.39 mBar, 30 s). Samples (3 – 5 μL) were stained with 0.75% uranyl formate as described previously29. Images were collected with a Tecnai T12 microscope (FEI Company, Hillsboro, USA) with a LaB6 filament, operated at 120 kV, and data was captured with a Gatan Ultrascan CCD camera (Gatan, Inc., Pleasanton, USA). For MT-binding assays, reactions were prepared on grids and incubated for 2 min. MTs were used at a concentration of 1 μM αβ-Tubulin in pre-formed MTs. LEM2 constructs were imaged with MTs (Fig. 2F), at the following concentrations: 6 μM LEM2FL, 4 μM LEM2NTD, 200 μM LEM2145–165 (LEM2-PRA), 80 μM LEM2188–212 (LEM2-PRB). Reactions of MTs with LEM2NTD or LEM2188–212, to corroborate turbidimetry, were prepared as described above. Phosphomimetic constructs, LEM2Mim1 and LEM2Mim2, were tested for MT-bundling at 8 μM.
LEM2-induced CHMP7 Polymerization
LEM2 and CHMP7 proteins were mixed at concentrations ranging from 4 – 8 μM in a total volume of 50 μL. LEM2WH or LEM2NTD-Linker-WH was present in twofold molar excess to CHMP7 proteins, unless otherwise stated. The buffer was adjusted to between 600 and 800 mM KCl. Reactions were dialyzed for 9–12 h into low-salt buffer (30 mM HEPES, pH 8.0, 25 mM KCl, and 1 mM DTT) using Slide-A-Lyzer MINI Dialysis Device, 10K MWCO (Thermo Fisher Scientific). For experiments including MTs, a 3x stock of pre-formed, lyophilized MTs was prepared in buffer (30 mM HEPES, pH 8.0, 800 mM KCl, 1 mM DTT, 60 uM paclitaxel, and 3 mM MgCl2), and dialysis buffer was supplemented with 10 μM paclitaxel and 1 mM MgCl2. After dialysis, polymeric assemblies were concentrated by low speed centrifugation (5,000 g, 5 min) and resuspended in 30 μL buffer for negative stain EM, SDS-PAGE, or cross-linking mass spectrometry analysis. To determine the stoichiometry of the CHMP7-LEM2WH polymer, CHMP7 (4 μM) was titrated with LEM2WH (0, 0.08, 1 and 4 μM), dialyzed, and polymers were collected by low-speed centrifugation. The supernatant was collected such that 10 μL where left behind as the pellet fraction. Quantities of polymerized and unpolymerized CHMP7 at each LEM2 condition were measured by Coomassie-stained SDS-PAGE, in which equal volumes of pellet and supernatant fractions were loaded. Intensities were quantified by ImageJ. The data was normalized to samples containing 0 and equimolar amounts of LEM2WH.
Liposome preparation
Lipid solutions (Avanti Polar Lipids) were resuspended in chloroform, and liposomes were prepared as previously described29. Briefly, lipids (2 mg total) were dried in a glass vial to give final ratio (mole %) of 30% egg phosphatidylserine (PS), 30% egg phosphatidylcholine (PC) and 40% phosphatidylethanolamine (PE). Lipid films were dispersed in buffer (40 mM HEPES, pH 8.0, 150 mM KCl) to produce liposomes at a final concentration of 1 mg/mL, and stored at −80°C.
Microtubule bundling assay of full length LEM2 in presence of model membranes.
A dried lipid film in a glass vial (1 mg total containing final ratio (mole %) 60% egg PC, 24.7 % PE, 10% bovine liver phosphatidylinositol, 5% cholesterol, and 0.3% 18:1 Liss Rhod PE from Avanti Polar Lipids) was dispersed in buffer (40 mM HEPES, pH 8.0, 800 mM KCl, 5% glycerol, 0.1 % DDM) and sonicated at 30°C for 10 min to produce detergent solubilized lipids at a concentration of 1 mg/mL. Equal volumes detergent-solubilized lipids, activated Bio-Beads™ SM-2 Resin (BioRad), and concentrated LEM2FL (1 mg/mL) or LEM2FL buffer were combined and incubated overnight at 4°C. Detergent-depleted reactions were separated from resin and mixed with fluorescently labeled MT and G-PEM buffer (Cytoskeleton Inc. BST01) to a final KCl concentration of 150 mM and 1 μM Tubulin. Reactions were incubated for 1h at RT before imaging.
Membrane-induced CHMP7 polymerization
CHMP7 was dialyzed or diluted to reduce the salt concentration from 800 mM to 150 mM KCl (supplemented with 5% glycerol, 40 mM HEPES, pH 8.0, 1 mM DTT) to give a final protein concentration of 0.1 mg/ml. Liposomes and CHMP7 were mixed 40:1 (w/w) and negative stain EM grids were prepared immediately.
Electron Microscopy data acquisition and 2D classification
Membrane-induced CHMP7 polymers were prepared for negative stain EM and imaged with a Tecnai T20 microscope (FEI) with a LaB6 filament, operated at 200 kV. 227 micrographs were collected with a TemCam-F816 8k × 8k camera (TVIPS) using SerialEM software35, with a nominal pixel size of 1.57 Å. The defocus was 0.7 −1.7 μm and the total dose was 20 e-/Å2. Particles containing a repeating polymeric unit were picked manually along the polymeric protein chain, yielding 6094 particles. Specifically, particles were picked from polymers detached from membrane, which were in a favorable orientation for subsequent classification. Particles were picked and 2D-classified using default parameters within RELION version 2.0 software.
Cross-linking Mass spectrometry
Full length CHMP7 (60 μg) was polymerized with equimolar His6-SUMO-LEM2WH, following the described polymerization assay, and crosslinked with 2 mM light crosslinker (H12-BS3, Creative Molecules) for 30 min at 30°C. His6-SUMO-LEM2WH was used to achieve a higher protein concentration. Full length, monomeric CHMP7 (60 μg) was crosslinked with 2 mM heavy crosslinker (D12-BS3, Creative Molecules) under the same conditions. Reactions were quenched (10 mM ammonium bicarbonate, 10 min, room temperature), and light and heavy crosslinked reaction mixtures were combined and processed for mass spectrometry as described previously36,37. Crosslinked products were enriched by size-exclusion chromatography (Superdex Peptide, GE Healthcare Life Sciences) as described previously36 and fractions eluting between 0.9 and 1.4 mL were dried, resuspended in 0.1% formic acid for MS analysis. The fractions starting at 0.9 ml and 1.3 ml were combined prior to evaporation to make four total SEC fractions.
LC-MS analysis was performed with a Q-Exactive Plus mass spectrometer (Thermo Scientific) coupled with a nanoelectrospray ion source (Easy-Spray, Thermo) and NanoAcquity UPLC system (Waters). Enriched fractions were separated on a 15 cm × 75 μm ID PepMap C18 column (Thermo) using a 60-minute gradient from 5–28% solvent B (A: 0.1% formic acid in water, B: 0.1% formic acid in acetonitrile). Precursor MS scans were measured in the Orbitrap scanning from 350–1500 m/z (mass resolution: 70,000). The ten most intense triply charged or higher precursors were isolated in the quadrupole (isolation window: 4 m/z), dissociated by HCD (normalized collision energy: 24), and the product ion spectra were measured in the Orbitrap (mass resolution: 17,500). A dynamic exclusion window of 20 sec was applied and the automatic gain control targets were set to 3e6 (precursor scan) and 5e4 (product scan).
Peaklists were generated using Proteome Discoverer 2.2 (Thermo), and crosslinked peptides searched for with Protein Prospector 5.20.2338. 85 of the most intense peaks from each product ion spectrum were searched against a database containing His6-SUMO-LEM2WH along with the sequences of 10 other proteins comprising CHMP subunits and Tubulin, concatenated with 10 randomized decoy versions of each of these sequences (121 sequences total). Search parameters were: mass tolerance of 20 ppm (precursor) and 30 ppm (product); fixed modifications of carbamidomethylation on cysteine; variable modifications of peptide N-terminal glutamine conversion to pyroglutamate, oxidation of methionine, and “dead-end” modification of lysine and the protein N-terminus by semi-hydrolyzed heavy and light BS3; trypsin specificity was used with 2 missed cleavages and three variable modifications per peptide were allowed. Unique, crosslinked residue pairs were reported at a 1.5% FDR threshold, corresponding to a Score Difference cutoff of 15.
For quantitative analysis, precursor ion filtering in Skyline 4.139 was used to extract light:heavy crosslinked precursor ion signals. Skyline does not directly support crosslinking analysis, so crosslinked peptides were linearized and exported as a spectral library as previously described40. Transitions were generated for every light or heavy crosslinked peptide species discovered in the Protein Prospector search and paired with its corresponding heavy or light counterpart. Precursor ion transitions matching the first three isotopes were extracted across all four LC-MS fractions. Each extracted ion chromatogram was manually inspected and the start and end points were adjusted to ensure that the correct peaks were detected and that there were no interfering signals. Isotope dot products were required to exceed 0.85. The peak areas were re-imported into R and summarized at the level of crosslinked residues for each light and heavy crosslink. Peak areas were summed for all peptides matching a given crosslink. Finally, log2 ratios of the heavy to light peak areas were determined. Filtered cross-links were mapped to the primary protein structure using xiNET41.
Homology modeling and cross-link mapping
Homology models of human CHMP7 and LEM2 domains were created with Phyre242 (Supplementary Table 2). Reference structures were selected based on confidence scores and homology to reference structure. Models were validated by mapping cross-linking data to the models using UCSF Chimera43 together with Xlink analyzer44.
Immunostaining for fluorescence microscopy
Cells were fixed at room temperature in 2% paraformaldehyde for 25 min. The primary antibodies used for immunodetection were rabbit α-IST145, rabbit α-Tubulin (ab18251; abcam), rat α-Tubulin (YL1/2; Accurate Chemical & Scientific), α-Lamin B2 (AbCam; ab8983), α-SUN2 (gift from Brian Burke), and mouse α−53BP1 (MAB3802; Millipore). After incubation with fluorescently labeled secondary antibodies (α-rabbit 488, α-mouse 488, α-rabbit 647, and α-rabbit 568; Thermo Fisher), coverslips were mounted with DAPI ProLong Gold (Thermo Fisher) and imaged by either widefield microscopy (Zeiss Axioskop 2; Axiovision software), spinning disk confocal microscopy (Nikon Eclipse Ti; Metamorph software), or stimulated emission depletion microscopy (see below). For quantifying IST1 localization: α-rabbit 488 against rabbit α-IST1; for assessing DNA Damage in telophase cells: α-mouse 488 against mouse α−53BP1 and α-rabbit 568 against rabbit α-Tubulin; for quantifying and imaging the tubulin and nuclear envelope phenotype in telophase cells: α-mouse 488 against mouse α-SUN2 (INM marker for orthogonal imaging) or α-Lamin B2 (INM marker for quantitative experiments), and α-rabbit 568 against rabbit α-Tubulin; for interphase phenotypes: α-rabbit 488 against rabbit α-Tubulin; for STED: α-mouse 568 against mouse α-Tubulin and α-rabbit 647 against rabbit α-LEM2.
Stimulated Emission Depletion (STED) microscopy
STED microscopy was performed on a Leica TCS SP8 STED 3X confocal laser-scanning microscope equipped with a HC PL APO CS2 100x/1.40 OIL objective. Confocal sections were imaged with Leica LAS X Core software and processed with Huygens Software Suite (SVI). Images were recorded using 405 nm laser line at 1.4% laser power to image DAPI, and a 572 nm Laser line at 5.6% laser power to image Tubulin in confocal detector mode. LEM2 was imaged with a 653 nm laser line at 2.5% laser power in STED pulsed detector mode (gate start at 0.3 ns and gate end at 6.5 ns) with a Huygens saturation factor of 5.7. Deconvolved Images were contrast enhanced in ImageJ (NIH), raw data available upon request.
Quantification from fluorescence microscopy
For illustration, images of anaphase A and B cells were acquired by widefield microscopy at 100X and adjusted so that background fluorescence in the DNA, IST1, and LEM2-mChr channels were comparable between samples. Raw images acquired by widefield microscopy at 100X were used to score the IST1 phenotype in anaphase A (early) and anaphase B (late). IST1 localization to anaphase chromatin masses was assessed in three independent experiments in which images were coded, randomized and scored blindly by three independent scorers. Images were decoded and blind scores were quantified. Each chromatin disk (two per cell) was scored as having extra robust, robust, weak, or no recruitment for IST1. Robust recruitment was characterized by distinctive foci organized at the core of chromatin masses, whereas weak recruitment was characterized by less intense, often fewer, and less organized foci at the chromatin surface, consistent with what has previously been shown4. Extra robust was characterized by strikingly intense IST1 fluorescence, often accompanied by recruitment over most of the chromatin disk. For clarity, the robust and extra robust categories were graphed together as a single category. The majority score was used in cases where the three scores differed.
For time-lapse colocalization experiments tracking GFP-CHMP7, images of anaphase cells were acquired by time-lapse light microscopy (described below) and were selected for scoring at the time of peak LEM2-mCherry or LEM2ΔWH-mCherry enrichment at the core region of anaphase chromatin disks. In FIJI, each cell was thresholded for either LEM2-mCherry or LEM2ΔWH-mCherry enrichment. The mean fluorescence (arbitrary units) was measured for each region of interest in the GFP-CHMP7 channel. The regions of interest were subtracted from the area of the whole cell to measure the mean fluorescence of cytoplasmic GFP-CHMP7 for each anaphase cell. The plotted values are the mean GFP-CHMP7 fluorescence of the region of interest, as determined by exogenous LEM2 enrichment, normalized to the mean fluorescence of cytoplasmic GFP-CHMP7.
Nuclear accumulation of NLS-3GFP in either late anaphase or telophase was determined by taking the ratio of nuclear to cytoplasmic NLS-3GFP at either one-minute intervals throughout anaphase (after imaging at 15s intervals) or 30 minutes after complete cleavage furrow ingression, in telophase (time-lapse microscopy described below). In FIJI, regions of chromatin were defined as regions of interest in the NucBlue™ channel and used to measure mean fluorescence (arbitrary units) of nuclear NLS-3GFP in late anaphase or the integrated density (the product of area and mean gray value) in telophase cells. Cytoplasmic levels of NLS-3GFP were determined by selecting the whole cell, and subsequently deselecting the regions of chromatin. For anaphase cells, the mean fluorescence of nuclear NLS-3GFP for each disk was then divided by the mean fluorescence of cytoplasmic NLS-3GFP of the same cell. For telophase, the integrated density was used to account for changes in nuclear size due to decondensation.
For the purposes of illustration, interphase and telophase cells were acquired by widefield and time-lapse microscopy and were adjusted so that background fluorescence was comparable between samples. Spinning disk confocal microscopy at 60X was used to acquire z-stacks for orthographic projection. Raw images used to score the nuclear envelope and tubulin phenotype in telophase were acquired by widefield microscopy at 60X. To score DNA damage in telophase, images were acquired by widefield microscopy at 60X and thresholded uniformly in FIJI. Nuclear foci were detected using the find maxima function in FIJI and noise tolerance was held constant for all conditions. To score interphase nuclear circularity, images were acquired by widefield microscopy at 60X. The DNA channel was thresholded in FIJI and each nucleus was defined as a region of interest. The nuclei were then assessed for their circularity (circularity = 4pi(area/perimeter^2), as described by others46.
Time-Lapse Light Microscopy Analysis
All live imaging experiments were imaged at 60X by spinning disk confocal microscopy using glass-bottomed Mat-Tek dishes. For experiments tracking chromatin, cells were treated with NucBlue™ (Thermo Fisher) 1 hr prior to imaging, per manufacturer’s instructions. Stable cell lines and plasmids for transient transfection used in this study are described in Supplementary Table 3. Cells stably expressing GFP-Lamin B2 and LEM2-mCherry were cultured for 48 hours and treated with 200nM SiR-Tubulin (CY-SC006; Cytoskelton, Inc.) 1 hour prior to imaging. Cells stably expressing GFP-BAF and LEM2-mCherry were also cultured asynchronously. All other experiments were subjected to cell-cycle synchronization, as described below. To track nuclear integrity, cells stably expressing NLS-3GFP (PL19) alone or in combination with the stable expression of either siRNA resistant LEM2-mCherry (PL13), LEM2ΔSY-mChr (PL16), LEM2ΔPR-mChr (PL17), or LEM2ΔWH-mCherry (PL18) were imaged in either 15-second intervals (to assess anaphase compartmentalization) or 3-minute intervals for at least 30 minutes following complete cleavage furrow ingression (to assess telophase compartmentalization). In the latter experiments, 100 nM SiR-Tubulin (CY-SC006; Cytoskelton, Inc.) was added 1 hr prior to imaging. HeLa cells stably expressing H2B-mCherry and GFP-Tubulin were treated with siRNA oligos, as described below. For transient expression experiments, cells were transfected with plasmids using Lipofectamine LTX Plus (Thermo Fisher) for 24 h, then re-plated and subjected to cell-cycle synchronization. Cells stably expressing GFP-Tubulin47 were transiently transfected with siRNA resistant pCMV(Δ5)-LEM2-mCherry (PL13), pCMV(Δ5)-LEM2m21-mCherry (PL14), pCMV(Δ5)-LEM2ΔLCD-mCherry (PL15), pCMV(Δ5)-LEM2ΔSY-mCherry (PL16), pCMV(Δ5)-LEM2ΔPR-mCherry (PL17), or pCMV(Δ5)-LEM2ΔWH-mCherry (PL18). For time-lapse colocalization experiments, HeLa cells stably expressing GFP-CHMP7 were transiently transfected with either siRNA resistant pCMV(Δ5)-LEM2-mCherry (PL13) or siRNA resistant pCMV(Δ5)-LEM2ΔWH-mCherry (PL17).
siRNA-Mediated Depletion and Cell-Cycle Synchronization
HeLa cells were a gift from Maureen Powers (Emory University School of Medicine) and U2OS were a gift from Don Ayer (University of Utah School of Medicine); both cell lines were authenticated by STR profiling. All HeLa cell lines were generated from the same parental HeLa cells, which tested negative for mycoplasma contamination. U2OS cells were not tested for mycoplasma contamination. HeLa and U2OS cells were plated on fibronectin-coated coverslips in the presence of 10 nM siRNA oligo, delivered by Lipofectamine RNAiMAX Transfection Reagent (Thermo Fisher). Specific sequences used were: siControl [siScr-1]47,48, siLEM2–1 [antisense sequence targeting nucleotides 78–98: UUGCGGUAGACAUCCCGGGdTdT19], siLEM2–2 [antisense sequence targeting nucleotides 1,297–1,317: UACAUAUGGAUAGCGCUCCdTdT19], and siCHMP7 [antisense sequence targeting nucleotides 650–669: CCCUCUUCUAACACUUCAAdTdT]49. In experiments testing whether exogenous LEM2 could rescue function after endogenous LEM2 depletion, siLEM2–2 was used to deplete endogenous LEM2 as exogenous LEM2 constructs harbor silent mutations that confer resistance to the siLEM2–2 oligo. For cell-cycle synchronization experiments, 6–8 hours after plating, 2 mM thymidine was added for 24 h to arrest cells at G1/S. Cells were then rinsed thoroughly with PBS, followed by the addition of culture media. Twelve hours after release, cells were imaged live or fixed for microscopy. For experiments tracking interphase phenotypes, cells were fixed for immunostaining sixteen hours after release. To assess the phosphorylation status of exogenous LEM2 at different stages of the cell cycle, cells were arrested at G1/S by treating with 2 mM thymidine for 24 h. G1/S-arrested cells were then either harvested or thoroughly rinsed with PBS before the addition of culture media containing 100ng/mL nocodazole. After 16 h of nocodazole treatment, mitotic cells were harvested by shake off. Cell pellets were rinsed in TBS before lysis and separation by Phos-Tag™ acrylamide SDS-PAGE50 and subsequent immunoblot (described below).
Immunoblots
To verify efficacy of siRNA treatments and expression of siRNA-resistant constructs, cells were plated in six-well dishes and subjected to the same experimental conditions as those used to generate imaging data. Primary antibodies [α-LEM2 (HPA017340; Sigma-Aldrich), α-mCherry (Novus Biologicals, NBP2–25157), α-Tubulin (ab18251; abcam)] were detected with HRP-coupled secondary antibodies (Thermo Fisher) and chemiluminescence. To assess phosphorylation of exogenous LEM2 by mobility shift, whole cell lysates were prepared in lysis buffer lacking EDTA and phosphatase inhibitors. Aliquots of each lysate were then subjected to either lambda protein phosphatase treatment per the manufacturer’s instructions (P0753S; NEB) or a control reaction treatment containing only PMP buffer and MnCl2. Samples were run on 8 and 10% SDS-PAGE gels prepared with Phos-Tag™ Acrylamide reagent (AAL-107; Waco) per the manufacturer’s instructions. Detection of LEM2 by immunoblot was performed as described above.
Extended Data
Extended Data Fig. 1 |. The N-terminus of LEM2 possesses a canonical BAF-binding LEM domain and a low complexity domain (LCD).
a, Live-cell imaging of GFP-Lamin B2 and LEM2-mChr; DNA is stained with NucBlue and tubulin detected with SiR-tubulin. Time 0 refers to complete cleavage furrow ingression. Representative of 10 or more cells imaged across at least 3 biological replicates. b, Multiple sequence alignment of LEM domains across LEM family proteins, highlighting a conserved four-amino acid sequence that, when mutated in Emerin (EMDm24), disrupts BAF binding20. The position of an analogous mutation in LEM2 (LEM2m21) is indicated. Scale bar 2 μm c, HeLa cells stably expressing LEM2-mCherry and EGFP-BAF live-imaged during anaphase. Representative of 10 or more cells imaged across at least 3 biological replicates for both fixed and live-cell imaging. Scale 10 μm. d, Top: A homology model for LEM21–72 -BAF-DNA complex51, based on PDB:2BZF and PDB:2ODG32,51. Middle: Absorbance at 280 nm as a function of retention volume (mL) from analytical size exclusion chromatography. Retention volumes for major peaks (arrowheads) and predicted molecular weights for protein or protein-DNA complexes are listed. Bottom: SDS-PAGE of major peak for LEM21–72+BAF+DNA sample. Representative of 3 technical replicates. For gel source data, see Supplementary Fig. 1. e, LEM2’s LCD percent amino acid composition, and the compositions of two subregions, compared to an average amino acid composition. f, Schematic of LEMNTD with amino acid substitutions (S, T, or Y to D) relative to SY-rich (yellow) and PR-rich (rust) regions, in LEM2NTD Mim1 and Mim2 constructs. LEM2 immunoblot assessing the migration pattern of full length, also shown in Fig. 1e, and mutant LEM2-mChr constructs following separation by Phos-tag SDS-PAGE. Cell lysates were prepared from G1/S- and prometaphase- arrested cells expressing the indicated exogenous LEM2; lysates treated with lambda phosphatase (λ-PP) are indicated. Representative data from 2 biological replicates, with 1 and 3 technical replicates per biological replicate. For immunoblot source data, see Supplementary Fig. 1. g, Amino acid sequence of the peptide corresponding to LEM2’s SY-rich and PR-rich regions. Concentration-dependent droplet formation by the LEM2SY peptide, juxtaposed with similar data collected for full LEM2NTD as in Fig 1d. Representative of 3 technical replicates. h, Fluorescence microscopy of purified LEM2NTD with indicated molecular anions. Image representative of 2 technical replicates. Scale 2 μm.
Extended Data Fig. 2 |. LEM2 wets the surface of microtubules with a liquid-like coat.
a, Additional example of STED imaging of endogenous LEM2 localization during late anaphase. Scale 150 nm. Representative of data from 4 cells. b, Fluorescence imaging of indicated combinations of LEM2FL-Alexa488 (magenta), Tubulin-Alexa647 (green), and lipids labeled with PE-rhodamine (cyan). Scale 2 μm. Representative of 2 technical replicates. c, Light scattering at 340 nm (turbidity) of MT bundling by indicated LEM2 constructs. Half maximal concentration of LEM2NTD is 1.303 μM +/− 0.1 μM. Quantification of mean +/− SEM for n=3 independent samples. d, Negative stain EM of MTs alone or MTs with indicated concentrations of LEM2NTD, corresponding to the concentrations measured by light scattering. Images representative of at least 6, scale 25 nm. e, Fluorescence microscopy of LEM2NTD Alexa488 in combination with Tubulin-Alexa647, LEM2WH-Alexa555, and GTP/MgCl2, as indicated. Scale 10 μm. Images are representative of at least 3. f, Example images for FRAP of LEM2FL- and LEM2NTD-coated MT bundles, representative of 5 independent samples (LEM2FL) or 17 independent samples (LEM2NTD). g, Top: Kymograph across bleached region. Bottom: FRAP of LEM2NTD-coated MT bundle. Images show fluorescent LEM2NTD channel. Scale 2 μm. Representative of 8 technical replicates.
Extended Data Fig. 3 |. LEM2-LCD bundles microtubules in vitro through a regulated MT-binding domain.

a, Amino acid sequences of 6 LEM2 peptides tiling the LCD. LEM2145–165 is LEM2-PRA, and LEM2188–212 is LEM2-PRB. b, Light scattering at 340 nm (turbidity) of MT bundling by indicated LEM2 peptides. Half maximal concentration of LEM2188–212 (LEM2-PRB) equals 85.11 μM. For LEM2188–212, data plotted are mean +/− SEM for n=3 technical replicates. LEM240–60, LEM261–81, LEM2123–144, LEM2166–187, did not bundle. c, Negative stain EM of MTs alone or MTs with indicated concentrations of LEM2188–212, corresponding to turbidity reactions. Scale 25 nm. For each condition, images are representatives of 7. d, Live cell imaging of indicated LEM2ΔSY-mChr and LEM2ΔPR-mChr deletion constructs (magenta) and GFP-tubulin (green). Time 0 refers to time of complete cleavage furrow ingression. Scale 2 μm. Images are representative of 3 independent experiments. e, Negative stain EM of MTs co-incubated indicated phosphomimetic proteins. Scale 25 nm. Images are representative of 2 technical replicates. f, Light scattering at 340 nm (turbidity) of MT bundling by phosphomimetic LEM2 constructs. Vertical lines are half max and shading are standard error; LEM2NTD (green) half max 1.303 μM; error 1.144 to 1.493 μM, LEM2Mim1 (red) half max 2.824 μM; error 2.283 to 3.397μM, LEM2Mim2 (blue) half max 8.442 μM, error 7.511 to 10.06 μM. Data plotted are mean +/− SEM from 3 technical replicates.
Extended Data Fig. 4 |. LEM2 WH domain is required for IST1 recruitment to the nascent NE and mediates polymer formation with CHMP7.
a, Top: Quantification of robust IST1 recruitment to chromatin disks in late anaphase, as assessed by blind scoring. Mean +/− SEM determined from 3 independent experiments. (siControl parental: n=80, 58, 106; siLEM2–2 parental: n=78, 50, 58; siControl LEM2-mChr: n=46, 42, 62; siLEM2–2 LEM2-mChr: n=78, 51, 62; siControl LEM2ΔWH-mChr: n=138, 52, 42; siLEM2–2 LEM2ΔWH-mChr: n=112, 48, 51). Two-tailed unpaired t-test was used to determine p-values. No multiple comparisons. Bottom: Representative images by widefield showing localization of endogenous IST1 in late anaphase cells depleted of endogenous LEM2 and expressing the indicated siRNA resistant LEM2-mChr constructs. Scale 2 μm. b, Top: Quantification of the percent of early anaphase disks with robust IST1 recruitment, as assessed by blind scoring. Mean +/− SEM determined from 3 independent experiments (siControl parental: n=38, 16, 20; siLEM2–2 parental: n=24, 10, 25; siControl LEM2-mChr: n=50, 20, 24; siLEM2–2 LEM2-mChr: n=38, 14, 8; siControl LEM2ΔWH-mChr: n=44, 16, 20; siLEM2–2 LEM2ΔWH-mChr: n=20, 4, 14). Two-tailed unpaired t-test was used to determine p-values. No multiple comparisons. Bottom: Representative images by widefield showing localization of endogenous IST1 in early anaphase cells depleted of endogenous LEM2 and expressing the indicated siRNA resistant LEM2-mChr constructs. Scale 2 μm. c, Negative stain EM corresponding to the CHMP7 polymerization assay showing no polymerization for the control condition CHMP7+LEM2NTD. Representative of 2 technical replicates.
Extended Data Fig. 5 |. Homology modeling and crosslinking-mass spectrometry (XL-MS) consistent with a WH domain-swap mechanism for CHMP7 activation by LEM2.

a, Workflow of lysine-lysine hybrid peptide mapping using XL-MS. BS3 cross-links surface accessible Lys residues with Cα-Cα distances <~3nm. b, Homology models for the winged helix (WH) domains of CHMP7 and LEM2 from reference structures described in Supplementary Table 2. WH1 of CHMP7 contains a membrane binding region indicated as a loop4. c, Homology models of the CHMP7 ESCRT-III-fold in open and closed conformations. Alpha helices 1–2 (green), 3–4 (orange). d, Distance restraints identified from XL-MS analysis of the CHMP7 monomer were mapped to open and closed homology models. Cα-Cα distances > 3 nm are considered violations. Satisfied restraints are shown in blue, and violated restraints are shown in red. The open ESCRT-III conformation was rejected. e, Top: A crystallographic interface between VPS25 and an ESCRT-III helix28 serves as template for the XL-MS informed homology model of the CHMP7 WH2 interaction with the CHMP7 ESCRT-III domain. For details on template structures see Supplementary Table 2. Middle and bottom: All cross-links are satisfied when mapped to the closed CHMP7-ESCRT-III model (middle and lower panel) and agree with domain connectivity. A subset of cross-links was not satisfied when mapping WH1 instead to the same interface (data not shown). f, Left: Distance restraints identified from XL-MS analysis of CHMP7 monomer mapped to conformation of polymerized CHMP7 consistent with 2D class averages. Violated restraints suggest a hinge region between CHMP7 WH1 and WH2 that allows its WH1 to move closer to the ESCRTIII core (black arrow). Right: Violated restraints to WH2 are indicated.
Extended Data Fig. 6 |. Activated CHMP7 forms polymeric rings via its ESCRT-III domain, exposing its tandem WH domains.
a, CHMP7 point mutations are indicated in an open ESCRT-III-fold, representing polymerized CHMP7. b, Negative stain EM of His6-SUMO-LEM2WH co-incubated with CHMP7 mutants. Scale bars are 50 nm. Images representative of 3 technical replicates. c, SDS-PAGE of pellet (P) or supernatant (S) following centrifugation of LEM2WH incubated with wild type or mutant CHMP7. For gel source data, see Supplementary Figure 1. d, Quantification of pelleted protein after SDS-PAGE and Coomassie blue staining for mutant versus wild type proteins. Mean +/− SD quantified from n=3 independent experiments. e, SDS-PAGE based relative quantification of polymerized and pelleted CHMP7 with different ratios of LEM2WH present. Red lines indicate expected fraction of CHMP7 in the pelleted polymer, assuming 1:1 stoichiometric polymer. Mean +/− SD quantified from n=3 independent experiments. For gel source data, see Supplementary Figure 1. f, Negative stain EM of CHMP7 polymers on a liposome. Scale 100 nm. g, Top, negative stain EM of membrane-induced CHMP7 polymers used for 2D averaging. Scale 20 nm. Bottom, representative 2D-class averages from manually particles from polymers shown at top. f and g representative of 5 technical replicates. h, Negative stain EM of CHMP7ESCRT-III (AA: 229–453). Representative of 3 technical replicates. Scale 20 nm.
Extended Data Fig. 7 |. LEM2 promotes early nuclear compartmentalization via cooperation between its LCD and WH domains.
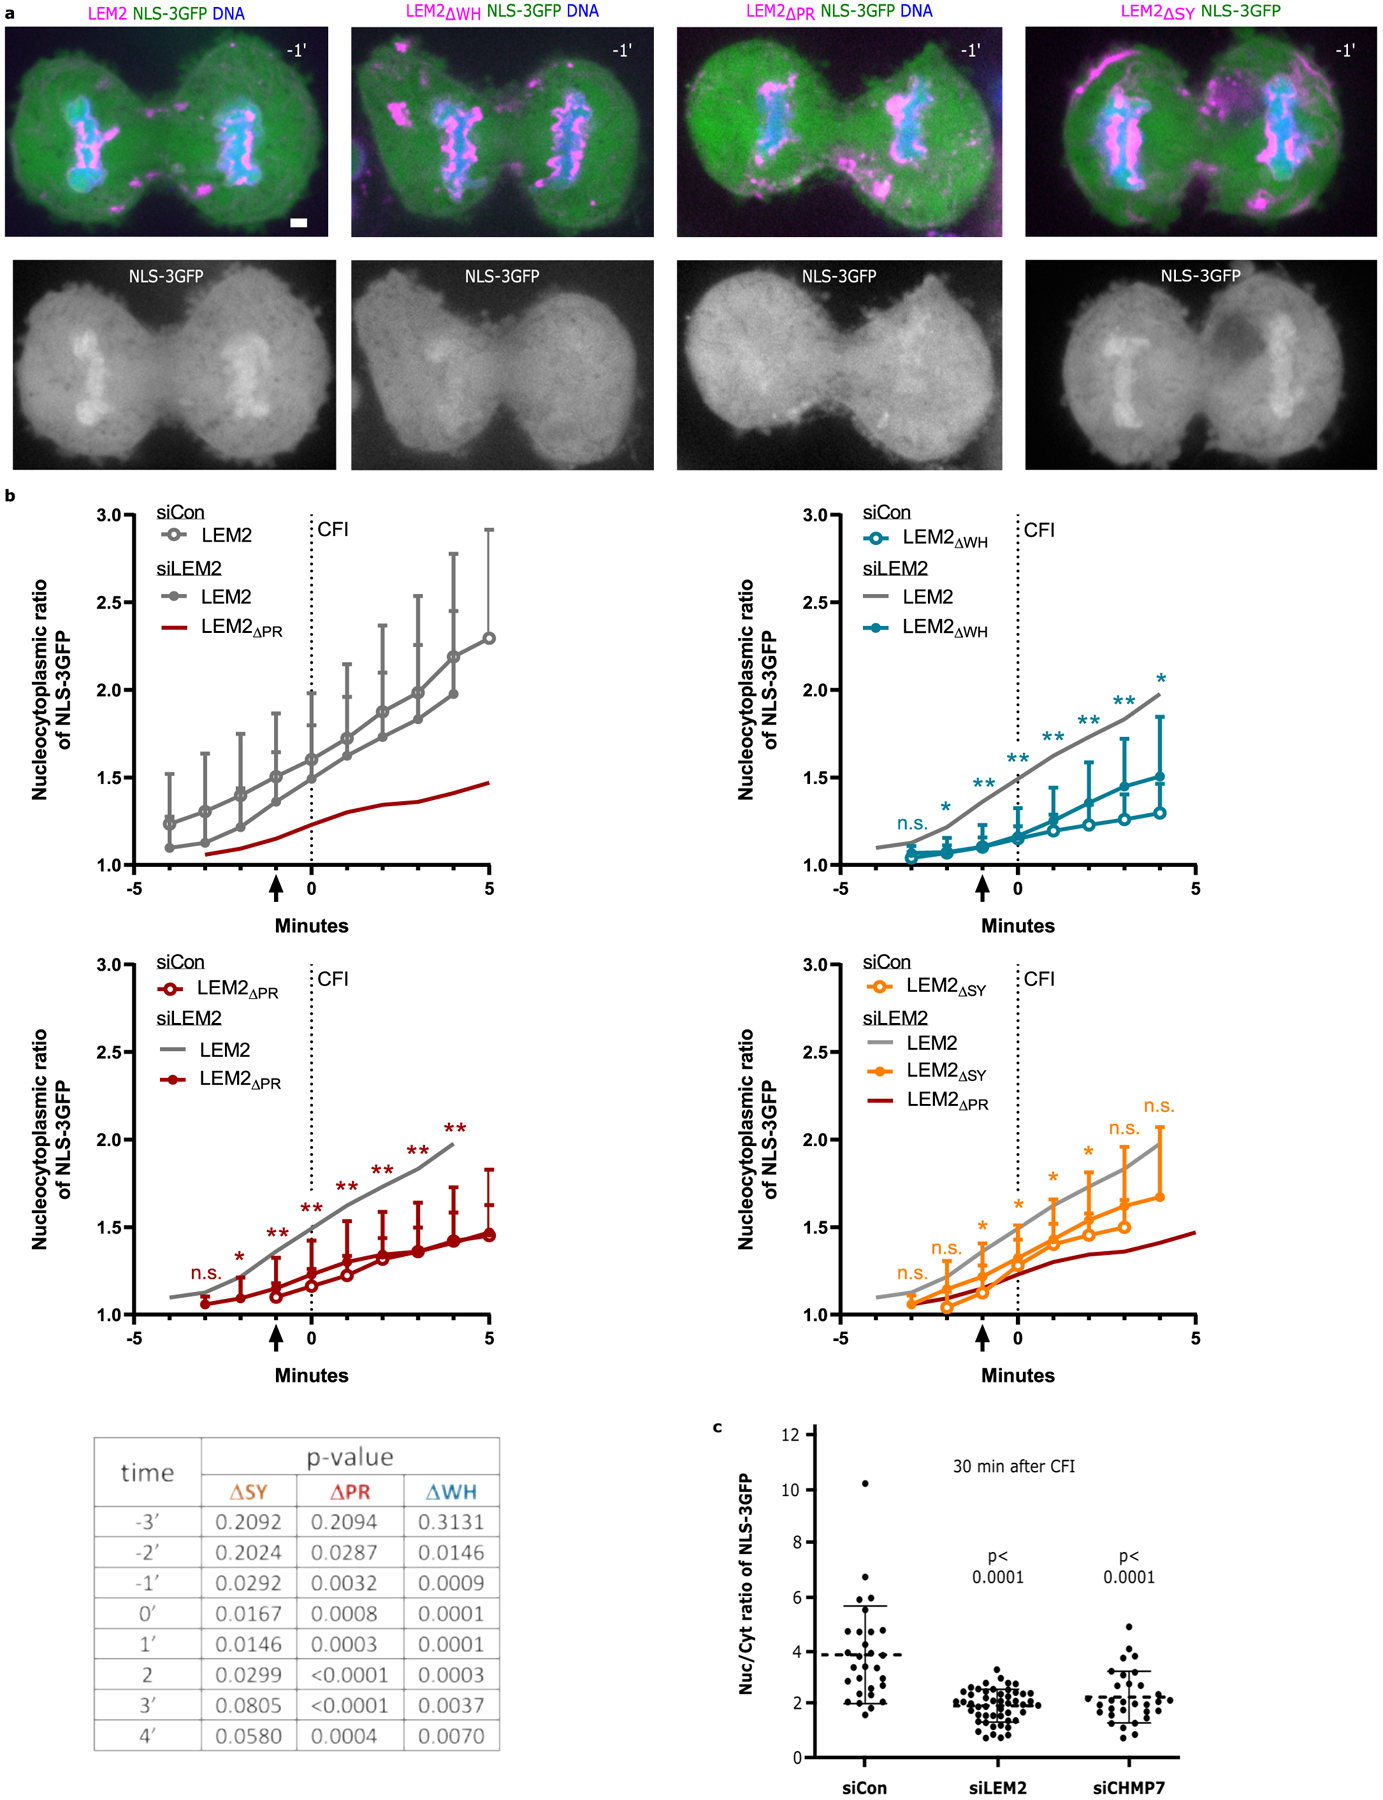
a, Example images of cells treated with siLEM2 and expressing NLS-3GFP in combination with siRNA resistant LEM2 constructs corresponding to the quantification graphs shown in b and main text Fig. 3f. DNA was labeled using NucBlue. Time 0 refers to the time of complete cleavage furrow ingression. Scale bar 2 μm. b, Mean nuclear/cytoplasmic ratio of NLS-3GFP fluorescence over time in cells treated with the indicated siRNAs and expressing the indicated siRNA resistant constructs. Cells imaged at 15s intervals though 1min increments are plotted. Data was collected across at least 3 biological replicates and the mean +/− SD are plotted (siCon LEM2-mChr; n=26; siLEM2–2 LEM2-mChr: n=44; siCon LEM2ΔSY-mChr: n=20; siLEM2–2 LEM2ΔSY-mChr: n=24; siCon LEM2ΔPR-mChr: n=20; siLEM2–2 LEM2ΔPR-mChr: n=20; siCon LEM2ΔWH-mChr: n=24; siLEM2–2 LEM2ΔWH-mChr: n=16). Two-tailed unpaired t-test was used to determine p-values comparing deletion mutant lines to the full length LEM2 line under endogenous LEM2 depletion conditions at each timepoint. No multiple comparisons. Asterisk code graphed for clarity (*P < 0.05; **P < 0.005) while exact are p-values reported in the table shown at the bottom. c, Quantification of nuclear/cytoplasmic ratio of NLS-3GFP approximately 30 minutes after complete cleavage furrow ingression in parental HeLa cells treated with the indicated siRNAs. Data was collected across 3 biological replicates and plotted as mean +/− SD (siControl: n=11, 12, 6; siLEM2–2: n=18, 18, 14; siCHMP7: n=11, 6, 14). Two-tailed unpaired t-test was used to determine p-values. No multiple comparisons.
Extended Data Fig. 8 |. Loss of LEM2 functions leads to DNA damage and abnormal nuclear morphologies.

a, Live-cell imaging of GFP-tubulin and H2B-mChr in siRNA treated cells. Images representative of 2 biological replicates and quantified in b. Time 0 refers to the time of complete cleavage furrow ingression. Scale 2 μm. b, Left: Orthogonal view of the tubulin phenotype following LEM2 depletion co-stained for the NE protein SUN2. Images representative of 3 biological replicates. Scale 5 μm. Right: The mean percent of telophase cells with nuclear tubulin defects, lined with inner nuclear membrane (as assessed by immunofluorescence of Lamin B2). Data plotted are mean +/− SEM from 3 biological replicates (siControl: n=75, 35, 37; siLEM2–1: n=72, 35, 37; siLEM2–2: n=45, 34, 34). Two-tailed unpaired t-test was used to determine p-values. No multiple comparisons. c, Left: Example images of 53BP1 localization by immunofluorescence in telophase U2OS cells following siRNA treatment, as quantified on the right. Scale 5μm. Right: Quantification of the percent of telophase cells with ≥5 53BP1 nuclear foci. Mean +/− SEM percent of telophase cells with ≥5 53BP1 foci determined from 3 biological replicates (siControl: n=56, 52, 44; siLEM2–1: n=64, 56, 26; siLEM2–2: n=74, 50, 40). Two-tailed unpaired t-test was used to determine p-values. No multiple comparisons. Bottom: immunoblot confirming depletion of endogenous LEM2 in U2OS cells, using siRNA oligos previously validated in other human cell lines, including HeLa (immunoblot source data shown in Supplementary Fig. 1)4,19. d, Negative stain EM of indicated combinations of MT, LEM2NTD-linker-WH, and CHMP7FL. Scale 25 nm. Images representative of 2 technical replicates. e, Example images of cells expressing the indicated siRNA-resistant constructs and treated with the indicated siRNAs. LEM2-mChr in magenta, DAPI-stained DNA in blue, and tubulin immunofluorescence in green. Cells were arrested in S-phase and then allowed to progress through one round of division, resulting in an interphase population of cells that just exited mitosis. We observed an increased number of highly irregular nuclei in cells expressing either LEM2ΔPR-mChr or LEM2ΔWH-mChr compared to cells expressing full-length LEM2 or even those depleted of LEM2. Notably, deformed nuclei were commonly associated with microtubule disorganization and aberrant accumulation of LEM2ΔPR-mChr and LEM2ΔWH-mChr. Representative nuclear, tubulin, and LEM2 phenotypes and the correspondence to nuclear circularity score is shown. Nuclear borders and circularity scores annotated in tubulin channel. Scale 5μm. These findings suggest that interfering with cooperation between LEM2’s microtubule-interacting and ESCRT-binding domains alters nuclear morphology, indicating that both activities are necessary, but neither is sufficient for NE reformation. Moreover, the presence of one activity without the other is detrimental to nuclear morphology. f, Quantification of nuclear circularity in interphase parental HeLa cells and cells expressing the indicated siRNA-resistant LEM2 constructs, treated with the indicated siRNAs. Data plotted are mean +/− SEM from 3 biological replicates (siControl parental: n=105, 46, 80; siLEM2–2 parental: n=102, 116, 59; siControl LEM2-mChr: n=153, 53, 122; siLEM2–2 LEM2-mChr: n=84, 81, 105; siControl LEM2ΔSY-mChr: n=123, 68, 144; siLEM2–2 LEM2ΔSY-mChr: n=93, 95, 105; siControl LEM2ΔPR-mChr: n=149, 123, 58; siLEM2–2 LEM2ΔPR-mChr: n=49, 31, 42; siControl LEM2ΔWH-mChr: n=116, 96, 94; siLEM2–2 LEM2ΔWH-mChr: n=85, 32, 68). Two-tailed unpaired t-test was used to determine p-values comparing circularity scores less than 0.6 (indicated by blue) between the indicated treatments. No multiple comparisons. g, Immunoblot showing relative levels of the siRNA-resistant constructs fused with mCherry in parallel with endogenous LEM2. Representative of 2 technical replicates. For immunoblot source data, see Supplementary Fig. 1.
Supplementary Material
Acknowledgments:
We thank Wesley I. Sundquist and Sy Redding for critically reading the manuscript. For reagents, technical advice, and discussions we thank the Redding, Narlikar, Frost, and Ullman labs, as well as the Nikon Imaging Center at UCSF. We thank Lauren Williams for helping score cell phenotypes and Michelle Mendoza and Jody Rosenblatt for generously sharing microscope and other resources. We also thank the UCSF Center for Advanced cryoEM, including Alexander Myasnikov, David Bulkley and Michael Braunfeld.
Funding: Our research was supported by NIH grants P50 GM082545, 1DP2-GM110772 (A.F.), 1R01-GM131052 (K.S.U.), and the Huntsman Cancer Foundation (K.S.U). Shared resources used at the University of Utah were funded in part by the Huntsman Cancer Institute Cancer Center Support Grant NIH P30CA042014. Mass spectrometry analysis at the UCSF Mass Spectrometry Resource was supported by the Dr. Miriam and Sheldon G. Adelson Medical Research Foundation and a shared instrument grant (NIH S10OD016229). A.v.A was funded by EMBO (ALTF 455-2016) and the German Research Foundation (DFG AP 298/1-1). I.E.J. was funded by the NSF Graduate Research Fellowship (1000232072) and a Mortiz-Heyman Discovery Fellowship. Adam Frost is a Chan Zuckerberg Biohub investigator and an HHMI faculty scholar.
Footnotes
Competing interests: The authors declare no conflict of interest.
Data Availablility
Raw data and peaklists from the quantitative crosslinking mass spectrometry analysis can be accessed with MassIVE: ftp://massive.ucsd.edu/MSV000084837/. Crosslinked peptide spectral assignments are accessible using accession: rgf6hriush at http://msviewer.ucsf.edu/prospector/cgi-bin/msform.cgi?form=msviewer. The uncropped blots and gels are provided in Supplementary Fig. 1. Source Data for Figs. 1–3 and Extended Data Figs. 1–5,7 and 8 are provided with the paper.
References
- 1.Ungricht R & Kutay U Mechanisms and functions of nuclear envelope remodelling. Nat Rev Mol Cell Biol 18, 229–245, doi: 10.1038/nrm.2016.153 (2017). [DOI] [PubMed] [Google Scholar]
- 2.Vietri M et al. Spastin and ESCRT-III coordinate mitotic spindle disassembly and nuclear envelope sealing. Nature 522, 231–235, doi: 10.1038/nature14408 (2015). [DOI] [PubMed] [Google Scholar]
- 3.Olmos Y, Hodgson L, Mantell J, Verkade P & Carlton JG ESCRT-III controls nuclear envelope reformation. Nature 522, 236–239, doi: 10.1038/nature14503 (2015). [DOI] [PMC free article] [PubMed] [Google Scholar]
- 4.Gu M et al. LEM2 recruits CHMP7 for ESCRT-mediated nuclear envelope closure in fission yeast and human cells. Proc Natl Acad Sci U S A 114, E2166–E2175, doi: 10.1073/pnas.1613916114 (2017). [DOI] [PMC free article] [PubMed] [Google Scholar]
- 5.Haraguchi T et al. BAF is required for emerin assembly into the reforming nuclear envelope. J Cell Sci 114, 4575–4585 (2001). [DOI] [PubMed] [Google Scholar]
- 6.Margalit A, Segura-Totten M, Gruenbaum Y & Wilson KL Barrier-to-autointegration factor is required to segregate and enclose chromosomes within the nuclear envelope and assemble the nuclear lamina. Proc Natl Acad Sci U S A 102(9), 3290–3295, doi: 10.1073/pnas.0408364102 (2005). [DOI] [PMC free article] [PubMed] [Google Scholar]
- 7.Herrada I et al. Purification and Structural Analysis of LEM-Domain Proteins. Methods Enzymol 569, 43–61, doi: 10.1016/bs.mie.2015.07.008 (2016). [DOI] [PubMed] [Google Scholar]
- 8.Barton LJ, Soshnev AA & Geyer PK Networking in the nucleus: A spotlight on LEM-domain proteins. Curr Opin Cell Biol 34, 1–8, doi: 10.1016/j.ceb.2015.03.005 (2015). [DOI] [PMC free article] [PubMed] [Google Scholar]
- 9.Raab M et al. ESCRT III repairs nuclear envelope ruptures during cell migration to limit DNA damage and cell death. Science 352, 359–362, doi: 10.1126/science.aad7611 (2016). [DOI] [PubMed] [Google Scholar]
- 10.Denais CM et al. Nuclear envelope rupture and repair during cancer cell migration. Science 352, 353–358, doi: 10.1126/science.aad7297 (2016). [DOI] [PMC free article] [PubMed] [Google Scholar]
- 11.Halfmann CT et al. Repair of nuclear ruptures requires barrier-to-autointegration factor. J Cell Biol 218, 2136–2149, doi: 10.1083/jcb.201901116 (2019). [DOI] [PMC free article] [PubMed] [Google Scholar]
- 12.Thaller DJ et al. An ESCRT-LEM protein surveillance system is poised to directly monitor the nuclear envelope and nuclear transport system. Elife 8, doi: 10.7554/eLife.45284 (2019). [DOI] [PMC free article] [PubMed] [Google Scholar]
- 13.Penfield L et al. Dynein-pulling forces counteract lamin-mediated nuclear stability during nuclear envelope repair. Mol Biol Cell, doi: 10.1091/mbc.E17-06-0374 (2018). [DOI] [PMC free article] [PubMed] [Google Scholar]
- 14.Mekhail K & Moazed D The nuclear envelope in genome organization, expression and stability. Nat Rev Mol Cell Biol 11, 317–328, doi: 10.1038/nrm2894 (2010). [DOI] [PMC free article] [PubMed] [Google Scholar]
- 15.Barrales RR, Forn M, Georgescu PR, Sarkadi Z & Braun S Control of heterochromatin localization and silencing by the nuclear membrane protein Lem2. Genes Dev 30, 133–148, doi: 10.1101/gad.271288.115 (2016). [DOI] [PMC free article] [PubMed] [Google Scholar]
- 16.Ebrahimi H, Masuda H, Jain D & Cooper JP Distinct ‘safe zones’ at the nuclear envelope ensure robust replication of heterochromatic chromosome regions. Elife 7, doi: 10.7554/eLife.32911 (2018). [DOI] [PMC free article] [PubMed] [Google Scholar]
- 17.Pieper GH, Sprenger S, Teis D & Oliferenko S ESCRT-III/Vps4 controls heterochromatin-nuclear envelope attachments. bioRxiv, 579805, doi: 10.1101/579805 (2019). [DOI] [PMC free article] [PubMed] [Google Scholar]
- 18.Brachner A, Reipert S, Foisner R & Gotzmann J LEM2 is a novel MAN1-related inner nuclear membrane protein associated with A-type lamins. J Cell Sci 118, 5797–5810, doi: 10.1242/jcs.02701 (2005). [DOI] [PubMed] [Google Scholar]
- 19.Ulbert S, Antonin W, Platani M & Mattaj IW The inner nuclear membrane protein Lem2 is critical for normal nuclear envelope morphology. FEBS Lett 580, 6435–6441, doi: 10.1016/j.febslet.2006.10.060 (2006). [DOI] [PubMed] [Google Scholar]
- 20.Lee KK et al. Distinct functional domains in emerin bind lamin A and DNA-bridging protein BAF. J Cell Sci 114, 4567–4573 (2001). [DOI] [PubMed] [Google Scholar]
- 21.Banani SF, Lee HO, Hyman AA & Rosen MK Biomolecular condensates: Organizers of cellular biochemistry. Nat Rev Mol Cell Biol 18, 285–298, doi: 10.1038/nrm.2017.7 (2017). [DOI] [PMC free article] [PubMed] [Google Scholar]
- 22.Alberti S, Gladfelter A & Mittag T Considerations and Challenges in Studying Liquid-Liquid Phase Separation and Biomolecular Condensates. Cell 176, 419–434, doi: 10.1016/j.cell.2018.12.035 (2019). [DOI] [PMC free article] [PubMed] [Google Scholar]
- 23.Shin Y & Brangwynne CP Liquid phase condensation in cell physiology and disease. Science 357, doi: 10.1126/science.aaf4382 (2017). [DOI] [PubMed] [Google Scholar]
- 24.Rai AK, Chen JX, Selbach M & Pelkmans L Kinase-controlled phase transition of membraneless organelles in mitosis. Nature 559, 211–216, doi: 10.1038/s41586-018-0279-8 (2018). [DOI] [PubMed] [Google Scholar]
- 25.Huguet F, Flynn S & Vagnarelli P The Role of Phosphatases in Nuclear Envelope Disassembly and Reassembly and Their Relevance to Pathologies. Cells 8, doi: 10.3390/cells8070687 (2019). [DOI] [PMC free article] [PubMed] [Google Scholar]
- 26.Hornbeck PV et al. PhosphoSitePlus, 2014: mutations, PTMs and recalibrations. Nucleic Acids Res 43, D512–520, doi: 10.1093/nar/gku1267 (2015). [DOI] [PMC free article] [PubMed] [Google Scholar]
- 27.Boeynaems S et al. Spontaneous driving forces give rise to protein–RNA condensates with coexisting phases and complex material properties. Proc Natl Acad Sci U S A 116, 7889–7898, doi: 10.1073/pnas.1821038116 (2019). [DOI] [PMC free article] [PubMed] [Google Scholar]
- 28.Im YJ, Wollert T, Boura E & Hurley JH Structure and function of the ESCRT-II-III interface in multivesicular body biogenesis. Dev Cell 17, 234–243, doi: 10.1016/j.devcel.2009.07.008 (2009). [DOI] [PMC free article] [PubMed] [Google Scholar]
- 29.McCullough J et al. Structure and membrane remodeling activity of ESCRT-III helical polymers. Science 350, 1548–1551, doi: 10.1126/science.aad8305 (2015). [DOI] [PMC free article] [PubMed] [Google Scholar]
- 30.Tang S et al. Structural basis for activation, assembly and membrane binding of ESCRT-III Snf7 filaments. Elife 4, doi: 10.7554/eLife.12548 (2015). [DOI] [PMC free article] [PubMed] [Google Scholar]
- 31.Samwer M et al. DNA Cross-bridging shapes a single nucleus from a set of mitotic chromosomes. Cell 170, 956–972 e923, doi: 10.1016/j.cell.2017.07.038 (2017). [DOI] [PMC free article] [PubMed] [Google Scholar]
- 32.Bradley CM, Ronning DR, Ghirlando R, Craigie R & Dyda F Structural basis for DNA bridging by barrier-to-autointegration factor. Nat Struct Mol Biol 12, 935–936, doi: 10.1038/nsmb989 (2005). [DOI] [PubMed] [Google Scholar]
- 33.Hamon L, Savarin P, Curmi PA & Pastré D Rapid assembly and collective behavior of microtubule bundles in the presence of polyamines. Biophys J 101, 205–216, doi: 10.1016/j.bpj.2011.05.022 (2011). [DOI] [PMC free article] [PubMed] [Google Scholar]
- 34.Gibson BA et al. Organization of Chromatin by Intrinsic and Regulated Phase Separation. Cell 179, 470–484 e421, doi: 10.1016/j.cell.2019.08.037 (2019). [DOI] [PMC free article] [PubMed] [Google Scholar]
- 35.Mastronarde DN Automated electron microscope tomography using robust prediction of specimen movements. J Struct Biol 152, 36–51, doi: 10.1016/j.jsb.2005.07.007 (2005). [DOI] [PubMed] [Google Scholar]
- 36.Bui KH et al. Integrated structural analysis of the human nuclear pore complex scaffold. Cell 155, 1233–1243, doi: 10.1016/j.cell.2013.10.055 (2013). [DOI] [PubMed] [Google Scholar]
- 37.Leitner A et al. Expanding the chemical cross-linking toolbox by the use of multiple proteases and enrichment by size exclusion chromatography. Mol Cell Proteomics 11, M111 014126, doi: 10.1074/mcp.M111.014126 (2012). [DOI] [PMC free article] [PubMed] [Google Scholar]
- 38.Trnka MJ, Baker PR, Robinson PJ, Burlingame AL & Chalkley RJ Matching crosslinked peptide spectra: only as good as the worse identification. Mol Cell Proteomics 13, 420–434, doi: 10.1074/mcp.M113.034009 (2014). [DOI] [PMC free article] [PubMed] [Google Scholar]
- 39.Schilling B et al. Platform-independent and label-free quantitation of proteomic data using MS1 extracted ion chromatograms in skyline: application to protein acetylation and phosphorylation. Mol Cell Proteomics 11, 202–214, doi: 10.1074/mcp.M112.017707 (2012). [DOI] [PMC free article] [PubMed] [Google Scholar]
- 40.Muller F, Fischer L, Chen ZA, Auchynnikava T & Rappsilber J On the reproducibility of label-free quantitative cross-linking/mass spectrometry. J Am Soc Mass Spectrom 29, 405–412, doi: 10.1007/s13361-017-1837-2 (2018). [DOI] [PMC free article] [PubMed] [Google Scholar]
- 41.Combe CW, Fischer L & Rappsilber J xiNET: cross-link network maps with residue resolution. Mol Cell Proteomics 14, 1137–1147, doi: 10.1074/mcp.O114.042259 (2015). [DOI] [PMC free article] [PubMed] [Google Scholar]
- 42.Kelley LA, Mezulis S, Yates CM, Wass MN & Sternberg MJE The Phyre2 web portal for protein modeling, prediction and analysis. Nat Protoc 10, 845–858, doi: 10.1038/nprot.2015.053 (2015). [DOI] [PMC free article] [PubMed] [Google Scholar]
- 43.Pettersen EF et al. UCSF Chimera - A visualization system for exploratory research and analysis. J Comput Chem 25, 1605–1612, doi: 10.1002/jcc.20084 (2004). [DOI] [PubMed] [Google Scholar]
- 44.Kosinski J et al. Xlink analyzer: Software for analysis and visualization of cross-linking data in the context of three-dimensional structures. J Struct Biol 189, 177–183, doi: 10.1016/j.jsb.2015.01.014 (2015). [DOI] [PMC free article] [PubMed] [Google Scholar]
- 45.Bajorek M et al. Biochemical analyses of human IST1 and its function in cytokinesis. Mol Biol Cell 20, 1360–1373, doi: 10.1091/mbc.E08-05-0475 (2009). [DOI] [PMC free article] [PubMed] [Google Scholar]
- 46.Donahue DA et al. SUN2 Overexpression Deforms Nuclear Shape and Inhibits HIV. J Virol 90, 4199–4214, doi: 10.1128/JVI.03202-15 (2016). [DOI] [PMC free article] [PubMed] [Google Scholar]
- 47.Mackay DR, Makise M & Ullman KS Defects in nuclear pore assembly lead to activation of an Aurora B-mediated abscission checkpoint. J Cell Biol 191, 923–931, doi: 10.1083/jcb.201007124 (2010). [DOI] [PMC free article] [PubMed] [Google Scholar]
- 48.Mackay DR, Elgort SW & Ullman KS The nucleoporin Nup153 has separable roles in both early mitotic progression and the resolution of mitosis. Mol Biol Cell 20, 1652–1660, doi: 10.1091/mbc.E08-08-0883 (2009). [DOI] [PMC free article] [PubMed] [Google Scholar]
- 49.Morita E et al. Human ESCRT-III and VPS4 proteins are required for centrosome and spindle maintenance. Proc Natl Acad Sci U S A 107, 12889–12894, doi: 10.1073/pnas.1005938107 (2010). [DOI] [PMC free article] [PubMed] [Google Scholar]
- 50.Kinoshita E, Kinoshita-Kikuta E, Takiyama K & Koike T Phosphate-binding tag, a new tool to visualize phosphorylated proteins. Mol Cell Proteomics 5, 749–757, doi: 10.1074/mcp.T500024-MCP200 (2006). [DOI] [PubMed] [Google Scholar]
- 51.Cai M et al. Solution NMR structure of the barrier-to-autointegration factor-emerin complex. J Biol Chem 282, 14525–14535, doi: 10.1074/jbc.M700576200 (2007). [DOI] [PubMed] [Google Scholar]
- 52.Cuylen S et al. Ki-67 acts as a biological surfactant to disperse mitotic chromosomes. Nature 535, 308–312, doi: 10.1038/nature18610 (2016). [DOI] [PMC free article] [PubMed] [Google Scholar]
- 53.Mehsen H et al. PP2A-B55 promotes nuclear envelope reformation after mitosis in Drosophila. J Cell Biol 217, 4106–4123, doi: 10.1083/jcb.201804018 (2018). [DOI] [PMC free article] [PubMed] [Google Scholar]
- 54.Cundell MJ et al. A PP2A-B55 recognition signal controls substrate dephosphorylation kinetics during mitotic exit. J Cell Biol 214, 539–554, doi: 10.1083/jcb.201606033 (2016). [DOI] [PMC free article] [PubMed] [Google Scholar]
- 55.Kim H-S, Fernandes G & Lee C-W Protein phosphatases involved in regulating mitosis: facts and hypotheses. Mol Cells 39, 654–662, doi: 10.14348/molcells.2016.0214 (2016). [DOI] [PMC free article] [PubMed] [Google Scholar]
- 56.Asencio C et al. Coordination of kinase and phosphatase activities by Lem4 enables nuclear envelope reassembly during mitosis. Cell 150, 122–135, doi: 10.1016/j.cell.2012.04.043 (2012). [DOI] [PubMed] [Google Scholar]
- 57.Otsuka S et al. Postmitotic nuclear pore assembly proceeds by radial dilation of small membrane openings. Nat Struct Mol Biol 25, 21–28, doi: 10.1038/s41594-017-0001-9 (2018). [DOI] [PubMed] [Google Scholar]
- 58.LaJoie D & Ullman KS Coordinated events of nuclear assembly. Curr Opin Cell Biol 46, 39–45, doi: 10.1016/j.ceb.2016.12.008 (2017). [DOI] [PubMed] [Google Scholar]
- 59.Haraguchi T et al. Live cell imaging and electron microscopy reveal dynamic processes of BAF-directed nuclear envelope assembly. J Cell Sci 121, 2540–2554, doi: 10.1242/jcs.033597 (2008). [DOI] [PubMed] [Google Scholar]
- 60.Liu S et al. Nuclear envelope assembly defects link mitotic errors to chromothripsis. Nature 561, 551–555, doi: 10.1038/s41586-018-0534-z (2018). [DOI] [PMC free article] [PubMed] [Google Scholar]
- 61.Berk JM, Tifft KE & Wilson KL The nuclear envelope LEM-domain protein emerin. Nucleus 4, 298–314, doi: 10.4161/nucl.25751 (2013). [DOI] [PMC free article] [PubMed] [Google Scholar]
- 62.Tapia O, Fong LG, Huber MD, Young SG & Gerace L Nuclear envelope protein Lem2 is required for mouse development and regulates MAP and AKT kinases. PLoS One 10, e0116196, doi: 10.1371/journal.pone.0116196 (2015). [DOI] [PMC free article] [PubMed] [Google Scholar]
- 63.Yam C, He Y, Zhang D, Chiam KH & Oliferenko S Divergent strategies for controlling the nuclear membrane satisfy geometric constraints during nuclear division. Curr Biol, 21, 1314–1319, doi: 10.1016/j.cub.2011.06.052 (2011). [DOI] [PubMed] [Google Scholar]
- 64.Webster BM et al. Chm7 and Heh1 collaborate to link nuclear pore complex quality control with nuclear envelope sealing. EMBO J 35, 2447–2467, doi: 10.15252/embj.201694574 (2016). [DOI] [PMC free article] [PubMed] [Google Scholar]
- 65.Olmos Y, Perdrix-Rosell A & Carlton JG Membrane Binding by CHMP7 Coordinates ESCRT- III-Dependent Nuclear Envelope Reformation. Curr Biol 26, 2635–2641, doi: 10.1016/j.cub.2016.07.039 (2016). [DOI] [PMC free article] [PubMed] [Google Scholar]
- 66.Schöneberg J et al. ATP-dependent force generation and membrane scission by ESCRT-III and Vps4. Science 362, 1423–1428, doi: 10.1126/science.aat1839 (2018). [DOI] [PMC free article] [PubMed] [Google Scholar]
- 67.Yam C, Gu Y & Oliferenko S Partitioning and remodeling of the Schizosaccharomyces japonicus mitotic nucleus require chromosome tethers. Curr Biol 23, 2303–2310, doi: 10.1016/j.cub.2013.09.057 (2013). [DOI] [PubMed] [Google Scholar]
- 68.Pfitzner A-K, Mercier V & Roux A Vps4 triggers sequential subunit exchange in ESCRT-III polymers that drives membrane constriction and fission. bioRxiv, 718080, doi: 10.1101/718080 (2019). [DOI] [Google Scholar]
- 69.Ventimiglia LN et al. CC2D1B coordinates ESCRT-III activity during the mitotic reformation of the nuclear envelope. Dev Cell 47, 547–563 e546, doi: 10.1016/j.devcel.2018.11.012 (2018). [DOI] [PMC free article] [PubMed] [Google Scholar]
- 70.Vietri M et al. Unrestrained ESCRT-III drives chromosome fragmentation and micronuclear catastrophe. bioRxiv, 517011, doi: 10.1101/517011 (2019). [DOI] [PubMed] [Google Scholar]
- 71.Willan J et al. ESCRT-III is necessary for the integrity of the nuclear envelope in micronuclei but is aberrant at ruptured micronuclear envelopes generating damage. Oncogenesis 8, 29, doi: 10.1038/s41389-019-0136-0 (2019). [DOI] [PMC free article] [PubMed] [Google Scholar]
- 72.Im YJ & Hurley JH Integrated structural model and membrane targeting mechanism of the human ESCRT-II complex. Dev Cell 14, 902–913, doi: 10.1016/j.devcel.2008.04.004 (2008). [DOI] [PMC free article] [PubMed] [Google Scholar]
- 73.Hernández-Vega A et al. Local nucleation of microtubule bundles through tubulin concentration into a condensed Tau phase. Cell Rep 20, 2304–2312, doi: 10.1016/j.celrep.2017.08.042 (2017). [DOI] [PMC free article] [PubMed] [Google Scholar]
- 74.Hughes MP et al. Atomic structures of low-complexity protein segments reveal kinked β sheets that assemble networks. Science 359, 698–701, doi: 10.1126/science.aan6398 (2018). [DOI] [PMC free article] [PubMed] [Google Scholar]
- 75.Wang J et al. A molecular grammar governing the driving forces for phase separation of prion-like RNA binding proteins. Cell 174, 688–699 e616, doi: 10.1016/j.cell.2018.06.006 (2018). [DOI] [PMC free article] [PubMed] [Google Scholar]
- 76.Gallivan JP & Dougherty DA Cation-pi interactions in structural biology. Proc Natl Acad Sci U S A 96, 9459–9464, doi: 10.1073/pnas.96.17.9459 (1999). [DOI] [PMC free article] [PubMed] [Google Scholar]
- 77.Marbach F et al. The discovery of a LEMD2-associated nuclear envelopathy with early progeroid appearance suggests advanced applications for AI-driven facial phenotyping. Am J Hum Genet 104, 749–757, doi: 10.1016/j.ajhg.2019.02.021 (2019). [DOI] [PMC free article] [PubMed] [Google Scholar]
- 78.Boone PM et al. Hutterite-type cataract maps to chromosome 6p21.32-p21.31, cosegregates with a homozygous mutation in LEMD2, and is associated with sudden cardiac death. Mol Genet Genomic Med 4, 77–94, doi: 10.1002/mgg3.181 (2016). [DOI] [PMC free article] [PubMed] [Google Scholar]
- 79.Chmielewska M et al. Embryonic and adult isoforms of XLAP2 form microdomains associated with chromatin and the nuclear envelope. Cell Tissue Res 344, 97–110, doi: 10.1007/s00441-011-1129-2 (2011). [DOI] [PMC free article] [PubMed] [Google Scholar]
- 80.Ikegami K, Egelhofer TA, Strome S & Lieb JD Caenorhabditis elegans chromosome arms are anchored to the nuclear membrane via discontinuous association with LEM-2. Genome Biol 11, R120, doi: 10.1186/gb-2010-11-12-r120 (2010). [DOI] [PMC free article] [PubMed] [Google Scholar]
- 81.Larson AG et al. Liquid droplet formation by HP1α suggests a role for phase separation in heterochromatin. Nature 547, 236–240, doi: 10.1038/nature22822 (2017). [DOI] [PMC free article] [PubMed] [Google Scholar]
- 82.Gonzalez Y, Saito A & Sazer S Fission yeast Lem2 and Man1 perform fundamental functions of the animal cell nuclear lamina. Nucleus 3, 60–76, doi: 10.4161/nucl.18824 (2012). [DOI] [PMC free article] [PubMed] [Google Scholar]
- 83.Tange Y et al. Inner nuclear membrane protein Lem2 augments heterochromatin formation in response to nutritional conditions. Genes Cells 21, 812–832, doi: 10.1111/gtc.12385 (2016). [DOI] [PubMed] [Google Scholar]
- 84.Banday S, Farooq Z, Rashid R, Abdullah E & Altaf M Role of inner nuclear membrane protein complex Lem2-Nur1 in heterochromatic gene silencing. J Biol Chem 291, 20021–20029, doi: 10.1074/jbc.M116.743211 (2016). [DOI] [PMC free article] [PubMed] [Google Scholar]
- 85.Beutel O, Maraspini R, Pombo-Garcia K, Martin-Lemaitre C & Honigmann A Phase separation of zonula occludens proteins drives formation of tight junctions. Cell 179, 923–936.e911, doi: 10.1016/j.cell.2019.10.011 (2019). [DOI] [PubMed] [Google Scholar]
- 86.Milovanovic D, Wu Y, Bian X & De Camilli P A liquid phase of synapsin and lipid vesicles. Science 361, 604–607, doi: 10.1126/science.aat5671 (2018). [DOI] [PMC free article] [PubMed] [Google Scholar]
- 87.Lipowsky R Bending of membranes by anchored polymers. Europhysics Letters 30, 197–202, doi: 10.1209/0295-5075/30/4/002 (1995). [DOI] [Google Scholar]
- 88.Dimova R & Lipowsky R Lipid membranes in contact with aqueous phases of polymer solutions. Soft Matter 8, 6409–6415, doi: 10.1039/C2SM25261A (2012). [DOI] [Google Scholar]
- 89.Muzioł T et al. Structural Basis for Budding by the ESCRT-III Factor CHMP3. Dev Cell 10, 821–830, doi: 10.1016/j.devcel.2006.03.013 (2006). [DOI] [PubMed] [Google Scholar]
- 90.Caputo S et al. The carboxyl-terminal nucleoplasmic region of MAN1 exhibits a DNA binding winged helix domain. J Biol Chem 281, 18208–18215, doi: 10.1074/jbc.M601980200 (2006). [DOI] [PubMed] [Google Scholar]
Associated Data
This section collects any data citations, data availability statements, or supplementary materials included in this article.