

Summary
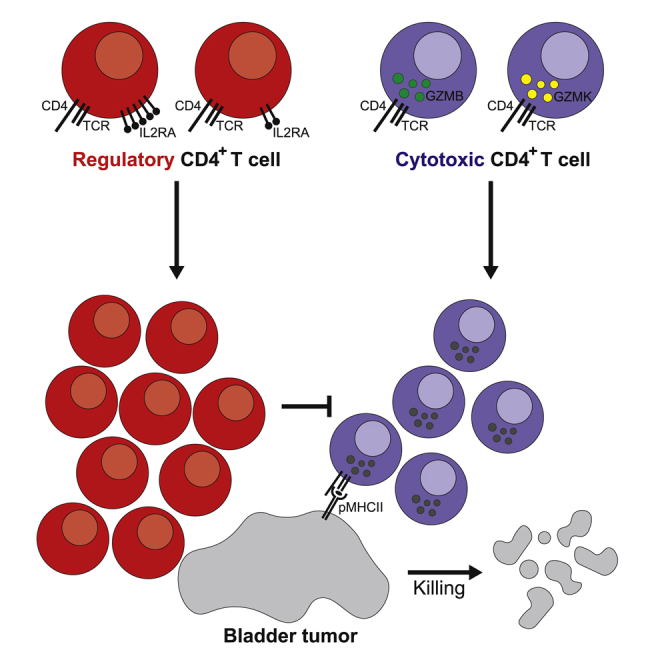
Responses to anti-PD-1 immunotherapy occur but are infrequent in bladder cancer. The specific T cells that mediate tumor rejection are unknown. T cells from human bladder tumors and non-malignant tissue were assessed with single-cell RNA and paired T cell receptor (TCR) sequencing of 30,604 T cells from 7 patients. We find that the states and repertoires of CD8+ T cells are not distinct in tumors compared with non-malignant tissues. In contrast, single-cell analysis of CD4+ T cells demonstrates several tumor-specific states, including multiple distinct states of regulatory T cells. Surprisingly, we also find multiple cytotoxic CD4+ T cell states that are clonally expanded. These CD4+ T cells can kill autologous tumors in an MHC class II-dependent fashion and are suppressed by regulatory T cells. Further, a gene signature of cytotoxic CD4+ T cells in tumors predicts a clinical response in 244 metastatic bladder cancer patients treated with anti-PD-L1.
Keywords: Bladder cancer, checkpoint inhibition, PD-1 blockade, anti-PD-L1, single-cell sequencing, cytotoxic CD4+ T cells, predictive gene signature
Graphical Abstract
Highlights
-
•
Human bladder tumors contain multiple clonally expanded cytotoxic CD4+ T cell states
-
•
Cytotoxic CD4+ T cells can kill autologous tumors in an MHC class II-dependent fashion
-
•
Autologous regulatory T cells can inhibit the activity of cytotoxic CD4+ T cells
-
•
A cytotoxic CD4+ gene signature predicts response to anti-PD-L1 in bladder cancer
Single-cell RNA and paired T cell receptor sequencing highlights enrichment of cytotoxic CD4+ T cells rather than CD8+ T cells in human bladder cancer. These CD4+ T cells are capable of killing autologous tumor cells and are subjected to inhibition by Tregs.
Introduction
Immunotherapies have changed the landscape of cancer treatment by producing durable and long-lasting responses through triggering anti-tumor cell-mediated immunity. In particular, checkpoint inhibitors (CPIs) targeting the immune inhibitory molecules CTLA-4 and PD-1 in T lymphocytes have been approved based on responses and improved overall survival in multiple malignancies, particularly those with a high mutational burden (Hodi et al., 2010, Herbst et al., 2014, Powles et al., 2014, Robert et al., 2015, Martincorena and Campbell, 2015, Cancer Genome Atlas Research Network, 2008). However, in specific malignancies, such as transitional cell carcinoma (TCC) of the bladder, CPIs as monotherapies are efficacious in only ∼20% of patients (Powles et al., 2014, Hargadon et al., 2018). This could be partly due to the heterogeneity of tumor-infiltrating T lymphocytes (TILs) and their differential ability to confer a therapeutic benefit upon treatment.
Currently, cytotoxic CD8+ T cells are the main focus of efforts to understand how immunotherapy elicits anti-tumor immunity. In melanoma, expression and chromatin state signatures of cytotoxicity and exhaustion (Tirosh et al., 2016, Philip et al., 2017, Ayers et al., 2017, Herbst et al., 2014) and the presence of CD8+ T cells at the tumor-invasive margin pre-treatment (Tumeh et al., 2014) are significantly correlated with subsequent responses to PD-1-directed therapy. However, in metastatic bladder TCC, where response rates to PD-1 blockade are ∼15%–20% in platinum chemotherapy-refractory patients and more than 20% in frontline platinum-ineligible patients, predictive biomarkers of response are unclear, including PD-L1 expression (Koshkin and Grivas, 2018). Recently, bulk RNA sequencing (RNA-seq) of the pre-treatment tumor microenvironment in TCC found that a higher score of CD8+ gene signature and tumor mutational burden and, conversely, a lower score of transforming growth factor β (TGF-β) gene signature, particularly in immune-excluded tumors, were associated with response to the anti-PD-L1 agent atezolizumab (Mariathasan et al., 2018). However, the importance of heterogeneous subsets of TILs in TCC beyond canonical CD8+ cytotoxic and exhausted phenotypes in response to PD-1 blockade remains unexplored. In particular, the role of CD4+ T cells in controlling or enhancing TCC tumor growth remains largely unknown. Although regulatory CD4+ T cells (Tregs) in the TCC environment have been associated with adverse outcomes (Baras et al., 2016), and a CD4+ subset expressing the inducible costimulator (ICOS) that produces interferon-gamma (IFNγ) in response to anti-CTLA-4 therapy has been described in human bladder tumors (Liakou et al., 2008), the presence of other CD4+ T cell subsets that directly promote cell-mediated immunity through other effector mechanisms remains unclear. Detailed characterization of the T lymphocytes in the tumor is critically needed for precisely mapping the cells responsible for tumor recognition and control and defining predictive markers of response to CPI in bladder cancer.
To address these points, we interrogated the tumor microenvironment of patients with localized muscle-invasive bladder TCC who received or did not receive neoadjuvant anti-PD-L1 immunotherapy (atezolizumab, Genentech) prior to surgical resection. Droplet single-cell RNA-seq (dscRNA-seq) and paired T cell receptor sequencing (TCR-seq) of more than 30,000 CD4+ and CD8+ T cells from paired tumors and adjacent non-malignant tissues revealed heterogeneity in known CD4+ states, such as regulatory T cells, which were also enriched and clonally expanded in tumors. In addition, several states of cytotoxic CD4+ T cells expressing cytolytic effector proteins were identified, some of which are enriched in tumors. Cytotoxic CD4+ T cells were clonally expanded in tumors and could kill autologous tumors ex vivo. Cytotoxic CD4+ T cells existed in discrete proliferating and non-proliferating states in tumors. A gene signature of cytotoxic CD4+ T cells was predictive of a response to PD-1 blockade in an orthogonal RNA-seq dataset of metastatic bladder cancer patients treated with anti-PD-L1. Overall, these findings highlight the importance of CD4+ T cell heterogeneity and the relative balance between activation of cytotoxic CD4+ effectors and inhibitory regulatory cells for killing autologous tumors.
Results
Canonical CD8+ T Cell States Were Not Enriched in the Bladder Tumor Microenvironment
To assess the T cell composition of the tumor environment, we profiled T cells from dissociated bladder tumors and adjacent uninvolved bladder tissues using single-cell RNA and TCR sequencing (see schematic in Figure S1A). We used the 10X Genomics Chromium platform (Zheng et al., 2017b) to sequence 8,833 tumor-derived and 1,929 non-malignant tissue-derived CD8+ T cells from 7 patients (Table S1). All samples were muscle-invasive bladder cancer (MIBC) from 2 standard-of-care-untreated patients (“untreated”), 1 chemotherapy-treated patient (gemcitabine + carboplatin, “chemo”), and 4 anti-PD-L1-treated patients (“anti-PD-L1”) with detailed clinical annotations (Table S1). To assess the shared heterogeneity of T cells across samples, we restricted the analysis to highly variable genes and used an empirical Bayes approach (ComBat; Johnson et al., 2007, Büttner et al., 2019) to account for preparation batch among individual samples. We subsequently used Leiden clustering (Traag et al., 2019) to define clusters that were visualized using uniform manifold approximation and projection (UMAP) (McInnes and Healy, 2018). Tumor- and non-malignant-derived CD8+ T cells form 11 clusters, each populated by cells from all samples suggestive of shared states in TCC regardless of the treatment regimen (Figure 1A; Figure S2A). Differential expression analyses comparing each cluster with all other cells combined identified 1,067 differentially expressed genes in at least one cluster (adjusted P value (Padj) < 0.05, |log2(fold change, FC)| > 0.5) (Table S2). The identified states include known CD8+ subtypes (Figures 1B and 1C): cells expressing HAVCR2 (TIM-3), LAG3, ENTPD1, as well as the chemokine CXCL13 (CD8ENTPD1: log2(FC) = 1.4–3.7), described previously as tumor-reactive CD8+ T cells (Duhen et al., 2018); effector cells expressing FGFBP2 and GNLY, a granule-associated pore-forming protein known to function in pathogen killing (Krensky and Clayberger, 2009) (CD8FGFBP2: log2(FC) = 3.6–5.3); naive cells expressing CCR7 and GZMK (CD8NAIVE: log2(FC) = 0.9–2.8); central memory cells expressing CCR7 and SELL (L-selectin) (CD8CM: log2(FC) = 1.5–1.7); and mucosal-associated invariant T (MAIT) cells expressing KLRB1 (CD8MAIT: log2(FC) = 2.7) that preferentially use the known semi-invariant TCR α chains TRAV1-2 and/or TRAJ33 (Kurioka et al., 2016; Figure 1D). Of note, we also found MKI67+ proliferating cells (CD8PROLIF: log2(FC) = 6.5) as well as cells expressing the chemokines XCL1/2 (CD8xcl: log2(FC) = 5.2–5.6). Similar states were also identified in the tumor environment of hepatocellular carcinoma based on scRNA-seq (Zheng et al., 2017a). Surprisingly, although the frequency of CD8ENTPD1 cells was higher in tumors, none of the CD8+ states displayed statistically significant differences in frequency between the tumor and non-malignant bladder (exact permutation test; Figure 1E; density plots in Figure 1F).
Figure S1.

Flow Cytometry and Immunofluorescence Validation of T Cell Phenotypes in Bladder Tumors, Related to Figures 1, 2, 3, 4, and 5
(A) Schematic of processing for paired tumor and adjacent non-malignant tissue from either anti-PD-L1-treated, or standard-of-care (untreated/chemotherapy-treated) cystectomy patients. FACS-sorted CD4+ or CD8+ T cells were subjected to droplet-based single-cell RNA sequencing (dscRNA-seq) with paired T cell receptor (TCR) sequencing as described in the text. (B) Parallel flow cytometry data from the same single-cell digest used for dscRNA-seq from 4 anti-PD-L1-treated tumors, showing the percentage of CD4+ or CD8+ T cells from total CD3+ cells. (C) Gating strategy for flow cytometric analysis of populations in CD4+ and CD8+ T cells from RNA-seq. CD4+ and CD8+ populations were gated out of CD3+ CD45+ single live cells. CD4+ cells were further gated as FoxP3- and FoxP3+. Treg cells are gated as FOXP3+ CD25+ cells. FOXP3- CD4+ and CD8+ cells were gated into central memory (CM, CCR7+ CD45RA-), and CCR7- cells (a combination of effector memory CCR7- CD45RA- and effector CCR7- CD45RA+). Boolean gating of CCR7- cells was used to obtain GZMK+, GZMB+ and Ki67+ populations for further marker analysis. Plots are shown here to demonstrate the presence of these populations. (D) Representative gates shown for each marker for CD4+ and CD8+ T cells were used for Boolean gating for the populations described above. (E) Flow cytometry staining of GZMB, GZMK, or perforin versus CD3 in CCR7- CD8+ T cells. Gates used for Boolean analysis are shown. (F) Flow cytometry staining of GZMB or GZMK co-expression with perforin in CCR7- CD8+ T cells. (G) Percentage of cells expressing GZMB, GZMK, or perforin from CCR7- CD8+ T cells by flow cytometry (left), and the percentage of cells co-expressing perforin within GZMB+ or GZMK+ CCR7- CD8+ T cells (right), are shown (N = 7 tumors, mean + SEM). (H) Percentages of cells expressing IFNγ, TNFα, or both from GZMB+ or GZMK+ CCR7- CD8+ T cells with and without stimulation (N = 11 tumors, mean + SEM). (I) Multiplex immunofluorescent staining of DAPI (blue), CD4 (red), GZMK (green), GZMB (white) and overlay without DAPI are shown from a cystectomy tumor region from an additional patient with parallel scRNA-seq and TCR-seq data (anti-PD-L1 D). CD4+ cells that co-express GZMK (arrows) or GZMB (arrowhead) are indicated. Scale bar, 10 μm. (J) Percentage of cells co-expressing Ki67 and either GZMB or GZMK from CCR7- CD4+ FOXP3- T cells (left), or Ki67 and CD25 from CD4+ FOXP3+ T cells (right), by flow cytometry are shown, with dots for values from individual tumors (N = 7 tumors, mean ± SEM). (K) Flow cytometry staining showing co-expression of GZMB and Ki67, or GZMK and Ki67, from CCR7- CD8+ T cells.
Figure 1.

Bladder Cancer Contains Canonical CD8+ T Cell States
(A) Uniform manifold approximation and projection (UMAP) plots of 10,762 single sorted CD3+ CD8+ T cells obtained from bladder tumors and adjacent non-malignant tissue (N = 7 patients). Phenotypic clusters are represented in distinct colors.
(B) Relative intensity of expression of select genes superimposed on the UMAP projections in (A).
(C) Violin plots showing the relative expression of select differentially expressed genes (columns) for each cluster shown in (A) (rows) (all Padj < 0.05).
(D) The frequency of cells expressing MAIT-associated TRAV1-2/TRAJ33+ TCRs within each defined CD8+ phenotypic cluster.
(E) The frequency of cells in individual clusters shown as a proportion of total CD8+ cells within tumor or non-malignant compartments across all patients (orange, tumor; blue, non-malignant). For each cluster, a box and whisker plot is shown with the median, interquartile range (IQR, a box with lower and upper bounds representing 25th and 75th percentiles, respectively), and 1.5 times the IQR (whiskers). Outlier points are shown if more than 1.5 times the IQR beyond the lower and upper quartiles. Statistical testing was done using an exact permutation test.
(F) Density plots showing distribution of cells in tumor or non-malignant samples.
Figure S2.

Clustering, Differential Expression, Annotation, and Correlation Analysis of T Cell Transcriptional Phenotypes, Related to Figures 1, 2, 3, and 4
(A-B) UMAP plots showing cluster representation for CD8+ (A) and CD4+ (B) TIL from individual patients. (C) Volcano plots showing adjusted P values versus log2(FC) for differential testing of genes between tumor and non-malignant compartments for regulatory T cell populations (top, CD4IL2RAHI, CD4IL2RALO) and cytotoxic CD4+ populations (bottom, CD4GZMB, CD4GZMK). Genes whose expression is significantly different between compartments with Padj < 0.05 and |log2(FC) > 1.4| are shown in red. (D-E) Unbiased clustering of CD4+ T cells from tumor and adjacent non-malignant tissue from a single patient (anti-PD-L1 C). (D) UMAP plot showing individual cells coded by cluster or by tissue of origin. (E) Violin plot showing top 5 differentially expressed marker genes for each unbiased cluster. (F) Annotations of single CD4+ T cells from tumor and adjacent non-malignant tissue using SingleR. (G) Correlation matrix of all CD4+ and CD8+ populations from tissue (combined tumor and non-malignant tissues) based on expression of shared genes. Pearson correlation coefficient is shown. Populations were arranged based on hierarchical clustering using Euclidean distance metric.
Tregs Included Heterogeneous States that Are Enriched in Bladder Tumors
Given the lack of tumor enrichment of CD8+ states and the higher frequency of CD4+ over CD8+ T cells in bladder tumors (Figure S1B), we investigated CD4+ T cell heterogeneity in a similar fashion to determine their contribution to anti-tumor responses. We sequenced and analyzed 16,995 tumor- and 2,847 non-malignant tissue-infiltrating CD4+ T cells isolated from the same patients. Tumor-derived and non-malignant tissue-derived CD4+ T cells formed 11 clusters each with representation from all individual patients (Figure 2A; Figure S2B). We identified 1,511 differentially expressed genes in at least one cluster (Padj < 0.05, |log2(FC)| > 0.5; Table S2; Figures 2B and 2C) defining several canonical CD4+ T cell states. These include CCR7+ cells, which demonstrated a central memory phenotype (CD4CM) based on parallel flow cytometry data showing that these were CD45RA− (see below) as well as cells expressing high levels of CXCL13 and IFNG (CD4CXCL13: log2(FC) = 5.9 and 1.4), which were also likely to be exhausted based on overexpression of TOX (log2(FC) = 1.9) (Yao et al., 2019) and whose presence has been associated with improved outcomes in breast, gastric, and microsatellite-unstable colorectal carcinoma, which is an immune-responsive tumor (Schmidt et al., 2018, Gu-Trantien et al., 2013, Gu-Trantien et al., 2017, Wei et al., 2018, Zhang et al., 2018). Other states included Th17 cells expressing IL17A (CD4TH17: log2(FC) = 4.7), which represented important anti-tumor effectors (Kryczek et al., 2011); activated cells expressing CD69 (CD4ACTIVATED: log2(FC) = 2.2) but not FOXP3 (log2(FC) < 0.5) (Figures 2B and 2C); as well as several important additional states described in further detail below. Notably, some of these states were selectively enriched in specific compartments. CD4CXCL13 demonstrated significant enrichment in tumor compared with non-malignant tissue (tumor versus non-malignant: 6.5% versus 3.0%, p = 0.015, exact permutation test), whereas states enriched in non-malignant tissue included CD4CM (tumor versus non-malignant: 30% versus 42%, p = 0.008) and CD4ACTIVATED (tumor versus non-malignant: 7.5% versus 10%, p = 0.02) (density plots in Figure 2D; tumor and non-malignant frequencies in Figure 2E).
Figure 2.

CD4+ T Cells in Bladder Tumors Are Composed of Multiple Distinct Functional States
(A) UMAP plots of 19,842 single sorted CD3+ CD4+ T cells obtained from bladder tumors and adjacent non-malignant tissue (N = 7 patients). Each distinct phenotypic cluster identified using Leiden clustering is identified with a distinct color. Annotation of each unbiased cluster was performed by manual inspection of the highest-ranked differentially expressed genes for each cluster and using reference signature-based correlation methods (SingleR) as described in the text.
(B) Relative intensity of expression of select genes superimposed on the UMAP projections shown in (A).
(C) Violin plot showing relative expression of select differentially expressed genes (columns) for each cluster shown in (A) (rows) (all Padj < 0.05).
(D) Density plots showing distribution of cells in tumor or non-malignant samples.
(E) The frequency of cells in individual CD4+ T cell states defined by scRNA-seq clustering is shown as a proportion of total CD4+ cells within either tumor or non-malignant compartments across all patients (orange, tumor; blue, non-malignant). A box and whisker plot is shown with formatting as in Figure 1E. ∗p < 0.05, ∗∗p < 0.01 by exact permutation test.
Tregs were abundant constituents of the bladder tumor microenvironment with demonstrated heterogeneity. We found two states of Tregs (CD4IL2RAHI and CD4IL2RALO), together constituting 26% ± 1.9% (mean ± SEM) of tumor-infiltrating CD4+ cells, which co-expressed FOXP3 (CD4IL2RAHI: log2(FC) = 2.7; CD4IL2RALO: log2(FC) = 1.2) and known immune checkpoints, including IL2RA, TIGIT, TNFRSF4/9/18, and CD27 (Philip et al., 2017, Zheng et al., 2017a, Plitas et al., 2016, De Simone et al., 2016) (CD4IL2RAHI and CD4IL2RALO: log2(FC) > 0.65; Figures 2B, 2C, and 3A). With the exception of TIGIT, these immune checkpoints are minimally expressed by other CD4+ states, such as CD4CM (Figure 3A). The two Treg states were distinguished by higher expression of IL2RA, TNFRSF4, TNFRSF9, and TNFRSF18 in CD4IL2RAHI cells (CD4IL2RAHI: log2(FC) = 2.5–3.6; CD4IL2RALO: log2(FC) = 0.4–1.6; Figure 3A; Table S2). Of note, both Treg states were significantly enriched in tumor compared with adjacent non-malignant tissue (CD4IL2RAHI: 14.3% versus 4.6%, p = 0.002; CD4IL2RALO: 11.1% versus 6.7%, p = 0.002; exact permutation test; Figure 2E). We confirmed, by flow cytometry from 7 additional bladder tumors, that multiple tumors contained distinct regulatory states that expressed graded protein levels of IL2RA and co-expressed significantly different levels of immune checkpoints, such as TNFRSF18 (p < 0.05 for TNFRSF18 expression in FOXP3+ CD25low versus CD25hi populations by Wilcoxon signed-ranked test; Figure 3B; gating strategy in Figures S1C–S1D). This heterogeneity may be consequential because Tregs expressing higher levels of immune checkpoints have been shown to be correlated with poorer outcomes in non-small cell lung cancer (Guo et al., 2018). Both regulatory states also demonstrated a common tumor-specific gene expression program that included several heat shock proteins compared with non-malignant tissue (Figure S2C; Table S2).
Figure 3.

Regulatory CD4+ T Cells Are Heterogeneous, Enriched, and Clonally Expanded in Bladder Tumors
(A) Heatmap showing the expression of select regulatory T cell marker genes (rows) for individual single cells (columns) within the CD4IL2RAHI and CD4IL2RLO clusters compared with the CD4CM cluster. Cells were grouped based on their annotations by tissue (tumor or non-malignant), treatment, and patient. Log2-transformed expression of each gene was row scaled.
(B) Flow cytometry staining of CD4+ FOXP3+ TILs from a bladder tumor, showing the gating strategy for CD25neg, CD25low, and CD25hi (top left), and histograms of TNFRSF18 staining from each CD25 gate (top right). Mean fluorescence intensity of TNFRSF18 and percent TNFRSF18+ from the parental gate are shown for CD25 gates across samples (N = 7 tumors, mean ± SEM). ∗p < 0.05 by Wilcoxon paired t test.
(C) Gini coefficients for regulatory populations (CD4ILRA2HI and CD4IL2RALO, red labels at far left) and other CD4+ T cell populations within tumor and non-malignant compartments across all samples. For each cluster, a box and whisker plot is shown with the median, IQR (box), and 1.5 times the IQR (whiskers), with outliers exceeding 1.5 times the IQR beyond lower and upper quartiles. ∗p < 0.05, ∗∗p < 0.01 by exact permutation test. N = 7 tumor samples and 6 non-malignant samples.
(D) Left: single cells expressing the top 3 most expanded clonotypes found in the combined regulatory populations (CD4ILRA2HI and CD4IL2RALO) are shown in red in the same UMAP space as in Figure 2A. The regions composed of regulatory, cytotoxic, and proliferating T cells are outlined and superimposed on the UMAP projection. Right: density plots for total CD4+ T cell distribution within tumor and non-malignant compartments are reproduced from Figure 2D for ease of visual comparison.
Tregs Are Clonally Expanded in Bladder Tumors
To query the TCR sequence in the same single cells for which we obtained whole-transcriptome data, we PCR-amplified and sequenced to saturation the complementarity-determining region 3 (CDR3) of the TCR alpha (TRA) and beta (TRB) loci from the barcoded full-length cDNA library (primers in Table S3). After filtering for matching whitelisted cell barcodes (Cell Ranger), this approach yielded 11,081 CD4+ T cells and 5,779 CD8+ T cells with paired TRA and TRB CDR3 sequences (49% and 47% recovery, respectively; summary in Table S3). These results are consistent with expected frequencies based on the average recovery of individual TRA (CD4+, 54%; CD8+, 50%) and TRB (CD4+, 68%; CD8+, 67%) sequences across whitelisted cells. Overall, the TCR repertoire was more restricted in the tumor microenvironment than in adjacent non-malignant tissue based on two analyses. First, in intratumoral CD4+ T cells, 10.8% ± 1.6% of unique clonotypes are shared by 2 or more cells; this degree of sharing was significantly greater than in the non-malignant compartment (5.1% ± 1.6%, unpaired t test, p = 0.033) and is not seen in blood from healthy donors (0.12%–0.16%) or from publicly available reference circulating CD4+ T cell data (0%) (Figure S3A). Second, we observed skewing of the intratumoral CD4+ T cell repertoire toward an increased cumulative frequency of clonotypes over fewer cells (Figure S3B) and a corresponding higher Gini coefficient (0.21 for tumor versus 0.05 for non-malignant tissue, Wilcoxon signed-rank test with Benjamini-Hochberg correction, p = 0.009; Figure S3C) compared with the non-malignant compartment and healthy controls.
Figure S3.

T Cell Receptor Repertoire Analysis of CD4+ and CD8+ Bladder Tumor- and Non-malignant Tissue-Infiltrating T Cells, Related to Figures 3 and 4
(A) The percentage of unique paired TRA and TRB CDR3 nucleotide sequences that are expressed by one cell (blue), shared by two cells (green), or shared by three or more cells (red) is indicated for CD4+ T cells from individual tumor (darker shades) and non-malignant tissues (lighter shades) from anti-PD-L1-treated (“PD-L1”), untreated, and chemotherapy-treated (“chemo”) patients. Triplicate control samples from a single healthy donor’s CD4+ T cells sorted from peripheral blood and processed for scRNA-seq and TCR in identical fashion in separate sequencing runs is shown (“healthy 1-3”), as well as reference publicly available data from peripheral blood CD4+ from a healthy donor. (B) Lorenz curves showing the cumulative frequency distributions for unique CD4+ T cells and unique CD4+ T cell clonotypes for tumor, non-malignant tissues, and healthy donor blood. Mean ± SD is shown. (C) Gini coefficients for CD4+ T cell clonotypes from tumor, non-malignant tissues, and healthy donor blood, calculated from the Lorenz curves in (D); p = 0.009 by Wilcoxon with Benjamini-Hochberg correction for tumor versus non-malignant tissues. For (D) and (E): N = 7 tumor samples; 6 non-malignant samples, 4 healthy donor samples (3 triplicates from one healthy donor, 1 dataset from 10X Genomics). (D-F) Paired TRA/TRB clonotype sharing between cells, Lorenz curves, and Gini coefficients for CD8+ clonotype data as in (A-C). (G) Gini coefficients for tissue-infiltrating CD4+ in individual populations, separated by treatment type. (H-I) Gini coefficients for CD8+ T cells in individual populations, separated by tumor versus non-malignant tissue (H) and treatment type (I). All box and whisker plots are formatted as in Figure 3C.
When we assigned TCR sequences to cells with cluster identities (9,770 CD4+ and 5,151 CD8+ T cells with a paired TRA/TRB had an assigned phenotypic cluster or 49% and 48% of all T cells with assigned clusters, respectively; merged TCR sequences and phenotypic clusters for CD4+ and CD8+ T cells in Table S4), we found that clonal expansion of Tregs contributes to intratumoral CD4+ T cell repertoire restriction. Compared with paired non-malignant tissue, both regulatory states exhibited increased Gini coefficients in tumors (CD4IL2RAHI: Ginitumor 0.17 versus Gininormal 0, p = 0.003; CD4IL2RALO: Ginitumor 0.06 versus Gininormal 0.003, p = 0.009; exact permutation test; Figure 3C). The most expanded clonotypes within the Tregs were specific to regulatory cells but not other cell states (all single cells expressing the top expanded regulatory clonotypes are shown in Figure 3D). The CXCL13-expressing state CD4cxcl13 (discussed in greater detail below) was also restricted in tumors (Ginitumor 0.07 versus Gininormal 0, p = 0.02, exact permutation test; Figure 3C). Gini coefficients for CD4+ states did not differ significantly by anti-PD-L1 treatment (Figure S3G). In contrast, although repertoire restriction was also seen in CD8+ T cells from the same samples, this was observed in both tumor (percent unique clonotypes shared between cells: 15.1% ± 1.1%; Ginitumor: 0.36% ± 0.04%) and non-malignant compartments (percent unique clonotypes shared between cells: 14.6% ± 0.2%; Gininormal: 0.39% ± 0.06; Figures S3D–S3F). Furthermore, no significant increase in Gini coefficient in tumor over non-malignant tissue was seen for any CD8+ state, including with anti-PD-L1 treatment (Figures S3H and S3I). Hence, an important contributor to increased repertoire restriction of tumor-infiltrating CD4+ over non-malignant tissue, which was not seen in the CD8+ compartment, involved clonal expansion of several distinct regulatory T cell states that differed in their levels of immune checkpoint expression, which may be driven by tumor-associated antigens and the tumor-specific microenvironment.
Bladder Tumors Possessed Multiple Cytotoxic CD4+ T Cell States
In addition to regulatory states, we also found 2 distinct states of cytotoxic CD4+ T cells in all samples constituting 15% ± 0.9% of tumor-infiltrating CD4+ T cells. CD4GZMB and CD4GZMK cytotoxic cells expressed a core set of cytolytic effector molecules (log2(FC) > 0.5, Padj < 0.05): GZMA (granzyme A), GZMB (granzyme B), and NKG7 (a granule protein that translocates to the surface of natural killer (NK) cells following target cell recognition; Medley et al., 1996) (Figures 2B, 2C, and 4A; Table S2). Each cytotoxic CD4+ state was distinguished by the expression of specific effector molecules. CD4GZMB cells co-expressed high levels of GZMB, the pore-forming protein PRF1 (perforin), and the granule-associated proteins GNLY and NKG7 (CD4GZMB: log2(FC) = 5.7, 3.4, 5.1, and 4.4, respectively), whereas CD4GZMK cells co-expressed high levels of the distinct granzyme GZMK and lower levels of NKG7 (CD4GZMK: log2(FC) = 6.3 and 3.9) (Figure 4A; Table S2). These shared cytolytic molecules were not expressed by other CD4+ states, including regulatory and central memory T cells (Figure 4A). Cytotoxic CD4+ cells co-expressed additional molecules, which may further contribute to anti-tumor effector function. Notably, IFNG was expressed by both cytotoxic states, which may contribute to tumor cell death, including ferroptosis (Wang et al., 2019) (CD4GZMB and CD4GZMK: log2(FC) = 2.1). Of note, the minority of CD4GZMB cells that expressed IFNG appeared to also express TNF as well as specific immune checkpoints, such as PDCD1, LAG3, and HAVCR2 (TIM3) (Figure 4A). A larger proportion of CD4GZMB cells expressed CXCR6 (CD4GZMB: log2(FC) = 1.3; Figure 4A). This chemokine is expressed in regulatory and non-regulatory CD4+ TILs from colorectal carcinoma, nasopharyngeal carcinoma, and renal cell carcinoma and, together with its ligand CXCL16, can mediate TIL chemotaxis (Löfroos et al., 2017, Parsonage et al., 2012, Oldham et al., 2012). Finally, CD4GZMB and CD4GZMK cells did not express high levels of other checkpoints associated with regulatory T cells, such as IL2RA, TIGIT, or TNFRSF4/9/18 (log2(FC) < 0.5; Figure 4A), nor did they express the exhaustion marker TOX (Table S2). Similar states were found with unbiased clustering without batch correction for paired tumor- and non-malignant-derived CD4+ cells from individual patients (Figures S2D and S2E).
Figure 4.

Multiple Cytotoxic CD4+ T Cell States Are Enriched and Clonally Expanded in Bladder Tumors and Possess Lytic Capacity against Tumors
(A) Heatmap showing the expression of select cytotoxic or regulatory T cell marker genes (rows) for individual single cells (columns) within the cytotoxic CD4GZMB and CD4GZMK clusters compared with regulatory (CD4IL2RAHI and CD4IL2RLO) and CD4CM clusters. Cells were grouped based on their annotations by tissue (tumor or non-malignant), treatment, and patient. Log2-transformed expression of each gene was row scaled.
(B) Flow cytometry staining of GZMB, perforin, or GZMK in CCR7− CD4+ FOXP3− T cells.
(C) Percentage of cells expressing GZMB, GZMK, or perforin from CCR7− CD4+ FOXP3− T cells by flow cytometry (left) and the percentage of cells co-expressing perforin within GZMB+ or GZMK+ CCR7− CD4+ FOXP3− T cells (right) (N = 7 tumors, mean + SEM).
(D) Representative flow cytometry staining of IFNγ and TNF-α expression in GZMB+ or GZMK+ CCR7− CD4+ FOXP3− T cells stimulated with PMA and ionomycin. (E) Percentages of cells expressing IFNγ, TNF-α, or both from GZMB+ or GZMK+ CCR7− CD4+ FOXP3− T cells with and without stimulation (N = 11 tumors, mean + SEM).
(F) Multiplex immunofluorescent staining of DAPI (blue), CD4 (immunohistochemistry, red), GZMK (RNAscope probe, green), and GZMB (RNAscope probe, white) and overlay without DAPI from a cystectomy tumor region from a patient with parallel scRNA-seq and TCR-seq data (anti-PD-L1 C, top row) and from a corresponding tumor field with negative control staining (bottom row). CD4+ cells that co-express GZMK (arrows) or GZMB (arrowhead) are indicated. Scale bar, 10 μm.
(G) The ratio of abundances of all regulatory T cell populations (CD4ILRAHI and CD4IL2RALO) to all cytotoxic CD4+ populations (CD4GZMB and CD4GZMK) across all tumor and non-malignant samples (mean + SEM shown; ∗p < 0.05 by unpaired t test, assuming unequal variance).
(H) Gini coefficients for each of the cytotoxic CD4+ populations within tumor and non-malignant compartments across all samples (box and whisker plot is shown with formatting as in Figure 3C; ∗p < 0.05, ∗∗p < 0.01, exact permutation test, N = 7 tumor samples and 6 non-malignant samples).
(I) Left panel: quantitation of Annexin V+ apoptotic cells over time from a time-lapse cytotoxicity experiment with tumor cells cultured alone or with bulk CD4+ TILs (CD4total) or CD4+ TILs depleted of regulatory T cells (CD4eff) at a 30:1 effector:target ratio. Right panel: CD4eff TILs and tumor cells (30:1 effector:target ratio) were co-cultured with a pan-anti-MHC class II antibody or isotype control. All traces were from the same culture and cytotoxicity assay from the same patient. All traces show relative change in cell death from time point 0. Cytotoxicity with CD4eff is representative of independent experiments from 4 different patients. Mean ± SEM from multiple technical replicates for each experiment is shown.
We validated the presence and functional heterogeneity of cytotoxic CD4+ T cells using several orthogonal and complementary methods. Using flow cytometry, the presence of cytotoxic CD4+ T cells with an effector memory (CCR7− CD45RA−) or effector (CCR7− CD45RA+) phenotype that express GZMB, GZMK, and perforin protein was confirmed by flow cytometry in tumors from multiple independent replicate samples (N = 7 tumors; Figure 4B; gating strategy in Figures S1C and S1D). Across this sample set, 9% ± 2.9% (mean ± SEM) of CD4+ FOXP3− CCR7− cells expressed GZMB, whereas 16% ± 4.5% expressed GZMK and 5.3% ± 2.6% expressed perforin (Figure 4C, left panel), at lower frequencies than CCR7− CD8+ cytotoxic cells from the same patients (Figures S1E–S1G). Importantly, 25.9% ± 8.7% of GZMB+ CD4+ FOXP3− CCR7− and 8.6% ± 3.5% of GZMK+ CD4+ FOXP3− CCR7− cytotoxic T cells showed co-expression of perforin with granzymes, in agreement with the scRNA-seq data (Figure 4C, right panel); these frequencies of granzyme and perforin co-expression were lower than those of CCR7− CD8+ cytotoxic cells from the same patients (Figures S1F and S1G). Importantly, CD45− bladder tumor cells express multiple major histocompatibility complex (MHC) class II molecules (data not shown), which would allow antigen recognition by TCRs expressing CD4 as a co-receptor. Flow cytometry of a separate set of 11 muscle-invasive bladder tumors confirms the functional capacity of cytotoxic CD4+ T cells to produce multiple cytokines. In agreement with the scRNA-seq data, 56% ± 4.8% (mean ± SEM) of CD4+ CCR7− cells were polyfunctional and could produce both IFNγ and tumor necrosis factor alpha (TNF-α), whereas a minority of these cells only secrete IFNγ alone or TNF-α alone after stimulation and, therefore, may demonstrate signs of exhaustion (IFNγ+ TNF-α−: 2.0% ± 0.76%; IFNγ− TNF-α+: 19% ± 3.3%) (Figures 4D and 4E). The frequency of polyfunctional cytotoxic CD4+ T cells was similar to stimulated CD8+ CCR7− T cells from the same patients (IFNγ+ TNF-α+: 55% ± 6.3%), although CD8+ CCR7− T cells that were monofunctional demonstrated an increased trend toward preferential IFNγ production alone over TNF-α production compared with cytotoxic CD4+ T cells (IFNγ+ TNF-α−: 14% ± 4.7%; IFNγ− TNF-α+: 7.2% ± 2.1%) (Figure S1H).
As further validation of the cytotoxic CD4+ T cell phenotype in tissue, multiplex immunofluorescence tissue staining of bladder tumor tissue from a patient in the scRNA-seq dataset demonstrated CD4+ T cells that also expressed GZMB or GZMK (Figure 4F, top row; tissue staining from an additional patient in Figure S1I) at levels not seen with negative control staining (Figure 4F, bottom row).
Overall annotation of clusters from the scRNA-seq data was supported by an independent analysis that assigns each single cell to the best-known published immune subset profiled by bulk expression analysis after sorting (SingleR) (Aran et al., 2019). This corroborated the identification of Tregs (90% and 78% of CD4IL2RAHI and CD4IL2RALO cells are assigned to Treg annotations, respectively) and further demonstrated that both cytotoxic CD4+ states are most similar to CD8+ effector memory T cells (37% and 45% of CD4GZMB and CD4GZMK cells, respectively, are assigned to effector memory CD8+ cell annotations), reinforcing their cytotoxicity profile (Figure S2F). Finally, an internal comparison of the transcriptional profiles from CD4+ and CD8+ TIL clusters from our scRNA-seq data indicated that, although most CD4+ clusters are most similar to other CD4+ clusters, cytotoxic CD4+ T cells are an exception. CD4GZMB cytotoxic cells were most correlated with tumor-specific CD8ENTPD1 cells (Pearson correlation coefficient = 0.92), whereas CD4GZMK cytotoxic cells were most correlated with CD8CM and CD8NAIVE cells (Pearson correlation coefficient = 0.98 for both) (Figure S2G). The tumor-specific gene expression program of these cytotoxic CD4+ cells was marked by heat shock protein expression in both states as well as tumor overexpression of CXCL13 and numerous immune checkpoints (TNFRSF18/LAG3/TIGIT/HAVCR2) as well as ENTPD1 within CD4GZMB cells (Figure S2C; Table S2).
Cytotoxic CD4+ T Cells Were Enriched and Clonally Expanded in Bladder Tumors
Of the 2 cytotoxic CD4+ states, CD4GZMK cells were significantly enriched in abundance in tumors (CD4GZMK in tumor versus non-malignant tissues: 7.2% ± 0.5% versus 5.0% ± 0.5%, exact permutation test, p = 0.01; Figure 2E). Overall, the CD4+ compartment exhibited a bias toward regulatory over cytotoxic CD4+ T cells in tumors (regulatory CD4+/cytotoxic CD4+ ratio = 1.8 ± 0.2) compared with non-malignant tissues, where proportions of regulatory and cytotoxic CD4+ T cells were more balanced (regulatory CD4+/cytotoxic CD4+ ratio = 1.1 ± 0.2, t test, p = 0.04; Figure 4G). Cytotoxic CD4+ T cell states contributed to intratumoral CD4+ repertoire restriction. Both cytotoxic CD4+ T cell states have significantly increased Gini coefficients in tumor compared with non-malignant tissues, with CD4GZMB representing the more restricted cytotoxic state in tumors (CD4GZMB: Ginitumor 0.21 versus Gininormal 0.06; CD4GZMK: Ginitumor 0.12 versus Gininormal 0; exact permutation test, p = 0.04 for CD4GZMB and p = 0.002 for CD4GZMK; Figure 4H). Hence, unbiased dscRNA-seq revealed that heterogeneous cytotoxic CD4+ T cells, a subset of which are closely related to conventional cytotoxic CD8+ T cells based on their functional program, are unexpected but frequent constituents of the bladder tumor microenvironment, some of which are quantitatively enriched in tumors. The tumor-specific clonal expansion of both cytotoxic CD4+ states suggests that their restricted repertoire may result from recognition of MHC class II cognate antigens that may include bladder tumor antigens.
Cytotoxic CD4+ T Cells Possessed Lytic Capacity against Autologous Tumor Cells that Was Restricted by Autologous Tregs
To validate the functional relevance of cytotoxic CD4+ in bladder tumors, we isolated CD4+ TILs by fluorescence-activated cell sorting (FACS) and then cultured the cells ex vivo with interleukin-2 (IL-2). We then co-cultured these cells with autologous tumor cells in an imaging-based time-lapse cytotoxicity assay, assessing for cell death with Annexin V. We found that expanded CD4+ TILs were cytotoxic and could trigger increased tumor apoptosis (“CD4total:tumor,” Figure 4I, left panel). However, when we performed the same co-cultures but with CD4+ TILs from the same patient that were depleted of Tregs, we found that killing was increased (“CD4eff:tumor,” Figure 4I, left panel), indicating that autologous Tregs can inhibit the activity of cytotoxic CD4+ T cells. Significant tumor death was seen in co-cultures with CD4eff TILs compared with tumors alone (Figure 4I, left panel; representative of 3 independent experiments from different patients). Furthermore, the cytotoxic activity of CD4eff was at least partially dependent on MHC class II recognition because tumor apoptosis was inhibited with pre-incubation with a pan-anti-MHC class II antibody that was not seen with an isotype control antibody (Figure 4I, right panel; representative of 2 independent patients). Independent experiments with an alternative death indicator (Cytotox Red) confirmed increased autologous tumor killing with tumor/CD4eff co-cultures (Figure S4A), MHC class II dependence of CD4eff killing (Figure S4B), as well as similar MHC class I-dependent autologous tumor killing with expanded CD8+ T cells (Figures S4C and S4D). Hence, flow cytometry and functional analyses from multiple independent patients confirmed not only that cytotoxic CD4+ T cells expressed cytolytic proteins, such as granzymes and perforin, in tumor tissue but that these cells can recognize bladder tumor antigens in an MHC class II-dependent fashion and were functionally competent to lyse autologous tumor cells in a manner that can be suppressed by autologous Tregs.
Figure S4.

Autologous MHC-Dependent Killing of Bladder Tumors by CD4+ and CD8+ TIL, Related to Figure 5
Analysis of the increase in the number of dead cells over time from the same killing assay for CD4eff TIL (ie cultures with Tregs sorted out during expansion) at 30:1 effector:target ratio (A), CD4eff TIL at 30:1 effector:target ratio with a pan-anti-MHCII antibody (B), CD8+ TIL at 30:1 effector:target ratio (C), or CD8+ TIL at 30:1 effector:target ratio with a pan-anti-MHCI antibody (D), are shown. Control traces from separate wells with tumor only are included. All traces were normalized to the number of dead cells per mm2 at time point 0. Experiments were done using Cytotox Red. The observation of autologous tumor killing by CD4+ and CD8+ TIL above the background level of spontaneous death is representative of 2 independent experiments involving distinct aliquots from the same patient.
Proliferating CD4+ T Cells Contained Regulatory and Cytotoxic Cells
Induction of proliferating T cells can be beneficial for anti-tumor immune responses. Proliferating CD4+ T cells are rapidly induced in the periphery within weeks of initiating checkpoint blockade in prostate cancer patients (Kavanagh et al., 2008) and in separate cohorts of thymic epithelial tumors and non-small cell lung cancer treated with anti-PD-1; a higher fold change in Ki67+ cells among PD-1+ CD8+ T cells in the periphery after a week was predictive of durable clinical benefit, progression-free survival, and (in the non-small cell lung cancer cohorts) overall survival (Kim et al., 2019). Within our tumor-infiltrating CD4+ T cell compartment in TCC, we also identified proliferating cells (CD4PROLIF) expressing MKI67, microtubule-associated markers (e.g., STMN1/TUBB), and DNA-binding proteins associated with cell cycle progression, such as PCNA, HMGB1, and HMGB2, which were expressed at lower levels in regulatory and cytotoxic CD4+ T cells (CD4PROLIF: log2(FC) > 2.1; Figure 2C; Table S2). A similar signature was also seen in the CD8+ compartment (CD8PROLIF; Figure 1C; Table S2). Higher-resolution clustering revealed that this proliferating state is comprised of discrete groups of cells co-expressing regulatory or cytotoxic genes but not both simultaneously (Figure 5A). Flow cytometry analysis of separate TCC samples confirmed the presence of discrete regulatory or cytotoxic populations of Ki67+ CD4+ T cells that co-expressed CD25, GZMB, or GZMK (Figure 5B). Across multiple independent samples, 4.7% ± 1.0% (mean ± SEM) of CD4+ FOXP3+ cells co-expressed Ki67 and CD25, whereas 1.2% ± 0.5% of CD4+ FOXP3− CCR7− cells co-expressed Ki67 and GZMB, and 1.0% ± 0.1% of CD4+ FOXP3− CCR7− cells co-expressed Ki67 and GZMK (N = 7 tumors; Figure S1J). Proliferating Ki67+ GZMB+ cells are also seen, using flow cytometry, within the CD8+ compartment of TCC patients (Figure S1K). Examination of exact TCR clonotype sharing of the most expanded CD4PROLIF clones identified sharing with regulatory and cytotoxic CD4+ T cells, further underscoring the contribution of each state to CD4PROLIF cells (Figure 5C).
Figure 5.

Proliferating CD4+ T Cells Contain Regulatory and Cytotoxic Cell States
(A) Heatmap showing expression of select cytotoxic, regulatory, and proliferating marker genes (rows) for individual single cells (columns) within the CD4PROLIF cluster. Samples were hierarchically clustered. Log2-transformed expression of each gene was row scaled.
(B) Representative flow cytometry staining from a bladder tumor showing expression of CD25, GZMB, GZMK, and Ki67.
(C) Single cells expressing the top 3 most expanded clonotypes found in the CD4PROLIF T cell population are shown in red in the same UMAP space as in Figure 2A. The regions composed of proliferating, regulatory, and cytotoxic T cells are outlined and superimposed on the UMAP projection for visualization.
(D) Left panel: pseudotime trajectories derived from all tumors (N = 7 samples) and non-malignant samples (N = 6 samples). Cells with expanded TCRs from the proliferating (CD4PROLIF, green), regulatory (CD4IL2RAHI and CD4IL2RALO, shades of red), and cytotoxic (CD4GZMB and CD4GZMK, shades of purple) states were used for this analysis. Specific branches corresponding to proliferating cytotoxic cells (top right), non-proliferating cytotoxic cells (bottom right), proliferating regulatory cells (top left), and non-proliferating regulatory cells (bottom left) are labeled. Right panel: branches are color-coded according to the above proliferating or non-proliferating identities. Also labeled are branch points that discriminate proliferating and non-proliferating cytotoxic CD4+ T cells (branch point 1) and proliferating and non-proliferating regulatory T cells (branch point 2).
(E) Heatmap showing all differentially expressed genes (columns) between branches for branch point 1 across cells in the pseudotime analysis (rows). Cells are grouped by their proliferating or non-proliferating branch assignments, color-coded at the right of the heatmap and corresponding to colors in (D). Genes are grouped by color-coded clusters (1–8) shown at the top of the plot, which result from hierarchical clustering based on co-regulation in specific branches.
(F) Cytotoxic CD4+ T cell gene signature scores were plotted in clinical responders (complete response or partial response) versus non-responders (stable disease or progressive disease) from baseline metastatic biopsies from bladder cancer patients with inflamed tumors on the IMvigor210 clinical trial (N = 62 tumors). The signature score was obtained from the IMvigor210 bulk RNA-seq dataset for the cytotoxic CD4+ T cell-specific genes derived from non-proliferating (cluster 4) and proliferating (cluster 7) cytotoxic CD4+ clusters from the pseudotime analysis shown below the heatmap in (E). Median ± SEM is shown; ∗p = 0.037 by two-tailed t test.
Given that regulatory and cytotoxic CD4+ T cells were heterogenous and composed of cells that were proliferating to a different extent, existing clusters may fail to resolve the separate contribution of specific expression programs from subsets with different proliferative capacity. Hence, we used pseudotime analysis to separate regulatory and cytotoxic cells into proliferating and non-proliferating components (Qiu et al., 2017). This analysis divided CD4PROLIF cells into two groups, each lying along a branch specific for proliferating regulatory or cytotoxic CD4+ T cells, with separate branches for non-proliferating regulatory and cytotoxic cells (Figure 5D). This underscored that regulatory and cytotoxic CD4+ T cells consist of distinct proliferating and non-proliferating states in TCC, based on transcriptomic and clonotypic analyses.
A Signature of Cytotoxic CD4+ T Cells Predicts Clinical Response to Anti-PD-L1
To assess the importance of the specific proliferating and non-proliferating cytotoxic CD4+ T cell states for patient outcomes, we performed branched expression analysis modeling (BEAM) to identify all genes that were differentially expressed between branches at branchpoint 1 of the pseudotime trajectory. This branchpoint divided proliferating cytotoxic CD4+ T cells, non-proliferating cytotoxic CD4+ T cells, and all other regulatory cells (Figure 5D, right panel). Hierarchical clustering identified genes upregulated preferentially in the proliferating cytotoxic branch (cluster 7) or the non-proliferating cytotoxic branch (cluster 4) but not in regulatory branches within this analysis (all genes with q < 0.05; heatmap of clusters and branches in Figure 5E; branch-specific signatures in Table S5). We developed a gene signature from this analysis consisting of genes that were upregulated specifically in proliferating or non-proliferating cytotoxic CD4+ T cells (from cluster 7: ABCB1; from cluster 4: APBA2, SLAMF7, GPR18, and PEG10; Figure 5E) but were not upregulated in any of the CD8+ T cell states from our scRNA-seq analysis (Table S2). We then tested this gene signature’s ability to predict treatment response using bulk RNA-seq data from pre-treatment tumors from a separate phase 2 trial of atezolizumab for metastatic bladder cancer (IMvigor210; Mariathasan et al., 2018). In 244 metastatic bladder cancer patients with pre-treatment RNA-seq data, immunohistochemistry (IHC) information regarding immune phenotype (immune desert, immune-excluded, or inflamed), and information regarding clinical response, this gene signature was significantly correlated with clinical response to anti-PD-L1 therapy in inflamed samples (p = 0.037, two-tailed t test, N = 62 inflamed samples; Figure 5F), which was not seen in samples with an immune-excluded or immune desert phenotype. Hence, we used a composite signature containing genes that discriminated proliferating and non-proliferating cytotoxic CD4+ T cells to assess the specific contributions of these discrete states and found that this signature is associated with response to PD-1 blockade in a large cohort of TCC patients. This result highlights the potential clinical importance of possessing intratumoral cytotoxic CD4+ T cell activity in response to anti-PD-L1 treatment.
Discussion
Current efforts to dissect the mechanism of tumor immune surveillance and enhance the efficacy of cancer immunotherapies have primarily focused on conventional cytotoxic CD8+ T cell-mediated responses. However, given the known functional diversity of CD4+ T cell effector responses and emerging data that CD4+ T cell recognition may be important for anti-tumor responses (for instance, in the context of a neoantigen vaccine; Ott et al., 2017, Sahin et al., 2017), the role of specific CD4+ states in enhancing or suppressing immune responses in the tumor microenvironment and how these are modulated by systemic therapies, including immunotherapy, remains unknown. Here we use unbiased massively parallel genotypic and phenotypic profiling of the T cell compartment in localized bladder tumors and the adjacent non-malignant compartment, including those treated with anti-PD-L1 immunotherapy, as a tool to finely dissect heterogeneity in CD4+ T cell subsets. We identified specific CD4+ T cell states with functional relevance for response to immunotherapy and clinical outcomes. We not only confirmed the presence of CD4+ T cell states with known contributions to anti-tumor immune responses, such as CXCL13+ CD4+ T cells (Schmidt et al., 2018, Gu-Trantien et al., 2013, Gu-Trantien et al., 2017, Wei et al., 2018, Zhang et al., 2018) as well as Th17 cells (Kryczek et al., 2011), we also uncovered insights into the contribution of CD4+ TILs to tumor control by the immune system in bladder cancer.
First we identified distinct states of Tregs that differed based on the level of expression of IL2RA and immune checkpoints, such as TNFRSF18, which was confirmed at the protein level. These Tregs possessed a private repertoire with no detected clonotype sharing with other T cell states, which would suggest that these are not induced Tregs. Because a gene signature from checkpoint-high Tregs is associated with worse outcome in non-small cell lung cancer (Guo et al., 2018), it is possible that these regulatory cells are responsible for setting a basal state of more potent immunosuppression and adverse outcomes in TCC.
Second, we identified heterogenous states of cytotoxic CD4+ T cells that were unexpected and differed in their expression of canonical cytolytic effector molecules (GZMB, GZMK, and PRF1 [perforin]) as well as other granule-associated proteins (GNLY [granulysin] and NKG7) that may have roles in target cell killing. These were distinct populations based on scRNA-seq and orthogonal validation by flow cytometry and multiplex immunofluorescence tissue staining. Our annotation using SingleR indicated that effector states such as cytotoxic CD4+ T cells found in the tumor microenvironment may not yet be annotated, and, based on “best fit” comparisons with external reference data and transcriptional correlation within our own data, these cells were, in fact, most similar to conventional effector memory cytotoxic CD8+ T cells. The functional similarity between cytotoxic CD4+ T cells and conventional CD8+ T cells was underscored by our finding that CD4GZMB TILs were actually most similar to tumor-specific CD8ENTPD1 cells (Duhen et al., 2018), based on transcriptional data, whereas CD4GZMK TILs were most similar to CD8CM and CD8NAIVE cells. Although these were distinct cell types, based on separate CD4 and CD8 co-receptor expression, this may indicate shared modes of tumor recognition and tumor clearance by cytotoxic CD4+ and CD8+ T cells. Although cytotoxic CD4+ T cells are present in non-small cell lung and hepatocellular carcinoma (Zheng et al., 2017a, Guo et al., 2018), circulate with ipilimumab treatment in metastatic melanoma (Kitano et al., 2013), and also are present in an infectious context, where they represent a clonally expanded dengue virus-specific effector subset (Patil et al., 2018), the extent of their heterogeneity in other solid tumors (including bladder cancer) and whether these cells are important for systemic immunotherapy has remained unclear prior to this work. We found that cytotoxic CD4+ subsets in bladder tumors were clonally expanded, which may be the result of recognition of cognate bladder tumor antigens. Their functional importance was confirmed by their ability to kill autologous tumors ex vivo. The mechanism by which these cells kill target tumor cells involves contact-dependent mechanisms based on inhibition of killing by anti-MHC class II antibodies, although other mechanisms may also contribute. We documented that these cytotoxic CD4+ T cells are polyfunctional and secrete multiple, such as TNF-α and IFNγ; the latter may contribute to tumor death as well through ferroptosis (Wang et al., 2019) in addition to contact-dependent cytotoxicity. Of note, apart from the subset of cells that co-express TNF-α, IFNγ, PDCD1, LAG3, and HAVCR2, cytotoxic CD4+ T cells are found to generally lack surface expression of many immune checkpoints currently being tested with therapeutic antibodies in pre-clinical and clinical testing, suggesting that these effector cells may have distinct requirements for activation.
Importantly, a gene signature derived from single-cell analysis of proliferating and non-proliferating cytotoxic CD4+ T cells is predictive of the response to anti-PD-L1 therapy in a separate set of 62 patients with inflamed metastatic bladder cancer. Most of these genes have been previously implicated in the biology of cytotoxic effector cells or specific human CD4+ T cell responses in pathogenesis or autoimmunity, including human cytotoxic CD4+ T cells (Arlehamn et al., 2014, Burel et al., 2018, Campbell et al., 2018, Imbeault et al., 2012, Mattoo et al., 2016, Sumida and Cyster, 2018, Wang et al., 2014). Overall, the predictive value of this cytotoxic CD4+ T cell-specific signature in a large cohort of anti-PD-L1-treated metastatic TCC patients highlights how anti-PD-L1 therapy may alter the immune microenvironment to favor activation of cytotoxic CD4+ effectors, particularly in patients with pre-existing cytotoxic CD4+ T cell activity.
The importance of the relative balance between regulatory and effector T cells is well known for conventional effectors; the regulatory CD4+:cytotoxic CD8+ ratio has been associated with improved survival or response to therapy in several cancers, including bladder (Preston et al., 2013, Sato et al., 2005, Baras et al., 2016, Takada et al., 2018). This work identifies the biological importance of another axis involving the relative balance of regulatory T cells and these cytotoxic CD4+ effectors for anti-tumor activity: removal of regulatory T cells enhanced tumor killing by cytotoxic CD4+ T cells. Our findings suggest that manipulating the balance between cytotoxic CD4+ and regulatory T cell states can lead to therapeutic benefit in TCC.
Finally, the origin of cytotoxic CD4+ T cell effectors within tumors remains unclear. We do not find direct evidence of plasticity or interconversion of regulatory T cells into cytotoxic CD4+ T cells, based on clonotype sharing. Cytotoxic CD4+ T cells do share clones with the proliferating CD4+ state, raising the possibility that these cells may arise from activation of other CD4+ subsets, whether within the tumor milieu itself or as a result of tumor homing of precursors, which are first activated outside of the tumor in the peripheral circulation.
There are important limitations to the interpretation of this study. The size of the sample set used for single-cell discovery of T cell heterogeneity was limited to 7 patients; hence, larger-scale single-cell sequencing efforts in bladder cancer will help to validate these findings. The treatments administered before collection were also heterogeneous; as a result, given the limitations in sample size, our ability to directly assess modulation of T cell subsets, such as cytotoxic CD4+ T cells, by immunotherapy in this dataset is limited. Finally, the scope of our findings in this dataset is limited to patients with MIBC; further efforts will be needed to assess the immune context in other bladder cancer disease states. Nonetheless, the robustness of our findings across the individual patients in this dataset highlight conserved CD4+ heterogeneity across patients, which is important for immune recognition of bladder tumors.
This work lays an important conceptual foundation for efforts to enhance bladder tumor immunotherapy. We identify cytotoxic CD4+ effectors whose distinct expression of cytolytic molecules and other marker genes will lead to further efforts to isolate and enhance the activity of specific cytotoxic subsets as well as to discover the bladder tumor antigens they are recognizing. At the same time, this work points to specific regulatory T cell states that may be more suppressive in bladder cancer and therefore represent ideal targets for parallel approaches to inhibit their activity. Collectively, our findings point to the importance of understanding multiple axes that balance suppressive regulatory T cell activity with effector function of anti-tumor immune subsets in TCC to enhance our ability to effectively manipulate these with therapeutic approaches to enhance tumor control.
STAR★Methods
Key Resources Table
| REAGENT or RESOURCE | SOURCE | IDENTIFIER |
|---|---|---|
| Antibodies | ||
| Brilliant Violet 605 CD25, clone BC96 | Biolegend | Cat# 302632 |
| Brilliant Violet 786 CD127, clone A019D5 | Biolegend | Cat# 351330 |
| Brilliant Violet 421 CD4, clone OKT4 | Biolegend | Cat# 317434 |
| Brilliant Violet 650 CD3, clone UCHT1 | Biolegend | Cat# 300468 |
| Brilliant Ultraviolet 395 CD45, clone H130 | Becton Dickinson | Cat# 563792 |
| Alexa Fluor 647 CD8, clone SK1 | Biolegend | Cat# 344726 |
| FITC GZMK, clone GM26E7 | Biolegend | Cat# 370508 |
| PerCP-Cy5.5 HLA-DR, clone L243 | Biolegend | Cat# 307630 |
| APC-R700 CCR7, clone 3D12 | Becton Dickinson | Cat# 565867 |
| Brilliant Violet 480 CD3, clone UCHT1 | Becton Dickinson | Cat# 566105 |
| Brilliant Violet 510 GZMB, clone GB11 | Becton Dickinson | Cat# 563388 |
| Brilliant Violet 605 Ki67, clone Ki-67 | Biolegend | Cat# 350522 |
| Brilliant Violet 650 CD45RA, clone HI100 | Biolegend | Cat# 304136 |
| Brilliant Violet 786 CD25, clone BC96 | Biolegend | Cat# 302638 |
| Brilliant violet 711 TNFSRF18, clone 108-17 | Biolegend | Cat# 371212 |
| Brilliant ultraviolet 395 CD4, clone RPA-T4 | Becton Dickinson | Cat# 564724 |
| Brilliant ultraviolet 496 CD8, clone RPA-T8 | Becton Dickinson | Cat# 564808 |
| Brilliant ultraviolet 805 CD45, clone HI30 | Becton Dickinson | Cat# 564914 |
| PE-CF594 FoxP3, clone 259D/C7 | Becton Dickinson | Cat# 562421 |
| PE-Cy7 Perforin, clone B-D48 | Biolegend | Cat# 353316 |
| Alexa Fluor 647 IFNγ, clone 4S.B3 | Biolegend | Cat# 502516 |
| PE anti-human TNFα, clone Mab11 | Biolegend | Cat# 502909 |
| CD4, clone SP35 | Cell Marque | Cat# 104R-18 |
| Alexa Fluor 555 goat anti-rabbit IgG(H+L) | Invitrogen | Cat# 4050-32 |
| Chemicals, Peptides, and Recombinant Proteins | ||
| Liberase TL, research grade | Millipore Sigma | Cat# 5401020001 |
| Draq7 | Biolegend | Cat# 424001 |
| Live/dead fixable Near-IR dead cell stain | Invitrogen | Cat# L34975 |
| FluoroFix buffer | Biolegend | Cat# 422101 |
| Recombinant human IL-2 | Peprotech | Cat# 200-02 |
| IncuCyte Annexin V Red reagent | Essen Bioscience | Cat# 4641 |
| IncuCyte Cytotox Red reagent | Essen Bioscience | Cat# 4632 |
| RNAscope probe, Homo sapiens, GZMB (channel 2) | Advanced Cell Diagnostics | Cat# 445971-C2 |
| RNAscope probe, Homo sapiens, GZMK (channel 1) | Advanced Cell Diagnostics | Cat# 475901-C1 |
| L15 media, 15 mM HEPES, 600 mg% glucose | UCSF Cell Culture Facility | N/A |
| Fetal bovine serum | Omega Scientific | Cat# FB-01 |
| RPMI-1640 | UCSF Cell Culture Facility | N/A |
| ImmunoCult XF complete medium (Medium + 10% FCS + 1% penicillin / streptomycin) | STEMCELL Technologies | Cat# 10981 |
| Critical Commercial Assays | ||
| GentleMACS | Miltenyi Biotec | Cat# 130-093-235 |
| FoxP3/transcription factor staining buffer set | eBioscience | Cat# 00-5523-00 |
| Cell stimulation cocktail | eBioscience | Cat# 00-4975 |
| Chromium Single Cell 3′ Library, Gel Bead & Multiplex Kit | 10X Genomics | Cat# 120233 (discontinued) |
| Chromium Single Cell 3′ Chip Kit | 10X Genomics | Cat# 120232 (discontinued) |
| Dynabeads Human T-Activator CD3/CD28/CD137 | GIBCO | Cat# 11162D |
| Opal 7-color manual IHC kit | Perkin Elmer | Cat# NEL811001KT |
| Deposited Data | ||
| Processed data | This study | NCBI GEO: GSE149652 |
| Healthy human donor TCR data for CD4+ peripheral blood mononuclear cells | 10X Genomics | https://support.10xgenomics.com/single-cell-vdj/datasets/2.2.0/vdj_v1_hs_cd4_t |
| Healthy human donor TCR data for CD8+ peripheral blood mononuclear cells | 10X Genomics | https://support.10xgenomics.com/single-cell-vdj/datasets/2.2.0/vdj_v1_hs_cd8_t |
| Human reference genome, build hg19 | 10X Genomics | http://software.10xgenomics.com/ |
| Oligonucleotides | ||
| TCR sequencing primers | Table S3 | N/A |
| Software and Algorithms | ||
| Cell Ranger v1.1 | 10X Genomics | http://software.10xgenomics.com/ |
| Scanpy v1.4.3 | Wolf et al., 2018 | https://scanpy.readthedocs.io/en/stable/index.html |
| miXCR v2.1.12 | Bolotin et al., 2015 | https://mixcr.readthedocs.io/en/latest/ |
| Monocle v2.10.1 | Qiu et al., 2017 | Bioconductor |
| SingleR v1.1.9 | Aran et al., 2019 | Bioconductor |
| FlowJo | TreeStar | N/A |
Resource Availability
Lead Contact
Further information and requests for resources and reagents should be directed to and will be fulfilled by the Lead Contact, Lawrence Fong (lawrence.fong@ucsf.edu).
Materials Availability
Primer sequences for TCR sequencing are enumerated in Table S3. All unique reagents generated in this study are available from the Lead Contact upon request.
Data and Code Availability
Processed single-cell RNA sequencing and TCR sequencing data that support this study have been deposited in the NCBI GEO database under accession GSE149652. Raw sequencing data will be deposited in dbGaP. All software algorithms used for analysis are available for download from public repositories which are listed in the Key Resources Table.
Experimental Model and Subject Details
Tissues were obtained from patients with localized bladder transitional cell carcinoma (TCC) who either received 1-2 doses of neoadjuvant atezolizumab as part of an ongoing clinical trial (UCSF IRB# 14-15423, patients were accrued sequentially to receive increasing numbers of atezolizumab doses), or standard of care treatments recommended by their treating physician including chemotherapy (gemcitabine/carboplatin) or no systemic therapy prior to planned cystectomy (these patients were consented for tissue collection under a separate protocol, UCSF IRB# 10-04057). All studies with patients and patient samples were conducted with appropriate institutional IRB approval and oversight. Patient demographics, including age, gender, disease state (all were localized muscle-invasive bladder cancer), neoadjuvant treatment, and presence of tumor and pathologic staging at the time of surgery are provided in Table S1. No formal sample size calculations were conducted for this particular collection.
Method Details
Tissue processing
Tissues were obtained from patients with localized bladder transitional cell carcinoma (TCC) who either received neoadjuvant atezolizumab, standard of care chemotherapy (gemcitabine/carboplatin), or no systemic therapy as per standard of care prior to planned cystectomy. Cystectomy surgical specimens were obtained fresh from the operating field, and dissected in surgical pathology where grossly apparent tumor or adjacent bladder not grossly affected by tumor (“non-malignant”) were isolated, minced, and transported at room temperature immersed in L15 media with 15 mM HEPES and 600 mg% glucose. Once received, these were digested using Liberase TL as well as mechanical dissocation with heat (gentleMACS) using standard protocols. Single cell suspensions were obtained and counted for viability before staining for FACS. Healthy donor blood was separately collected, processed by gradient centrifugation to peripheral blood mononuclear cells (PBMCs), and cryopreserved to be thawed later for control experiments.
Flow cytometry/FACS
Freshly dissociated TILs and previously frozen healthy donor PBMCs were used for sorting. Samples were stained with designated panels for 30 minutes at 4°C and washed twice with FACS buffer (PBS, 2% FBS, 1mM EDTA). Cells were incubated with Draq7 (Biolegend, Cat# 424001) for 5 mins at room temperature to stain dead cells. Samples were sorted on a FACSAria Fusion (Becton Dickinson) using FACSDiva software with single channel compensation controls acquired on the same day.
For RNA sequencing flow validation, previously frozen TILs were thawed into in complete media (RPMI, 10% heat inactivated FBS, 1% non-essential amino acids solution, 10 uM HEPES, 1mM sodium pyruvate, 2 mM L-glutamine, 100 U/ml penicillin-streptomycin) and washed once with PBS. Live/dead fixable Near-IR dead cell stain (Invitrogen, Cat# L34975) was incubated with cells for 30 minutes at room temperature and washed once with FACS buffer. Samples were stained with designated panels for 30 minutes at 4°C and washed twice with FACS buffer. Cells requiring intracellular staining were fixed and permeabilized with eBioscience FoxP3/ Transcription factor staining buffer set (Cat# 00-5523-00) according to the manufacturer’s protocol. Intracellular staining with antibodies was carried out for 30 minutes at room temperature and washed twice with FACS wash. Cells were fixed with FluoroFix buffer (Biolegend, Cat# 422101) and washed once with FACS buffer. Cells were acquired the next day on a FACSymphony (Becton Dickinson) using FACSDiva with single channel compensation controls acquired on the same day. Data was analyzed offline using FlowJo analysis software (FlowJo, LLC).
For cytokine expression, cells were resuspended in complete media and divided into two T25 flasks. One flask was activated with cell stimulation cocktail (eBioscience, cat# 00-4975 containing phorbol 12-myristate 13-acetate, ionomycin, brefeldin A and monensin at a final concentration of 81 nM, 1.34 nM, 10.6 μM and 2 μM respectively) and both flasks were incubated upright for 3 h in a CO2 incubator at 37°C. Cells were collected and washed once with PBS prior to Live/Dead Fixable Near-IR dead cell staining and surface and intracellular flow staining as described above.
Antibodies used for sorting were Brilliant Violet 605 CD25 (Biolegend, clone BC96, Cat# 302632), Brilliant Violet 786 CD127 (Biolegend, clone A019D5, Cat# 351330), Brilliant Violet 421 CD4 (Biolegend, clone OKT4, Cat# 317434), Brilliant Violet 650 CD3 (Biolegend, clone UCHT1, Cat# 300468), Brilliant Ultraviolet 395 CD45 (Becton Dickinson, clone H130, Cat# 563792), and Alexa Fluor 647 CD8 (Biolegend, clone SK1, Cat# 344726). Antibodies used for RNA sequencing flow validation were FITC GZMK (Biolegend, clone GM26E7, Cat# 370508), PerCP-Cy5.5 HLA-DR (Biolegend, clone L243, Cat# 307630), APC-R700 CCR7 (Becton Dickinson, clone 3D12, Cat# 565867), Brilliant Violet 480 CD3 (Becton Dickinson, clone UCHT1, Cat# 566105), Brilliant Violet 510 GZMB (Becton Dickinson, clone GB11, Cat# 563388), Brilliant Violet 605 Ki67 (Biolegend, clone Ki-67, Cat# 350522), Brilliant Violet 650 CD45RA (Biolegend, clone HI100, Cat# 304136), Brilliant Violet 786 CD25 (Biolegend, clone BC96, Cat# 302638), Brilliant violet 711 TNFSRF18 (Biolegend, clone 108-17, Cat# 371212), Brilliant ultraviolet 395 CD4 (Becton Dickinson, clone RPA-T4, Cat# 564724), Brilliant ultraviolet 496 CD8 (Becton Dickinson, clone RPA-T8, Cat# 564808), Brilliant ultraviolet 805 CD45 (Becton Dickinson, clone HI30, Cat# 564914), PE-CF594 FoxP3 (Becton Dickinson, clone 259D/C7), PE-Cy7 Perforin (Biolegend, clone B-D48, Cat# 353316).
Antibodies used for cytokine staining in addition to those used above were Alexa Fluor 647 IFNγ (Biolegend, clone 4S.B3, Cat# 502516) and PE anti-human TNFα (Biolegend, clone Mab11, Cat# 502909).
Single cell RNA sequencing
Droplet-based single-cell RNA sequencing (dscRNA-seq) was performed using the 10X Genomics Chromium Single Cell 3′ platform, version 1, according to manufacturer’s instructions. CD3+CD4+ and CD3+CD8+ T cells were sorted from digested tumor and non-malignant tissues, or Ficoll-purified and previously cryopreserved healthy control PBMCs, into 500 ul of PSA/0.04% BSA for loading onto 10X. Following library preparation, sequencing was performed on an Illumina HiSeq 2500 (Rapid Run mode). Paired samples from the same experiment and patient were processed in parallel during library preparation, and sequenced on the same flowcell to minimize batch effects.
TCR sequencing
In brief, approximately 10% of the barcoded cDNA from the 10X workflow was utilized for TCR analysis. Primers used for TCR sequencing are listed in Table S3. cDNA were first amplified with 6-12 amplification cycles using a template switching oligonucleotide (TSO) and P7 primers. A pool of forward Vα and Vβ primers containing the TruSeq Read 1 primer sequence were then used in conjunction with a reverse P7 primer to amplify CDR3 sequences from the TCR alpha and beta loci. An additional amplification step using forward primers containing the Illumina P5, i5 and Truseq Read 1 sequences was used with reverse P7 primer to create final TCR libraries for sequencing. Deep sequencing was done on an Illumina NovaSeq S1 with separate lanes for the TCR alpha and TCR beta sequencing. Read 1 contained 280 bp of the TCR alpha or beta CDR3 sequence, and the i7 read contained the 14 bp 10X barcode.
Expression analysis
After 10X sequencing data was processed through the Cell Ranger pipeline (version 1.1, hg19 genome assembly) with default settings, filtered gene-barcode matrices for single tumors were analyzed using the scanpy toolkit (Wolf et al., 2018). Genes that were detected in less than three cells were filtered out, and cells were filtered out with greater than ten percent of mitochondrial genes and with fewer than 100 or greater than 1200 detected genes. Cells that were annotated as red blood cells (HBB) or macrophage (CD14, CD68, CD163) were also excluded from downstream analyses. The gene expression values were log2 plus one transformed and normalized to 10,000 counts per cell. The resulting matrix was batch corrected by regressing out total UMI counts and percent mitochondrial genes using the built-in scanpy function followed by using the scanpy implementation of ComBat (Johnson et al., 2007) with each well acting as a batch (13 wells total). The adjusted matrix was scaled to a mean of zero and variance of 1. Highly variable genes were selected using the embedded scanpy function followed by principal component analysis (PCA), leiden clustering and UMAP plotting with default settings with the exception of using a resolution of 1.5 for CD4+ T cells and 1.0 for CD8+ T cells for the leiden clustering. This yielded 19 clusters which were collapsed to 11 cell types based on manual gene annotations (for CD4+ cells), and 11 clusters (for CD8+ cells). We performed differential expression to identify marker genes that were upregulated in each individual cluster relative to the combination of all other single cells (regardless of tumor or non-malignant tissue origin), or genes that were upregulated in tumor versus non-malignant compartments. We compared the gene lists to known literature to label the clusters, as well as using SingleR (Aran et al., 2019) to map the expression signature for each cluster to the best correlated candidate immune reference signature, using the Monaco bulk RNA-seq reference of sorted human immune cell populations described within (Monaco et al., 2019). Significant differences between the cell type abundances for the normal and tumor tissue samples were assessed using an exact permutation test on the abundances.
Correlation analysis between gene expression from distinct clusters was performed by restricting to genes expressed across all clusters being tested, and then correlating the scaled expression of the multidimensional vector of shared genes between pairs of clusters and computing the Pearson correlation coefficient.
TCR analysis
TRA and TRB CDR3 nucleotide reads were demultiplexed by matching reads to 10X barcodes from cells with existing expression data that passed filtering in the Cell Ranger pipeline, excluding cell barcodes that overlapped between multiple samples. Following demultiplexing of the TRA and TRB CDR3s, reads were aligned against known TRA/TRB CDR3 sequences then assembled into clonotype families using miXCR (Bolotin et al., 2015) with similar methodologies to a previous study (Zemmour et al., 2018). For any given 10X barcode, the most abundant TRA or TRB clonotype was accepted for further analysis; if 2 TRA or TRB clonotypes were equally abundant for a given 10X barcode, the clonotype with the highest sequence alignment score was used for further analysis. Detailed sequencing statistics and saturation analysis are provided in Table S3. Only cells with paired TRA and TRB were used for further downstream analysis. Analysis utilizing TCR data only (number of unique cells sharing a specific TRA/TRB clonotype sequence, Gini coefficient) utilized cells both with and without a specific functional population that had been assigned by clustering. Analysis involving both TCR clonotype and function was restricted to cells with both a mapped TRA/TRB and a functional population from clustering. Statistical comparisons of Gini coefficients across compartments was performed using Wilcoxon signed-rank test with Benjamini-Hochberg correction for multiple testing; statistical testing of differences in Gini coefficients between tumor and non-malignant compartments across all phenotypic clusters was performed using exact permutation testing.
Tumor infiltrating lymphocyte (TIL) isolation and culturing
Single-cell suspensions from processed and digested bladder tumors were viably frozen at −80 C and stored prior to culture setup. To sort the tumor-infiltrating lymphocytes, frozen cancer cell aliquots were thawed, washed once with PBS, and counted by Vicell. Cells were subsequent stained and sorted by FACS. CD4 TIL (Draq7-CD45+CD3+CD4+ that were not CD25+CD127lo) and CD8 TIL (Draq7-CD45+CD3+CD8+) were sorted into ImmunoCult XF complete medium (Medium + 10% FCS + 1% penicillin/streptomycin; STEMCELL Technologies #10981). T cells were pooled together for culturing. After centrifugation, T cells were suspended in ImmunoCult XF complete medium, and Dynabeads Human T-Activator CD3/CD28/CD137 (GIBCO #11162D) were added to the culture per manufacturer’s protocol. T cells were cultured in 96 well U-bottom plates, and briefly centrifuged to ensure cell contact with Dynabeads. T cell expansion was managed in two phases. For the first week of T cell expansion, TILs were maintained with ImmunoCult XF complete medium + 200 IU/ml of human recombinant IL-2 (Peprotech #200-02). From the second week onward, IL-2 concentration was gradually increased from 200 IU/ml to 2000 IU/ml based on cell growth kinetics (which varied by patient sample). T cells were harvested between 5-8 weeks for functional killing assays.
Cytotoxic T lymphocyte (CTL) killing assay
After expansion, TILs were again sorted for either CD4 or CD8 as distinct effector populations. Primary cancer cells from frozen aliquots were freshly thawed and sorted on CD45-Draq7- as target cells. To achieve various effector-to-target (E:T) ratios, 3000 cancer cell targets were suspended in ImmunoCult XF complete medium and seeded into each well. Different ratios of TILs were serially diluted and added to the corresponding wells. Each well contained 200 μL of medium supplemented with 1 μl/well of IncuCyte Annexin V Red reagent (Essen Bioscience #4641). For MHCI and MHCII blockade, 10 μg of blocking antibody (or isotype control matched to the anti-MHCII antibody) was added into wells containing cancer cells and cultured at 37 C for 1 hour prior to co-culture with TILs. Cell culture was monitored by the IncuCyte Zoom system (Essen Bioscience) at 15-30 minute intervals for up to 36 h when needed. Experiments with Annexin V were carried out with samples from 3 independent patients. Additional experiments were performed using 0.25 μL of IncuCyte Cytotox Red reagent (Essen Bioscience #4632) instead of Annexin V; 2 independent experiments were performed with Cytotox Red using distinct aliquots from the same patient. Analysis was performed using the IncuCyte Zoom software, using images background subtracted with a tophat filter. For Annexin V experiments, background death was subtracted, with all traces displayed as relative change in cell death from time point 0. For Cytotox Red experiments, tumor cells were larger than TIL based on inspection of wells with tumor cells alone or free TILs in wells containing TILs; based on this, the number of dying tumor cells per mm2 was determined using a minimum area threshold of 75 μm2. Out of focus frames were discarded, as were any wells where the first time frame was out of focus precluding accurate normalization.
Pseudotime analysis
Pseudotime analysis, including branched expression analysis modeling (BEAM) to identify all genes with branch-dependent differential expression followed by unbiased clustering of genes based on patterns of co-expression in specific branches, was performed using Monocle v2.10.1 as described (Qiu et al., 2017), for the combination of proliferating (CD4PROLIF, regulatory (CD4IL2RAHI, CD4IL2RALO) and cytotoxic (CD4GZMB, CD4GZMK) states from scRNA-seq clustering.
Gene signature analysis
Genes were selected based on their specific upregulation in proliferating or non-proliferating cytotoxic CD4+ T cell branches, but not in regulatory T cell branches, from the pseudotime analysis. Genes that overlapped with differentially expressed genes in any of the CD8+ T cell states from our scRNA-seq analysis (Table S2) were removed. The resulting gene list was used to construct a composite signature consisting of genes that distinguish either proliferating or non-proliferating cytotoxic CD4+ T cells; a signature score was computed as previously published for the IMvigor210 dataset (Mariathasan et al., 2018), by z-score transforming the expression of each gene in the signature, and then using the first component (PC1) of a principal component analysis as the gene signature score. Immune subtypes for the IMvigor210 samples for this analysis were previously assigned based on CD8 immunohistochemistry staining (Mariathasan et al., 2018).
RNAscope/tissue immunofluorescence staining
RNAscope (Advanced Cell Diagnostics) in situ hybridization and immunofluorescence staining were performed on 4 μm FFPE sections from cystectomy specimens with existing scRNA-seq and TCR-seq data. Tissues were pre-treated with target retrieval reagents and protease to improve target recovery based on guidelines provided in the RNAscope Multiplex Fluorescent Reagent Kit v2 Assay protocol. Probes for human GZMB and GZMK mRNA (ACD) were incubated at 1:700 dilution for 2 hr 40 min. The probe was then hybridized with Opal 7-Color Manual IHC Kit (PerkinElmer), with detection of GZMB and GZMK using Opal 620 and Opal 540 respectively. Samples were then immunofluorescence stained for human CD4 (Cell Marque) which was detected using Alexa Fluor 555-conjugated goat anti-rabbit IgG secondary antibody (Invitrogen). Tissues were counterstained with DAPI. Slides were imaged using a TCS SP8 X white light laser inverted confocal microscope (Leica Microsystems). No staining was seen with negative control probes (for RNAscope) or with secondary antibody alone (for immunofluorescence) for tumor tissue from cystectomy specimens (shown in Figure 4F) or healthy tonsil tissue (data not shown).
Quantification and Statistical Analysis
Specific statistical tests and metrics (median, mean, standard error) used for comparisons, along with sample sizes, are described in the Results and figure legends. The chemotherapy sample was included in unbiased clustering, testing for conserved marker genes and tumor versus non-malignant testing, but was excluded from analyses of treatment effect (anti-PD-L1 versus untreated).
Additional Resources
The clinical trial of neoadjuvant atezolizumab prior to planned cystectomy for localized bladder cancer is registered under clinicaltrials.gov (NCT02451423).
Acknowledgments
We thank the patients who volunteered to participate in these studies; the UCSF Genitourinary Medical Oncology and Urology providers involved in screening, enrollment, and clinical care of these patients; the UCSF Biospecimen Resources Program for assistance with tissue acquisition; and the Institute for Human Genetics Core for assistance with sequencing. This work was supported by the Parker Institute for Cancer Immunotherapy. D.Y.O. is supported by NIH T32CA177555 and K08AI139375, the Harry F. Bisel, MD Endowed Young Investigator Award from the Conquer Cancer Foundation of the American Society of Clinical Oncology, the Bladder Cancer Advocacy Network Palm Beach New Discoveries Young Investigator Award, and the Prostate Cancer Foundation Young Investigator Award. S.S.K. is supported by the Peter Michael Foundation. L.F. is support by the Parker Institute of Cancer Immunotherapy; the Prostate Cancer Foundation; and NIH R01CA194511, R01CA223484, U01CA233100, and U01CA244452.
Author Contributions
Study concept and design, D.Y.O., S.S.K., and L.F.; Acquisition of Patients, Samples, and Data, D.Y.O., S.S.K., A.I., C.-C.S.P., C.R., K.A., A.B., S.P., M.V.M., and T.W.F.; Data Analysis and Interpretation, D.Y.O., S.S.K., S.S.R., T.L., E.M., E.C., D.A., A.I., K.A., A.B., Y.S., M.H.S., S.M., C.J.Y., and L.F.; Writing of the Manuscript, D.Y.O., S.S.K., C.J.Y., and L.F.; Study Oversight, C.J.Y. and L.F.
Declaration of Interests
D.Y.O. has received research support from Roche/Genentech and Merck and has served as a paid consultant for Maze Therapeutics. L.F. has received research support from Roche/Genentech, Abbvie, Bavarian Nordic, Bristol Myers Squibb, Janssen, and Merck. C.J.Y. is a co-founder of Dropprint Genomics.
Published: June 3, 2020
Footnotes
Supplemental Information can be found online at https://doi.org/10.1016/j.cell.2020.05.017.
Contributor Information
Chun Jimmie Ye, Email: jimmie.ye@ucsf.edu.
Lawrence Fong, Email: lawrence.fong@ucsf.edu.
Supplemental Information
Healthy PBMC CD4+ and CD8+ control data are also included.
Cluster identifiers refer to the arbitrary clusters listed at the top of the heatmap in Figure 5E.
References
- Aran D., Looney A.P., Liu L., Wu E., Fong V., Hsu A., Chak S., Naikawadi R.P., Wolters P.J., Abate A.R. Reference-based analysis of lung single-cell sequencing reveals a transitional profibrotic macrophage. Nat. Immunol. 2019;20:163–172. doi: 10.1038/s41590-018-0276-y. [DOI] [PMC free article] [PubMed] [Google Scholar]
- Arlehamn C.L., Seumois G., Gerasimova A., Huang C., Fu Z., Yue X., Sette A., Vijayanand P., Peters B. Transcriptional profile of tuberculosis antigen-specific T cells reveals novel multifunctional features. J. Immunol. 2014;193:2931–2940. doi: 10.4049/jimmunol.1401151. [DOI] [PMC free article] [PubMed] [Google Scholar]
- Ayers M., Lunceford J., Nebozhyn M., Murphy E., Loboda A., Kaufman D.R., Albright A., Cheng J.D., Kang S.P., Shankaran V. IFN-γ-related mRNA profile predicts clinical response to PD-1 blockade. J. Clin. Invest. 2017;127:2930–2940. doi: 10.1172/JCI91190. [DOI] [PMC free article] [PubMed] [Google Scholar]
- Baras A.S., Drake C., Liu J.J., Gandhi N., Kates M., Hoque M.O., Meeker A., Hahn N., Taube J.M., Schoenberg M.P. The ratio of CD8 to Treg tumor-infiltrating lymphocytes is associated with response to cisplatin-based neoadjuvant chemotherapy in patients with muscle invasive urothelial carcinoma of the bladder. OncoImmunology. 2016;5:e1134412. doi: 10.1080/2162402X.2015.1134412. [DOI] [PMC free article] [PubMed] [Google Scholar]
- Bolotin D.A., Poslavsky S., Mitrophanov I., Shugay M., Mamedov I.Z., Putintseva E.V., Chudakov D.M. MiXCR: software for comprehensive adaptive immunity profiling. Nat. Methods. 2015;12:380–381. doi: 10.1038/nmeth.3364. [DOI] [PubMed] [Google Scholar]
- Burel J.G., Lindestam Arlehamn C.S., Khan N., Seumois G., Greenbaum J.A., Taplitz R., Gilman R.H., Saito M., Vijayanand P., Sette A., Peters B. Transcriptomic Analysis of CD4+ T Cells Reveals Novel Immune Signatures of Latent Tuberculosis. J. Immunol. 2018;200:3283–3290. doi: 10.4049/jimmunol.1800118. [DOI] [PMC free article] [PubMed] [Google Scholar]
- Büttner M., Miao Z., Wolf F.A., Teichmann S.A., Theis F.J. A test metric for assessing single-cell RNA-seq batch correction. Nat. Methods. 2019;16:43–49. doi: 10.1038/s41592-018-0254-1. [DOI] [PubMed] [Google Scholar]
- Campbell K.S., Cohen A.D., Pazina T. Mechanisms of NK Cell Activation and Clinical Activity of the Therapeutic SLAMF7 Antibody, Elotuzumab in Multiple Myeloma. Front. Immunol. 2018;9:2551. doi: 10.3389/fimmu.2018.02551. [DOI] [PMC free article] [PubMed] [Google Scholar]
- Cancer Genome Atlas Research Network Comprehensive genomic characterization defines human glioblastoma genes and core pathways. Nature. 2008;455:1061–1068. doi: 10.1038/nature07385. [DOI] [PMC free article] [PubMed] [Google Scholar]
- De Simone M., Arrigoni A., Rossetti G., Gruarin P., Ranzani V., Politano C., Bonnal R.J.P., Provasi E., Sarnicola M.L., Panzeri I. Transcriptional Landscape of Human Tissue Lymphocytes Unveils Uniqueness of Tumor-Infiltrating T Regulatory Cells. Immunity. 2016;45:1135–1147. doi: 10.1016/j.immuni.2016.10.021. [DOI] [PMC free article] [PubMed] [Google Scholar]
- Duhen T., Duhen R., Montler R., Moses J., Moudgil T., de Miranda N.F., Goodall C.P., Blair T.C., Fox B.A., McDermott J.E. Co-expression of CD39 and CD103 identifies tumor-reactive CD8 T cells in human solid tumors. Nat. Commun. 2018;9:2724. doi: 10.1038/s41467-018-05072-0. [DOI] [PMC free article] [PubMed] [Google Scholar]
- Gu-Trantien C., Loi S., Garaud S., Equeter C., Libin M., de Wind A., Ravoet M., Le Buanec H., Sibille C., Manfouo-Foutsop G. CD4+ follicular helper T cell infiltration predicts breast cancer survival. J. Clin. Invest. 2013;123:2873–2892. doi: 10.1172/JCI67428. [DOI] [PMC free article] [PubMed] [Google Scholar]
- Gu-Trantien C., Migliori E., Buisseret L., de Wind A., Brohée S., Garaud S., Noël G., Chi V.L.D., Lodewyckx J.N., Naveaux C. CXCL13-producing TFH cells link immune suppression and adaptive memory in human breast cancer. JCI Insight. 2017;2:91487. doi: 10.1172/jci.insight.91487. [DOI] [PMC free article] [PubMed] [Google Scholar]
- Guo X., Zhang Y., Zheng L., Zheng C., Song J., Zhang Q., Kang B., Liu Z., Jin L., Xing R. Global characterization of T cells in non-small-cell lung cancer by single-cell sequencing. Nat. Med. 2018;24:978–985. doi: 10.1038/s41591-018-0045-3. [DOI] [PubMed] [Google Scholar]
- Hargadon K.M., Johnson C.E., Williams C.J. Immune checkpoint blockade therapy for cancer: An overview of FDA-approved immune checkpoint inhibitors. Int. Immunopharmacol. 2018;62:29–39. doi: 10.1016/j.intimp.2018.06.001. [DOI] [PubMed] [Google Scholar]
- Herbst R.S., Soria J.C., Kowanetz M., Fine G.D., Hamid O., Gordon M.S., Sosman J.A., McDermott D.F., Powderly J.D., Gettinger S.N. Predictive correlates of response to the anti-PD-L1 antibody MPDL3280A in cancer patients. Nature. 2014;515:563–567. doi: 10.1038/nature14011. [DOI] [PMC free article] [PubMed] [Google Scholar]
- Hodi F.S., O’Day S.J., McDermott D.F., Weber R.W., Sosman J.A., Haanen J.B., Gonzalez R., Robert C., Schadendorf D., Hassel J.C. Improved survival with ipilimumab in patients with metastatic melanoma. N. Engl. J. Med. 2010;363:711–723. doi: 10.1056/NEJMoa1003466. [DOI] [PMC free article] [PubMed] [Google Scholar]
- Imbeault M., Giguère K., Ouellet M., Tremblay M.J. Exon level transcriptomic profiling of HIV-1-infected CD4(+) T cells reveals virus-induced genes and host environment favorable for viral replication. PLoS Pathog. 2012;8:e1002861. doi: 10.1371/journal.ppat.1002861. [DOI] [PMC free article] [PubMed] [Google Scholar]
- Johnson W.E., Li C., Rabinovic A. Adjusting batch effects in microarray expression data using empirical Bayes methods. Biostatistics. 2007;8:118–127. doi: 10.1093/biostatistics/kxj037. [DOI] [PubMed] [Google Scholar]
- Kavanagh B., O’Brien S., Lee D., Hou Y., Weinberg V., Rini B., Allison J.P., Small E.J., Fong L. CTLA4 blockade expands FoxP3+ regulatory and activated effector CD4+ T cells in a dose-dependent fashion. Blood. 2008;112:1175–1183. doi: 10.1182/blood-2007-11-125435. [DOI] [PMC free article] [PubMed] [Google Scholar]
- Kim K.H., Cho J., Ku B.M., Koh J., Sun J.M., Lee S.H., Ahn J.S., Cheon J., Min Y.J., Park S.H. The First-week Proliferative Response of Peripheral Blood PD-1+CD8+ T Cells Predicts the Response to Anti-PD-1 Therapy in Solid Tumors. Clin. Cancer Res. 2019;25:2144–2154. doi: 10.1158/1078-0432.CCR-18-1449. [DOI] [PubMed] [Google Scholar]
- Kitano S., Tsuji T., Liu C., Hirschhorn-Cymerman D., Kyi C., Mu Z., Allison J.P., Gnjatic S., Yuan J.D., Wolchok J.D. Enhancement of tumor-reactive cytotoxic CD4+ T cell responses after ipilimumab treatment in four advanced melanoma patients. Cancer Immunol. Res. 2013;1:235–244. doi: 10.1158/2326-6066.CIR-13-0068. [DOI] [PMC free article] [PubMed] [Google Scholar]
- Koshkin V.S., Grivas P. Emerging Role of Immunotherapy in Advanced Urothelial Carcinoma. Curr. Oncol. Rep. 2018;20:48. doi: 10.1007/s11912-018-0693-y. [DOI] [PubMed] [Google Scholar]
- Krensky A.M., Clayberger C. Biology and clinical relevance of granulysin. Tissue Antigens. 2009;73:193–198. doi: 10.1111/j.1399-0039.2008.01218.x. [DOI] [PMC free article] [PubMed] [Google Scholar]
- Kryczek I., Zhao E., Liu Y., Wang Y., Vatan L., Szeliga W., Moyer J., Klimczak A., Lange A., Zou W. Human TH17 cells are long-lived effector memory cells. Sci. Transl. Med. 2011;3:104ra100. doi: 10.1126/scitranslmed.3002949. [DOI] [PMC free article] [PubMed] [Google Scholar]
- Kurioka A., Walker L.J., Klenerman P., Willberg C.B. MAIT cells: new guardians of the liver. Clin. Transl. Immunology. 2016;5:e98. doi: 10.1038/cti.2016.51. [DOI] [PMC free article] [PubMed] [Google Scholar]
- Liakou C.I., Kamat A., Tang D.N., Chen H., Sun J., Troncoso P., Logothetis C., Sharma P. CTLA-4 blockade increases IFNgamma-producing CD4+ICOShi cells to shift the ratio of effector to regulatory T cells in cancer patients. Proc. Natl. Acad. Sci. USA. 2008;105:14987–14992. doi: 10.1073/pnas.0806075105. [DOI] [PMC free article] [PubMed] [Google Scholar]
- Löfroos A.B., Kadivar M., Resic Lindehammer S., Marsal J. Colorectal cancer-infiltrating T lymphocytes display a distinct chemokine receptor expression profile. Eur. J. Med. Res. 2017;22:40. doi: 10.1186/s40001-017-0283-8. [DOI] [PMC free article] [PubMed] [Google Scholar]
- Mariathasan S., Turley S.J., Nickles D., Castiglioni A., Yuen K., Wang Y., Kadel E.E., III, Koeppen H., Astarita J.L., Cubas R. TGFβ attenuates tumour response to PD-L1 blockade by contributing to exclusion of T cells. Nature. 2018;554:544–548. doi: 10.1038/nature25501. [DOI] [PMC free article] [PubMed] [Google Scholar]
- Martincorena I., Campbell P.J. Somatic mutation in cancer and normal cells. Science. 2015;349:1483–1489. doi: 10.1126/science.aab4082. [DOI] [PubMed] [Google Scholar]
- Mattoo H., Mahajan V.S., Maehara T., Deshpande V., Della-Torre E., Wallace Z.S., Kulikova M., Drijvers J.M., Daccache J., Carruthers M.N. Clonal expansion of CD4(+) cytotoxic T lymphocytes in patients with IgG4-related disease. J. Allergy Clin. Immunol. 2016;138:825–838. doi: 10.1016/j.jaci.2015.12.1330. [DOI] [PMC free article] [PubMed] [Google Scholar]
- McInnes L., Healy J. UMAP: Uniform Manifold Approximation and Projection for Dimension Reduction. arXiv. 2018 https://arxiv.org/abs/1802.03426 arXiv: 1802.03426. [Google Scholar]
- Medley Q.G., Kedersha N., O’Brien S., Tian Q., Schlossman S.F., Streuli M., Anderson P. Characterization of GMP-17, a granule membrane protein that moves to the plasma membrane of natural killer cells following target cell recognition. Proc. Natl. Acad. Sci. USA. 1996;93:685–689. doi: 10.1073/pnas.93.2.685. [DOI] [PMC free article] [PubMed] [Google Scholar]
- Monaco G., Lee B., Xu W., Mustafah S., Hwang Y.Y., Carré C., Burdin N., Visan L., Ceccarelli M., Poidinger M. RNA-Seq Signatures Normalized by mRNA Abundance Allow Absolute Deconvolution of Human Immune Cell Types. Cell Rep. 2019;26:1627–1640.e7. doi: 10.1016/j.celrep.2019.01.041. [DOI] [PMC free article] [PubMed] [Google Scholar]
- Oldham K.A., Parsonage G., Bhatt R.I., Wallace D.M., Deshmukh N., Chaudhri S., Adams D.H., Lee S.P. T lymphocyte recruitment into renal cell carcinoma tissue: a role for chemokine receptors CXCR3, CXCR6, CCR5, and CCR6. Eur. Urol. 2012;61:385–394. doi: 10.1016/j.eururo.2011.10.035. [DOI] [PubMed] [Google Scholar]
- Ott P.A., Hu Z., Keskin D.B., Shukla S.A., Sun J., Bozym D.J., Zhang W., Luoma A., Giobbie-Hurder A., Peter L. An immunogenic personal neoantigen vaccine for patients with melanoma. Nature. 2017;547:217–221. doi: 10.1038/nature22991. [DOI] [PMC free article] [PubMed] [Google Scholar]
- Parsonage G., Machado L.R., Hui J.W., McLarnon A., Schmaler T., Balasothy M., To K.F., Vlantis A.C., van Hasselt C.A., Lo K.W. CXCR6 and CCR5 localize T lymphocyte subsets in nasopharyngeal carcinoma. Am. J. Pathol. 2012;180:1215–1222. doi: 10.1016/j.ajpath.2011.11.032. [DOI] [PubMed] [Google Scholar]
- Patil V.S., Madrigal A., Schmiedel B.J., Clarke J., O’Rourke P., de Silva A.D., Harris E., Peters B., Seumois G., Weiskopf D. Precursors of human CD4+ cytotoxic T lymphocytes identified by single-cell transcriptome analysis. Sci. Immunol. 2018;3:eaan8664. doi: 10.1126/sciimmunol.aan8664. [DOI] [PMC free article] [PubMed] [Google Scholar]
- Philip M., Fairchild L., Sun L., Horste E.L., Camara S., Shakiba M., Scott A.C., Viale A., Lauer P., Merghoub T. Chromatin states define tumour-specific T cell dysfunction and reprogramming. Nature. 2017;545:452–456. doi: 10.1038/nature22367. [DOI] [PMC free article] [PubMed] [Google Scholar]
- Plitas G., Konopacki C., Wu K., Bos P.D., Morrow M., Putintseva E.V., Chudakov D.M., Rudensky A.Y. Regulatory T Cells Exhibit Distinct Features in Human Breast Cancer. Immunity. 2016;45:1122–1134. doi: 10.1016/j.immuni.2016.10.032. [DOI] [PMC free article] [PubMed] [Google Scholar]
- Powles T., Eder J.P., Fine G.D., Braiteh F.S., Loriot Y., Cruz C., Bellmunt J., Burris H.A., Petrylak D.P., Teng S.L. MPDL3280A (anti-PD-L1) treatment leads to clinical activity in metastatic bladder cancer. Nature. 2014;515:558–562. doi: 10.1038/nature13904. [DOI] [PubMed] [Google Scholar]
- Preston C.C., Maurer M.J., Oberg A.L., Visscher D.W., Kalli K.R., Hartmann L.C., Goode E.L., Knutson K.L. The ratios of CD8+ T cells to CD4+CD25+ FOXP3+ and FOXP3- T cells correlate with poor clinical outcome in human serous ovarian cancer. PLoS ONE. 2013;8:e80063. doi: 10.1371/journal.pone.0080063. [DOI] [PMC free article] [PubMed] [Google Scholar]
- Qiu X., Mao Q., Tang Y., Wang L., Chawla R., Pliner H.A., Trapnell C. Reversed graph embedding resolves complex single-cell trajectories. Nat. Methods. 2017;14:979–982. doi: 10.1038/nmeth.4402. [DOI] [PMC free article] [PubMed] [Google Scholar]
- Robert C., Long G.V., Brady B., Dutriaux C., Maio M., Mortier L., Hassel J.C., Rutkowski P., McNeil C., Kalinka-Warzocha E. Nivolumab in previously untreated melanoma without BRAF mutation. N. Engl. J. Med. 2015;372:320–330. doi: 10.1056/NEJMoa1412082. [DOI] [PubMed] [Google Scholar]
- Sahin U., Derhovanessian E., Miller M., Kloke B.P., Simon P., Löwer M., Bukur V., Tadmor A.D., Luxemburger U., Schrörs B. Personalized RNA mutanome vaccines mobilize poly-specific therapeutic immunity against cancer. Nature. 2017;547:222–226. doi: 10.1038/nature23003. [DOI] [PubMed] [Google Scholar]
- Sato E., Olson S.H., Ahn J., Bundy B., Nishikawa H., Qian F., Jungbluth A.A., Frosina D., Gnjatic S., Ambrosone C. Intraepithelial CD8+ tumor-infiltrating lymphocytes and a high CD8+/regulatory T cell ratio are associated with favorable prognosis in ovarian cancer. Proc. Natl. Acad. Sci. USA. 2005;102:18538–18543. doi: 10.1073/pnas.0509182102. [DOI] [PMC free article] [PubMed] [Google Scholar]
- Schmidt M., Weyer-Elberich V., Hengstler J.G., Heimes A.S., Almstedt K., Gerhold-Ay A., Lebrecht A., Battista M.J., Hasenburg A., Sahin U. Prognostic impact of CD4-positive T cell subsets in early breast cancer: a study based on the FinHer trial patient population. Breast Cancer Res. 2018;20:15. doi: 10.1186/s13058-018-0942-x. [DOI] [PMC free article] [PubMed] [Google Scholar]
- Sumida H., Cyster J.G. G-Protein Coupled Receptor 18 Contributes to Establishment of the CD8 Effector T Cell Compartment. Front. Immunol. 2018;9:660. doi: 10.3389/fimmu.2018.00660. [DOI] [PMC free article] [PubMed] [Google Scholar]
- Takada K., Kashiwagi S., Goto W., Asano Y., Takahashi K., Takashima T., Tomita S., Ohsawa M., Hirakawa K., Ohira M. Use of the tumor-infiltrating CD8 to FOXP3 lymphocyte ratio in predicting treatment responses to combination therapy with pertuzumab, trastuzumab, and docetaxel for advanced HER2-positive breast cancer. J. Transl. Med. 2018;16:86. doi: 10.1186/s12967-018-1460-4. [DOI] [PMC free article] [PubMed] [Google Scholar]
- Tirosh I., Izar B., Prakadan S.M., Wadsworth M.H., 2nd, Treacy D., Trombetta J.J., Rotem A., Rodman C., Lian C., Murphy G. Dissecting the multicellular ecosystem of metastatic melanoma by single-cell RNA-seq. Science. 2016;352:189–196. doi: 10.1126/science.aad0501. [DOI] [PMC free article] [PubMed] [Google Scholar]
- Traag V.A., Waltman L., van Eck N.J. From Louvain to Leiden: guaranteeing well-connected communities. Sci. Rep. 2019;9:5233. doi: 10.1038/s41598-019-41695-z. [DOI] [PMC free article] [PubMed] [Google Scholar]
- Tumeh P.C., Harview C.L., Yearley J.H., Shintaku I.P., Taylor E.J., Robert L., Chmielowski B., Spasic M., Henry G., Ciobanu V. PD-1 blockade induces responses by inhibiting adaptive immune resistance. Nature. 2014;515:568–571. doi: 10.1038/nature13954. [DOI] [PMC free article] [PubMed] [Google Scholar]
- Wang X., Sumida H., Cyster J.G. GPR18 is required for a normal CD8αα intestinal intraepithelial lymphocyte compartment. J. Exp. Med. 2014;211:2351–2359. doi: 10.1084/jem.20140646. [DOI] [PMC free article] [PubMed] [Google Scholar]
- Wang W., Green M., Choi J.E., Gijón M., Kennedy P.D., Johnson J.K., Liao P., Lang X., Kryczek I., Sell A. CD8+ T cells regulate tumour ferroptosis during cancer immunotherapy. Nature. 2019;569:270–274. doi: 10.1038/s41586-019-1170-y. [DOI] [PMC free article] [PubMed] [Google Scholar]
- Wei Y., Lin C., Li H., Xu Z., Wang J., Li R., Liu H., Zhang H., He H., Xu J. CXCL13 expression is prognostic and predictive for postoperative adjuvant chemotherapy benefit in patients with gastric cancer. Cancer Immunol. Immunother. 2018;67:261–269. doi: 10.1007/s00262-017-2083-y. [DOI] [PMC free article] [PubMed] [Google Scholar]
- Wolf F.A., Angerer P., Theis F.J. SCANPY: large-scale single-cell gene expression data analysis. Genome Biol. 2018;19:15. doi: 10.1186/s13059-017-1382-0. [DOI] [PMC free article] [PubMed] [Google Scholar]
- Yao C., Sun H.W., Lacey N.E., Ji Y., Moseman E.A., Shih H.Y., Heuston E.F., Kirby M., Anderson S., Cheng J. Single-cell RNA-seq reveals TOX as a key regulator of CD8+ T cell persistence in chronic infection. Nat. Immunol. 2019;20:890–901. doi: 10.1038/s41590-019-0403-4. [DOI] [PMC free article] [PubMed] [Google Scholar]
- Zemmour D., Zilionis R., Kiner E., Klein A.M., Mathis D., Benoist C. Single-cell gene expression reveals a landscape of regulatory T cell phenotypes shaped by the TCR. Nat. Immunol. 2018;19:291–301. doi: 10.1038/s41590-018-0051-0. [DOI] [PMC free article] [PubMed] [Google Scholar]
- Zhang L., Yu X., Zheng L., Zhang Y., Li Y., Fang Q., Gao R., Kang B., Zhang Q., Huang J.Y. Lineage tracking reveals dynamic relationships of T cells in colorectal cancer. Nature. 2018;564:268–272. doi: 10.1038/s41586-018-0694-x. [DOI] [PubMed] [Google Scholar]
- Zheng C., Zheng L., Yoo J.K., Guo H., Zhang Y., Guo X., Kang B., Hu R., Huang J.Y., Zhang Q. Landscape of Infiltrating T Cells in Liver Cancer Revealed by Single-Cell Sequencing. Cell. 2017;169:1342–1356.e16. doi: 10.1016/j.cell.2017.05.035. [DOI] [PubMed] [Google Scholar]
- Zheng G.X., Terry J.M., Belgrader P., Ryvkin P., Bent Z.W., Wilson R., Ziraldo S.B., Wheeler T.D., McDermott G.P., Zhu J. Massively parallel digital transcriptional profiling of single cells. Nat. Commun. 2017;8:14049. doi: 10.1038/ncomms14049. [DOI] [PMC free article] [PubMed] [Google Scholar]
Associated Data
This section collects any data citations, data availability statements, or supplementary materials included in this article.
Supplementary Materials
Healthy PBMC CD4+ and CD8+ control data are also included.
Cluster identifiers refer to the arbitrary clusters listed at the top of the heatmap in Figure 5E.
Data Availability Statement
Processed single-cell RNA sequencing and TCR sequencing data that support this study have been deposited in the NCBI GEO database under accession GSE149652. Raw sequencing data will be deposited in dbGaP. All software algorithms used for analysis are available for download from public repositories which are listed in the Key Resources Table.