

Abstract
Purpose:
We examined the capacity of the pan-fibroblast growth factor receptor (FGFR) inhibitor AZD4547 to augment radiation response across a panel of head and neck squamous cell carcinoma (HNSCC) cell lines and xenografts.
Experimental Design:
FGFR1, FGFR2, FGFR3 RNA in situ hybridization (ISH) expression was assessed in a cohort of HNSCC patient samples, cell lines and patient-derived xenografts (PDXs). In vitro effects of AZD4547 and radiation on cell survival, FGFR signaling, apoptosis, autophagy, cell cycle and DNA damage repair were evaluated. Reverse phase protein array (RPPA) was used to identify differentially phosphorylated proteins in cells treated with AZD4547. In vivo tumor responses were evaluated in cell line and PDX models.
Results:
FGFR1, FGFR2 and FGFR3 RNA ISH were expressed in 41%, 81% and 89%, of 107 oropharynx patient samples. Sensitivity to AZD4547 did not directly correlate with FGFR protein or RNA expression. In sensitive cell lines, AZD4547 inhibited p-MAPK in a time dependent manner. Significant radiosensitization with AZD4547 was observed in cell lines that were sensitive to AZD4547. The mechanism underlying these effects appear to be multifactorial involving inhibition of the MTOR pathway and subsequent enhancement of autophagy and activation of apoptotic pathways. Significant tumor growth delay was observed when AZD4547 was combined with radiation compared to radiation or drug alone in a FGFR-expressing HNSCC cell line xenograft and PDX.
Conclusions:
These findings suggest that AZD4547 can augment the response of radiation in FGFR-expressing HNSCC in vivo model systems. FGFR1 and FGFR2 may prove worthy targets for radiosensitization in HNSCC clinical investigations.
Keywords: FGFR, head and neck cancer, radiation, radiosensitization
Introduction
Treatment of locally advanced head and neck squamous cell carcinoma (HNSCC) typically involves a combined modality approach using surgery, radiation and chemotherapy. For patients with unresectable disease, radiation remains the central component of treatment. Whereas Human Papilloma Virus (HPV)-associated tumors demonstrate improved survival, the prognosis for HPV-negative tumors remains poor. Despite aggressive therapy, only 30-50% of these patients are alive 5-year after diagnosis.1 Treatment approaches that integrate molecularly targeted agents with radiation could improve the therapeutic index and outcomes.
Besides epidermal growth factor receptor (EGFR)-directed therapy, there has been only modest success in translating molecular targeted therapy in the treatment of HSNCC. Recent large-scale genomic profiling studies have identified the fibroblast growth family receptors (FGFR) as potential therapeutic targets in HNSCC.2,3 The FGFR family consists of four transmembrane receptor tyrosine kinases, FGFR1, FGFR2, FGFR3, and FGFR4, which are activated by 18 different fibroblast growth factors (FGF) ligands.4 Stimulation of these FGFRs activate cell signaling pathways, which are important in regulating cell survival, proliferation, migration and differentiation.4 Studies have shown that FGFR1 and FGFR2 are both overexpressed in HPV-positive and HPV-negative tumors5, and FGFR1 is amplified in 15–17% of HPV-negative tumors.6,7 One study examining 951 HNSCC patient tumor samples found 73% of oral cavity tumors and 85% of oropharyngeal tumors to highly co-express two or more FGFR family member proteins.5 Additional studies have also correlated FGFR1 protein overexpression with poor prognosis in HPV-negative HNSCC.8
FGFRs activate multiple pathways involved in the cellular response to radiation including RAS/RAF/MAPK, PI3K/AKT and STAT. A recent proteomic and transcriptomic analysis of HPV-negative HNSCC cell lines found several targets, including FGFR1 to be associated with radioresistance.9 Various FGFR inhibitors have shown anti-tumor activity in FGFR expressing HNSCC cell lines.8,10,11 In this study, we demonstrate the ability of AZD4547, a potent tyrosine kinase inhibitor of FGFR1, FGFR2 and FGFR312, to enhance the effect of radiation in HSNCC preclinical models including a patient-derived xenograft (PDX). AZD4547 is being investigated in multiple clinical trials and combination with radiotherapy may be beneficial for patients whose tumors express FGFR.
Materials and Methods
RNA In Situ Hybridization
FGFR1, FGFR2, FGFR3 RNA in situ hybridization (ISH) expression was assessed in 107 patient samples from the XX Head and Neck SPORE oropharynx tissue microarray and in a panel of 22 HNSCC PDX13 samples using the RNAscope assay (Advanced Cell Diagnostics Inc., Hayward, CA).
Cell lines and culture
HNSCC cell lines (HPV-positive: UD-SCC-2, UM-SCC-47, UPCI-SCC-90, 93-VU-147T and HPV-negative: UM-SCC-6, SCC-9, UM-SCC22B, MDA-1483, CCL-30, TU-138) were obtained from the UW Head and Neck SPORE cell line repository and cultured at low passage in standard conditions. The identity of all cell lines was confirmed via short tandem repeat testing as listed in Supplemental Table 1.
Immunoblot analysis
Western blotting was performed as described in supplement and imaged using the Odyssey system (LI-COR).
Quantitative real time-polymerase chain reaction (qRT-PCR)
RNA was extracted using Allprep DNA/RNA Mini Kit (Qiagen, Valencia, CA) and measured by Nanodrop. Relative mRNA levels were quantified by RT-qPCR (Bio-Rad, S1000 Thermal cycler) and normalized to human tonsil epithelial cells (HTE).
Proliferation assay
Cells were treated with indicated doses of AZD4547 and proliferation was measured with Cell Counting Kit-8 (CCK8).
Irradiation
Cells were irradiated with an Xstrahl X-ray System, Model RS225 (Xstrahl, UK) and animals were irradiated with an X-RAD320 (Precision X-Ray, North Branford, CT).
Clonogenic Survival Assay
Cells were seeded into 6-well plates at specific densities, incubated overnight, and treated with radiation after 1 hour of AZD4547 treatment. Colonies were fixed and stained by crystal violet in methanol.
Apoptotic cell death
Cells were stained with FITC Annexin V and propidium iodide Annexin V (BD Biosciences #556547) and positive cells were quantified.
Autophagy
Cells were stained using acridine orange (Sigma-Aldrich #318337) and staining was detected with the Countess II FL Automated Cell Counter utilizing GFP and RFP EVOS Light Cubes.
γH2AX immunofluorescence
Cells were permeabilized with 0.1% Triton-X 100, blocked with goat serum, and incubated with anti-phospho-H2AX primary antibody. Cells were probed with Alexa Fluor 555 conjugated secondary antibody (CST #4413). A Nikon A1RS confocal microscope was used.
Cell cycle
Cells were treated with RNAse A and incubated with propidium iodide. Samples were run on an Attune NxT flow cytometer (Thermo Scientific), and the cell cycle distribution was calculated using ModFIT software (Verity Software House, Top-sham, ME).
Reverse-phase protein array
TU-138 and UM-SCC-6 cells were treated with DMSO or 0.1 μM for 24 hours and samples were processed at the Functional Proteomics Core Facility at MD Anderson for reverse-phase protein array (RPPA) analysis as described in the supplement. The R package limma was used to determine the differentially expressed proteins.14 Gene Set Enrichment Analysis (GSEA)15 was performed using the Molecule Signatures Database v6.2 (MSigDB) on the RPPA data by mapping the gene symbols to the RPPA probe identifiers and discarding those genes with no corresponding probe (custom perl scripts)16.
Cell line xenograft and PDX growth delay studies
TU-138 cell lines and UW-SCC-36 PDX17, established from a HPV-positive oropharynx human tumor, were injected subcutaneously into flanks of nude mice. Tumor volumes were measured twice weekly. Eight to 10 mice (16-20 tumors) were used per treatment group.
Statistical analyses and full detailed materials and methods are described in the supplement.
Results
FGFR RNA expression in HNSCC patient samples
FGFR1, FGFR2 and FGFR3 RNA ISH was expressed in 41.1%, 81.3% and 88.8%, of the 107-oropharynx patients. High FGFR1, FGFR2 and FGFR3 RNA ISH expression was seen in 5.6%, 24.3% and 43.9% of patients. Supplemental Tables 3, 4 and 5 list patient characteristics by FGFR1, FGFR2 and FGFR3 RNA expression. No patient factors were associated with FGFR1 RNA expression. FGFR2 RNA expression was more prevalent in the p16-negative patients while FGFR3 RNA expression was more prevalent in the p16-positive patients. FGFR1, FGFR2 and FGFR3 expression was not found to be predictive of OS or DFS (Supplemental Table 6).
FGFR expression and sensitivity to AZD4547 in HNSCC cell lines
FGFR1, FGFR2 and FGFR3 protein and mRNA were expressed to varying degrees under cell culture conditions in our panel of 10 HNSCC cell lines (Fig. 2A and 2B). FGFR1 and FGFR2 copy number analysis identified 2 copies in most cell lines (Supplemental Fig. 1). Viability assays performed on HNSCC cell lines after 72-hour exposure to increasing concentrations of AZD4547 indicated variable responses to AZD4547 that did not correspond to FGFR1, FGFR2 or FGFR3 expression (Fig. 2C).
Figure 2.
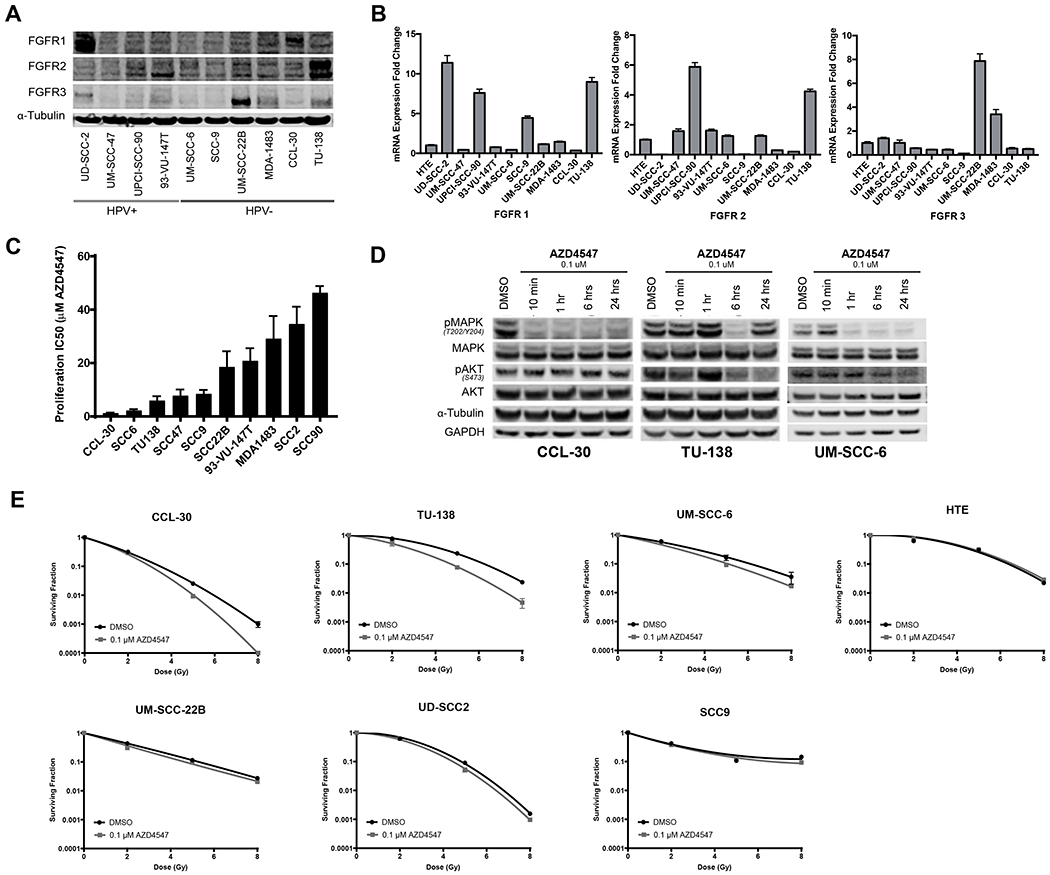
FGFR expression, response to AZD4547 and radiosensitivity effects of AZD4547 in HNSCC cell lines. (A), FGFR1, FGFR2 and FGFR3 protein levels and (B), mRNA expression in 10 HNSCC cell lines. (C), Sensitivity of HNSCC cell lines to AZD4547 determined by proliferation assay. (D), Western blot downstream signaling analysis of AZD4547-treated HNSCC cell lines. CCL-30, TU-138 and UM-SCC-6 cells were treated for 10 minutes, 1 hour, 6 hours and 24 hours with 0.1 μM AZD4547. (E), In vitro radiosensitiziting effects of AZD4547 on HNSCC cell lines. Cell cultures were exposed to 0.1 μM of AZD4547 for 1 hour before irradiation and maintained in the medium after irradiation. Colony-forming efficiency was determined 14 to 21 day later and survival curves were generated after normalizing for cytotoxicity induced by AZD4547 alone. Columns, mean; Points, mean; Bars, standard error of the mean (SEM) (n=3).
To assess the effect of AZD4547 on FGFR-associated signaling transduction, we measured phospho-MAPK (Thr202/Tyr204) and phospho-AKT (S473) protein levels in drug-responsive cell lines. AZD4547 strongly inhibited phospho-MAPK activation in all lines within six hours of exposure to 0.1 μM; however, the timeline of this response was variable (Fig. 2D). TU-138 and to a lesser degree UM-SCC-6 both exhibited decreased phospho-AKT activation, while CCL-30 cells did not. Two AZD4547 non-responding cell lines, UD-SCC-2 and MDA-1483, showed either no inhibition or no sustained inhibition of phospho-MAPK and no inhibition of phospho-AKT (Supplemental Figure 2).
FGFR inhibition with AZD4547 enhances radiosensitivity of HNSCC cell lines
Clonogenic survival assays were performed to assess the radiosensitizing effects of AZD4547 on six HNSCC cell lines and one human tonsillar epithelial cell line (Fig. 2E). Cells were exposed to 0.1 μM AZD4547 for 1 hour prior to irradiation and drug treatment continued 23 hours thereafter. AZD4547 significantly enhanced the effect of radiation in three cell lines, TU-138, CCL-30 and UM-SCC-6 (Fig.2E). The dose enhancement factor at a surviving fraction of 10% for these cell lines were 1.32 for TU-139, 1.15 for CCL-30, and 1.20 for UM-SCC-6.
Mechanism of AZD4547 radiation-induced death in HNSCC cell lines
To understand the mechanism by which AZD4547 exerts its in vitro radiosensitization effect, cellular Annexin V apoptosis, acridine orange autophagy, γH2AX immunofluorescence and flow cytometric cell-cycle analysis were conducted on TU-138, CCL-30 and UM-SCC-6 cell lines (Fig. 3). AZD4547 alone increased apoptosis in TU-138 treated cells (p=0.02) but not in CCL-30 and UM-SCC-6 cells (Fig. 3A). When AZD4547 (0.1 μM) was combined with radiation (3 Gy) a significant increase in apoptosis was only seen in UM-SCC-6 cells compared to radiation alone (p=0.01, Fig. 3A). Autophagy was increased with combined AZD4547 (0.1 μM) and radiation (3 Gy) treatment compared to AZD4547 or radiation alone in all three cell lines (TU-138, p=0.001; CCL-30, p=0.02; and UM-SCC-6, p=0.02, Fig. 3B). To determine whether AZD4547 inhibited DNA damage repair γH2AX foci were assessed after exposure to AZD4547 (0.1 μM) and radiation (3 Gy). The addition of AZD4547 to radiation did not prolong expression of γH2AX in TU-138 and CCL-30 at any time point (Fig. 3C). In UM-SCC-6 there was a significant prolonged expression γH2AX at 12 hours (p=0.04, Fig. 3C). Because redistribution of cells in the cell cycle can affect radiosensitivity, flow cytometry was used to determine cell cycle phase distribution 24 hours after exposure to 0.1 μM AZD4547, radiation (3 Gy or 8 Gy), or both AZD4547 and radiation. Cells treated with AZD4547 alone exhibited only minor cell cycle phase distribution (Fig. 3D). There was also no difference in the cell cycle distribution of irradiated cells treated with or without AZD4547 (Fig. 3D). These results indicate that redistribution of cells into a radiosensitive phase of the cell cycle by AZD4547 does not account for the radiation-induced cell killing observed in Fig. 2E.
Figure 3.
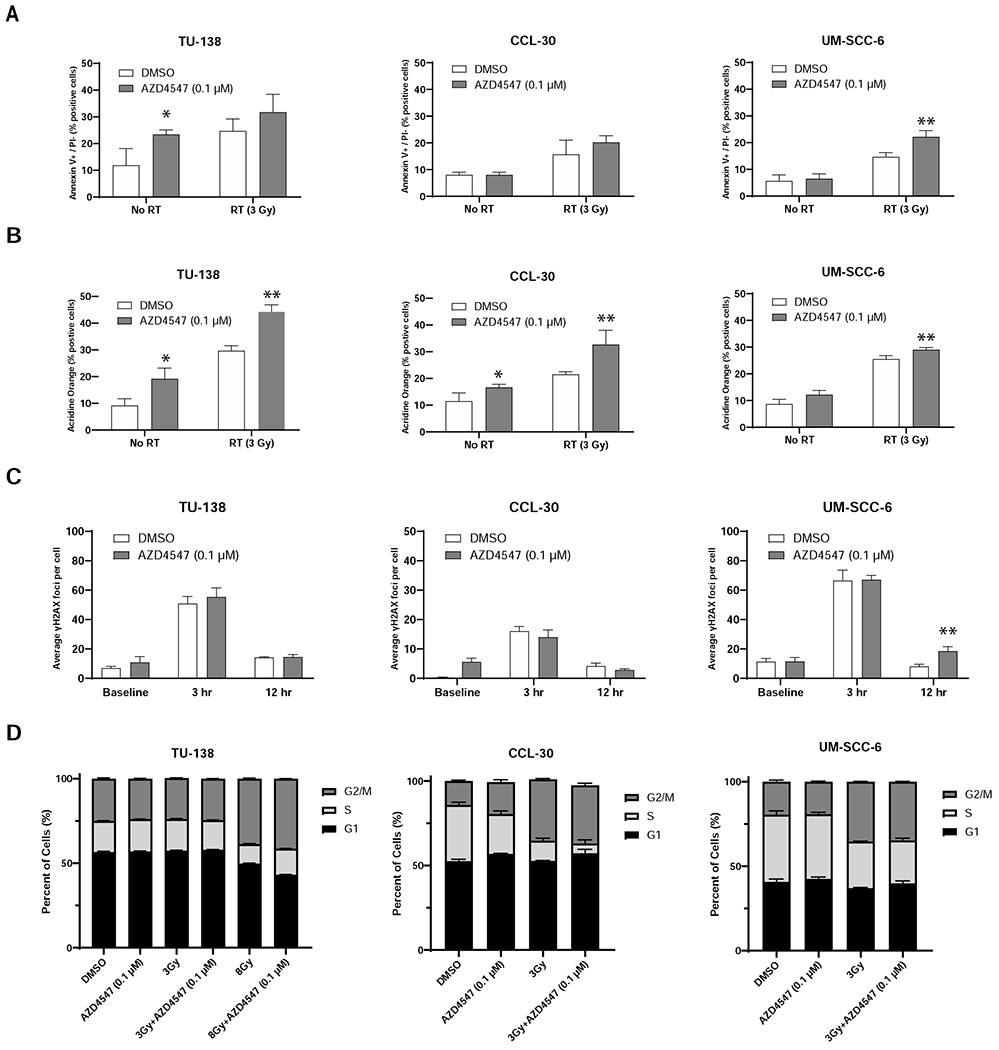
Mechanism of cell death after combined radiation and AZD4547 treatment in TU-138, CCL-30 and UM-SCC-6 cell lines. Cells were treated with DMSO, AZD4547 (0.1 μM), radiation (3 Gy) or combined AZD4547 (0.1 μM) and radiation (3 Gy) and analyzed at designated time points. (A) Annexin V apoptosis, (B) acridine orange autophagy, (C) γH2AX Assay foci, and (D) flow cytometric cell cycle, results are shown. Columns, mean; bars, SEM (n=3). *, P < 0.01, according to Student’s t test (DMSO versus AZD4547). **, P < 0.01, according to Student’s t test (irradiation versus AZD4547 plus irradiation).
RPPA demonstrates inhibition of mTOR signaling with AZD4547 in HNSCC cell lines
To identify differentially expressed proteins in response to AZD4547 treatment, we performed RPPA analysis in cells treated with AZD4547 (0.1 μM) for 24 hours and compared them to control cells treated with DMSO. We focused on two cell lines, TU-138 and UM-SCC-6, which demonstrated radiosensitization with AZD4547. Using FDR <0.05, we identified 57 proteins differentially expressed between AZD4547 treated and non-treated TU-138 cells and 15 proteins were differentially expressed in the UM-SCC-6 treated and non-treated cells (Fig. 4A–C).
Figure 4.
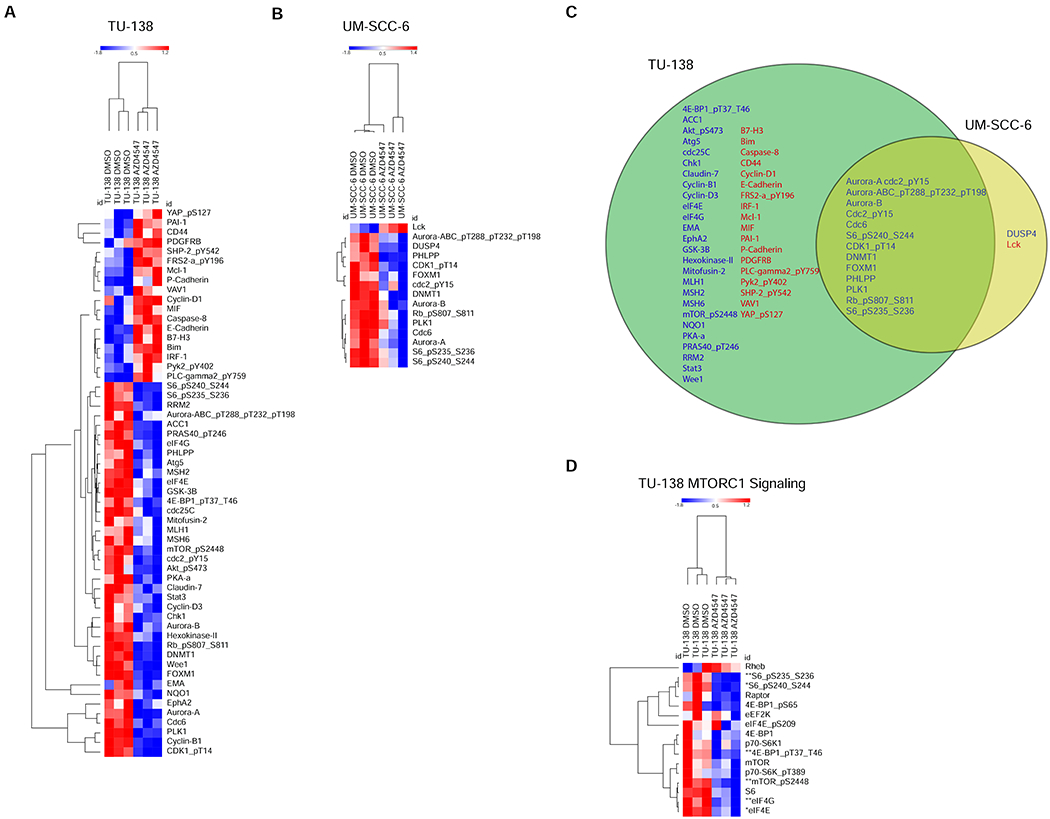
Reverse Phase Protein Array (RPPA) reveals inhibition of mTOR signaling in AZD4547 sensitive cell lines. (A), Heatmaps show RPPA proteins that were differentially expressed between AZD4547-treated and non-treated controls (q < 0.05) TU-138 and UM-SCC-6 cell lines. (B), Venn diagram shows overlap of differentially expressed proteins, upregulated (red) and downregulated (blue), in TU-138 and UM-SCC-6 AZD4547-treated cells. C, Representative heatmap showing inhibition of the MTORC1 reactome signaling pathway in TU-138 cells treated with AZD4547. *, q < 0.05; **, q < 0.01.
When comparing TU-138 treated cells to UM-SCC-6 treated cells, 13 proteins were differentially expressed in both cell lines (Fig. 4C). GSEA found MTOR and MTORC1 signaling and apoptosis pathways to be altered by AZD4547 treatment in TU-138 cells (Table 1A) and MTORC1 and cell cycle pathways to be altered in UM-SCC-6 cells (Table 1B). Fig. 4D shows the heatmap for differentially expressed proteins for TU-138 in the MTORC1 reactome signaling pathway.
Table 1A.
Gene Set Enrichment Analysis Pathways altered in TU-138 cells treated with AZD4546 versus control
| Gene Set | Protein Count | qValue | Regulation of Pathway |
|---|---|---|---|
| KEGG_MTOR_SIGNALING_PATHWAY | 40 | 0.0049 | down |
| HALLMARK_INTERFERON_GAMMA_RESPONSE | 21 | 0.0055 | up |
| HALLMARK_COAGULATION | 11 | 0.0055 | up |
| REACTOME_PKB_MEDIATED_EVENTS | 27 | 0.0085 | down |
| REACTOME_MTORC1_MEDIATED_SIGNALLING | 16 | 0.01 | down |
| HALLMARK_COMPLEMENT | 25 | 0.012 | up |
| KEGG_INSULIN_SIGNALING_PATHWAY | 65 | 0.016 | down |
| REACTOME_CELL_SURFACE_INTERACTIONS_AT_THE_VASCULAR_WALL | 16 | 0.024 | up |
| REACTOME_APOPTOTIC_EXECUTION_PHASE | 13 | 0.029 | up |
| REACTOME_APOPTOTIC_CLEAVAGE_OF_CELLULAR_PROTEINS | 12 | 0.034 | up |
| HALLMARK_TNFA_SIGNALING_VIA_NFKB | 22 | 0.038 | up |
| HALLMARK_MTORC1_SIGNALING | 30 | 0.039 | down |
| HALLMARK_MYC_TARGETS_V1 | 18 | 0.044 | down |
| HALLMARK_EPITHELIAL_MESENCHYMAL_TRANSITION | 19 | 0.046 | up |
| HALLMARK_APOPTOSIS | 47 | 0.048 | up |
Table 1B.
Gene Set Enrichment Analysis Pathways altered in UM-SCC-6 cells treated with AZD4546 versus control
| Gene Set | Protein Count | qValue | Regulation of Pathway |
|---|---|---|---|
| REACTOME_CELL_CYCLE_MITOTIC | 30 | <0.0001 | down |
| REACTOME_CELL_CYCLE | 43 | <0.0001 | down |
| REACTOME_MITOTIC_G1_G1_S_PHASES | 23 | <0.0001 | down |
| HALLMARK_G2M_CHECKPOINT | 30 | 0.0041 | down |
| HALLMARK_MTORC1_SIGNALING | 30 | 0.0042 | down |
| HALLMARK_E2F_TARGETS | 36 | 0.0051 | down |
| KEGG_CELL_CYCLE | 41 | 0.0070 | down |
| REACTOME_DNA_REPLICATION | 16 | 0.012 | down |
| REACTOME_G2_M_CHECKPOINTS | 16 | 0.012 | down |
| REACTOME_G1_S_TRANSITION | 20 | 0.012 | down |
| REACTOME_CELL_CYCLE_CHECKPOINTS | 23 | 0.036 | down |
| REACTOME_E2F_MEDIATED_REGULATION_OF_DNA_REPLICATION | 10 | 0.037 | down |
| REACTOME_G2_M_DNA_DAMAGE_CHECKPOINT | 13 | 0.038 | down |
| REACTOME_S_PHASE | 17 | 0.047 | down |
AZD4547 delays growth and enhances radiation response in HNSCC tumor xenografts
A panel of 22 HNSCC PDXs13 were screened for FGFR1, FGFR2 and FGFR3 RNA expression by ISH. Four samples revealed elevated FGFR1 or FGFR2 expression (Fig. 5A) and no FGFR3 expression (not shown). Immunoblot analysis confirmed the ISH findings (Fig. 5B). Copy number assay revealed FGFR1 and FGFR2 amplification in both UW-SCC-14 and UW-SCC-36. (Fig. 5C). Experiments involving UW-SCC-36 were used to determine the capacity of AZD4547 monotherapy to slow the growth of HNSCC in vivo and to guide dose selections for radiosensitization studies. AZD4547 significantly inhibited growth of UW-SCC-36 tumors (p<0.01, Fig. 5D) compared to controls.
Figure 5.
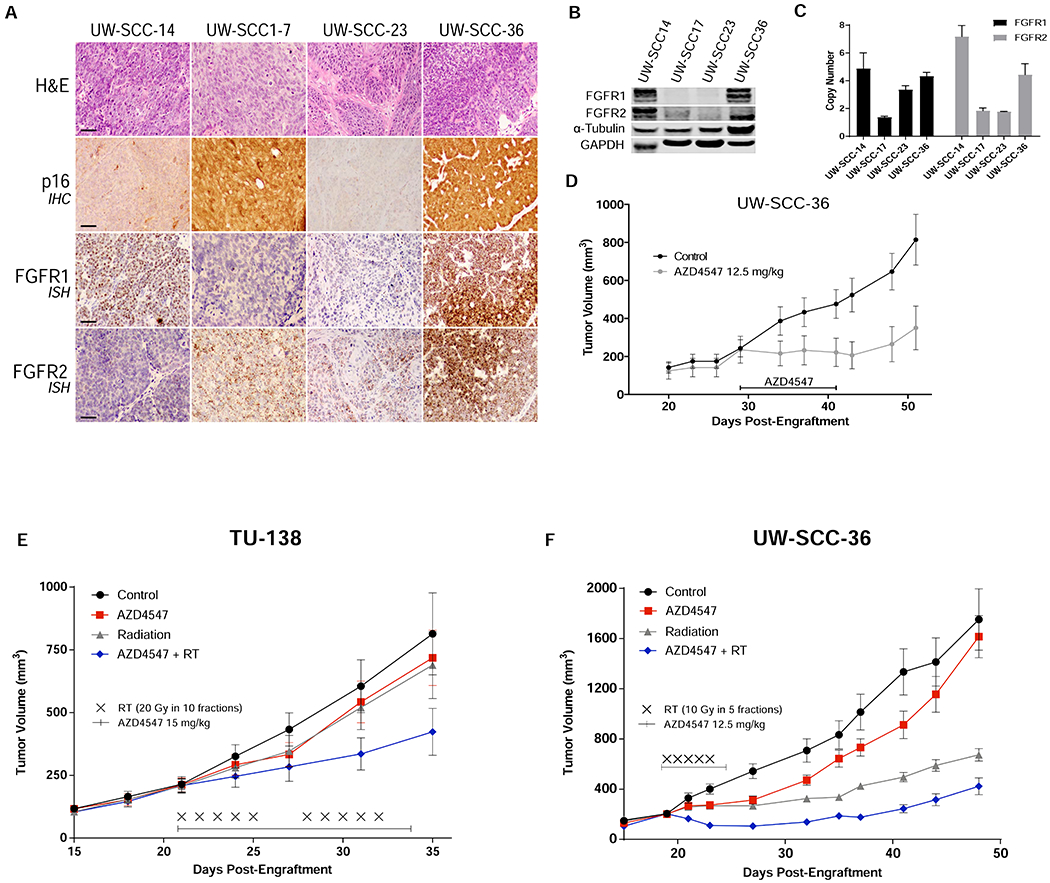
In vivo assessment of AZD4547. (A), Representative sections demonstrating tumor on H&E, p16 expression by IHC, and FGFR1 and FGFR2 expression by ISH of 4 HSNCC PDXs. (B), FGFR1 and FGFR2 protein levels by western blot and (C) DNA copy number results. (D), AZD4547 (12.5 mg/kg) administered by oral gavage once daily for 14 days in HPV+ HNSCC PDX (UW-SCC-36). Tumor growth delay curves of (E) TU-138 xenografts and (F) UW-SCC-36 PDX treated with vehicle, AZD4547 (15 mg/kg or 12.5 mg/kg), radiation (2 Gy x 10 or 2 Gy x 5) or AZD4547 (15 mg/kg or 12.5 mg/kg) plus irradiation (2 Gy x 10 or 2 Gy x 5). AZD4547 delivered as p.o. gavage at 1 hour before irradiation. Points, mean tumor volume in mice after treatment; bars, SEM.
In vivo radiosensitization by AZD4547 was assessed in TU-138 cell line xenografts and UW-SCC-36 PDXs. For both experiments, mice bearing tumors were randomized into four groups: control, AZD4547 (12 mg/kg or 15 mg/kg) daily for 7 or 14 days, irradiation (10 or 20 Gy in 2 Gy daily fractions), and AZD4547 (12 mg/kg or 15 mg/kg) given 1 hour before daily irradiation (10 or 20 Gy in 2 Gy daily fractions). The combination of AZD4547 and radiation delayed growth in both TU-138 and UW-SCC-36 tumors compared to control and single-modality treatments (p<0.01, Fig. 5E and F).
Discussion
The FGFR family plays an important role in the pathogenesis of HNSCC. FGFR1 and FGFR2 are both overexpressed in HPV-positive and HPV-negative HNSCC tumors; and FGFR1 amplification is seen in 15-17% of HPV-negative tumors.2,3 Aberrant FGFR1 and FGFR2 signaling drives tumorigenesis and confers resistance to anticancer therapies and thus are promising therapeutic targets. Preclinical work from multiple groups have demonstrated the efficacy of various FGFR inhibitors (PD173074, BGJ398, RO4383596, AZ8010 and AZD4547) in HNSCC cell lines.8,10,18–20. Our study focused on the role of FGFR inhibition in combination with radiation. We have shown that combining AZD4547, an FGFR1, 2 and 3 receptor tyrosine kinase inhibitor, with radiation results in in vitro radiosensitization and enhanced tumor growth delay in our FGFR expressing cell line xenograft and PDX models. The mechanisms underlying these effects appear to involve attenuation of the mTOR pathway and induction of autophagy. Cell lines not responsive to FGFR inhibition by AZD4547 did not demonstrate radiosensitization. In addition, radiosensitization was not seen in an immortalized human tonsillar epithelial line indicating AZD4547 may have limited radiosensitizing effects on normal tissues.
There is now mounting evidence supporting a role of the FGF/FGFR signaling axis in regulating the cellular response to radiation.21–25 Besides being involved in the pathogenesis of several malignant tumors, there is data to suggest that FGF ligands regulate cellular response to ionizing radiation and protects endothelial cells against radiation-induced apoptosis.26,27 Others have also shown FGF2 to mitigate the effects of radiation on gastrointestinal crypt cells and hematopoietic tissues through reduction in apoptosis, stem cell renewal, progenitor cell differentiation, and epithelial proliferation28,29 Two studies have also demonstrated radiosensitization with FGFR inhibition in human glioblastoma cells21,30.
In HNSCC, two transcriptome studies have identified FGFR signaling pathway as targets for radiosensitization. Ishigami et al. compared gene expression profiles of two HNSCC cell lines (HSC2 and HSC3) treated with radiation and identified six genes (ID1, ID3, FGFR3, PEG10, ICAM2 and MMP13) associated with radioresistant cells compared with radiosensitive cells.23 They then showed that inhibition of FGFR3 with either mRNA interference or small-molecule FGFR inhibitor leads to in vitro radiosensitization in one (HSC2) cell line.24 Skinner et al. performed a proteomic and transcriptomic analysis of targetable biomarkers of radioresistance in 47 HPV-negative HNSCC cell lines.9 They discovered increased expression of several targets including FGFR1, ERK1, EGFR and PTK2/FAK to be associated with radioresistance.9
We elected to investigate the combination of AZD4547 with radiation in this study as it is currently under clinical investigation in a variety of cancers where FGFRs are frequently amplified, overexpressed or harbor gene fusions.31–34 To date no clinical trials have studied AZD4547 in head and neck cancers. The clinical studies that have been completed with AZD4547 report it to be safe and well tolerated and to demonstrate modest anti-tumor effects.31,32,34 In these studies, FGFR amplification did not always correlate with FGFR gene and protein expression or with response to AZD4547.31,32,34 In some patients, response to AZD4547 was associated with high-level FGFR copy-number amplification and not low-level copy number.35 Others have indicated that response to AZD4547 may depend more on FGFR protein or RNA expression than on amplification.36 This raises the question of what is the most appropriate biomarker to select patients for FGFR-directed therapy.
In our study, we found high levels of FGFR1, FGFR2 and FGFR3 RNA ISH expression in our oropharynx patient cohort, but expression of these receptors did not predict for disease outcome. In our in vitro analysis, we found protein and RNA expression did not directly correlate with AZD4547 sensitivity or radiosensitization. The reason for the limited efficacy of AZD4547 in some patients and cell lines may be a result of intra- and inter-tumor heterogeneity of FGFR protein and gene expression along with activation of alternative pathways.31,32 Common HNSCC signaling pathways such as EGFR and downstream mTOR may function as resistance mechanisms of FGFR inhibition.8,10,37 For example, Singleton et al. showed that AZD4547 resistance is driven through activation of the mTOR pathway, and combining AZD4547 with an mTOR inhibitor significantly attenuated tumor growth in their HSNCC models.38 Pearson et al. demonstrated similar findings and concluded that high-level FGFR-amplified cell lines have a distinct oncogene addiction phenotype that is characterized by PI3K and mTOR signaling mediated by FGFR.35 They also report that lower-level FGFR-amplified cell lines do not display this phenotype and are not sensitive to FGFR inhibition. In addition, they found that mTOR inhibitors can synergize with FGFR inhibition in these insensitive cell lines.35 Our data also supports the role of FGFRs in the regulation of mTOR and mTORC1 signaling and demonstrates that AZD4547 can inhibit those pathways. It is well known that mTOR is a key regulator of autophagy39 and our data also suggest that the mechanism of AZD4547-induced radiosensitization may be mediated by inhibition of mTOR signaling leading to an increase in radiation-induced autophagy. The role of autophagy as a mechanism of radiosensitization is complex40 and further work will be needed to define its role in FGFR-induced radiosensitization.
Limitations of this work include the use of PDX models that do not account for the immune microenvironment. Combining FGFR inhibition with anti-PD-1 has been shown to lead to expansion of T-cell clones and immunological changes in the tumor microenvironment to support enhanced antitumor immunity.41 Anti-PD-1 immunotherapy is now approved for the treatment of advanced HNSCC and is currently being investigated in combination with radiation. Further testing with FGFR inhibition, ant-PD-1 and radiation is therefore warranted.
In summary, we have demonstrated radiation enhancement by combining the selective FGFR inhibitor AZD4547 with clinically meaningful doses of radiotherapy in a HNSCC preclinical model. This combination holds translational implications given the well-established use of radiotherapy in the treatment of HSNCC. These data provide a rationale for further investigation of combining radiotherapy with molecular agents that inhibit the FGFRs.
Supplementary Material
Figure 1.
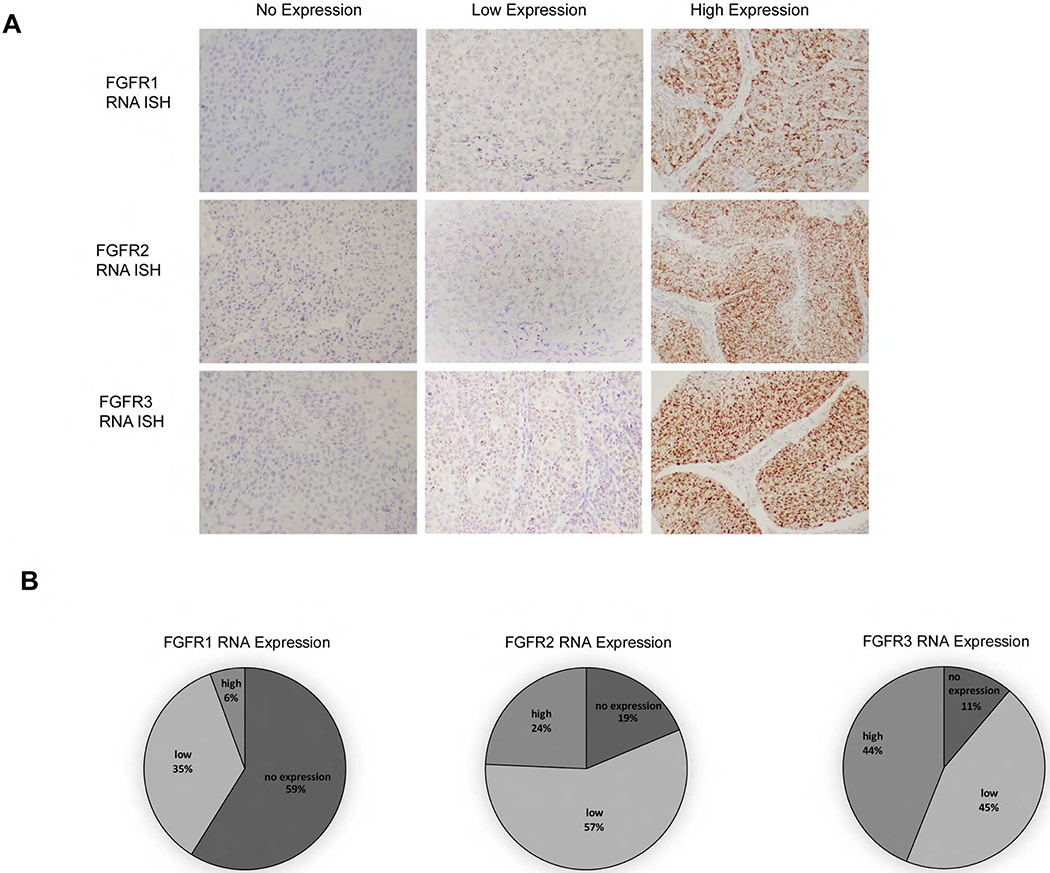
FGFR1, FGFR2 and FGFR3 RNA in situ hybridization (ISH) expression in patient oropharynx tumors. (A), Representative images (20x) of cytoplasmic RNA expression as defined by ISH assay as no expression (score 0), low expression (score 1-2+) and high expression (score 3-4+). (B), Percentages of FGFR1, FGFR2 and FGFR3 RNA ISH expression in oropharynx tumors.
Acknowledgments
Funding: This project was supported in part by grants from the American Cancer Society grant RSG-16-091-01-TBG, the University of Wisconsin Carbone Cancer Center Support Grant P30 CA014520 and the Specialized Program of Research Excellence (SPORE) program, through the NIH National Institute for Dental and Craniofacial Research (NIDCR) and National Cancer Institute (NCI), grant P50DE026787. The content is solely the responsibility of the authors and does not necessarily represent the official views of the NIH.
Footnotes
Publisher's Disclaimer: This is a PDF file of an unedited manuscript that has been accepted for publication. As a service to our customers we are providing this early version of the manuscript. The manuscript will undergo copyediting, typesetting, and review of the resulting proof before it is published in its final form. Please note that during the production process errors may be discovered which could affect the content, and all legal disclaimers that apply to the journal pertain.
Disclosures: None
References
- 1.Pignon JP, le Maitre A, Maillard E, et al. : Meta-analysis of chemotherapy in head and neck cancer (MACH-NC): an update on 93 randomised trials and 17,346 patients. Radiother Oncol 92:4–14, 2009 [DOI] [PubMed] [Google Scholar]
- 2.Cancer Genome Atlas N: Comprehensive genomic characterization of head and neck squamous cell carcinomas. Nature 517:576–82, 2015 [DOI] [PMC free article] [PubMed] [Google Scholar]
- 3.Seiwert TY, Zuo Z, Keck MK, et al. Integrative and comparative genomic analysis of HPV-positive and HPV-negative head and neck squamous cell carcinomas. Clin Cancer Res 21:632–41, 2015 [DOI] [PMC free article] [PubMed] [Google Scholar]
- 4.Turner N, Grose R: Fibroblast growth factor signalling: from development to cancer. Nat Rev Cancer 10:116–29, 2010 [DOI] [PubMed] [Google Scholar]
- 5.Koole K, Clausen MJ, van Es RJ, et al. : FGFR Family Members Protein Expression as Prognostic Markers in Oral Cavity and Oropharyngeal Squamous Cell Carcinoma. Mol Diagn Ther 20:363–74, 2016 [DOI] [PMC free article] [PubMed] [Google Scholar]
- 6.Goke F, Bode M, Franzen A, et al. : Fibroblast growth factor receptor 1 amplification is a common event in squamous cell carcinoma of the head and neck. Mod Pathol 26:1298–306, 2013 [DOI] [PubMed] [Google Scholar]
- 7.Freier K, Schwaenen C, Sticht C, et al. : Recurrent FGFR1 amplification and high FGFR1 protein expression in oral squamous cell carcinoma (OSCC). Oral Oncol 43:60–6, 2007 [DOI] [PubMed] [Google Scholar]
- 8.Koole K, Brunen D, van Kempen PM, et al. : FGFR1 Is a Potential Prognostic Biomarker and Therapeutic Target in Head and Neck Squamous Cell Carcinoma. Clin Cancer Res 22:3884–93, 2016 [DOI] [PubMed] [Google Scholar]
- 9.Skinner HD, Giri U, Yang L, et al. : Proteomic Profiling Identifies PTK2/FAK as a Driver of Radioresistance in HPV-negative Head and Neck Cancer. Clin Cancer Res 22:4643–50, 2016 [DOI] [PMC free article] [PubMed] [Google Scholar]
- 10.Marshall ME, Hinz TK, Kono SA, et al. : Fibroblast growth factor receptors are components of autocrine signaling networks in head and neck squamous cell carcinoma cells. Clin Cancer Res 17:5016–25, 2011 [DOI] [PMC free article] [PubMed] [Google Scholar]
- 11.Sweeny L, Zimmermann TM, Liu Z, et al. : Evaluation of tyrosine receptor kinases in the interactions of head and neck squamous cell carcinoma cells and fibroblasts. Oral Oncol 48:1242–9, 2012 [DOI] [PMC free article] [PubMed] [Google Scholar]
- 12.Gavine PR, Mooney L, Kilgour E, et al. : AZD4547: an orally bioavailable, potent, and selective inhibitor of the fibroblast growth factor receptor tyrosine kinase family. Cancer Res 72:2045–56, 2012 [DOI] [PubMed] [Google Scholar]
- 13.Kimple RJ, Harari PM, Torres AD, et al. : Development and characterization of HPVpositive and HPV-negative head and neck squamous cell carcinoma tumorgrafts. Clin Cancer Res 19:855–64, 2013 [DOI] [PMC free article] [PubMed] [Google Scholar]
- 14.Ritchie ME, Phipson B, Wu D, et al. : limma powers differential expression analyses for RNA-sequencing and microarray studies. Nucleic Acids Res 43:e47, 2015 [DOI] [PMC free article] [PubMed] [Google Scholar]
- 15.Subramanian A, Tamayo P, Mootha VK, et al. : Gene set enrichment analysis: a knowledge-based approach for interpreting genome-wide expression profiles. Proc Natl Acad Sci U S A 102:15545–50, 2005 [DOI] [PMC free article] [PubMed] [Google Scholar]
- 16.Mootha VK, Lindgren CM, Eriksson KF, et al. : PGC-1alpha-responsive genes involved in oxidative phosphorylation are coordinately downregulated in human diabetes. Nat Genet 34:267–73, 2003 [DOI] [PubMed] [Google Scholar]
- 17.Swick AD, Stein AP, McCulloch TM, et al. : Defining the boundaries and expanding the utility of head and neck cancer patient derived xenografts. Oral Oncol 64:65–72, 2017 [DOI] [PMC free article] [PubMed] [Google Scholar]
- 18.Goke F, Franzen A, Hinz TK, et al. : FGFR1 Expression Levels Predict BGJ398 Sensitivity of FGFR1-Dependent Head and Neck Squamous Cell Cancers. Clin Cancer Res 21:4356–64, 2015 [DOI] [PMC free article] [PubMed] [Google Scholar]
- 19.Nguyen PT, Tsunematsu T, Yanagisawa S, et al. : The FGFR1 inhibitor PD173074 induces mesenchymal-epithelial transition through the transcription factor AP-1. Br J Cancer 109:2248–58, 2013 [DOI] [PMC free article] [PubMed] [Google Scholar]
- 20.Singleton KR, Kim J, Hinz TK, et al. : A receptor tyrosine kinase network composed of fibroblast growth factor receptors, epidermal growth factor receptor, v-erb-b2 erythroblastic leukemia viral oncogene homolog 2, and hepatocyte growth factor receptor drives growth and survival of head and neck squamous carcinoma cell lines. Mol Pharmacol 83:882–93, 2013 [DOI] [PMC free article] [PubMed] [Google Scholar]
- 21.Ader I, Delmas C, Skuli N, et al. : Preclinical evidence that SSR128129E--a novel small-molecule multi-fibroblast growth factor receptor blocker--radiosensitises human glioblastoma. Eur J Cancer 50:2351–9, 2014 [DOI] [PubMed] [Google Scholar]
- 22.Ader I, Toulas C, Dalenc F, et al. : RhoB controls the 24 kDa FGF-2-induced radioresistance in HeLa cells by preventing post-mitotic cell death. Oncogene 21:5998–6006, 2002 [DOI] [PubMed] [Google Scholar]
- 23.Ishigami T, Uzawa K, Higo M, et al. : Genes and molecular pathways related to radioresistance of oral squamous cell carcinoma cells. Int J Cancer 120:2262–70, 2007 [DOI] [PubMed] [Google Scholar]
- 24.Uzawa K, Ishigami T, Fushimi K, et al. : Targeting fibroblast growth factor receptor 3 enhances radiosensitivity in human squamous cancer cells. Oncogene 30:4447–52, 2011 [DOI] [PubMed] [Google Scholar]
- 25.Cohen-Jonathan E, Toulas C, Monteil S, et al. : Radioresistance induced by the high molecular forms of the basic fibroblast growth factor is associated with an increased G2 delay and a hyperphosphorylation of p34CDC2 in HeLa cells. Cancer Res 57:1364–70, 1997 [PubMed] [Google Scholar]
- 26.Fuks Z, Persaud RS, Alfieri A, et al. : Basic fibroblast growth factor protects endothelial cells against radiation-induced programmed cell death in vitro and in vivo. Cancer Res 54:2582–90, 1994 [PubMed] [Google Scholar]
- 27.Haimovitz-Friedman A, Balaban N, McLoughlin M, et al. : Protein kinase C mediates basic fibroblast growth factor protection of endothelial cells against radiation-induced apoptosis. Cancer Res 54:2591–7, 1994 [PubMed] [Google Scholar]
- 28.Houchen CW, George RJ, Sturmoski MA, et al. : FGF-2 enhances intestinal stem cell survival and its expression is induced after radiation injury. Am J Physiol 276:G249–58, 1999 [DOI] [PubMed] [Google Scholar]
- 29.Zhang L, Sun W, Wang J, et al. : Mitigation effect of an FGF-2 peptide on acute gastrointestinal syndrome after high-dose ionizing radiation. Int J Radiat Oncol Biol Phys 77:261–8, 2010 [DOI] [PMC free article] [PubMed] [Google Scholar]
- 30.Ma J, Benitez JA, Li J, et al. : Inhibition of Nuclear PTEN Tyrosine Phosphorylation Enhances Glioma Radiation Sensitivity through Attenuated DNA Repair. Cancer Cell 35:504–518 e7, 2019 [DOI] [PMC free article] [PubMed] [Google Scholar]
- 31.Van Cutsem E, Bang YJ, Mansoor W, et al. : A randomized, open-label study of the efficacy and safety of AZD4547 monotherapy versus paclitaxel for the treatment of advanced gastric adenocarcinoma with FGFR2 polysomy or gene amplification. Ann Oncol 28:1316–1324, 2017 [DOI] [PubMed] [Google Scholar]
- 32.Paik PK, Shen R, Berger MF, et al. : A Phase Ib Open-Label Multicenter Study of AZD4547 in Patients with Advanced Squamous Cell Lung Cancers. Clin Cancer Res 23:5366–5373, 2017 [DOI] [PMC free article] [PubMed] [Google Scholar]
- 33.Saka H, Kitagawa C, Kogure Y, et al. : Safety, tolerability and pharmacokinetics of the fibroblast growth factor receptor inhibitor AZD4547 in Japanese patients with advanced solid tumours: a Phase I study. Invest New Drugs 35:451–462, 2017 [DOI] [PMC free article] [PubMed] [Google Scholar]
- 34.Aggarwal C, Redman MW, Lara PN Jr., , et al. : SWOG S1400D (NCT02965378), a Phase II Study of the Fibroblast Growth Factor Receptor Inhibitor AZD4547 in Previously Treated Patients With Fibroblast Growth Factor Pathway-Activated Stage IV Squamous Cell Lung Cancer (Lung-MAP Substudy). J Thorac Oncol, 2019 [DOI] [PMC free article] [PubMed] [Google Scholar]
- 35.Pearson A, Smyth E, Babina IS, et al. : High-Level Clonal FGFR Amplification and Response to FGFR Inhibition in a Translational Clinical Trial. Cancer Discov 6:838–851, 2016 [DOI] [PMC free article] [PubMed] [Google Scholar]
- 36.Wynes MW, Hinz TK, Gao D, et al. : FGFR1 mRNA and protein expression, not gene copy number, predict FGFR TKI sensitivity across all lung cancer histologies. Clin Cancer Res 20:3299–309, 2014 [DOI] [PMC free article] [PubMed] [Google Scholar]
- 37.Kas SM, de Ruiter J, Schut E, et al. : Transcriptomics and transposon mutagenesis identify multiple mechanisms of resistance to the FGFR inhibitor AZD4547. Cancer Res, 2018 [DOI] [PubMed] [Google Scholar]
- 38.Singleton KR, Hinz TK, Kleczko EK, et al. : Kinome RNAi Screens Reveal Synergistic Targeting of MTOR and FGFR1 Pathways for Treatment of Lung Cancer and HNSCC. Cancer Res 75:4398–406, 2015 [DOI] [PMC free article] [PubMed] [Google Scholar]
- 39.Jung CH, Ro SH, Cao J, et al. : mTOR regulation of autophagy. FEBS Lett 584:1287–95, 2010 [DOI] [PMC free article] [PubMed] [Google Scholar]
- 40.Ondrej M, Cechakova L, Durisova K, et al. : To live or let die: Unclear task of autophagy in the radiosensitization battle. Radiother Oncol 119:265–75, 2016 [DOI] [PubMed] [Google Scholar]
- 41.Palakurthi S, Kuraguchi M, Zacharek SJ, et al. : The Combined Effect of FGFR Inhibition and PD-1 Blockade Promotes Tumor-Intrinsic Induction of Antitumor Immunity. Cancer Immunol Res 7:1457–1471, 2019 [DOI] [PubMed] [Google Scholar]
Associated Data
This section collects any data citations, data availability statements, or supplementary materials included in this article.