Abstract
Leukemias are refractory hematopoietic malignancies, for which the development of new therapeutic agents requires in vivo studies using tumor-bearing mouse models. Although several organs are commonly examined in such studies to evaluate the disease course, the effectiveness of interventions and the localization of tumor cells in the affected organs are still unclear. In this study, we histologically examined the distribution of leukemia cells in several organs using two leukemic mouse models produced by the administration of two cell lines (THP-1, a human myelomonocytic leukemia, and A20, a mouse B cell leukemia/lymphoma) to severe immunodeficient mice. Survival of the mice depended on the tumor burden. Although A20 and THP-1 tumor cells massively infiltrated the parenchyma of the liver and spleen at 21 days after transplantation, A20 cells were hardly found in connective tissues in Glisson’s capsule in the liver as compared with THP-1 cells. In the bone marrow, there was more severe infiltration of A20 cells than THP-1 cells. THP-1 and A20 cells were widely spread in the lungs, but were rarely observed in the small intestine. These findings suggest that each leukemia model has a unique localization of tumor cells in several affected organs, which could critically affect the disease course and the efficacy of therapeutic agents, including cellular immunotherapies.
Keywords: leukemia, mouse model, immunohistochemistry, leukemia cell line
I. Introduction
Acute leukemias are common hematopoietic malignancies characterized by the uncontrollable expansion of blast cells in the bone marrow, peripheral blood, and other organs [6]. Common types of acute leukemia include acute myeloid leukemia (AML) and acute lymphocytic leukemia (ALL), and recent estimates of their incidence from the National Cancer Institute Surveillance Research Program were 4.3 per 100,000 and 1.7 per 100,000, respectively [20]. Despite the expansion of treatment strategies including molecular-targeted or immune therapies, the cure rate remains low, at only 20 to 40 % [6, 10]. In vivo animal leukemia models have been important tools for understanding the biology of leukemia, developing new therapeutic agents and making advances in leukemia research.
There are several methods for inducing leukemias in mice, such as by chemical, radiation, viral, transposon, or transgenic techniques, or by the administration of tumor cells [25]. Among these, tumor injection into severe immunodeficient mice is a relatively simple and easy way to develop leukemia mouse models. Irradiated immunodeficient mice have an immune system that is insufficient to reject transplanted primary human normal hematopoietic cells. Since the late 19th century, leukemia mouse models have been developed and congenitally immunodeficient mice, such as severe immunodeficient (SCID), NOG (nonobese diabetic/severe combined immunodeficient; NOD/Scid/IL2Rγnull), NSG (NOD/Scid/IL2Rγnull), and NOJ (NOD/Scid/Jak3null) mice, have been discovered. Not only T and B cells, but also natural killer (NK) cells are disrupted in these severe immunodeficient NSG and NOG mice, so that xenograft can be easily engrafted into a host compared to nude or SCID mice [11, 13, 14, 23].
We formerly analyzed the pathogenesis of graft-versus-host disease (GVHD), which is a critical adverse event after transplantation for refractory leukemias, using xenogeneic humanized NOG mouse models [16, 17]. To induce GVHD, NOG mice were intravenously (i.v.) administered human peripheral blood mononuclear cells (PBMCs) following irradiation. In those studies, we demonstrated the localization of invaded human PBMC in host mouse tissues. The lungs and liver were mainly affected by donor T cells, while only mild invasion was observed in the intestine, which was frequently affected in GVHD after both human and murine allogeneic transplantation. In the same way, we also intended to create mouse models of leukemia and treatment with xenogeneic hematopoietic cell transplantation using irradiated NOG mice to analyze the pathogenesis of graft-versus-leukemia (GVL) effects using a mouse leukemia/lymphoma cell line [submitted]. We demonstrated differences in the distribution of PBMCs in multiple GVHD-affected mouse organs, but the localization of tumor cells in leukemia mouse models remains unclear.
Therefore, in this study, we sought to clarify the localization of tumor cells at different time points in both humanized and murine leukemia models. We describe the time-dependent characteristics of histopathology in the leukemia mouse models using two kinds of leukemia cell lines: THP-1, a human myelomonocytic leukemia cell line, and A20, a mouse B cell leukemia/lymphoma cell line.
II. Materials and Methods
Animals
Female NOG mice were purchased from the Central Institute of Experimental Animals (Kawasaki, Japan). The animals were maintained under a 12-hr light/dark cycle and given conventional food and water ad libitum. Room temperature was maintained at approximately 23°C. All mice used in the experiments were 8–12 weeks old. All animal experiments were performed with approval from the Institutional Animal Experiment Committee of Jichi Medical University, and conducted in accordance with the Institutional Regulations for Animal Experiments and Fundamental Guidelines for Proper Conduct of Animal Experiment and Related Activities in Academic Research Institutions under the Jurisdiction of the Japanese Ministry of Education, Culture, Sports, Science and Technology.
Cells
Firefly luciferase-transfected A20 BALB/c strain mouse B leukemia and lymphoma cells were kindly gifted by Dr. K. Ohnuma (Juntendo University, Tokyo, Japan) [22]. THP-1 cells (human leukemia, type M5 according to the French-American-British (FAB) Classification) were purchased from the American Type Culture Collection (ATCC, Rockville, MD, USA) and transfected with luciferase driven by cytomegalovirus promoter for stable expression. Both cell lines were cultured using RPMI 1640/Glutamax culture medium (Gibco, MA, USA) supplemented with 10% fetal bovine serum and 0.5% penicillin–streptomycin.
Tumor mouse models
NOG mice were injected i.v. with a pre-determined number of A20 or THP-1 cells suspended in 500 μL Dulbecco’s phosphate-buffered saline (DPBS) on the day of transplantation following total body irradiation with 2Gy (gamma irradiator with a Cesium137 source; GAMMACELL-40 (Atomic Energy of Canada Limited, Ottawa, Canada)). Three mice in each group were used for a survival analysis and their overall survival was analyzed by a Kaplan-Meier analysis. All statistical tests were performed with EZR (Saitama Medical Center, Jichi Medical University, Saitama, Japan) [15]. The injected THP-1 and A20 tumor cells expressed luciferase, so that tumor cell proliferation and spreading could be detected in live animals using in vivo imaging with an IVIS SpectrumCT In Vivo Imaging System (PerkinElmer, MA, USA). D-luciferin sodium salt (OZ Biosciences, Marseille, France) was dissolved in DPBS in a final concentration of 30 mg/mL in accordance with the manufacturer’s instructions and stored at −80°C. Each mouse was injected with 100 μL of D-luciferin stock substrate solution 10 min before imaging following anesthetization. For monitoring tumor growth, the mice in GVL treatment experiments were subjected to bioluminescence imaging every week. In vivo imaging data were analyzed by Living Image software (Perkin Elmer).
Histopathology and immunohistochemistry
Each group consisted of six mice and three were dissected 14 or 21 days after transplantation. The animals were anesthetized with pentobarbital sodium (30 mg/kg intraperitoneally, i.p., Kyoritsu Seiyaku, Tokyo, Japan). For immunohistochemistry, mice were perfused with 4% paraformaldehyde with 0.05 M phosphate buffer (pH 7.4) for 5 min. The left lung, liver, spleen, and intestinal specimens were fixed overnight at 4°C with the same fixative, and then embedded in paraffin following alcohol dehydration. Sections (4 μm thick) were prepared using a microtome. The sections were deparaffinized and used for staining with hematoxylin-eosin (H&E) or immunohistochemistry. IHC was performed as described previously [27] with some modifications. The primary antibodies used in immunohistochemistry are shown in Table 1. The THP-1 cell line overexpressed the CD31 surface antigen and A20 mouse leukemia cells expressed the murine B cell marker B220 [19, 24]. While B220 is a widely used surface marker of mouse B lymphocytes, it was possible to detect only A20 B leukemia cells due to the lack of normal B and T cells in NOG mice. Therefore, rabbit anti-human CD31 IgG or rat anti-mouse B220 IgG was used to detect THP-1 or B220, respectively, in this experiment. The antigens were retrieved by heating in 1 mM EDTA (Nissin EM, Tokyo, Japan) at 90°C for 10 min by using microwave in immunostaining for human CD31 or in citrate buffer (pH 6.0) at 95°C for 60 min in immunostaining for B220. These sections were incubated in phosphate-buffered saline (PBS) containing 3% hydrogen peroxidase for 30 min to inactivate the peroxidase, and pretreated with a Streptavidin/Biotin Blocking Kit (Vector Laboratories, CA, USA) and blocked with PBS containing 2% normal goat serum for 30 min at room temperature. After the blocking processes, the sections were treated with primary antibodies. To visualize the primary antibodies, samples were treated with a TSA-biotin System (PerkinElmer) and biotin-conjugated secondary antibody for human CD31 and B220, respectively, in accordance with the manufacturer’s instructions, and finally visualized by using a Vectastain ABC kit (Vector Laboratories) with 3,3'-diaminobenzidine (Nakarai Chemical, LTD, Kyoto, Japan). Images were acquired with a light microscope (BX-63; Olympus Japan Co., Tokyo, Japan). The absence of an observable nonspecific immunoreaction was confirmed by performing immunostaining without primary antibodies. For quantification of the occupation of the tumors, we calculated the immunopositive rate (immunopositive cells among total cells) in the liver, spleen, and bone marrow. Three images including at least one splenic sinusoid in the spleen or Gleason’s sheath in the liver and five images of the bone marrow were taken in each mouse. Therefore, in each leukemia group, a total of nine images of the liver with a total of 8,166 and 11,315 cells in the A20 and THP-1 models, respectively; nine images of the spleen with a total of 13,114 and 10,414 cells in the A20 and THP-1 models, respectively; and 15 images of the bone marrow with a total of 21,402 and 23,263 cells in the A20 and THP-1 models, respectively, were used for quantification. To analyze the distribution of tumor cells surrounding Gleason’s sheath in the liver, we randomly selected 10 Gleason’s sheath areas and counted the tumor cells, which were in direct contact with Gleason’s sheath. We also measured the total perimeter of Gleason’s sheath and calculated the number of cells in direct contact per determined length. Fiji-ImageJ (https://imagej.net/Fiji) was used for the measurement of the length in the images. Comparisons were made by two-tailed Student’s t tests.
Table 1. .
Target antigens and primary antibodies for immunohistochemistry staining
| Antigen | Immunized animal | Dilution factor | Supplier | Immunostained cellular type |
|---|---|---|---|---|
| CD31 (PECAM-1) | Rabbit | 1:50 | Abcam, MA, USA | THP-1 |
| B220 (CD45RA) | Rat | 1:400 | Santa Cruz Biotechnology, CA, USA | A20 |
III. Results
Establishment of THP-1 and A20 leukemia mouse models
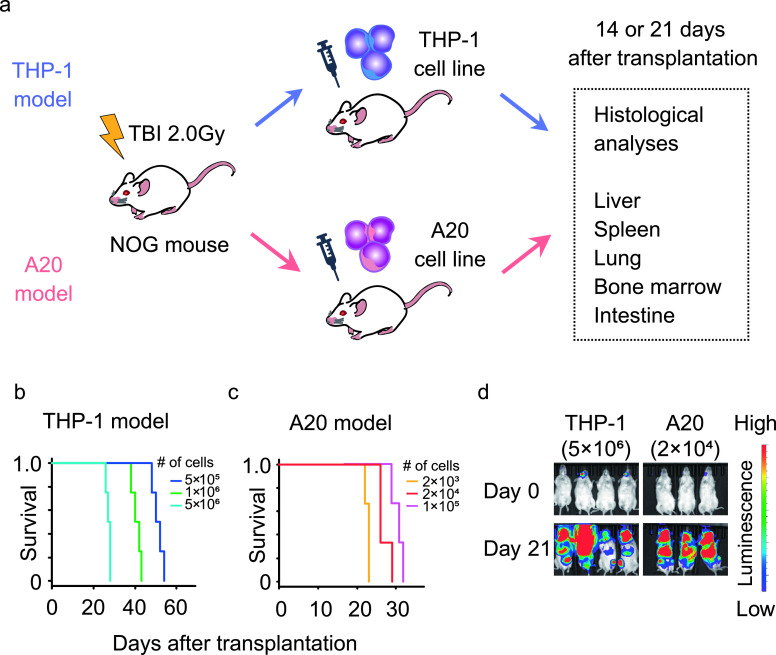
In this study, tumor cells obtained from THP-1 or A20 cell lines were administered intravenously into severe immunodeficient NOG mice following irradiation (Fig. 1a). Under the injection of different numbers of tumor cells, all mice eventually died several weeks after transplantation, and survival of the mice depended on the number of administered cells in both the THP-1 (Fig. 1b) and A20 (Fig. 1c) models. According to previous reports [7, 22], the number of injected tumor cells was titrated to achieve a survival duration of 1 month. In the THP-1 model, survival was too long when 1 × 10⁶ or fewer THP-1 cells were injected, and was about 1 month when 5 × 10⁶ THP-1 cells were injected (Fig. 1b). In the A20 model, survival was about 1 month and the injection of 2 × 10⁴ A20 cells gave a survival time closest to that with 5 × 10⁶ THP-1 cells (Fig. 1c). Bioluminescence imaging showed that all the mice in the two models developed leukemia that spread throughout the whole body in 21 days after transplantation (Fig. 1d). Some leukemic mice developed paralysis in both legs, which was suspected to be caused by central nervous system invasion of tumor cells, as could be seen from high luminescence intensity in their heads. These results demonstrated that the titrated injection of THP-1 and A20 cells produced leukemia mouse models with comparable survival and tumor cells spread widely throughout the whole body in 21 days. We injected 5 × 10⁶ THP-1 cells or 2 × 10⁴ A20 cells in all subsequent analyses to achieve comparable survival and organ pathology during one month of the disease course in the two different models. The photon intensity of bioluminescence in all the mice at 7 days after transplantation was lower than the defined cut-off level (data not shown). Moreover, histopathological analysis showed that few cells were observed in the liver (per glass slide) and no tumor cells were seen in other organs (data not shown). Thereafter, we dissected the two kinds of leukemia mouse models at 14 or 21 days after transplantation, and the organs were histologically examined using H&E staining and immunohistochemistry staining for tumor cells in subsequent analyses (Fig. 1a).
Fig. 1.
Titration of cell number for the leukemia mouse models. A luciferase-expressing cell line (THP-1 or A20) was administered into irradiated NOG (nonobese diabetic/severe combined immunodeficient/Scid/IL2Rγnull) mice, and the organs were histologically examined 14 or 21 days after tumor cell transplantation (a). Survival of NOG mice injected with different numbers of THP-1 (b) or A20 (c) cells. The growth and whole-body spreading of tumor cells were detected using bioluminescence imaging of luciferase in tumor cells (d). TBI: total body irradiation.
Massive but partly different infiltration of tumor cells in liver and spleen of A20 and THP-1 models
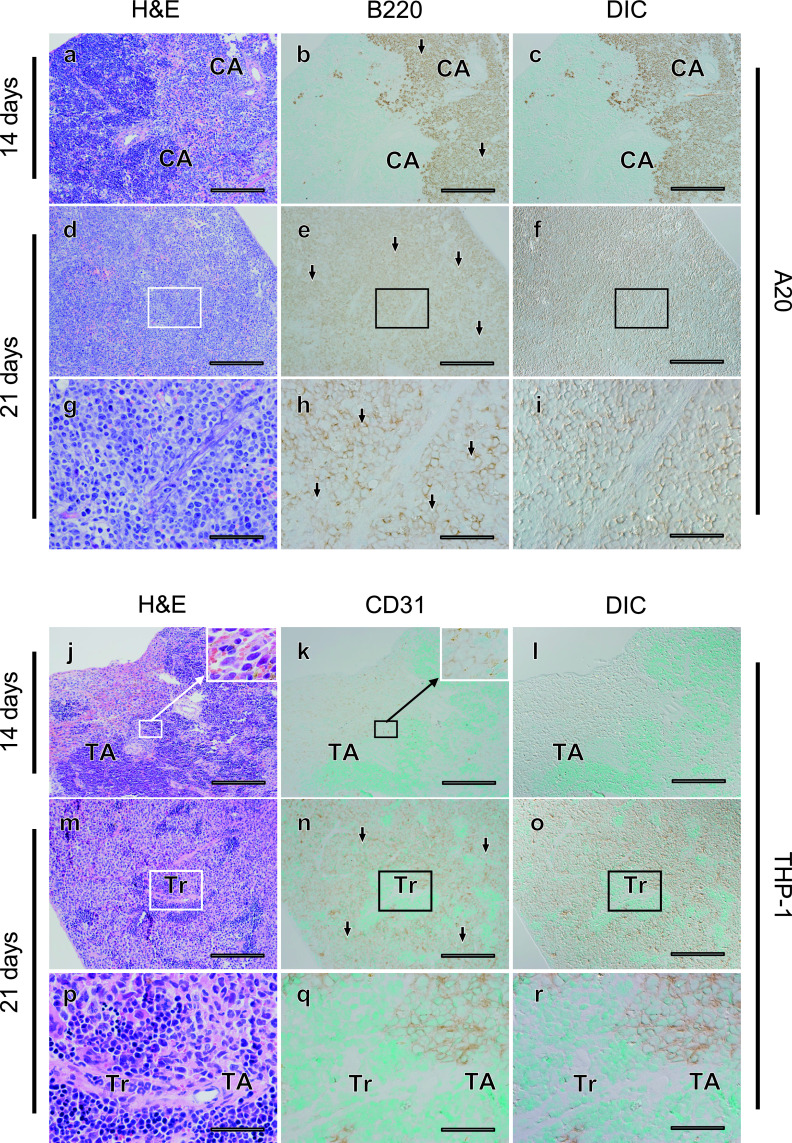
Organ swelling can be caused by infiltration of tumor cells in human leukemia, and palpable hepatosplenomegaly was prominent 21 days after tumor cell transplantation in both the A20 and THP-1 mouse models. Positive signals for both B220 for A20 cells and human CD31 for THP-1 cells were observed in the spleen 14 and 21 days after transplantation (Fig. 2). In both models, tumor cells started to infiltrate but did not spread throughout the spleen at 14 days after transplantation (Fig. 2a–c, j–l). These tumor cells proliferated and diffusely infiltrated the spleen 21 days after transplantation (Fig. 2d–i, m–r). In the spleen, the tumor occupancy rate was approximately 80% in both the A20 and THP-1 models, and there was no significant difference between the two models (P = 0.851) (Table 2).
Fig. 2.
Massive infiltration of tumor cells into the spleen parenchyma was commonly observed in the A20 and THP-1 leukemia mouse models, but infiltration into connective tissues was observed only in the A20 model. Fourteen (a–c, j–l) or 21 (d–f, m–o) days after transplantation, histological changes in spleen tissues were evaluated in serial sections (a–c, d–f, j–l, m–o) using hematoxylin-eosin (H&E) staining (a, d, j, m) and tumor cells (arrows) were detected with immunostaining for B220 in A20 leukemia mouse models (b, c, e, f), and for CD31 in THP-1 mouse models (k, l, n, o). Differential interference contrast (DIC) images (c, f, l, o) were acquired in areas where immunostaining for tumor cells was observed (b, e, k, n). Areas indicated with rectangles (d–f, m–o) are magnified (g–i, p–r). CA; central artery, Tr; trabecula, TA; trabecular artery. Bars = 500 μm (a–f, j–o) and 100 μm (g–i, p–r).
Table 2. .
Statistical analysis in immunohistochemistry staining positive cells
| Organ | A20 | THP-1 | P-value | |
|---|---|---|---|---|
| Immunopositive cells/total cells (%) | Spleen (n = 9) | 80.7 ± 3.36 | 81.4 ± 0.42 | 0.851 |
| Liver (n = 9) | 62.8 ± 6.48 | 63.7 ± 6.96 | 0.927 | |
| Bone marrow (n = 15) | 69.1 ± 8.75 | 26.9 ± 3.42 | <0.01 | |
| Number of tumor cells (/100 μm) | Around Glisson’s sheath (n = 10) | 1.80 ± 0.43 | 4.68 ± 0.82 | <0.01 |
Means ± SDs are shown.
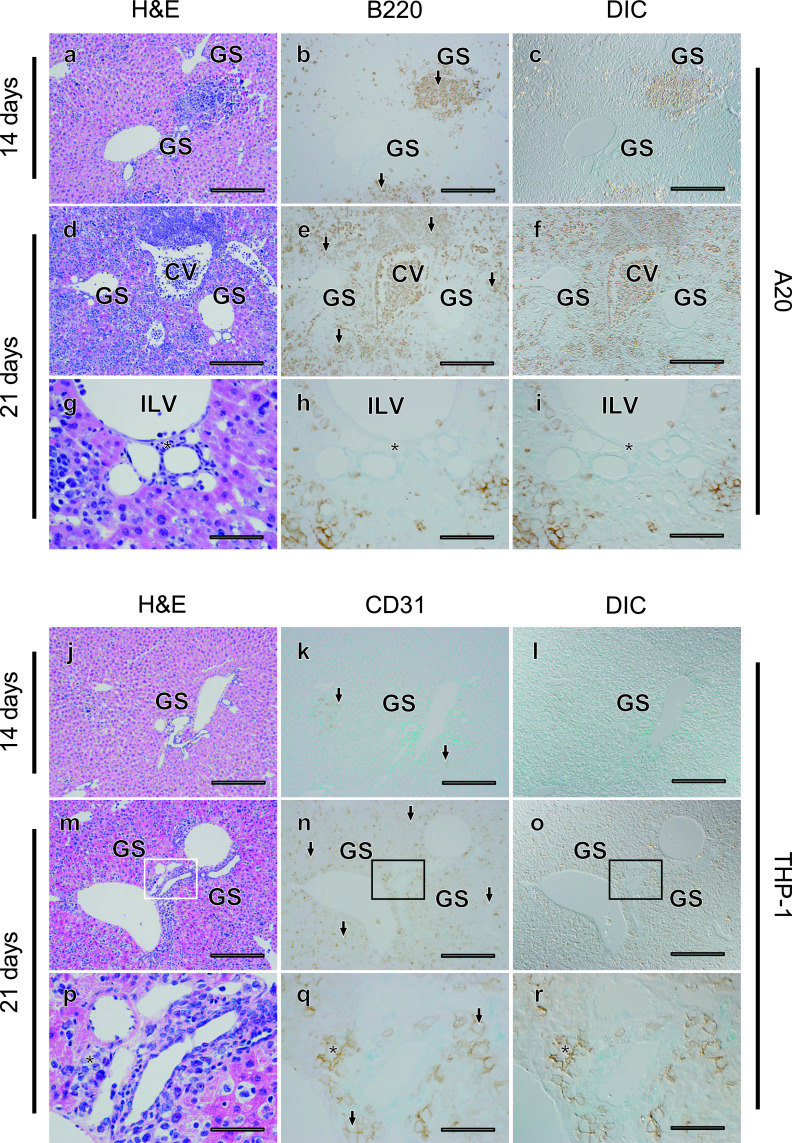
Next, we examined the liver tissues of these mouse models (Fig. 3). Invasion of leukemia cell lines increased as time advanced in both mouse models. At 14 days after transplantation, many tumor cells were diffusely infiltrated into the hepatic lobule in both models, and some tumor cells formed clusters (Fig. 3a–c, j–l). Normal liver structures such as hepatic laminae and sinusoids appeared intact outside of the tumor cell clusters. However, 21 days after transplantation, tumor cells massively infiltrated the hepatic lobules in both models, and normal liver structures appeared to be disrupted, especially in the A20 leukemia model (Fig. 3d–i, 3m–r). Similar to the finding in the spleen, the tumor occupancy rate was about 60% and not significantly different in the two models (P = 0.927) (Table 2). Although tumor cells were sparsely distributed and not apparent in Glisson’s capsule in the A20 model, tumor cells were frequently observed inside the interlobular connective tissue in the THP-1 model (Fig. 3h, i, q, r), and a higher number of THP-1 cells was seen around Glisson’s capsule as compared with A20 cells (Table 2). These results demonstrate that, while obvious infiltration of tumor cells is common, distribution can be different in Glisson’s capsule in the liver of the A20 and THP-1 models.
Fig. 3.
Absence of A20, but not THP-1, tumor cells around Glisson’s sheath (GS) in the liver of the leukemia mouse models. Fourteen (a–c, j–l) or 21 (d–f, m–o) days after transplantation, histological changes in liver tissues were evaluated in serial sections (a–c, d–f, j–l, m–o) using H&E staining (a, d, j, m) and tumor cells (arrows) were detected with immunostaining for B220 in A20 leukemia mouse models (b, c, e, f), and CD31 in THP-1 mouse models (k, l, n, o). DIC images (c, f, l, o) were acquired in areas where immunostaining for tumor cells was observed (b, e, k, n). Areas indicated with rectangles (d–f, m–o) are magnified (g–i, p–r). CV; central vein, ILV; intralobular vein. Asterisks identify the connective tissue around Glisson’s capsule. Bars = 500 μm (a–f, j–o) and 100 μm (g–i, p–r).
A20 cells infiltrate bone marrow more severely than THP-1 cells
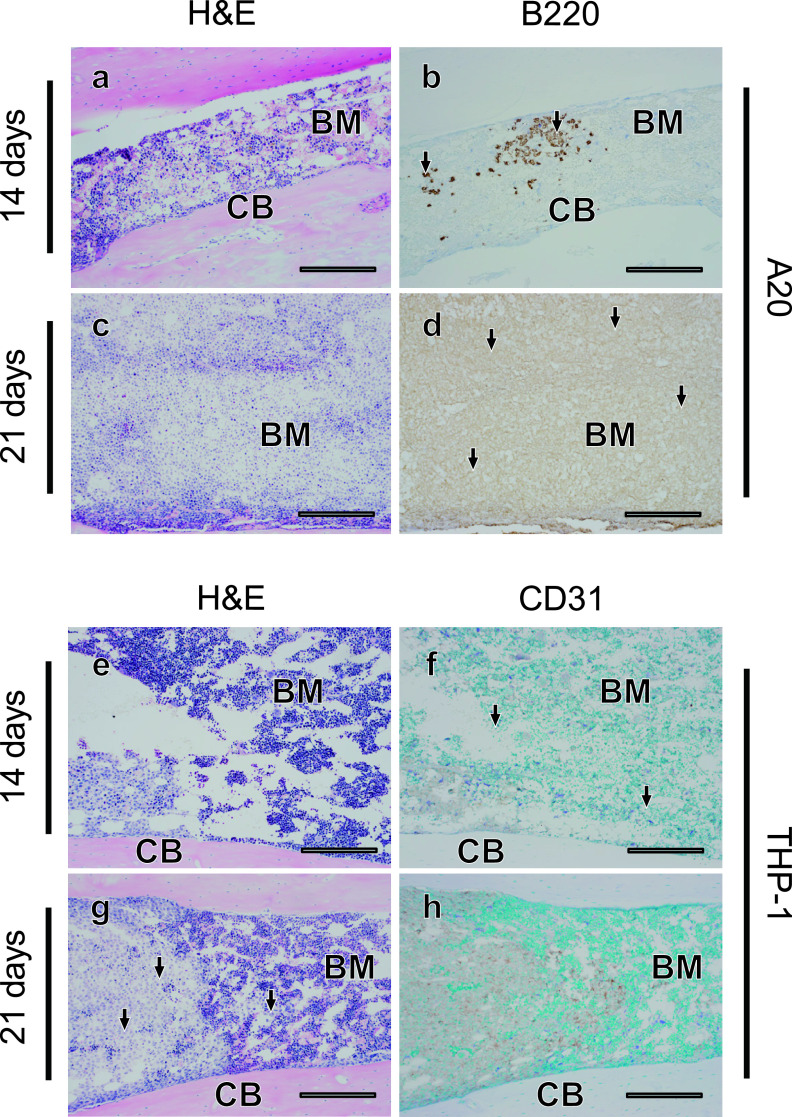
We next examined the distribution of tumor cells in bone marrow in the A20 and THP-1 models, using bone marrow tissues in femur bones. Only small numbers of tumor cells were observed in the bone marrow of the A20 (Fig. 4a, b) and THP-1 (Fig. 4e, f) models 14 days after transplantation. At 21 days after transplantation, an enormous number of tumor cells appeared to be packed in the bone marrow in the A20 model (Fig. 4c, d), and adipose tissue was hardly observed. Interestingly, on the other hand, the infiltration of THP-1 cells into bone marrow was mild, and clusters of tumor cells were observed only in some regions of the bone marrow even at 21 days after transplantation (Fig. 4g, h). When the numbers of tumor cells were counted, in contrast to the liver and spleen, a significantly larger number of tumor cells invaded the bone marrow in the A20 model as compared with the THP-1 model at 21 days after transplantation (P < 0.01) (Table 2). These results suggest that differential tumor cell invasion into bone marrow in the A20 and THP-1 models, and A20 cells appear to have a more prominent ability to infiltrate bone marrow.
Fig. 4.
Diffuse infiltration of A20 cells and partial infiltration of THP-1 cells into the bone marrow. Fourteen (a, b, e, f) or 21 (c, d, g, h) days after transplantation, histological changes in bone marrow were evaluated in serial sections (a–b, c–d, e–f, g–h) using H&E staining (a, c, e, g) and tumor cells (arrows) were detected with immunostaining for B220 in A20 leukemia mouse models (b, d), and for CD31 in THP-1 mouse models (f, h). BM; bone marrow, CB; cortical bone. Bars = 500 μm.
Both A20 and THP-1 cells massively infiltrated the lungs but not the intestine
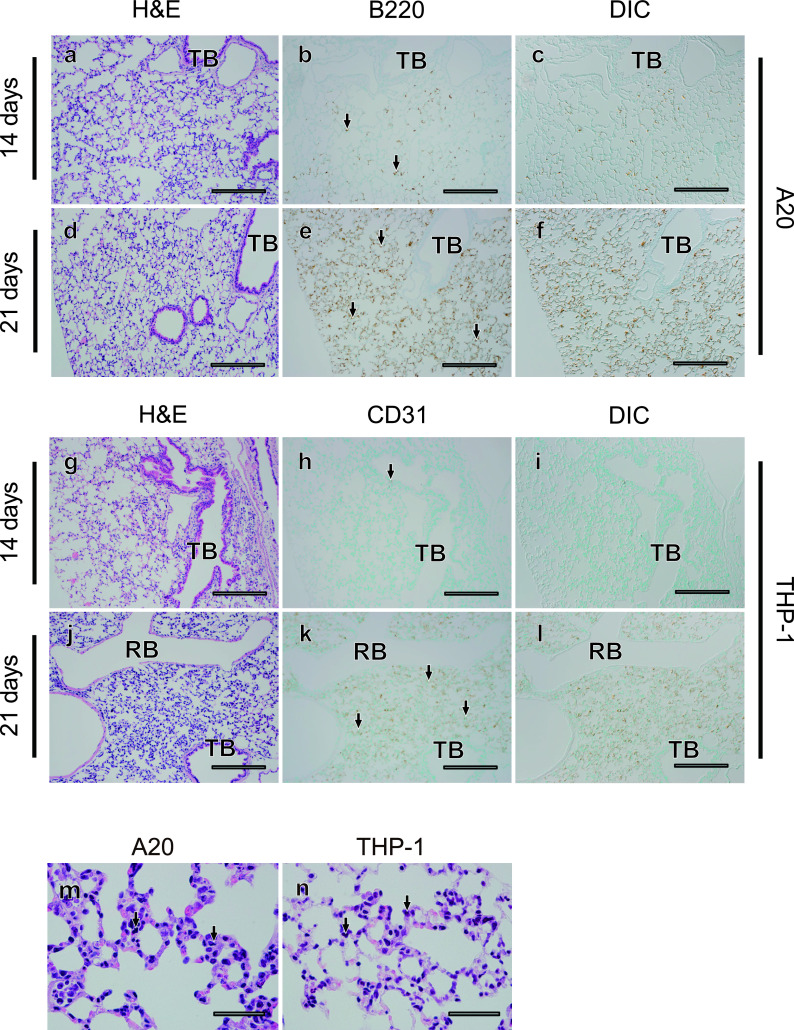
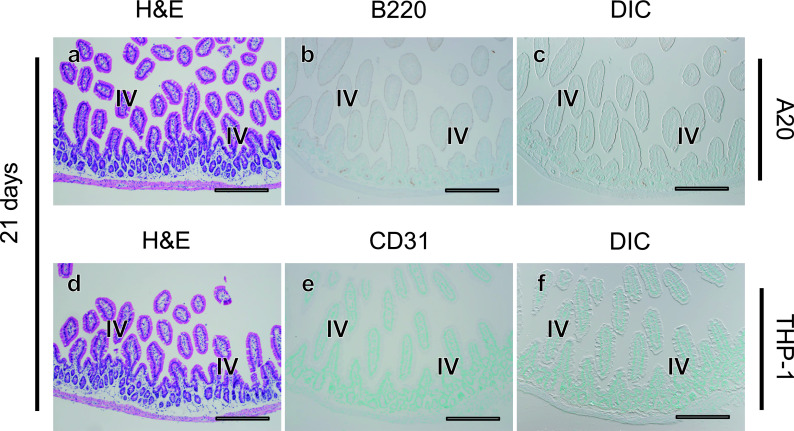
We finally examined the distribution of tumor cells in the lungs and intestine, which were frequently affected in murine allogeneic GVHD. In lung tissues of both the A20 and THP-1 models, only some tumor cells were observed 14 days after transplantation (Fig. 5a–c, g–i) and much larger numbers of tumor cells were diffusely infiltrated 21 days after transplantation (Fig. 5d–f, j–i). In both leukemia models, tumor cells mainly touched the alveolar septum and rarely exudated within the intra-alveolar space (Fig. 5m, n). In contrast to the results in the liver, tumor cells never formed clusters in the lungs of the A20 or THP-1 models. In contrast, although allogeneic GVHD in mice frequently affects the intestinal tract, no evidence of tumor cell infiltration into the intestine was observed in either model, even at 21 days after transplantation (Fig. 6a–f). These results demonstrate that THP-1 and A20 cells both massively infiltrated the lungs, but not the intestine.
Fig. 5.
Diffuse infiltration of both A20 and THP-1 into the lungs. Fourteen (a–c, g–i) or 21 (d–f, j–l) days after transplantation, histological changes in lung tissues were evaluated in serial sections (a–c, d–f, g–i, j–l) using H&E staining (a, d, g, j) and tumor cells (arrows) were detected with immunostaining for B220 in A20 leukemia mouse models (b, c, e, f), and for CD31 in THP-1 mouse models (h, i, k, l). DIC images (c, f, i, l) were acquired in areas where immunostaining for tumor cells was observed (b, e, h, k). Images of pulmonary alveoli and intra-alveolar tumor cells (arrows) in A20 (m) and THP-1 models (n) are shown at high magnification. TB; terminal bronchiole, RB; respiratory bronchiole. Bar = 500 μm (a–l) and 50 μm (m, n).
Fig. 6.
No infiltration of A20 or THP-1 cells in the intestine. Twenty one days after transplantation, histological changes in intestinal tissues were evaluated in serial sections (a–c, d–f) using H&E staining (a, d) and tumor cells (arrows) were detected with immunostaining for B220 in A20 leukemia mouse models (b, c), and for CD31 in THP-1 mouse models (e, f). There is no evidence of leukemia invasion into the intestine. IV; intestinal villi. Bars = 500 μm.
IV. Discussion
In the present study, we sought to clarify organ involvement and the localization of tumor cells in leukemia mouse models using two different leukemia cell lines, THP-1 and A20. Both models showed comparable survival, tumor cell spreading and palpable hepatosplenomegaly after titrated injection, and massive infiltration of tumor cells was observed in the spleen and liver at 21 days after tumor cell injection. However, differential distribution was also observed in the two models; in the spleen, A20 cells, but not THP-1 cells, invaded normal connective tissues such as the splenic column, while THP-1 cells, but not A20 cells, invaded the connective tissues of Glisson’s sheath in the liver. A difference in tumor distribution was also found in the bone marrow; while many A20 cells were packed in the entire bone marrow, normal bone marrow cells including adipocytes remained in the THP-1 model at 21 days after tumor cell injection. There were no differences in tumor localization in the lungs or intestine between the two mouse models, although tumor cell infiltration was distinct between the two organs; both cell lines diffusely infiltrated the lungs and there was no evidence of tumor invasion in the intestine. These results suggest that different leukemia mouse models have different patterns of organ involvement, and the localization of tumor cells in the leukemia models provides critical information to evaluate the effects of anti-leukemia treatments using these mice models.
In this study, the survival of tumor-bearing mice depended on the number of tumor cells administered. In general, 103 to 107 human or murine cells can be engrafted into SCID, NSG or NOG mice [4, 5, 8, 9, 13, 14, 18]. Among different types of human leukemias, tumor cells from ALL patients are easy to engraft compared to those from AML patients [5]. Similar to our results, the rate of leukemia engraftment and the survival of mice have been reported to depend on the tumor cell dosage [8]. However, in our experiment, the A20 model tended to have shorter survival even with a relatively small tumor volume compared to the THP-1 model. NKT cells were defective in NOG mice, but residual innate immunity might prevent the proliferation of THP-1 cells rather than syngeneic A20 cells. These results suggest that the in vivo microenvironment for syngeneic tumor proliferation may be more beneficial for specific types of leukemia cells in leukemia mouse models.
Different leukemia cell types showed differences in organ involvement. In human leukemia, M4 and M5 (Acute monocytic leukemia) leukemias according to the FAB Classification and leukemias with cytogenetic abnormalities of t(8;21), inv(16), and t(8;16) had higher incidences of extramedullary acute leukemias [2, 3, 26]. Especially human acute myelomonocytic leukemia (Type M4 and M5) often invades organs other than bone marrow, such as the gingiva, lungs and skin. Similar to our THP-1 (Type M5 according to FAB classification) model, leukemia mouse models bearing primary human leukemia cells obtained from patients with FAB M4 and M5 had severe organ involvement compared to M1 or M2 mice models, but had less bone marrow invasion [18]. The differences in leukemia cell migration may be attributable to chemokine-chemokine receptor interactions and/or matrix-leukocyte integrin interactions, as indicated in a previous study [21]. However, the reasons why leukemia cells mainly proliferate in bone marrow rather than other organs in human leukemia patients are still unclear. Further studies are needed to elucidate the mechanisms that regulate the dynamics of leukemia blasts.
In the liver of our mouse models, A20 cells were hardly distributed in Glisson’s sheaths, while THP-1 cells invaded the whole liver, even inside the connective tissues of Glisson’s sheaths. Previous reports suggested that chemokine receptors and the expression of adhesions molecules such as surface CD56 provided an environment for tumor homing [3, 9]. Moreover, myelomonocytic cells are known to maintain a high ability for migration after leukemic change and easily differentiate after migration to extravascular spaces [1]. On the contrary, previous studies in human ALL mouse models revealed that lymphocytic leukemia cells gathered around the periportal region and central vein [5, 13]. In xenogeneic GVHD mouse models, we formerly demonstrated that the upregulation of CXC chemokine in host mouse tissues and the high expression of CCR family in donor human T cells were associated with the localization of human cell invasion [18]. Human lymphocytes could not reach the region around Glisson’s sheath, so that human PBMC transplantation should not have strong graft-versus-tumor effects in THP-1 leukemia mice. These results suggest that it is important to know about the homing and localization of tumor cells in mouse models for evaluating anti-leukemia treatment using these tumor models, especially cellular immunotherapy such as transplantation and chimeric antigen receptor T cells.
To date, a few reports have described the localization of tumor cells in leukemia mouse models, but the route of tumor administration generally determines the target organs invaded by the tumor cells. For example, a tumor cell line grew in the lungs, kidneys, spleen and bone marrow after i.v. injection, but did not invade the lungs or bone marrow following i.p. injection [8]. Indeed, both of our i.v. models showed the massive invasion of tumor cells into the liver, lungs and spleen, but not the gut. Consistently, the liver seemed to be the most affected organ and the intestine was the least affected organ, as in i.v.-injected models, [4, 8, 13, 14, 18]. In contrast, tumor invasion in the gut was observed in an i.p. model [8]. Another recent report showed that leukemia cells thoroughly engrafted into circulating peripheral blood, spleen and bone marrow using intrahepatic tumor administration in newborn mice [9]. Intracellular gaps of discontinuous capillaries might be associated with cells, especially in the liver and spleen, to permeate proteins, which could help with tumor cell proliferation [12]. These results suggest that the abundance/permeability of capillaries and high supply of blood flow are critical factors that help determine the possibility of tumor cell invasion in organs following i.v. administration.
In conclusion, we examined the localization of tumor cells invading multiple organs in two leukemic mouse models using THP-1 or A20 cells. THP-1 and A20 cells massively infiltrated the liver, lung, and spleen but had different distributions in the bone marrow and liver. To clarify the mechanisms of tumor localization among organs, further molecular studies are needed.
V. Conflicts of Interest
The authors declare that there are no conflicts of interest.
VI. Acknowledgments
The authors would like to thank Dr. Tom Koki, Dr. Shinya Mochizuki, Ms. Megumi Yatabe, Dr. Yoko Fujiwara, Dr. Hiroko Hayakawa, Dr. Janyerkye Tulyeu, Ms. Fujianti Casmad, Ms. Chortip Sajjaviriya, Mr. Thanachai Methatham and all of our colleagues at Jichi Medical University for their helpful advice.
VII. References
- 1.Baden T. J. and Gammon W. R. (1987) Leukemia cutis in acute myelomonocytic leukemia. Arch. Dermatol. 123; 88–90. [PubMed] [Google Scholar]
- 2.Bakst R. L., Tallman M. S., Douer D. and Yahalom J. (2011) How I treat extramedullary acute myeloid leukemia. Blood 118; 3785–3793. [DOI] [PubMed] [Google Scholar]
- 3.Byrd J. C., Edenfield W. J., Shields D. J. and Dawson N. A. (1995) Extramedullary myeloid cell tumors in acute nonlymphocytic leukemia: a clinical review. J. Clin. Oncol. 13; 1800–1816. [DOI] [PubMed] [Google Scholar]
- 4.Cesano A., O’Connor R., Lange B., Finan J., Rovera G. and Santoli D. (1991) Homing and progression patterns of childhood acute lymphoblastic leukemias in severe combined immunodeficiency mice. Blood 77; 2463–2474. [PubMed] [Google Scholar]
- 5.De Lord C., Clutterbuck R., Powles R., Morilla R., Hanby A., Titley J., Min T. and Millar J. (1994) Growth of primary human acute lymphoblastic and myeloblastic leukemia in SCID mice. Leuk. Lymphoma 16; 157–165. [DOI] [PubMed] [Google Scholar]
- 6.Döhner H., Weisdorf D. J. and Bloomfield C. D. (2015) Acute myeloid leukemia. N. Engl. J. Med. 373; 1136–1152. [DOI] [PubMed] [Google Scholar]
- 7.Ehx G., Fransolet G., de Leval L., D’Hondt S., Lucas S., Hannon M., Delens L., Dubois S., Drion P., Beguin Y., Humblet-Baron S. and Baron F. (2017) Azacytidine prevents experimental xenogeneic graft-versus-host disease without abrogating graft-versus-leukemia effects. Oncoimmunology 6; e1314425. [DOI] [PMC free article] [PubMed] [Google Scholar]
- 8.Ghetie M. A., Richardson J., Tucker T., Jones D., Uhr J. W. and Vitetta E. S. (1990) Disseminated or localized growth of a human B-cell tumor (Daudi) in SCID mice. Int. J. Cancer 45; 481–485. [DOI] [PubMed] [Google Scholar]
- 9.Her Z., Yong K. S. M., Paramasivam K., Tan W. W. S., Chan X. Y., Tan S. Y., Liu M., Fan Y., Linn Y. C., Hui K. M., Surana U. and Chen Q. (2017) An improved pre-clinical patient-derived liquid xenograft mouse model for acute myeloid leukemia. J. Hematol. Oncol. 162; 1–14. [DOI] [PMC free article] [PubMed] [Google Scholar]
- 10.Jabbour E., O’Brien S., Konopleva M. and Kantarjian H. (2015) New insights into the pathophysiology and therapy of adult acute lymphoblastic leukemia. Cancer 121; 2517–2528. [DOI] [PubMed] [Google Scholar]
- 11.Jacoby E., Chien C. D. and Fry T. J. (2014) Murine models of acute leukemia: important tools in current pediatric leukemia research. Front. Oncol. 4; 95. [DOI] [PMC free article] [PubMed] [Google Scholar]
- 12.Johnson, L. (2003) Essential Medical Physiology 3rd ed., Elsevier/Academic Press, United States, pp. 217–225. [Google Scholar]
- 13.Kamel-Reid S., Letarte M., Sirard C., Doedens M., Grunberger T., Fulop G., Freedman M. H., Phillips R. A. and Dick J. E. (1989) A model of human acute lymphoblastic leukemia in immune-deficient SCID mice. Science 246; 1597–1600. [DOI] [PubMed] [Google Scholar]
- 14.Kamel-Reid S., Letarte M., Doedens M., Greaves A., Murdoch B., Grunberger T., Lapidot T., Thorner P., Freedman M. H. and Phillips R. A. (1991) Bone marrow from children in relapse with pre-B acute lymphoblastic leukemia proliferates and disseminates rapidly in SCID mice. Blood 78; 2973–2981. [PubMed] [Google Scholar]
- 15.Kanda Y. (2013) Investigation of the freely available easy-to use software ‘EZR’ for medical statistics. Bone Marrow Transplant. 48; 452–458. [DOI] [PMC free article] [PubMed] [Google Scholar]
- 16.Kawasaki Y., Sato K., Hayakawa H., Takayama N., Nakano H., Ito R., Mashima K., Oh I., Minakata D., Yamasaki R., Morita K., Ashizawa M., Yamamoto C., Hatano K., Fujiwara S. I., Ohmine K., Muroi K. and Kanda Y. (2018) Comprehensive analysis of the activation and proliferation kinetics and effector functions of human lymphocytes, and antigen presentation capacity of antigen-presenting cells in xenogeneic graft-versus-host disease. Biol. Blood Marrow Transplant. 24; 1563–1574. [DOI] [PubMed] [Google Scholar]
- 17.Kawasaki Y., Sato K., Nakano H., Hayakawa H., Izawa J., Takayama N., Mashima K., Oh I., Minakata D., Yamasaki R., Morita K., Ashizawa M., Yamamoto C., Hatano K., Fujiwara S. I., Ohmine K., Muroi K., Ito R., Hayakawa M., Ohmori T. and Kanda Y. (2019) Alloreactive T cells display a distinct chemokine profile in response to conditioning in xenogeneic GVHD models. Transplantation 103; 1834–1843. [DOI] [PubMed] [Google Scholar]
- 18.Lapidot T., Sirard C., Vormoor J., Murdoch B., Hoang T., Caceres-Cortes J., Minden M., Paterson B., Caligiuri M. A. and Dick J. E. (1994) A cell initiating human acute myeloid leukaemia after transplantation into SCID mice. Nature 367; 645–648. [DOI] [PubMed] [Google Scholar]
- 19.Mamdouh Z., Chen X., Pierini L. M., Maxfield F. R. and Muller W. A. (2003) Targeted recycling of PECAM from endothelial surface-connected compartments during diapedesis. Nature 421; 748–753. [DOI] [PubMed] [Google Scholar]
- 20.National Cancer Institute (2013) SEER cancer statistics review. Leukemia, annual incidence rates (acute lymphocytic leukemia). [Google Scholar]
- 21.Ohanian M., Faderl S., Ravandi F., Pemmaraju N., Garcia-Manero G., Cortes J. and Estrov Z. (2013) Is acute myeloid leukemia a liquid tumor? Int. J. Cancer 133; 534–543. [DOI] [PMC free article] [PubMed] [Google Scholar]
- 22.Ohnuma K., Hatano R., Aune T. M., Otsuka H., Iwata S., Dang N. H., Yamada T. and Morimoto C. (2015) Regulation of pulmonary graft-versus-host disease by IL-26+CD26+CD4 T lymphocytes. J. Immunol. 94; 3697–3712. [DOI] [PMC free article] [PubMed] [Google Scholar]
- 23.Okada S., Vaeteewoottacharn K. and Kariya R. (2018) Establishment of a patient-derived tumor xenograft model and application for precision cancer medicine. Chem. Pharm. Bull. (Tokyo) 66; 225–230. [DOI] [PubMed] [Google Scholar]
- 24.Palmieri C., Falcone C., Iaccino E., Tuccillo FM., Gaspari M., Trimboli F., De Laurentiis A., Luberto L., Pontoriero M., Pisano A., Vecchio E., Fierro O., Panico MR., Larobina M., Gargiulo S., Costa N., Dal Piaz F., Schiavone M., Arra C., Giudice A., Palma G., Barbieri A., Quinto I. and Scala G. (2010) In vivo targeting and growth inhibition of the A20 murine B-cell lymphoma by an idiotype-specific peptide binder. Blood 116; 226–238. [DOI] [PubMed] [Google Scholar]
- 25.Skayneh H., Jishi B., Hleihel R., Hamieh M., Darwiche N., Bazarbachi A., Sabban M. and Hajj H. (2019) A critical review of animal models used in acute myeloid leukemia pathophysiology. Genes (Basel) 10; E614. doi: 10.3390/genes10080614. [DOI] [PMC free article] [PubMed] [Google Scholar]
- 26.Solh M., Solomon S., Morris L., Holland K. and Bashey A. (2016) Extramedullary acute myelogenous leukemia. Blood Rev. 30; 333–339. [DOI] [PubMed] [Google Scholar]
- 27.Taniguchi A., Susa T., Kogo H., Kogo A., Yokoo S. and Matsuzaki T. (2019) Long-term Pilocarpine Treatment Improves Salivary Flow in Irradiated Mice. Acta Histochem. Cytochem. 52; 45–58. [DOI] [PMC free article] [PubMed] [Google Scholar]


