

Abstract
The purpose of this paper is to analyze the effects of uncertainty shocks on airline employment in the light of the current global pandemic. The airline industry has faced many threats throughout history, but none quite as rapid and severe as the one posed by the spread of COVID-19. One constant during uncertainty shocks and industry downturns is that airline labor bears the brunt of the decline. As the industry reduces capacity amid the increase in travel restrictions, the post-stimulus impacts to airline labor are not known. Using time series analysis, the dynamics of historical uncertainty shocks to the industry are examined. During periods of uncertainty shocks, the estimated job loss is nearly 7% of the airline workforce with an upper bound of over 13%. Major airline employment is most impacted, while low-cost and regional airline employment is least impacted. The hardest hit employees are ones related to passenger handling and flight operations, while management employees fair slightly better during these uncertain periods. Further, recovery following uncertainty shocks is estimated to take between 4 and 6 years. Overall, the labor impacts to the airline industry from uncertainty events are substantial and provide insight into the expected industry job loss from COVID-19.
Keywords: Airline labor, COVID-19, Recessions, Uncertainty, Unemployment
Highlights
-
•
Examines the effects of uncertainty shocks such as the one posed by COVID-19 on US airline labor.
-
•
Results suggest that total airline employment will decrease by 7%–13%.
-
•
Major airline employees are hardest hit by the shock followed by low-cost then regional airlines.
-
•
Unskilled airline employees face the biggest threat during these workforce reductions.
1. Introduction
The global pandemic from the spread of COVID-19 has created uncertainty for many as quarantines, hospitalizations, and tragically, related-deaths continue to growth. Travel restrictions have reduced the mobility of individuals across the globe and the associated negative impacts have propagated to numerous industries. The transportation industry has been especially hard hit as air travel continues to shrink due to flight cancellations and capacity reductions. The airline industry has experienced a decrease in capacity of roughly 60–80% at major carriers (Josephs, 2020). As demand wains, further reductions by airlines are on the horizon. The indefinite timeline for removing social distancing and travel restrictions has increased uncertainty for the industry as a whole. In the U.S., the government has passed a large stimulus bill to assist the crippled industry (Gilbertson, 2020). Despite this stimulus to aid the wounded industry, the labor impacts of COVID-19 in the industry following expiration of stimulus-imposed requirements remain to be seen. This paper provides novel insight into the effects of uncertainty shocks to airline labor by examining the historical relationship between the industry and uncertainty shocks such as pandemics.
The interaction between pandemics and economic dynamics has been studied in theoretical modelling by Eichenbaum et al. (2020). Their model suggests that containment policies that promote reductions in consumption and work can reduce the number of deaths attributed to a pandemic. These policies unfortunately negatively impact the economy and worsen the effects of the subsequent recession. Another study, Barro et al. (2020), uses the Spanish flu and WWI deaths as proxies to quantify the economic impacts a nation could expect during a pandemic. Their analysis estimates that a nation on average will experience a 6% decline in consumption and an 8% decline in GDP. As the spread of COVID-19 continues, the expected decline in consumption is being realized as jobless claims reach nearly 10 million in March 2020 (Wolfers, 2020). Barro et al. (2020) also find increased stock market and interest rate volatility during these periods. Their work implies that situations similar to the current COVID-19 panic can result in financial conditions much like the Great Recession. Atkeson (2020) notes that models of the spread of COVID-19 suggest that social distancing and the associated economic tradeoffs could last for nearly 18 months. Additionally, McKibbin and Fernando (2020) use data from China to model the potential impacts from the COVID-19 spread. They find rough estimates of a 1%–5% shock to consumption, an equity risk premium shock of 1.07%–1.33%, and a labor supply shock of up to 1.4%.
The true economic and societal impacts from the COVID-19 pandemic are still materializing; however, the uncertainty surrounding the pandemic is evident and increasing as nations attempt to contain and mitigate the spread of the virus. Uncertainty is noted as a key driver in numerous recessions and uncertainty related economic shocks can propagate over time (Caggiano et al., 2014). These uncertainty shocks can be caused by many factors to include financial crises, terror-related events, disease outbreaks, and natural disasters. The fluctuations in uncertainty create a distorted view for individuals, businesses, and policymakers alike. Empirical economic research has addressed the topic of uncertainty shocks with respect to macroeconomic conditions. An increase in uncertainty tends to reduce real activity in an economy (Basu and Bundick, 2017). The contraction in real macroeconomic activity is caused by precautionary savings by individuals and businesses as well as the subsequent job losses. The Great Recession was driven by financial uncertainty in the market even as policymakers reduced policy rates (Ludvigson et al., 2015). This uncertainty overshadowed policymaker action given the constraints imposed by a federal funds rate near 0% (Caggiano et al., 2017). The current state of the economy is also noted as a determinant of the responsiveness of actors to uncertainty (Alessandri and Mumtaz, 2019). Gross domestic product growth and globalization impact an economy's responsiveness to these uncertainty shocks (Bloom, 2014). Globalization has created an interwoven system of economies connected by the robust air transportation network (Mahutga et al., 2010).
The airline industry has been threatened by global crises throughout history. From the oil embargo, airline deregulation, terrorist attacks, the industry has weathered many storms (Davies, 2016). The survival of an airline during and after these downturns is often related to the airline's business model. Franke and John (2011) note that the attacks on 9/11 caused a significant reduction in air travel and airlines struggled to remain operational. As the spread of SARS followed these events, demand only returned to pre-2001 levels in 2004 (Franke and John, 2011). During this period, low cost carriers gained market share as major air carriers struggled to recover as pricing competition increased (Tan, 2016). Rising fuel prices also hindered the recovery of the industry following 2001. Major airlines adjusted capacity to compensate for this increased cost leaving lower cost airlines opportunities to enter new markets (Sibdari et al., 2018). The Great Recession has further changed the network and routing structure of airlines as they attempt to mitigate the impacts of the decline in demand by cutting capacity (Pearce, 2012). Less noted in the literature are the industry workforce changes due to these shocks. Following 9/11, airlines moved to restructure their businesses to reduce both fixed and variable costs (von Nordenflycht and Gittell, 2013). These efforts were marked by employee layoffs and renegotiation of labor contracts. Even as airline demand was recovering, the industry was still plagued by continual job loss (Goodman, 2008). Bankruptcies and mergers during this period furthered the workforce reductions and labor contract renegotiations. The surviving employees were faced with wage and benefits cuts that varied depending upon occupation and ranged from 9% to 50% (von Nordenflycht and Gittell, 2013). Air travel demand levels returned to pre-recession levels within 18 months, signaling that even deep crises eventually correct. The current COVID-19 pandemic has disrupted the airline industry with the uncertainty of reduced capacity, weak demand, and an indefinite return to pre-2020 levels. The impact of the pandemic on the airlines is a continual source of debate for policymakers given the large economic impact and importance of the industry; however, the discussion concerning the post-stimulus airline labor impacts is typically an afterthought. This paper will add to the policy discussions by providing extensive insight into the expected impact on airline labor from the current crisis. Additionally, no known study uses historical industry data and econometric modelling to estimate the impact of uncertainty shocks on major, low-cost, and regional airline labor. This study represents the first attempt to model the impact of uncertainty shocks to airline labor.
The remaining sections of this paper are organized as follows: the next section provides a description of the data and the framework for modelling the uncertainty shocks to the industry and airline labor. Section 3 provides the results of the analysis and places them in the light of the current pandemic. Finally, Section 4 provides insight to policymakers and labor leaders as well as paths for future work.
2. Empirical strategy
Data are used from U.S. airline and government datasets from 1991 to 2019. Air travel data are from the Bureau of Transportation Statistics T-100 database. This data includes revenue passenger miles (RPMs), available seat miles (ASMs), and departures for each airline. Airline employment data are provided by airline Form 41 data as well as the data provider Cirium. Airlines are sorted into three categories: major, low-cost, and regional airlines. Within each airline, employee data was sorted into six different categories to provide a more detailed understanding of employees impacted. Many skilled airline employees at airlines (e.g. pilots, mechanics) are represented by labor organizations with lower levels of representation of low skilled airline workers (von Nordenflycht and Gittell, 2013). Table 1 provides a description of the employee categories and percentage makeup of the airline workforce. Economic variables such as gross domestic product (GDP) and crude oil prices are from the St. Louis Federal Reserve Economic Data. Stock market index data are from the CRSP database. Fig. 1 provides a macro viewpoint of the relationship between total air transportation related employment, the measure of airline supply (ASMs), and a volatility index (measured by the VIX volatility index discussed later). Until 2001, air transportation related employment followed the trend of growth in air transport; however, after 9/11 employment has declined while air transport has on average increased. Further, we notice that volatility spikes, as measured by the VIX, have a slight aftereffect on ASMs, but employment appears to follow a somewhat similar trend to average volatility over time.
Table 1.
Airline employee categories.
| Category | Example job title | % of total airline employment for carrier type |
||
|---|---|---|---|---|
| Major | Low-cost | Regional | ||
| Cargo handling | Cargo or freight agent | 9% | 1% | 1% |
| Aircraft handling | Line Service technician | 7% | 14% | 13% |
| Maintenance | Aircraft mechanic | 11% | 5% | 13% |
| Passenger handling | Passenger service agent | 45% | 48% | 37% |
| Aircrew | Pilot | 14% | 18% | 28% |
| Management | Manager | 7% | 6% | 4% |
| Other | Security | 7% | 8% | 4% |
As of 2019.
Fig. 1.
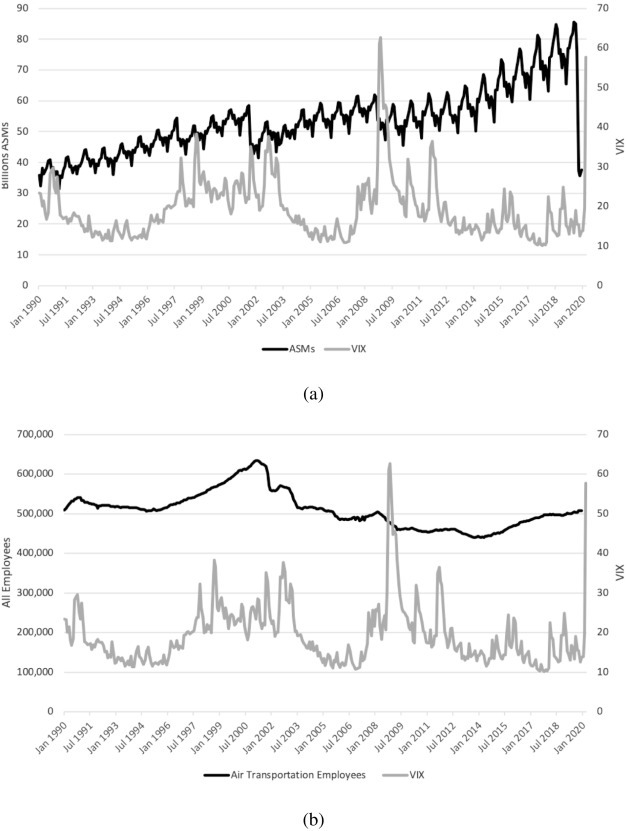
Data from 1990 to 2020 displaying (a) total U.S. airline ASMs and VIX volatility index and (b) all air transportation employees and VIX volatility index.
The primary model used in this study is the vector autoregression (VAR) model. Introduced by Sims (1980), the VAR models the joint dynamics of economic variables in time-series analysis. VAR models are an extension of univariate autoregressive models where all variables in the multi-equation system are treated as endogenous (Greene, 2011). The VAR model without constraints on the coefficients is considered a seemingly unrelated regression model and regression on each equation provides the maximum likelihood estimates for the coefficients of the lagged variables. The VAR model allows for feedback between variables of interest in a multi-equation system and affords the opportunity to analyze the real effects of uncertainty shocks in a dynamic system. Several measures of uncertainty shocks will be used in this analysis. The first measure of uncertainty is the stock market volatility measured by VIX. The VIX is the most commonly used measure of uncertainty shocks in the macroeconomic literature (e.g. Bloom et al., 2007; Caggiano et al., 2018). It provides a forward-looking measure of uncertainty over the next period (Bloom, 2014). The second measure is the index of consumer expectation (ICE) from the University of Michigan (Colombo, 2013; Leduc and Liu, 2016). This index is derived from surveys of households asking about expectations related to future economic and business conditions. The ICE allows for a forward-looking indicator of movement in consumer behavior which is akin to a shock in aggregate demand. Finally, we also build an uncertainty indicator similar to the one constructed in Bloom (2009). Using information of uncertainty events related to volatility in the stock market (Bloom, 2009) and volatility in the airline industry (Franke and John, 2011), the built indicator will take the value 1 when an uncertainty event occurs and 0 otherwise. Table 2 displays the list of events used in this study to develop this uncertainty indicator.
Table 2.
Uncertainty Events.
| Event | Year(s) | Event type |
|---|---|---|
| Gulf Crisis/Gulf War I | 1990/1991 | War |
| Asian Crisis | 1998 | Economic |
| 9/11 Attacks | 2001 | Terrorism |
| SARs | 2003 | Epidemic |
| Great Recession | 2008/2009 | Economic |
The VAR model used to examine the uncertainty shocks and their relation to economic variables is given by:
| (1) |
where y t is the vector of endogenous variables ordered uncertainty shocks indicator, log of GDP, log of airline employment, V is the vector of constants, Γ is a matrix of coefficients, β is a matrix of coefficients, X t is a vector of exogenous variables, and u t is the vector of white noise. The order of the variables in y are based on economic theoretic assumptions that shocks impact the stock market instantaneously, followed by prices, then real quantities such as output and employment. The ordering of these variables will be varied during checks for robustness. The time series properties of the data are important to address before proceeding with any estimation.
To estimate the parameters of the VAR, the variables used in the estimation are required to be covariance stationary. The error-correction representation of a VAR, a vector error correction model (VECM), may be more appropriate if the variables in y t are not covariance stationary. The augmented Dickey-Fuller (ADF) test will be conducted to investigate the degree of integration of the variables (Elliott, 1998). Additionally, a test for the presence of a unit root in the variables developed in Phillips (1987) and Phillips and Perron (1988) will be used to account for the potential heteroskedasticity in the residuals. The results of these tests on the five endogenous variables (including alternate measures of uncertainty) are displayed in Table 3 . The null hypothesis of the ADF test is that the process is a random walk or that a unit root does exist. We fail to reject the null hypothesis for GDP, EMP, and OIL variables in levels, but reject the null hypothesis for ASM and all uncertainty variables in levels and the first differences. The ADF test suggests that the ASM and all uncertainty variables in levels and the first differences of GDP, EMP, and OIL are I(0). The results of the Phillips-Perron test also indicate that the variables GDP, EMP, and OIL are I(1), while ASM and all uncertainty variables are I(0). Therefore, these results combined suggest that all of the series are I(1) with the exception of ASM and all uncertainty variables.
Table 3.
Unit-roots tests.
| Variables | Dickey-Fuller |
Phillips-Perron |
||||
|---|---|---|---|---|---|---|
| Levels | 1st Difference | Levels |
1st Difference |
|||
| μa | tb | μa | tb | |||
| GDP | −2.696 | −18.306⁎ | −10.410 | −1.982 | −359.543⁎ | −18.336⁎ |
| ASM | −3.858⁎ | −23.965⁎ | −23.689⁎ | −3.552⁎ | −436.360⁎ | −24.053⁎ |
| EMP | −1.382 | −11.272⁎ | −2.206 | −1.049 | −204.189⁎ | −11.603⁎ |
| OIL | −2.059 | −12.681⁎ | −6.280 | −1.792 | −216.650⁎ | −12.591⁎ |
| VOL (VIX) | −5.903⁎ | −21.787⁎ | −61.634⁎ | −5.809⁎ | −363.828⁎ | −22.490⁎ |
| VOL (ICE) | −4.451⁎ | −9.284⁎ | −25.512⁎ | −5.203⁎ | −144.887⁎ | −9.419⁎ |
| VOL (Index) | −4.275⁎ | −19.066⁎ | −21.433⁎ | −4.571⁎ | −477.913⁎ | −19.629⁎ |
a,b Phillips-Perron test statistic without a trend, μ, and with a trend, t.
Indicates rejection at the 1% level.
Given these series are I(1) in levels, a common trend may exist. If the variables exhibit a common long-run trend, then the variables are considered cointegrated. When one or more cointegrating relationship exists in the series, then estimations using linear VAR models would provide spurious long-run results and a VECM would be more appropriate. Therefore, testing for cointegration is conducted using the Johansen-Juselius test (Johansen, 1988; Johansen and Juselius, 1990). The Johansen maximum likelihood approach is used to test for cointegration, and the appropriate variable lag length is determined by using an Akaike Information Criterion (AIC), likelihood ratio test, and Schwarz Criterion (SC). The appropriate lag length is determined to be four and using this lag length will reduce the possibility of over parameterization. Table 4 summarizes the results of the cointegration test. The results suggest that we fail to reject the null hypothesis of no integration for each of the specifications. Since these results suggest no cointegration exists, then we employ the VAR model with lag order of four.
Table 4.
Cointegration tests.
| Hypothesis | r = 0 | r ≤ 2 | r ≤ 3 | r ≤ 4 | |
|---|---|---|---|---|---|
| ASM specification | Trace Statistic | 63.76⁎ | 36.52⁎ | 18.38⁎ | 6.68⁎ |
| Log Likelihood | 2991.38 | 2999.82 | 3001.32 | 3002.57 | |
| EMP specification | Trace Statistic | 55.35⁎ | 35.26⁎ | 23.47⁎ | 3.78⁎ |
| Log Likelihood | 2972.96 | 2975.96 | 2976.31 | 2977.42 |
Indicates rejection at the 5% level. Variables include GDP, OIL, VOL with lag order of four.
3. Results
The impulse response function for total industry ASMs is provided in Fig. 2 . An initial decline of nearly 0.04% in all ASMs in the U.S. occurs following an uncertainty shock. This decline in ASMs is sustained for nearly five periods which corresponds to previous literature describing industry shocks (Franke and John, 2011; Jean and Lohmann, 2016). Pre-shock ASM levels eventually return; however, this return to pre-shock levels is sluggish as seen in the IRF and noted in the aforementioned studies. Given the contraction in air transportation production (ASMs) following these uncertainty shocks, economic studies suggest that employment will decline as production falls (Altug et al., 2012; Bhadra, 2009; Dixit, 1997). These results provide additional motivation to investigate the change in employment from the related shocks. We now examine the change in airline employment from an uncertainty shock.
Fig. 2.
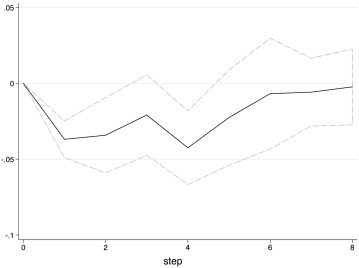
Change in ASMs from an uncertainty shock.
The IRFs for the three categories of airlines are displayed in Fig. 3 . An uncertainty shock, as measured by the uncertainty indicator, has a negative impact on major airline employment and the decline is sustained through the remaining periods. This result is explained by the large financial exposure of major airlines and the larger payroll liabilities of these airlines. Major airlines are more greatly impacted by these shocks due to their inflexible business model versus low-cost carriers (Neal and Kassens-Noor, 2011) This inflexibility negatively impacts employment at these airlines as they shed employees along with capacity during uncertainty shocks. This result would lead us to expect that major airline employees will receive the brunt of industry job loss following an uncertainty shock such as the recent pandemic. Low-cost carriers experience a sharp decline of approximately 0.035% but recover quickly most likely as a result of their business model and lower employee wages. The low-cost model affords these carriers the ability to offer lower fares which would be more attractive during periods of uncertainty (Cho and Min, 2018). This result aligns with previous findings that low-cost carriers rebounded quickly to 9/11 following an initial decline (Franke, 2004). Therefore, we would expect that employment at these airlines would only suffer in the short run following the uncertainty shock such as this pandemic. Regional airlines display an increase in employment following an uncertainty shock with greater fluctuations in total employment. This result could be caused by major airlines using regional carriers to operate on routes with smaller, more efficient aircraft and lower relative ASMs. The contracting of regionals by major airlines has been well documented in the literature to aid in shedding costs for major airlines (Tan, 2018). Therefore, employment at regional airlines is expected to increase as travel restrictions are lifted, the uncertainty shock is dated, and major airlines attempt to further reduce costs by contracting with regional carriers.
Fig. 3.
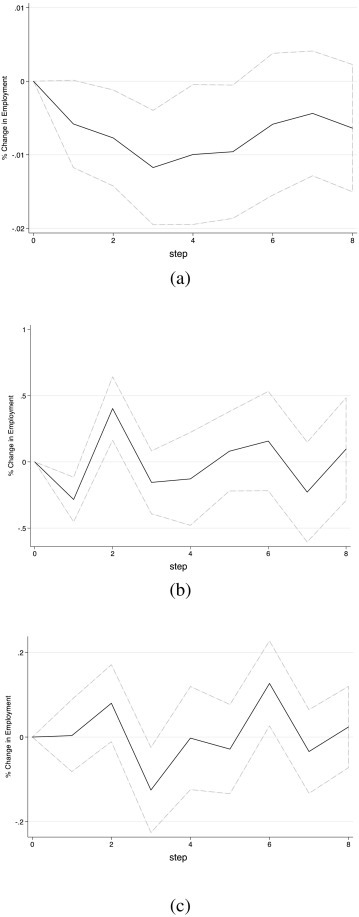
The response of employment to an uncertainty shock for (a) major, (b) low-cost, and (c) regional airlines.
The measure of uncertainty shocks using the uncertainty index is now tested against the other measures of uncertainty described in Section 2. These checks of robustness allow for a more stringent examination of the impact of uncertainty that aligns with common measures in the literature. Fig. 4 provides the combined IRFs for total employment at major, low-cost, and regional airlines. Uncertainty shocks have a negative impact on major airlines regardless of the uncertainty measure used. Using the VIX, major airlines experience a steeper initial decline in total employment following an uncertainty shock, low-cost airline employment appears more volatile, and regional airline employment is almost unaffected. The ICE metric produces a similar declination as observed with the uncertainty index for major and low-cost airlines with a slightly deeper negative impact in latter periods for major airlines. The constructed index provides an averaged impact on employment for major airlines and low-cost airlines relative to VIX and ICE. The regional airline employment IRF using the uncertainty index aligns with the results from the VIX and ICE when examining the interval created by two standard errors. Using these results, estimates of the total impact of these shocks to employment are calculated. The baseline estimated job loss is over 32,000 employees. Using the two standard errors, the impact is estimated to range between 5500 and 64,000. That corresponds to an approximate decline of nearly 7% of the airline workforce with a range between 1%–13%.
Fig. 4.
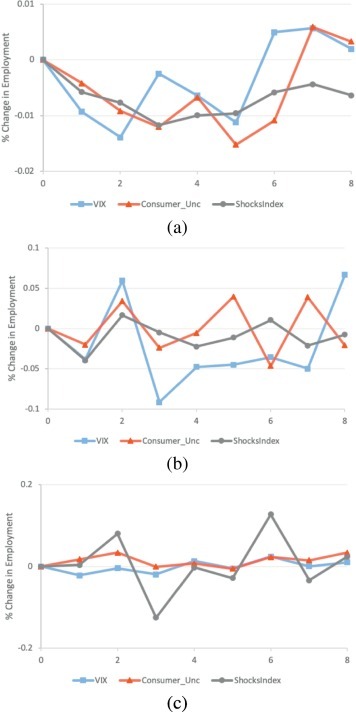
IRFs for varying uncertainty shock measures for (a) major, (b) low-cost, and (c) regional airlines.
Examining the employment impact of uncertainty shocks for different employee categories provides insight into the occupations facing the greatest threat from uncertainty shocks. Fig. 5, Fig. 6, Fig. 7 provide the IRFs for different airline category employees at major, low-cost, and regional airlines. Uncertainty shocks cause an initial decline in cargo handling employees at major airlines likely due to the decline in capacity. Passenger handling occupations such as ticket or gate agent see the largest shocks and volatility from uncertainty shocks. Comprising >45% of the total major airline workforce, these occupations appear to be the first line of cost shedding for airlines during uncertainty shocks. Initial declines in maintenance and aircrew are observed following these uncertainty shocks. These declines are evident in the literature as furloughs of these employees at major airlines typically occur in the early stages of the shock. These occupations are unaffected in later periods most possibly due to skilled nature of the workforce and requirement of a minimum number of pilots, flight attendants, and aircraft maintainers. Management positions show no statistically significant impact from uncertainty shocks at major airlines possibly due to the low proportion of employees in this category.
Fig. 5.
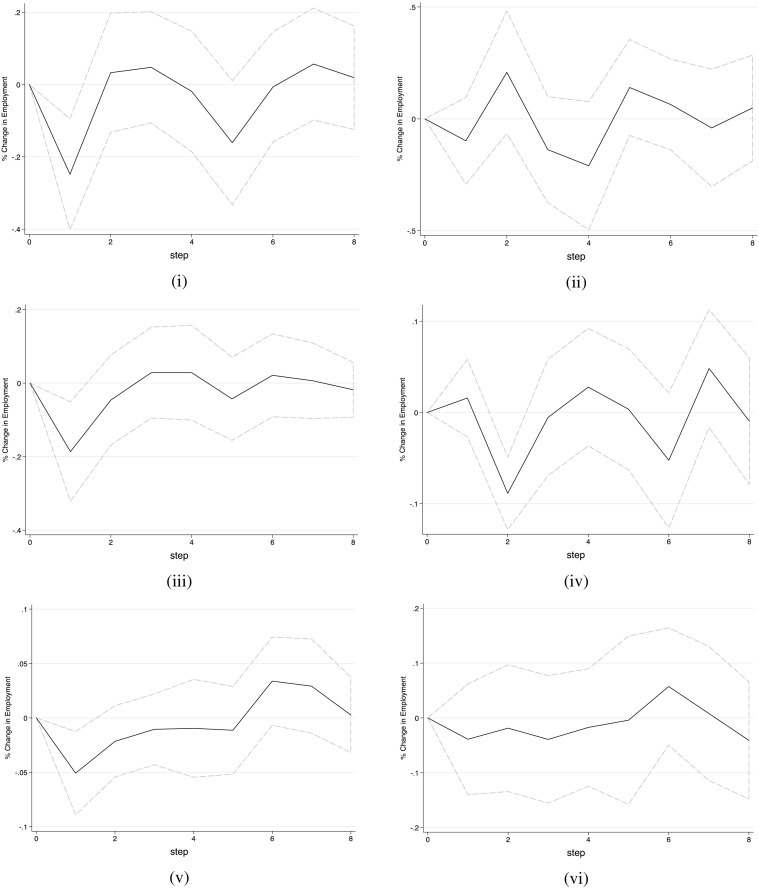
IRFs for major airline individual employee categories (i) cargo handling, (ii) aircraft handling, (iii) maintenance, (iv) passenger handling, (v) aircrew, and (vi) management.
Fig. 6.
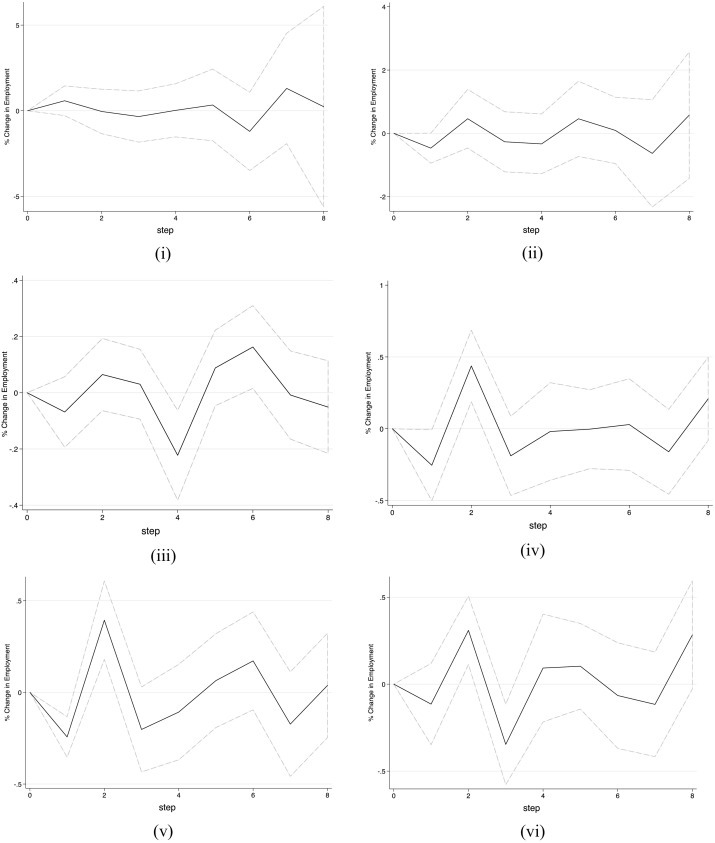
IRFs for low-cost airline individual employee categories (i) cargo handling, (ii) aircraft handling, (iii) maintenance, (iv) passenger handling, (v) aircrew, and (vi) management.
Fig. 7.
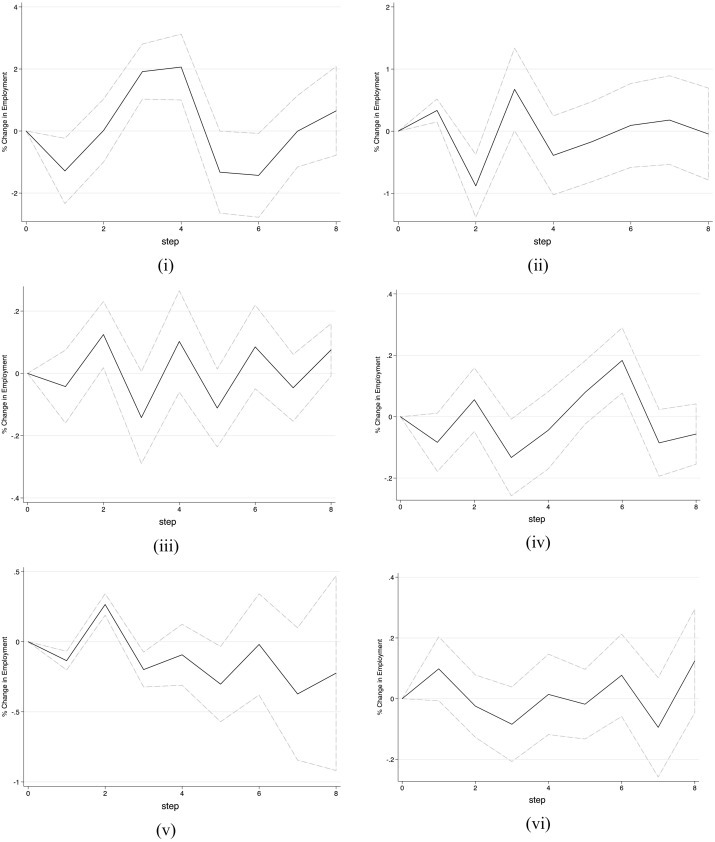
IRFs for regional airline individual employee categories (i) cargo handling, (ii) aircraft handling, (iii) maintenance, (iv) passenger handling, (v) aircrew, and (vi) management.
For low-cost airlines, an uncertainty shock has small negative impacts on aircrew, but these are quickly recovered as operations for low-cost airlines tend to increase post shock. The increase in operations in later periods as low-cost carriers increase capacity following the shock increases employment in passenger handling, aircrew, and management. These increases in employment post-shock appear to diminish in later periods as major airlines increase their capacity and low-cost airlines slow expansion (Atallah et al., 2018). Examining the impacts on regional airlines employees, cargo handling, passenger handling, and aircrew experience an increase in employment in the early periods following an uncertainty shock. This result is consistent with the increase in operations experienced by the transition from major airline flights to contracted regional carrier operations. As capacity increases for these carriers due to their low operating costs relative to major airlines, then demand for aircrew and passenger handling employees increases. This spike in employment is tempered in later periods as major airlines recover from the uncertainty shock and regional airline employment becomes less attractive. The other employee categories at regional airlines, to include management and maintenance are found to not be statistically impacted by the uncertainty shocks.
4. Conclusion
The pandemic arising from the spread of COVID-19 has caused airlines to reduce capacity and lobby the government for emergency relief. As these reductions in capacity continue to grow and the post-stimulus employment requirements expire, the uncertain future of the airline workforce is apparent. To provide insight into the movements of airline employment during uncertainty shocks to the industry, this paper examined the dynamic interactions among economic and industry variables when exposed to these types of shocks. As shown, ASMs decline during uncertainty shocks and this decline in capacity can last for years. The uncertainty shock due to the events of September 11, 2001 caused a halt in air traffic throughout the U.S. that lasted several days. Although air travel has yet to be completely curtailed, COVID-19 is causing airlines around the globe to reduce capacity due to travel restrictions and/or out of diminishing demand. The results of this analysis suggest that employees at major airlines will be the most impacted during uncertain times such as the one faced today by the global pandemic. The major airlines' size and financial exposure increase their vulnerability to uncertainty shocks throughout history. This analysis has shown that employment reductions are the likely response these airlines have to uncertain times such as the one facing the industry today. In total, approximately 7% of the airline workforce will be displaced by these shocks. Due to the global nature and severity of the shock of COVID-19, the impact may be of the magnitude near the upper bound of the estimates with a reduction of over 13% of the airline workforce.
Another finding is that the low-cost and regional airlines' business models afford these airlines the ability to weather uncertain times without the large employment reductions seen by the major carriers. One explanation is that these airlines are built around low fares driven by low costs of operation. The already lean nature of these airlines may make them more able at allocating personnel in a cost-effective manner. Regional airlines receive a boost during these periods as major airlines contract out routes to these airlines. The lower costs related to personnel and aircraft make them ripe candidates for substitution of major airline capacity. These changes ultimately diminish as demand recovers post uncertainty shock and major carriers resume mainline operations. Another important finding of this study is that certain categories of employees will face deeper workforce cuts than others. The occupations related to passenger handling at major airlines are noted as a category that is hardest hit and could benefit most from a safety net such as career transition assistance. The lower skilled employees at airlines appear to receive the majority of the impact from workforce reductions. This finding aligns with prior economic research related to workforce reductions due to uncertainty. The implications to policymakers from these findings are that resources should be devoted to the less skilled employees working at airlines. As many of these employees are not represented by labor unions, the at-will nature of their employment may make them more susceptible to workforce reductions (Slotnick, 2020). It would appear unlikely to organize all airline workers as airlines have increasingly lowered the percentage of organized workers in their employee counts via anti-union campaigns and outsourcing (Hiltzik, 2019).
As COVID-19 continues to reduce air travel and airline capacity, future analyses could provide a more complete picture of the impacts by accounting for the indirect effects to employment. Although beyond the focus of this study, the implications to employment that is tied to the transport of passengers and cargo via air travel are vitally important. Without the related tourism, business travel, flow of goods, etc., these indirect employees will likely experience workforce reductions as well. An accurate account of both the direct and indirect effects would also highlight the truly vital nature of air transportation and the need to understand the dynamics of the industry to uncertainty shocks such as this one.
References
- Alessandri P., Mumtaz H. Financial regimes and uncertainty shocks. J. Monet. Econ. 2019;101:31–46. doi: 10.1016/j.jmoneco.2018.05.001. [DOI] [Google Scholar]
- Altug S., Tan B., Gencer G. Cyclical dynamics of industrial production and employment: Markov chain-based estimates and tests. J. Econ. Dyn. Control. 2012;36(10):1534–1550. doi: 10.1016/j.jedc.2012.03.016. [DOI] [Google Scholar]
- Atallah S., Hotle S.L., Mumbower S. The evolution of low-cost carrier operational strategies pre-and post-recession. J. Air Transp. Manag. 2018;73:87–94. doi: 10.1016/j.jairtraman.2018.08.011. [DOI] [Google Scholar]
- Atkeson A. National Bureau of Economic Research; 2020. What Will Be the Economic Impact of COVID-19 in the US? Rough Estimates of Disease Scenarios (No. w26867) [DOI] [Google Scholar]
- Barro R., Ursua J., Weng J. National Bureau of Economic Research; 2020. The Coronavirus and the Great Influenza Pandemic: Lessons from the “Spanish Flu” for the Coronavirus’s Potential Effects on Mortality and Economic Activity (No. w26866) [DOI] [Google Scholar]
- Basu S., Bundick B. Uncertainty shocks in a model of effective demand. Econometrica. 2017;85(3):937–958. doi: 10.3982/ECTA13960. [DOI] [Google Scholar]
- Bhadra D. Race to the bottom or swimming upstream: performance analysis of US airlines. J. Air Transp. Manag. 2009;15(5):227–235. doi: 10.1016/j.jairtraman.2008.09.014. [DOI] [PMC free article] [PubMed] [Google Scholar]
- Bloom N. The impact of uncertainty shocks. Econometrica. 2009;77(3):623–685. doi: 10.3982/ECTA6248. [DOI] [Google Scholar]
- Bloom N. Fluctuations in uncertainty. J. Econ. Perspect. 2014;28(2):153–176. doi: 10.1257/jep.28.2.153. [DOI] [Google Scholar]
- Bloom N., Bond S., Van Reenen J. Uncertainty and investment dynamics. Rev. Econ. Stud. 2007;74(2):391–415. doi: 10.1111/j.1467-937X.2007.00426.x. [DOI] [Google Scholar]
- Caggiano G., Castelnuovo E., Groshenny N. Uncertainty shocks and unemployment dynamics in US recessions. J. Monet. Econ. 2014;67:78–92. doi: 10.1016/j.jmoneco.2014.07.006. [DOI] [Google Scholar]
- Caggiano G., Castelnuovo E., Pellegrino G. Estimating the real effects of uncertainty shocks at the zero lower bound. Eur. Econ. Rev. 2017;100:257–272. doi: 10.1016/j.euroecorev.2017.08.008. [DOI] [Google Scholar]
- Caggiano G., Castelnuovo E., Figueres J.M. Economic policy uncertainty spillovers in booms and busts. Oxf. Bull. Econ. Stat. 2018 doi: 10.1111/obes.12323. [DOI] [Google Scholar]
- Cho W., Min D.J. Longitudinal examination of passenger characteristics among airline types in the US. J. Air Transp. Manag. 2018;72:11–19. doi: 10.1016/j.jairtraman.2018.06.004. [DOI] [Google Scholar]
- Colombo V. Economic policy uncertainty in the US: does it matter for the euro area? Econ. Lett. 2013;121(1):39–42. doi: 10.1016/j.econlet.2013.06.024. [DOI] [Google Scholar]
- Davies R.E.G. Smithsonian Institution; 2016. Airlines of the Jet Age: A History. [Google Scholar]
- Dixit A. Investment and employment dynamics in the short run and the long run. Oxf. Econ. Pap. 1997;49(1):1–20. doi: 10.1093/oxfordjournals.oep.a028592. [DOI] [Google Scholar]
- Eichenbaum M., Rebelo S., Trabandt M. National Bureau of Economic Research; 2020. The Macroeconomics of Epidemics (No. w26882) [DOI] [Google Scholar]
- Elliott G. On the robustness of cointegration methods when regressors almost have unit roots. Econometrica. 1998;66(1):149–158. doi: 10.2307/2998544. [DOI] [Google Scholar]
- Franke M. Competition between network carriers and low-cost carriers—retreat battle or breakthrough to a new level of efficiency? J. Air Transp. Manag. 2004;10(1):15–21. doi: 10.1016/j.jairtraman.2003.10.008. [DOI] [Google Scholar]
- Franke M., John F. What comes next after recession? — Airline industry scenarios and potential end games. J. Air Transp. Manag. 2011;17(1):19–26. doi: 10.1016/j.jairtraman.2010.10.005. [DOI] [Google Scholar]
- Gilbertson D. US airlines must continue flying if they accept coronavirus relief. USA Today, 31 March. 2020. https://www.usatoday.com/story/travel/airline-news/2020/03/31/coronavirus-stimulus-package-us-airlines-must-continue-flying/5093641002/ Available at:
- Goodman C.J. Takeoff and descend of airline employment. Monthly Lab. Rev. 2008;131:3. [Google Scholar]
- Greene W. Seventh edition. Pearson; 2011. Econometric Analysis. [Google Scholar]
- Hiltzik M. Column: In anti-union campaign, Delta becomes latest firm offering dumb financial advice. Los Angeles Times, 13 May. 2019. https://www.latimes.com/business/hiltzik/la-fi-hiltzik-delta-union-20190513-story.html Available at:
- Jean D.A., Lohmann G. Revisiting the airline business model spectrum: the influence of post global financial crisis and airline mergers in the US (2011−2013) Res. Transp. Bus. Manag. 2016;21:76–83. doi: 10.1016/j.rtbm.2016.06.002. [DOI] [Google Scholar]
- Johansen S. Statistical analysis of cointegration vectors. J. Econ. Dyn. Control. 1988;12(2–3):231–254. doi: 10.1016/0165-1889(88)90041-3. [DOI] [Google Scholar]
- Johansen S., Juselius K. Maximum likelihood estimation and inference on cointegration — with applications to the demand for money. Oxf. Bull. Econ. Stat. 1990;52(2):169–210. doi: 10.1111/j.1468-0084.1990.mp52002003.x. [DOI] [Google Scholar]
- Josephs L. American Airlines cutting international summer schedule by 60% as coronavirus drives down demand. CNBC News, 2 April. 2020. https://www.cnbc.com/2020/04/02/coronavirus-update-american-airlines-cuts-summer-international-flights-by-60percent-as-demand-suffers.html Available at:
- Leduc S., Liu Z. Uncertainty shocks are aggregate demand shocks. J. Monet. Econ. 2016;82:20–35. doi: 10.1016/j.jmoneco.2016.07.002. [DOI] [Google Scholar]
- Ludvigson S.C., Ma S., Ng S. National Bureau of Economic Research; 2015. Uncertainty and Business cycles: Exogenous Impulse or Endogenous Response? (No. w21803) [Google Scholar]
- Mahutga, M.C., Ma, X., Smith, D.A., Timberlake, M., 2010. Economic globalisation and the structure of the world city system: the case of airline passenger data. Urban Stud., 47(9), 1925-1947. Doi: 10.1177/0042098010372684. [DOI]
- McKibbin W., Fernando R. The global macroeconomic impacts of COVID-19: seven scenarios. The Brookings Institution Report. 2020. https://www.brookings.edu/research/the-global-macroeconomic-impacts-of-covid-19-seven-scenarios/ Available at:
- Neal Z.P., Kassens-Noor E. The business passenger niche: comparing legacy carriers and southwest during a national recession. J. Air Transp. Manag. 2011;17(4):231–232. doi: 10.1016/j.jairtraman.2010.09.001. [DOI] [Google Scholar]
- von Nordenflycht A., Gittell J.H. In: Collective Bargaining Under Duress: Case Studies of Major US Industries. Stanger Howard R., Frost Ann C., Clark Paul F., editors. 2013. Context, process, and outcomes of collective bargaining in the US airline industry; pp. 9–43. [Google Scholar]
- Pearce B. The state of air transport markets and the airline industry after the great recession. J. Air Transp. Manag. 2012;21:3–9. doi: 10.1016/j.jairtraman.2011.12.011. [DOI] [Google Scholar]
- Phillips P.C. Time series regression with a unit root. Econometrica. 1987:277–301. doi: 10.2307/1913237. [DOI] [Google Scholar]
- Phillips P.C., Perron P. Testing for a unit root in time series regression. Biometrika. 1988;75(2):335–346. doi: 10.1093/biomet/75.2.335. [DOI] [Google Scholar]
- Sibdari, S., Mohammadian, I., Pyke, D.F., 2018. On the impact of jet fuel cost on airlines' capacity choice: evidence from the US domestic markets. Transp. Res. E, 111, 1–17. doi: 10.1016/j.tre.2017.12.009. [DOI]
- Sims C.A. Macroeconomics and reality. Econometrica. 1980;48(1):1–48. doi: 10.2307/1912017. [DOI] [Google Scholar]
- Slotnick D. US airport and airline contractors are being laid off nationwide and risk being forgotten in a bailout plan meant to protect workers. Bus. Insid. 2020 https://www.businessinsider.com/airline-contract-workers-laid-off-bailout-covid19-2020-3 24 March. Available at: [Google Scholar]
- Tan K.M. Incumbent response to entry by low-cost carriers in the US airline industry. South. Econ. J. 2016;82(3):874–892. doi: 10.1002/soej.12117. [DOI] [Google Scholar]
- Tan K.M. Outsourcing and price competition: an empirical analysis of the partnerships between legacy carriers and regional airlines. Rev. Ind. Organ. 2018;53(2):275–294. doi: 10.1007/s11151-017-9610-z. [DOI] [Google Scholar]
- Wolfers J. The unemployment rate is probably around 13 percent. New York Times. 2020 https://www.nytimes.com/2020/04/03/upshot/coronavirus-jobless-rate-great-depression.html 3 April. Available at: [Google Scholar]