

Abstract
mRNA processing is highly regulated during development through changes in RNA-binding protein (RBP) activities. CUG-BP, Elav-like family member 1 (CELF1, also called CUGBP1) is an RBP, the expression of which decreases in skeletal muscle soon after birth. CELF1 regulates multiple nuclear and cytoplasmic RNA processing events. In the nucleus, CELF1 regulates networks of postnatal alternative splicing (AS) transitions, while in the cytoplasm, CELF1 regulates mRNA stability and translation. Stabilization and misregulation of CELF1 has been implicated in human diseases including myotonic dystrophy type 1, Alzheimer’s disease and multiple cancers. To understand the contribution of nuclear and cytoplasmic CELF1 activity to normal and pathogenic skeletal muscle biology, we generated transgenic mice for doxycycline-inducible and skeletal muscle-specific expression of active CELF1 mutants engineered to be localized predominantly to either the nucleus or the cytoplasm. Adult mice expressing nuclear, but not cytoplasmic, CELF1 are characterized by strong histopathological defects, muscle loss within 10 days and changes in AS. In contrast, mice expressing cytoplasmic CELF1 display changes in protein levels of targets known to be regulated at the level of translation by CELF1, with minimal changes in AS. These changes are in the absence of overt histopathological changes or muscle loss. RNA-sequencing revealed extensive gene expression and AS changes in mice overexpressing nuclear and naturally localized CELF1 protein, with affected genes involved in cytoskeleton dynamics, membrane dynamics, RNA processing and zinc ion binding. These results support a stronger role for nuclear CELF1 functions as compared to cytoplasmic CELF1 functions in skeletal muscle wasting.
Introduction
RNA processing plays a pivotal role in the regulation of protein expression and proteome diversity (1–3). Defective RNA processing has become a well-recognized cause of disease and modulation of disease phenotype (4,5), either by mutations of cis-acting elements that disrupt expression of individual genes or mutations in trans-acting RNA-binding proteins (RBPs) that alter expression of multiple genes in an RNA processing network (6–8). RBPs regulate RNA processing at multiple levels including alternative splicing (AS), polyadenylation, translation, mRNA stability and mRNA localization. Given that RBPs regulate networks of RNA processing events integrated with transcription and other post-transcriptional regulation, the expression and activity of RBPs are often under tight control (9,10).
A common mechanism of RBP regulation is through changes in cellular localization (11–13). CUG-BP, Elav-like family member 1 (CELF1, also known as CUGBP1) is a developmentally regulated RBP that is characterized by differential cellular localization. During mouse myoblast differentiation, for example, CELF1 expression changes from predominantly nuclear expression in undifferentiated C2C12 myoblasts to predominantly cytoplasmic expression in myotubes differentiated for 10 days (14). The CELF family of RBPs contains six paralogs in humans and mice (CELF1–CELF6) and based on phylogenic analysis can be divided into two distinct subfamilies: CELF1–CELF2 and CELF3–CELF6 (15,16). CELF1, which is mainly expressed in the heart, skeletal muscle and brain, has been implicated in various human diseases including increased expression in myotonic dystrophy type 1 (DM1) (17–19), misregulation in cancer (20–23) and an association with Alzheimer’s disease (24,25).
CELF1 shuttles between the nucleus and the cytoplasm (26) and regulates multiple aspects of RNA processing, such as alternative splicing, mRNA stability and translation (27). CELF1 contains two N-terminal RNA recognition motifs (RRMs) and one C-terminal RRM (26), with which CELF1 binds GU-rich elements within RNA targets (28,29). One of the earliest described roles for CELF1 was its regulation of pre-mRNA splicing in the nucleus in which it binds to intronic sequences flanking alternative exons to either promote exon inclusion or exclusion (30–32).
In the cytoplasm, CELF1 mediates mRNA decay of short-lived transcripts (33), a function that is conserved between mammals and Xenopus (34). CELF1 bound to the 3′ untranslated region (UTR) of mRNA targets interacts with ribonucleases (35), such as poly(A)-specific ribonuclease (PARN) (36), leading to enhanced mRNA decay. CELF1 has also been shown to control translational activation of genes during epithelial-to-mesenchymal transition (EMT) in breast epithelial cells (23) and binds to the 5′UTRs of target transcripts and promotes translation in skeletal muscle (37).
In striated muscle, CELF1 protein levels are highest during embryogenesis and are reduced 5–10-fold after birth (38,39). Therefore, when CELF1 protein levels become aberrantly elevated, as observed in disease states, a transition toward more embryonic expression patterns of CELF1 RNA targets is observed (39).
CELF1 protein levels are elevated in skeletal muscle of individuals affected by myotonic dystrophy type 1 (DM1), a multisystemic disease that includes severe skeletal muscle wasting (19,40). We previously showed that tetracycline-inducible overexpression of CELF1 specifically in skeletal muscle of adult mice produced severe histopathological changes, muscle wasting and extensive misregulation of alternative splicing (41). These results demonstrated the impact of CELF1 upregulation in skeletal muscle but did not distinguish between the nuclear and cytoplasmic functions of CELF1. Here, our goal was to identify how CELF1 overexpression contributes to skeletal muscle myopathy—specifically, whether increased nuclear function, cytoplasmic function or both contribute to skeletal muscle wasting. Toward this goal, we generated tetracycline-inducible transgenic mice for skeletal muscle-specific expression of active CELF1 mutants that predominantly localize to the nucleus or cytoplasm and an unmodified CELF1 protein as a control.
We found that overexpression of nuclear localized CELF1 leads to widespread alternative splicing changes, muscle wasting and myopathy within 10 days of induction, as also observed for wild-type (WT) CELF1. In contrast, minimal phenotypic effects were observed in animals overexpressing the cytoplasmic version of CELF1. The activity of cytoplasmic CELF1 was demonstrated by changes in steady-state protein levels of known CELF1 targets. Together these results indicate that while both cytoplasmic and nuclear localized CELF1 induced molecular changes, the myopathy observed following CELF1 overexpression in muscle can largely be attributed to increased function of CELF1 within the nucleus.
Results
Directed localization leads to primarily nuclear or cytoplasmic expression of CELF1 in skeletal muscle
We generated three tetracycline-inducible transgenic mouse lines for skeletal muscle-specific expression of human CELF1. The first transgenic line expresses an unmodified version of CELF1 to serve as a control (parental line, hereafter referred to as hCELF1par). We also generated active CELF1 mutants to drive CELF1 expression to be predominantly nuclear (nuclear line, hereafter referred to as hCELF1nuc) or cytoplasmic (cytoplasmic line, hereafter referred to as hCELF1cyt) (Fig. 1A). The CELF1 open reading frames were fused with mCherry to reduce passive nuclear–cytoplasmic diffusion by increasing the protein size to 81 kDa and to visualize CELF1 intracellular distribution by fluorescence microscopy. Nuclear localization signals (NLSs) and nuclear export signals (NESs) that were mapped in CELF2, which is 84% identical to CELF1 (26), were used as a reference to modify the cellular distribution of CELF1. The hCELF1par construct provides a control transgenic line expressing a mCherry-CELF1 fusion protein with an unmodified NES/NLS configuration. To generate the hCELF1nuc construct, a canonical 10-amino acid NLS was added to the N- and C-termini, and conserved leucines in the putative NES were changed to alanines. To generate the hCELF1cyt construct, a NLS was removed and an 11-amino acid NES was added at the N- and C-termini (Fig. 1A). These constructs were derived from the transgene of our previously published TRECUGBP1 mouse line overexpressing the LYLQ isoform of CELF1 that lacks mCherry (41). Each CELF1 derivative was first tested in cell culture by transient transfection to confirm functionality using minigene and reporter assays (data not shown) as well as differential localization of each derivative during C2C12 differentiation (Supplemental Material, Fig. S1). In vivo activity of all three CELF1 derivatives was confirmed (see below).
Figure 1.
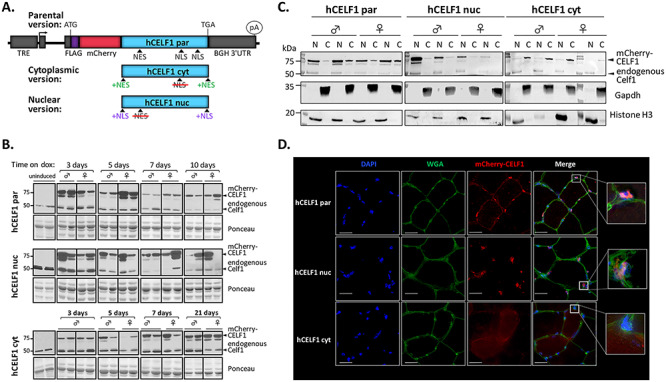
Modified CELF1 proteins show distinct cellular localization. (A) Diagram of transgenes for inducible expression of differentially localized CELF1. In the parental construct (hCELF1par), human CELF1 is unmodified, with natural nuclear localization (NLS) and export signals (NES) indicated (top). The cytoplasmic (hCELF1cyt) and nuclear (hCELF1nuc) constructs contain the changes shown and described in the text. (B) Adult bitransgenic mice, hCELF1/MDAF, hCELF1nuc/MDAF and hCELF1cyt/MDAF, were induced to express mCherry-CELF1 for the times indicated. Western blotting for CELF1 detects endogenous and exogenous CELF1 and determines the level of mCherry-CELF1 expression. Ponceau stain (bottom) shows total protein loading. The expected sizes of mCherry-CELF1 and endogenous Celf1 are 81 and 52 kDa, respectively. For each line and time point, n = 4–7 males and 4–7 females per genotype, representative animals are shown from each. (C) Isolation of nuclear and cytoplasmic proteins from quadriceps of animals induced for 3 days shows enhanced nuclear expression of mCherry-CELF1 in the hCELF1nuc line and enhanced cytoplasmic expression in the hCELF1cyt line. N, nuclear fraction; C, cytoplasmic fraction. (D) Representative fluorescence images from transgenic animals induced to express the mCherry-CELF1 fusion construct for 7 days. Images are of mCherry epifluorescence (red) from frozen sections of tibialis anterior and were stained for wheat germ agglutinin to outline cell boundary (green). Scale bar, 25 μm.
hCELF1par, hCELF1nuc and hCELF1cyt mouse lines were individually crossed to a mouse line with skeletal muscle-specific expression of a modified reverse tetracycline transactivator (rtTA) MDAFrtTA (hereafter referred to as MDAF) (42), to generate bitransgenic animals. mCherry-CELF1 expression was induced in 10–11-week-old bitransgenic animals using the tetracycline derivative, doxycycline (dox), with dox-containing chow. Expression levels of mCherry-CELF1 in each line were optimized by dox dose to obtain similar expression levels between the three transgenic lines (data not shown). Mice from the hCELF1par line were fed chow containing 0.25 g doxycycline/kg chow, mice from the hCELF1nuc line were fed 0.1 g doxycycline/kg chow, and mice from the hCELF1cyt line were fed 2.0 g doxycycline/kg chow. We used induction over a time course to determine the effects of each CELF1 derivative in skeletal muscle. Protein expression was confirmed for each line at each time point (Fig. 1B). Bitransgenic animals on standard chow lacking doxycycline did not express detectable levels of mCherry-CELF1 protein (Fig. 1B).
While bitransgenic animals from each of the three transgenic lines were derived from individual founder animals, we consistently observed variable mCherry-CELF1 protein expression levels within each line, likely contributing to the phenotypic variability observed throughout the study. This was not specific to these three founders and was observed for additional founder lines for each of the three transgenic lines (data not shown). We utilized this variability to establish correlations between the level of mCherry-CELF1 expression and phenotype and to compare phenotypes of animals from the three transgenic lines with similar protein expression levels.
Localization of nuclear and cytoplasmic mCherry-CELF1 proteins in bitransgenic mice was confirmed by subcellular fractionation followed by western blot from quadriceps (Fig. 1C) and mCherry epifluorescence in the tibialis anterior of induced animals (Fig. 1D). In agreement with previous observations (39), endogenous Celf1 expression is detected primarily in the nuclear fraction in all three lines (Fig. 1C).
Of the five skeletal muscles examined, exogenous mCherry-CELF1 protein expression was found to be highest in biceps, followed by gastrocnemius in all three lines (Supplemental Material, Fig. S2A). Exogenous CELF1 expression was detected specifically in skeletal muscle for all three lines with little to no expression detected in the heart, liver, lung or spleen (Supplemental Material, Fig. S2B).
Nuclear, but not cytoplasmic, CELF1 expression leads to skeletal muscle myopathy
The effects of hCELF1nuc or hCELF1cyt on muscle histology were determined by hematoxylin and eosin (H&E) staining of muscle cross sections. Cross sections of quadriceps (Fig. 2), gastrocnemius (data not shown) and tibialis anterior muscle (data not shown) from male and female animals overexpressing CELF1 derivatives were compared with WT (data not shown) and MDAF littermates through a time course following transgene induction (Fig. 2A). All bitransgenic and control animals were on dox for the same time period to control for the effects of dox. Control animals from each line were also given the same dox concentration as the corresponding bitransgenic animals from that line. The results described below and shown in Figure 2 are of quadriceps muscle, however, similar histological defects were also observed in gastrocnemius and tibialis anterior muscles. Quadriceps from adult bitransgenic animals given dox chow for 3 days exhibited healthy muscle histology in all three transgenic lines (Fig. 2A). After 5 days of hCELF1par overexpression, some minor histological defects, such as rounded and hyperpigmented myofibers, were observed in a subset of animals (Fig. 2A, top). Seven days after overexpression of hCELF1par, all animals in the cohort displayed at least moderate histological defects such as myofiber variability, hyperpigmentation and myofiber necrosis. Ten days following induction of hCELF1par overexpression, most animals displayed many patches of severe histological defects (Fig. 2) throughout all muscles examined with about 17% (2/12) of animals displaying milder defects.
Figure 2.
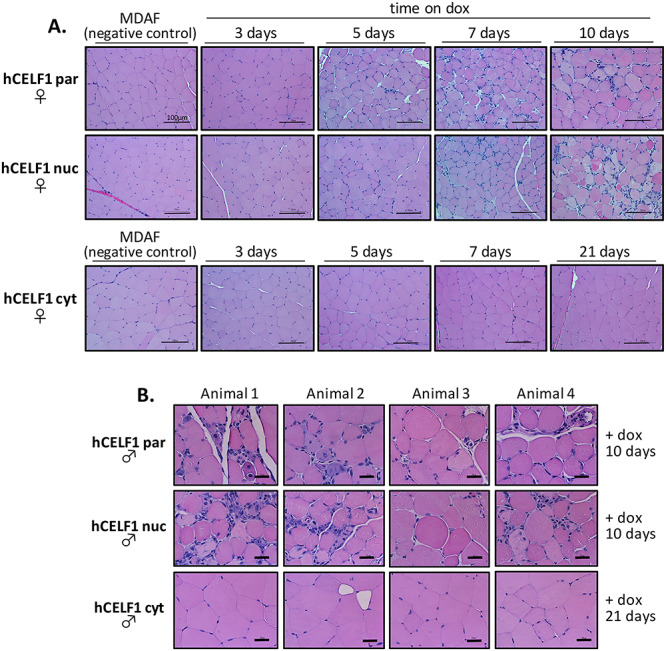
Parental and nuclear but not cytoplasmic mCherry-CELF1 transgenic lines develop severe histopathology. Adult hCELF1par, hCELF1nuc and hCELF1cyt bitransgenic mice were induced to express mCherry-CELF1 for the times indicated. (A) Panels show H&E staining of formalin-fixed, paraffin-embedded female quadriceps. MDAF alone control littermates on dox for 7 days show normal histology. Induced animals from the hCELF1par and hCELF1nuc lines have multiple histological defects such as myofiber variability, hyperpigmentation and myofiber necrosis. Animals expressing hCELF1cyt do not show evidence overt histopathology. Scale bar, 100 μm. (B) Panels for each line show H&E staining from four different male animals. hCELF1par and hCELF1nuc animals were induced for 10 days and hCELF1cyt animals were induced for 21 days. Examples of severe histological defects observed in animals expressing high levels hCELF1par and hCELF1nuc of mCherry-CELF1. Mice expressing high levels of hCELF1cyt show normal histology, with some areas of adipose deposition and myofiber variability but otherwise display no detectable histological defects 21 days post-induction. Scale bar, 25 μm.
Similarly, overexpression of hCELF1nuc for 5 days led to minor histological defects in a subset of animals, and by 7 days, many animals displayed moderate histological defects similar to hCELF1par overexpression (Fig. 2A, middle), although about one-third of the hCELF1nuc animals displayed only minor changes such as rounded and hyperpigmented myofibers. Ten days following induction of hCELF1nuc, nearly all male and female animals displayed many patches of severe histological defects similar to hCELF1par (Fig. 2B) throughout all muscles examined, with about 17% (2/12) of animals displaying milder defects. Overexpression of hCELF1par or hCELF1nuc for 10 days led to variability in myofiber size with some regions of smaller myofibers as well as areas with very large and rounded myofibers. Subsets of myofibers with hyperpigmentation and others with loss of pigmentation, as well as centralized nuclei and infrequent ring fibers, were also observed. Lastly, striking patches containing many small mononucleated cells, which are likely infiltrating immune cells, were observed (Fig. 2B). When hCELF1par and hCELF1nuc were induced to highly express CELF1 for 14 days using chow containing higher concentrations of dox, severe myopathy and infiltration of many mononucleated cells was observed (Supplemental Material, Fig. S3A). When hCELF1par and hCELF1nuc were induced to highly express CELF1 for 28 days, the appearance of extensive centralized nuclei was observed, likely indicative of regenerating myofibers (Supplemental Material, Fig. S3B). For both hCELF1par and hCELF1nuc, there was no apparent divergence between males and females.
In contrast to hCELF1par and hCELF1nuc, overexpression of hCELF1cyt did not lead to any detectable histological defects after 7 days of CELF1 overexpression (Fig. 2A, bottom). Even 21 days post-hCELF1cyt induction, only minimal histological defects were observed, such as myofiber variability, in male and female animals (Fig. 2A).
The severity of the histopathological changes observed in hCELF1par and hCELF1nuc lines directly correlated with expression levels of mCherry-CELF1 protein, with animals expressing higher levels of mCherry-CELF1 protein showing more severe histological defects. To better evaluate the effects of equivalent levels of mCherry-CELF1 expression between the three lines, we examined the quadriceps of low and high expressing animals from each line by western blot and H&E staining (Fig. 3). The high expressing animals from hCELF1par and hCELF1nuc lines express much higher than the high expressing animals from the hCELF1cyt line, about 3–5-fold versus 2-fold over endogenous Celf1, respectively. However, a direct comparison can be made between lines since the high expressing animals from the hCELF1cyt line express levels of mCherry-CELF1 protein comparable to the low expressing animals from the hCELF1par and hCELF1nuc lines (Fig. 3A, lanes 2, 8, and 10). Histological examination of quadriceps cross sections of the same animals used for western blots in Fig. 3A shows that comparably low expression of hCELF1par and hCELF1nuc resulted in similar defects in skeletal muscle histology (Fig. 3B). Overexpression of hCELF1cyt to these same levels, however, did not result in any histological defects, indicating that the lack of skeletal muscle phenotype in the hCELF1cyt line is not simply due to lower expression levels (Fig. 3B).
Figure 3.
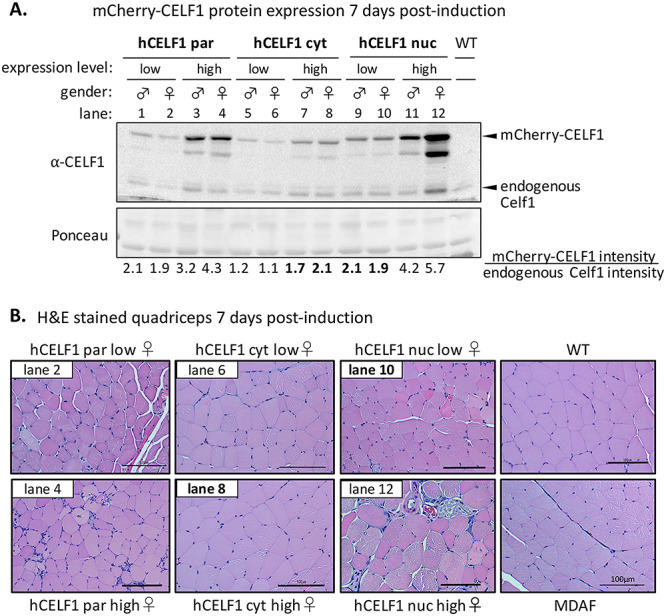
A comparison of low and high expressing animals from mCherry-CELF1 transgenic lines highlights pathology associated with overexpression of nuclear CELF1. Adult hCELF1par, hCELF1nuc and hCELF1cyt mice and WT controls were given dox-containing chow for 7 days. (A) Total protein was isolated from quadriceps of mice expressing high and low amounts of mCherry-CELF1 from each line. WT control littermates do not express mCherry-CELF1 protein. Ponceau stain (bottom) shows total protein loading. The expected sizes of mCherry-CELF1 and endogenous Celf1 are 81 and 52 kDa, respectively. The levels of mCherry-CELF1 were normalized to the levels of endogenous Celf1 to determine fold increase. (B) H&E staining of formalin-fixed, paraffin-embedded quadriceps from the female bitransgenic mice shown in A and indicated by lane number. hCELF1par and hCELF1nuc animals expressing low levels of mCherry-CELF1 (comparable to hCELF1cyt high expressing animals) show signs of histological defects. High and low expressing hCELF1cyt animals show normal skeletal muscle histology. Scale bar, 100 μm.
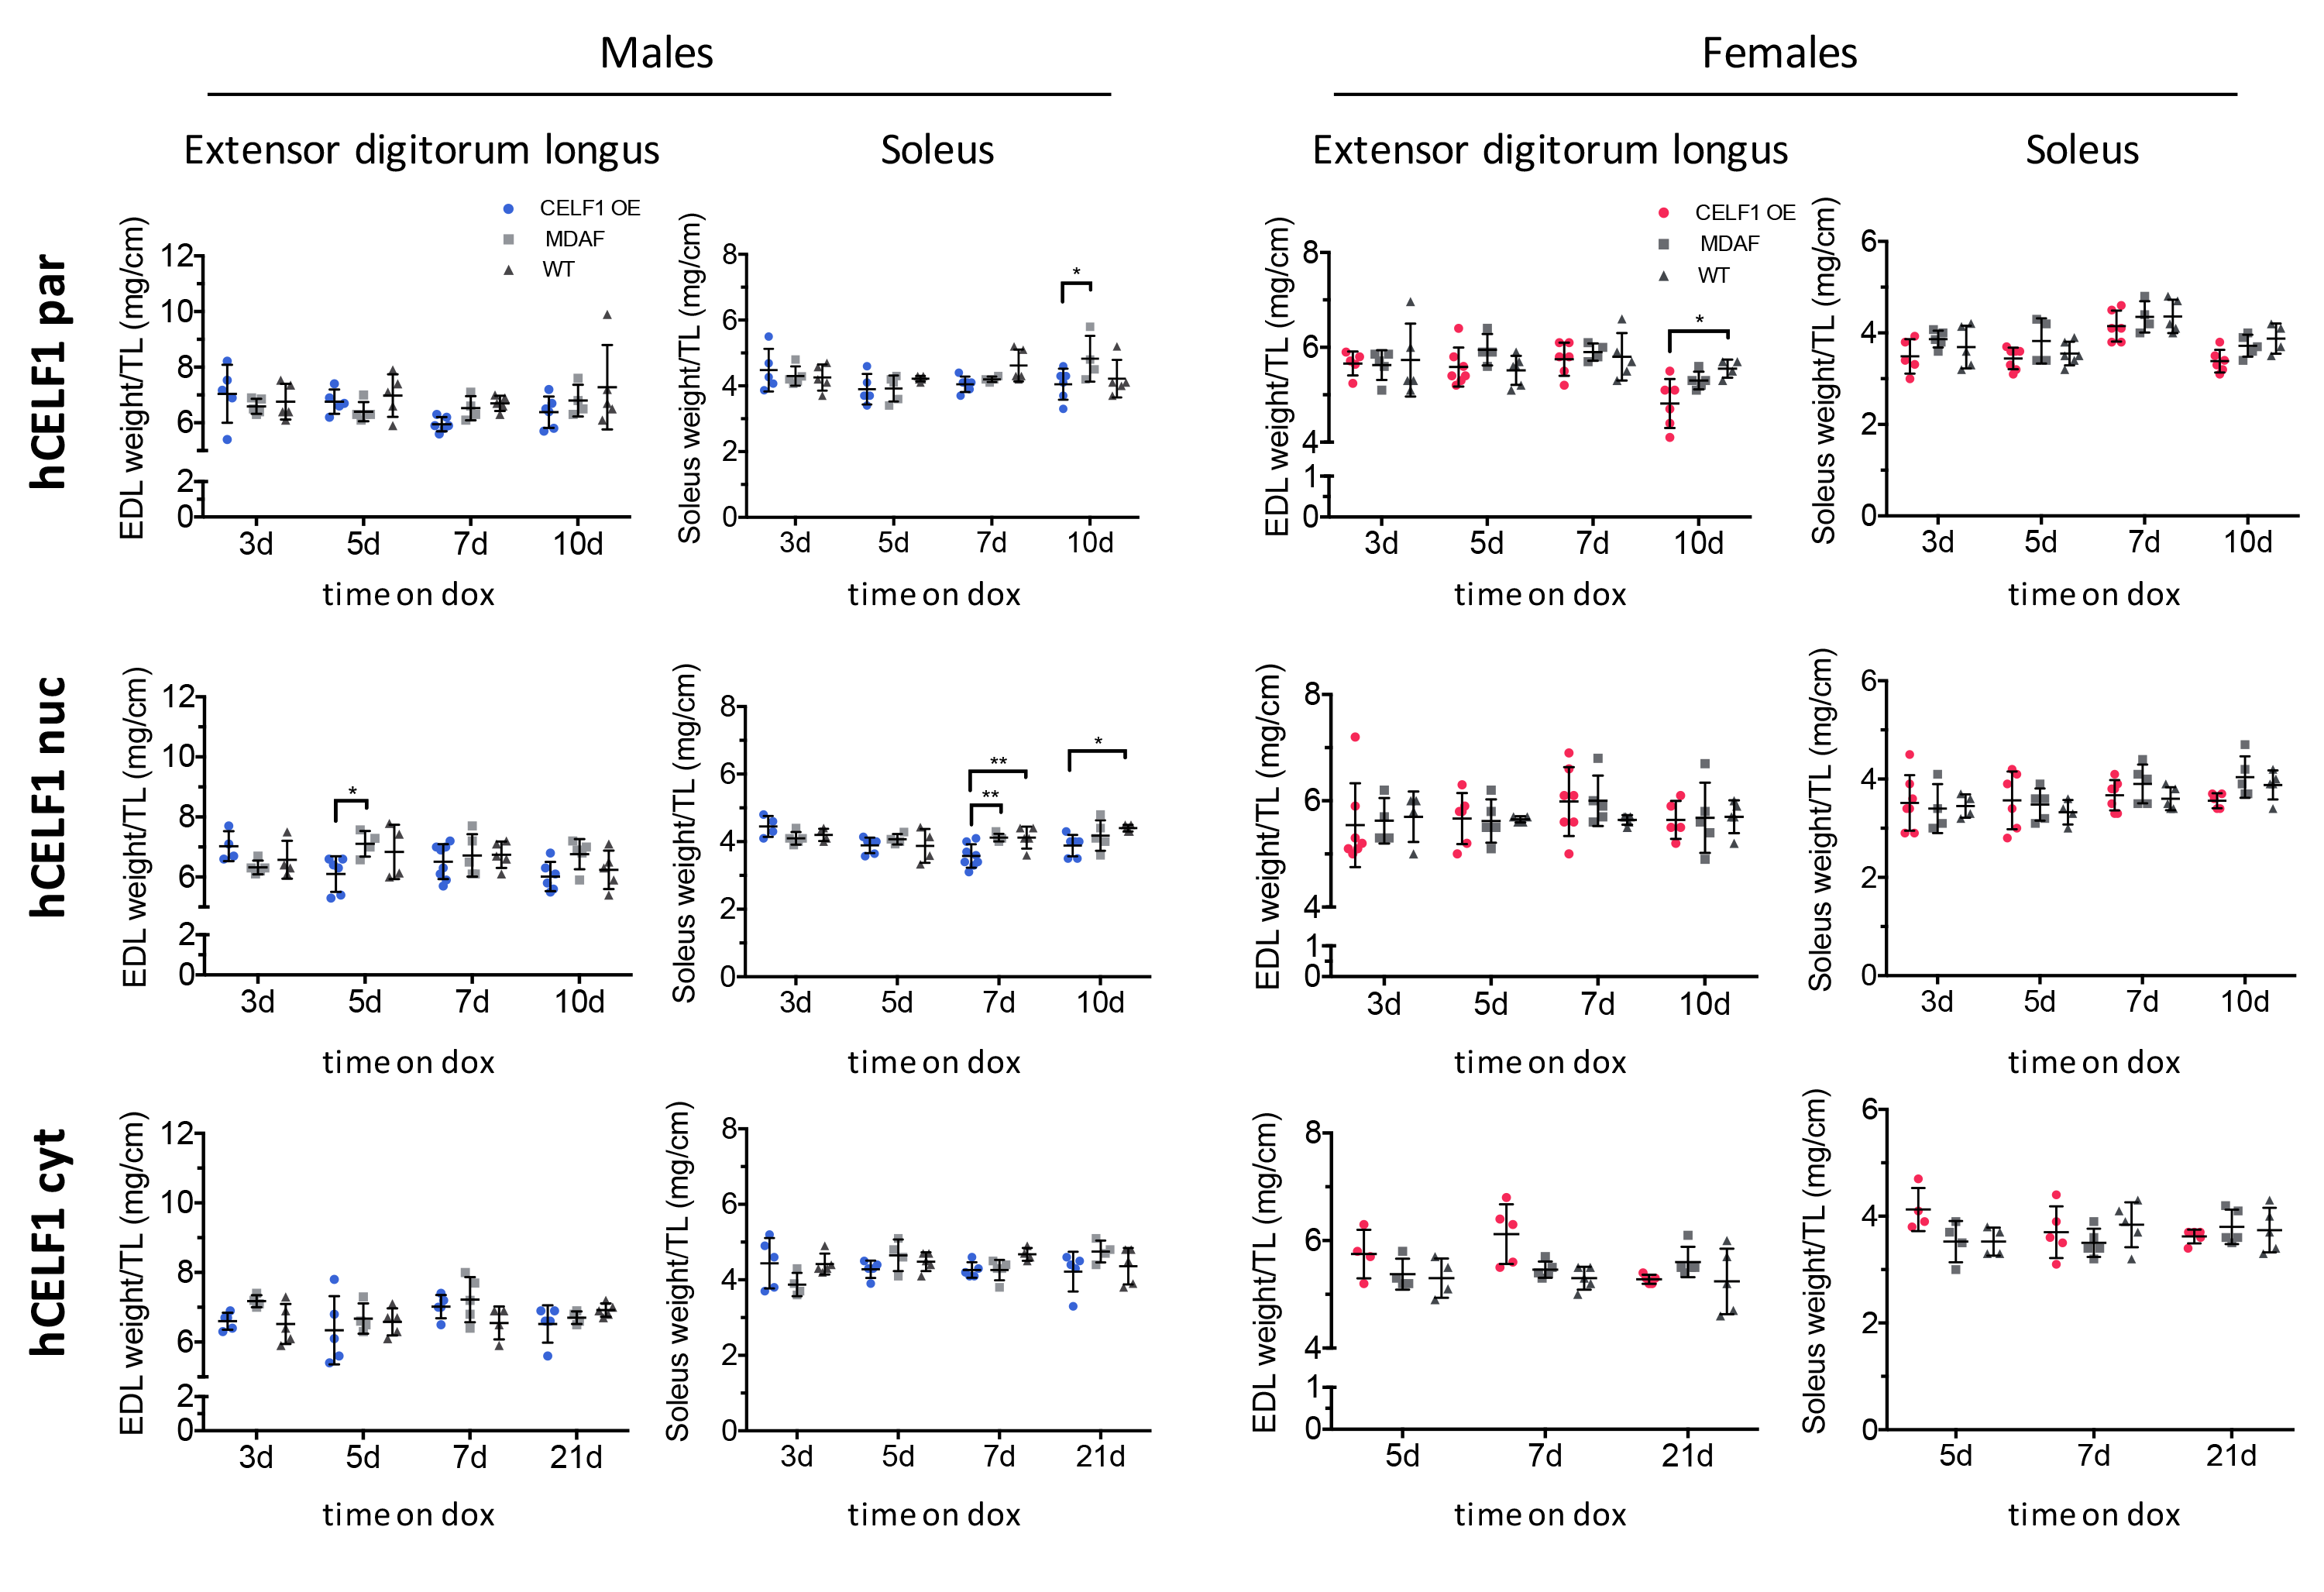
To determine whether CELF1 expression led to muscle wasting in the transgenic lines, we measured the skeletal muscle weight of six muscles (Fig. 4, Supplemental Material, Figs S4 and S5): tibialis anterior, gastrocnemius, quadriceps, biceps brachii, extensor digitorum longus and soleus. The muscle weights of all animals were included in quantification regardless of mCherry-CELF1 expression. Muscle weights of induced female (Fig. 4) and male (Supplemental Material, Fig. S4) bitransgenic animals were compared to the muscle weights of littermate WT and MDAF controls, normalized to tibia length for each time point. Overexpression of either hCELF1par or hCELF1nuc for 10 days led to a significant 11% decrease in gastrocnemius muscle weight, while overexpression of hCELF1cyt led to no significant decrease 21 days post-induction (Fig. 4). On average, animals overexpressing hCELF1nuc displayed less muscle loss than hCELF1par animals; however, this could be due to the increased variability of mCherry-CELF1 protein expression in the hCELF1nuc line. While differences can be observed between male and female animals in both hCELF1par and hCELF1nuc lines, we did not observe consistent gender-specific trends in muscle loss, with all muscle loss ranging from 7 to 17% in the hCELF1par line and 8 to 12% in the hCELF1nuc line depending on the muscle and gender under examination. Furthermore, we observed consistent muscle loss in gastrocnemius, quadriceps and biceps brachii (Fig. 4), the muscles in which mCherry-CELF1 protein expression was consistently found to be higher. In the muscles where mCherry-CELF1 protein expression was lower, the soleus and extensor digitorum longus, we observed less consistent changes in muscle weight (Supplemental Material, Fig. S5).
Figure 4.
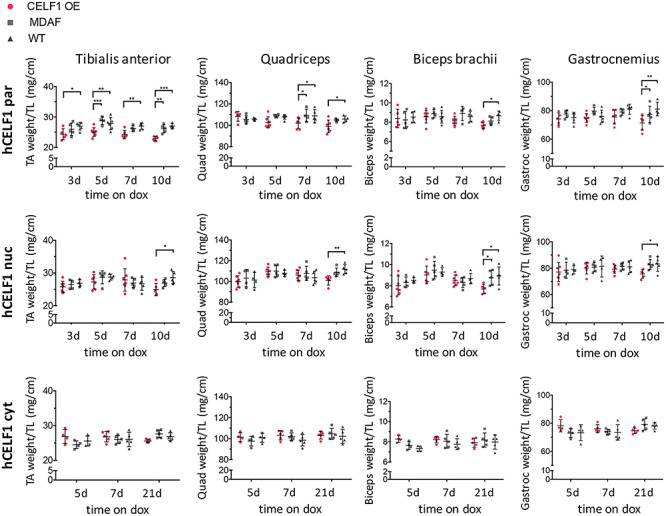
hCELF1par and hCELF1nuc female transgenic mice display decreases in skeletal muscle weight. Skeletal muscle weight was normalized to tibia length. Muscle weights of all animals were included in quantification regardless of mCherry-CELF1 expression. Induced hCELF1par and hCELF1nuc female mice display significant reduction in muscle weight of several muscles 10 days post-induction (weights from male mice listed in Supplemental Material, Fig. S4). hCELF1cyt animals show no significant changes in muscle weight 21 days post-induction. Comparisons were made to MDAF alone and WT negative control littermates, also on dox-containing chow for the same time as corresponding bitransgenic animals. For each line and time point, n = 4–7 per genotype. Statistical analysis was conducted with two-way ANOVA. Post hoc analysis was performed using Tukey’s honestly significant difference (HSD) correction. *P-value < 0.05, **P-value < 0.01, ***P-value < 0.001.
CELF1 expression induced alternative splicing changes in hCELF1par and hCELF1nuc lines, confirming nuclear activity in vivo
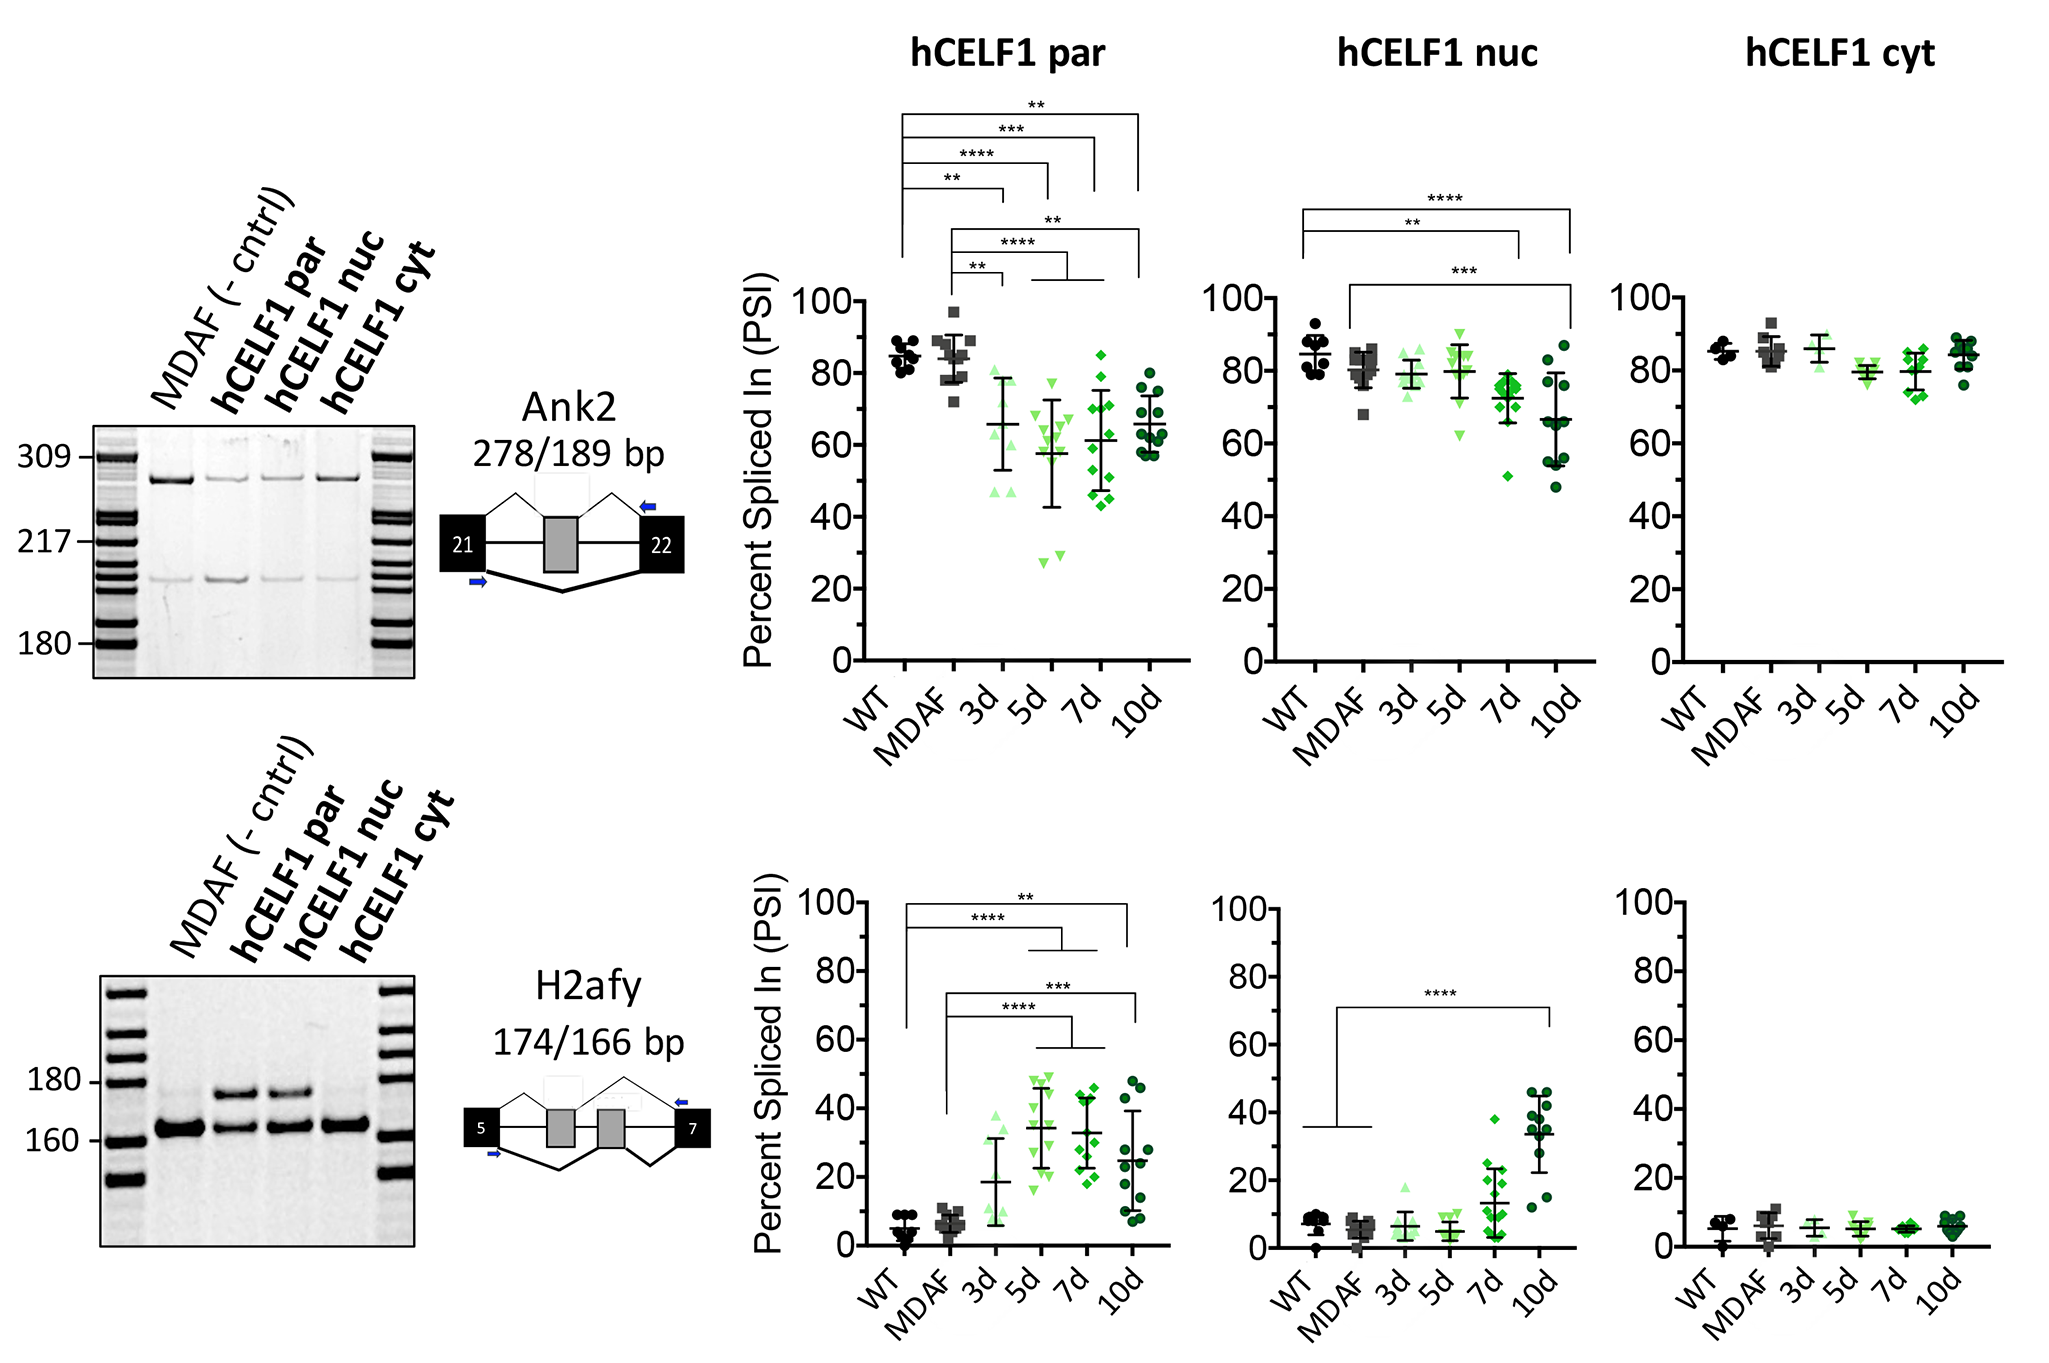
One of the earliest recognized roles of CELF1 was its involvement in alternative splicing regulation (17,30,31). Here, we examined several alternative splicing events previously demonstrated to be CELF1 targets (32,41) to confirm functionality of each of the CELF1 derivatives in vivo. We performed reverse transcription polymerase chain reaction (RT-PCR) on RNA from quadriceps muscles using primers complementary to the constitutive exons flanking the alternative exons of interest. Alternative splicing changes were quantified by the percent spliced in (PSI), which measures the percent of mRNA from the gene that contains the alternative exon. Overexpression of either hCELF1par or hCELF1nuc produced marked changes in the exon inclusion/exclusion ratios of Impdh2 exon 9b, Mybpc1 exon 24, Ank2 ex 21, Gfat exon 9 and H2afy exon 6, while minimal changes were observed in muscle RNA from the hCELF1cyt line (Fig. 5, Supplemental Material, Fig. S6). Within 3 days of CELF1 overexpression, we detected changes in alternative splicing patterns, and by 10 days post-induction of CELF1, ∆PSI values of 18% or more were observed for all events tested in both the hCELF1par and hCELF1nuc lines, with the exception of Mybpc1 (Fig. 5B). Splicing changes were observed in both male and female animals from the hCELF1par and hCELF1nuc lines (Supplemental Material, Fig. S7). With the exception of Impdh2 splicing, which demonstrated a mild response in the hCELF1cyt line, all other events tested in the hCELF1cyt line display no significant deviation from the splicing patterns observed in WT and MDAF littermates, indicating minimal CELF1 nuclear function in the hCELF1cyt line.
Figure 5.
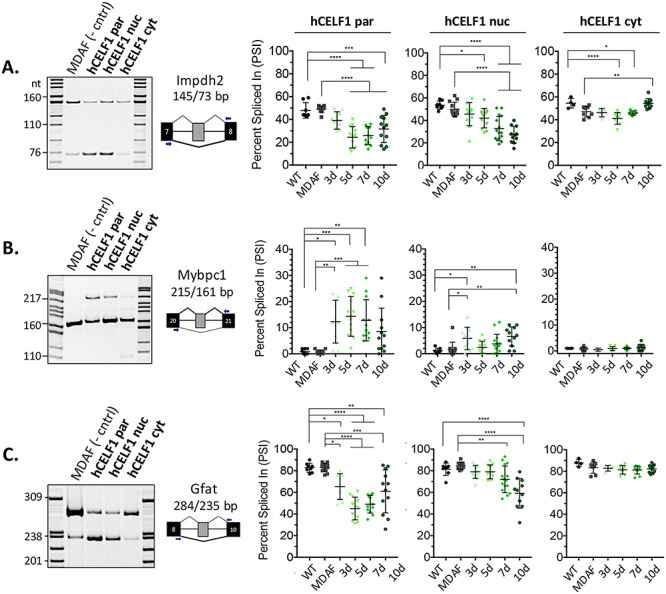
hCELF1par and hCELF1nuc derivatives display functionality in vivo with characteristic alternative splicing misregulation. To test the functionality of each CELF1 derivative in vivo, RNA was isolated from quadriceps of hCELF1par, hCELF1nuc, hCELF1cyt, MDAF and WT mice at each of the time points. RT-PCR was performed using primers complementary to the constitutive exons flanking the alternative exons of interest. Percent exon inclusion was calculated as the intensity of the top band/intensity of both bands x 100, expressed as percent spliced in (PSI). Splicing events of known CELF1 targets that were tested include (A) 72 nt exon Impdh2, (B) 54 nt exon in Mybpc1 and (C) 49 nt exon in Gfat. In the hCELF1par and hCELF1nuc lines, the splicing events tested show a response compared to the splicing pattern observed in MDAF control. Quantification of WT and MDAF controls are a combination of time points as no significant changes were detected in controls on dox for different time points. For each line and time point, n = 4–7 for males and n = 4–7 for females per genotype. Statistical analysis was conducted with one-way ANOVA. Post hoc analysis was performed using Tukey’s HSD correction. *P-value < 0.05, **P-value < 0.01, ***P-value < 0.001, ****P-value < 0.0001.
CELF1 expression leads to alterations in protein levels of CELF1 translation targets, confirming in vivo functionality of all three CELF1 derivatives
CELF1 regulates translation through multiple mechanisms in various contexts (22,23,43,44). Here, we examined protein levels of previously identified CELF1 translation targets to confirm functionality of the CELF1 cytoplasmic derivative in vivo. Previous studies demonstrated that CELF1 interacts with the human p27 Kip1 5′UTR and regulates its translation through an IRES (45). In all three transgenic lines, we observed an initial increase in p27 Kip1 protein levels after CELF1 overexpression compared to WT controls, followed by a subsequent decrease in protein levels at later time points (Fig. 6). Since CELF1 is a shuttling protein, we expected to see changes in the protein levels of CELF1 translation targets in the hCELF1par line as well as changes in the hCELF1cyt line. We suspect that the changes observed in the hCELF1nuc line are due to residual cytoplasmic CELF1 as we observed a small amount of CELF1 protein in the cytoplasmic compartment in animals from the hCELF1nuc line based on the fractionation results shown in Figure 1D.
Figure 6.
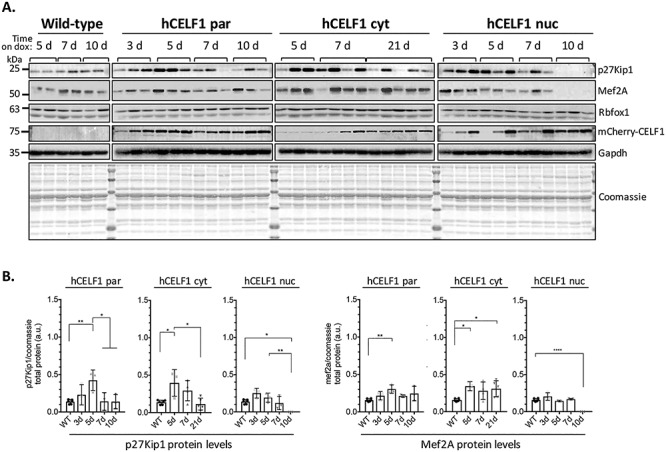
mCherry-CELF1 derivatives display cytoplasmic functionality in vivo with changes in CELF1 translation targets. To test the cytoplasmic functionality of each CELF1 derivative in vivo, protein was isolated from the quadriceps of female hCELF1par, hCELF1nuc, hCELF1cyt and WT (+ dox) animals at each of the time points. (A) Each lane displays protein isolated from different animals. For each protein target tested, all samples were run on one gel and transferred together. In all three lines, the protein levels of CELF1 translation targets p27Kip1 and Mef2A diverge from the levels observed in WT control mice following mCherry-CELF1 expression. (B) Quantification of WT controls are a combination of time points as no significant changes were detected in controls on dox for different time points. Representative Coomassie and Gapdh are shown. Protein signal was measured by densitometry and normalized to total protein as measured by Coomassie. Statistical analysis was conducted with one-way ANOVA. Post hoc analysis was performed using Tukey’s HSD correction. *P-value < 0.05, **P-value < 0.01, ****P-value < 0.0001.
Previous work has also demonstrated a role for CELF1 in the translational regulation of myocyte enhancer factor 2A (Mef2A) (44,46). A GC-rich region within Mef2A mRNA has been shown to be required for the CELF1-dependent increase of Mef2A protein levels (44). We examined Mef2A protein levels in each of the transgenic lines induced to overexpress CELF1 and observed an increase in Mef2A protein levels as early as 5 days post-induction of CELF1 in both the hCELF1par and hCELF1cyt lines (Fig. 6, Supplemental Material, Fig. S8). Furthermore, Mef2a levels induced in skeletal muscle of hCELF1cyt animals are at least comparable to Mef2a levels induced in skeletal muscle of hCELF1par animals. There were no significant changes in Mef2A protein levels in animals from the hCELF1nuc line in the early time points. Interestingly, in the hCELF1nuc line 10 days post-induction, we observed complete loss of both p27Kip1 and Mef2A protein (Fig. 6A). The mechanism for this downregulation is unknown; however we suspect it may be secondary to muscle damage in the hCELF1nuc line given the severe histological changes observed in this subset of animals. CELF1 overexpression did not produce changes in the expression of proteins not shown to be regulated by CELF1, such as RbFox1 and Gapdh (Fig. 6A). Taken together, these results indicate that in each of the transgenic lines, CELF1 exhibits cytoplasmic function; however this regulation appears to be stronger in the hCELF1cyt line. These results along with the splicing results in the prior section illustrate that the cytoplasmic but not nuclear activity of CELF1 is enhanced in the hCELF1cyt line; however, this increase in activity is not sufficient to lead to the skeletal muscle myopathy associated with elevated CELF1 expression.
CELF1 overexpression leads to widespread transcriptome alterations relevant to skeletal muscle physiology
To determine the most significant transcriptome changes likely contributing to skeletal muscle wasting and myopathy in the CELF1 transgenic lines, we performed RNA-sequencing using polyadenylated mRNA isolated from hCELF1par, hCELF1nuc and hCELF1cyt female gastrocnemius samples throughout the induction time course (Table 1). Sequencing was performed on a total of four WT and six MDAF controls, six hCELF1par animals, nine hCELF1nuc animals and six hCELF1cyt animals. Animals with comparable mCherry-CELF1 protein expression and similar minimal histological defects were chosen for sequencing. As a positive control, sequencing was also performed on 2 TRECUGBP1/MDAF animals (referred to as TRECUGBP1) from our previously published mouse line in which Flag-tagged CELF1, without mCherry, was overexpressed ~8-fold over endogenous Celf1 in skeletal muscle (41). All animals (including controls) were fed dox-containing chow to account for any effects of dox.
Table 1.
RNA-sequencing sample information
| Genotype | # of mice | Sex | Time on dox |
|---|---|---|---|
| WT | 2 | Female | 3 days |
| WT | 2 | Female | 7 days |
| MDAF | 2 | Female | 3 days |
| MDAF | 2 | Female | 7 days |
| hCELF1par/MDAF | 3 | Female | 3 days |
| hCELF1par/MDAF | 3 | Female | 5 days |
| hCELF1cyt/MDAF | 3 | Female | 7 days |
| hCELF1cyt/MDAF | 3 | Female | 21 days |
| hCELF1nuc/MDAF | 3 | Female | 3 days |
| hCELF1nuc/MDAF | 3 | Female | 5 days |
| hCELF1nuc/MDAF | 3 | Female | 7 days |
| MDAF | 2 | Female | 5 days |
| TRECUGBP1/MDAF | 2 | Female | 5 days |
Complementary deoxyribonucleic acid (cDNA) libraries were prepared for 150 bp paired-end reads using the NovaSeq 6000 with >150 million reads per sample and >70% of reads mapping to the mm10 mouse genome. The high-quality RNA-seq data provided sufficient depth and quality to examine changes in both alternative splicing and gene expression that respond to CELF1 overexpression and correlate with skeletal muscle wasting and myopathy throughout the induction time course.
RNA from hCELF1par and hCELF1nuc animals induced to overexpress CELF1 for 3 days was sequenced in order to detect early transcriptome alterations before any noticeable changes were observed by muscle histology. Additionally, RNA from hCELF1par and hCELF1nuc animals induced to express CELF1 for 5 days was sequenced as this is when histological defects were first observed in each line. RNA from hCELF1nuc animals induced to overexpress CELF1 for 7 days was also sequenced as splicing changes were milder and slightly delayed in this line based on initial splicing analysis by RT-PCR. RNA from later time points of hCELF1par and hCELF1nuc overexpression were not sequenced as transcriptome alterations at these later time points are likely confounded by changes secondary to severe muscle damage. RNA from animals overexpressing hCELF1cyt for 7 and 21 days was sequenced in order to detect gene expression changes in this line, as well as to filter out transcriptome alterations detected in all three lines (hCELF1par, hCELF1nuc and hCELF1cyt) since changes in the hCELF1cyt line do not correlate with the skeletal muscle phenotype as in the hCELF1par and hCELF1nuc lines.
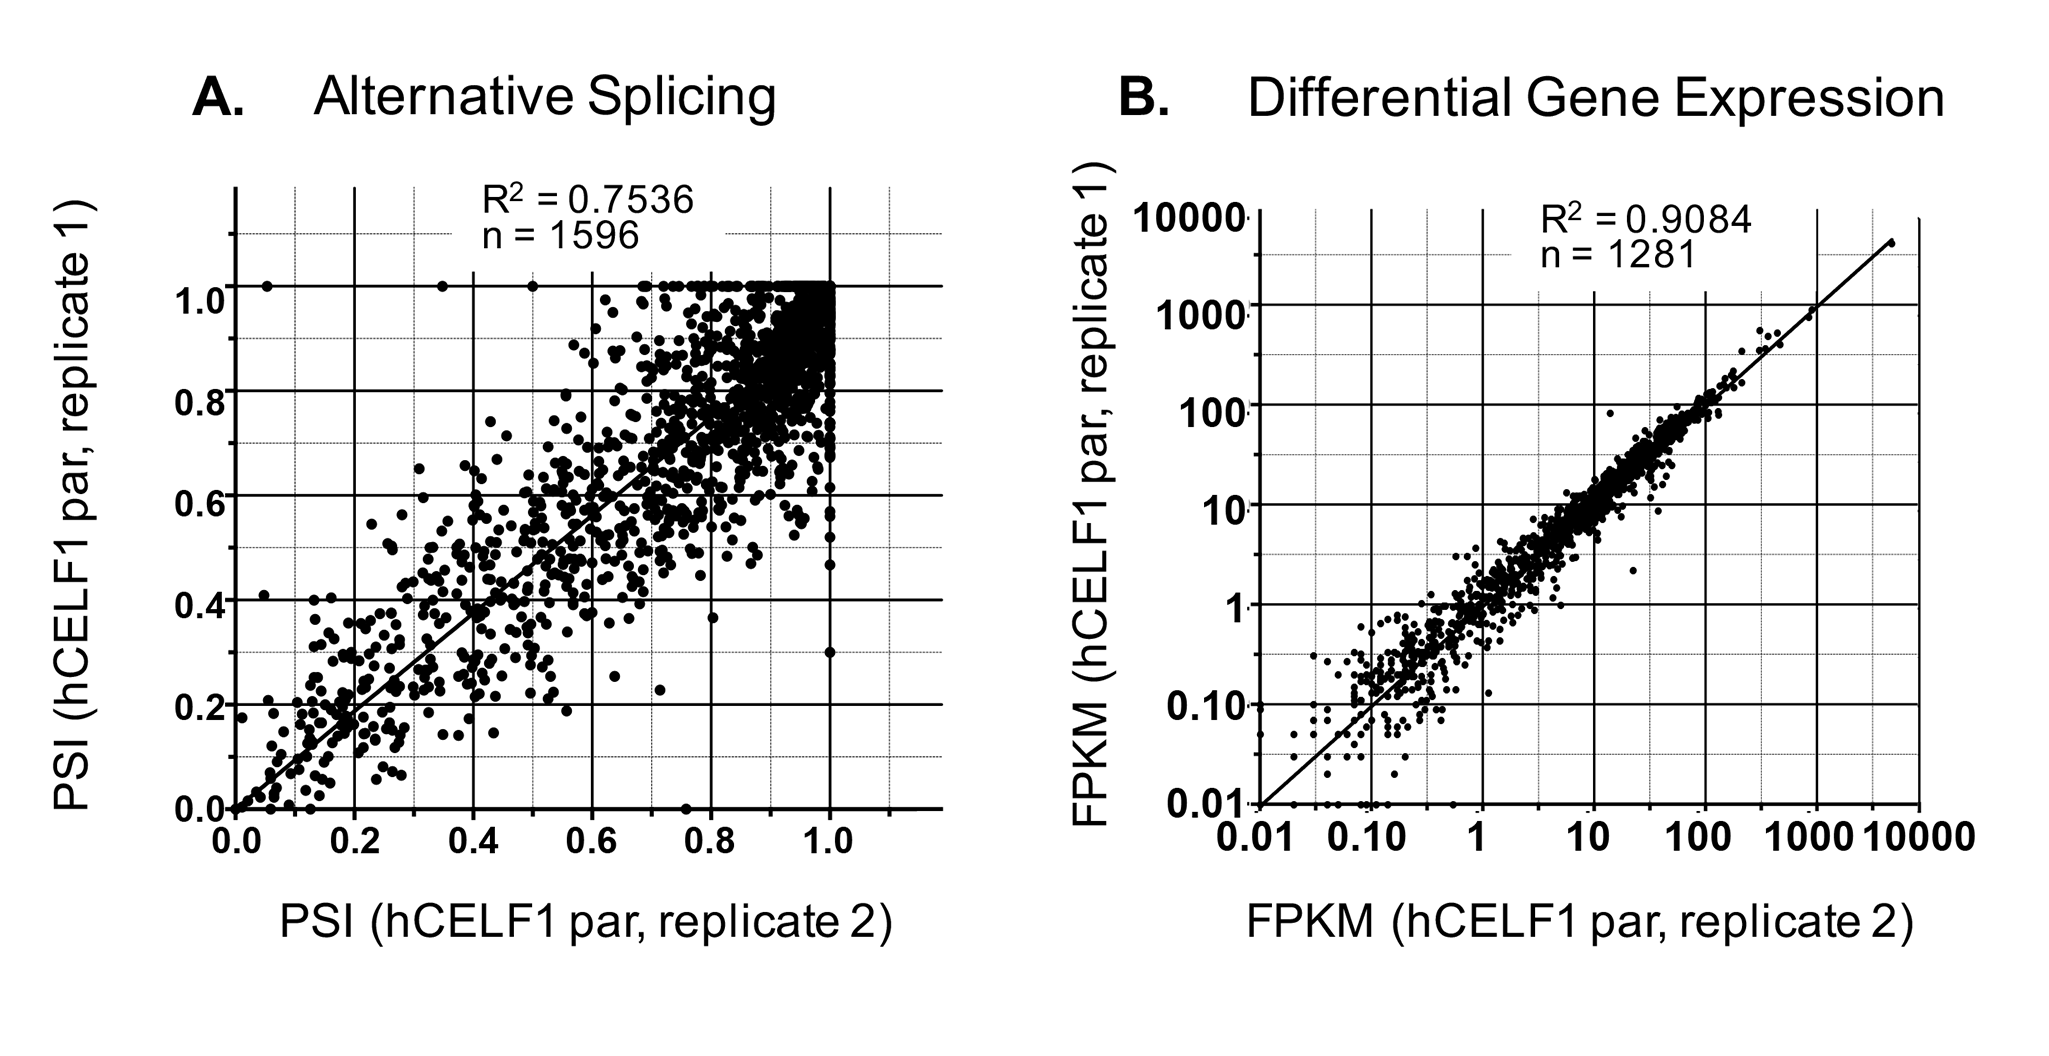
Splicing events were called using replicate multivariate analysis of transcript splicing (rMATS, v4.0.2) using HISAT2-aligned bam files as input (47,48). Events with changes in percent spliced in (∆PSI) values ≥15%, a false discovery rate (FDR) ≤ 0.05 and a count cutoff >20 reads (to exclude very low expressing genes) were considered. Alternative splicing data from two replicates of hCELF1par overexpression (Supplemental Material, Fig. S9A) showed good correlation (Pearson = 0.75, P-value <0.0001), as did replicates of all other genotypes (data not shown). A high correlation (Pearson = 0.87) between ∆PSI values from RT-PCR and RNA-seq experiments in all three lines (hCELF1par, hCELF1nuc and hCELF1cyt) demonstrated the accuracy of our RNA-seq data for both strongly and weakly regulated alternative splicing transitions (Fig. 7B and data not shown).
Figure 7.
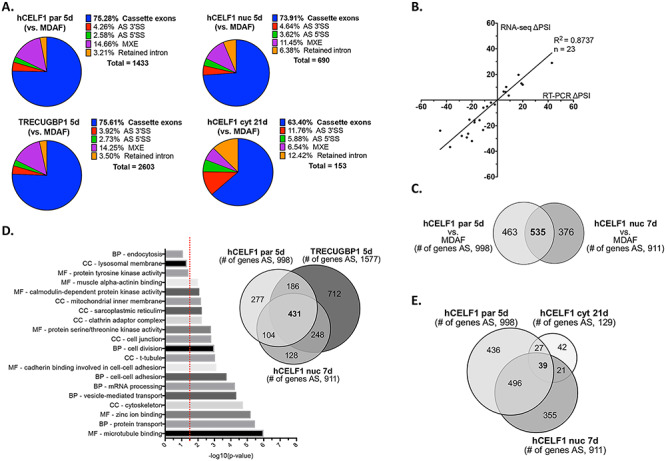
CELF1 overexpression results in extensive alternative splicing changes in adult skeletal muscle. RNA-sequencing was performed on RNA isolated from the gastrocnemius muscle of female hCELF1par, hCELF1nuc, hCELF1cyt, TRECUGBP1 (positive control), MDAF and WT mice at the time points indicated in Table 1. Animals with comparable mCherry-CELF1 protein expression and similar minimal histological defects were chosen for sequencing. Data was analyzed for alternative splicing (AS) changes. (A) Types of AS events responsive to CELF1 overexpression as compared to MDAF (+dox) negative controls in the hCELF1par, hCELF1nuc and TRECUGBP1 lines induced to overexpress CELF1 for 5 days; and the hCELF1cyt line induced to overexpress CELF1 for 21 days. The total number of alternative splicing changes with ∆PSI values ≥15%, a FDR ≤ 0.05 and a count cutoff >20 reads is also listed. CE, cassette exon; AS 5′SS, alternative 5′ splice site; AS 3′SS, alternative 3′ splice site; and MXE, mutually exclusive exons. (B) Analysis shows correlation between ΔPSI values [PSI (CELF1 overexpression—PSI (MDAF)] obtained by RNA-seq and RT-PCR for 5 splicing events tested at each time point of hCELF1par, hCELF1nuc and hCELF1cyt overexpression. (C–E) AS transitions were intersected between CELF1 overexpression (as compared with MDAF negative controls); (C) in the hCELF1par and hCELF1nuc lines induced for 5 or 7 days; (D) in the hCELF1par, hCELF1nuc and TRECUGBP1 lines induced for 5 or 7 days, with GO analysis; or in the (E) hCELF1par, hCELF1nuc and hCELF1cyt lines induced for 5, 7 or 21 days, respectively. P, Fisher’s exact test. Red line = P-value of ≤0.032. CC, cellular compartment; BP, biological process; MF, molecular function.
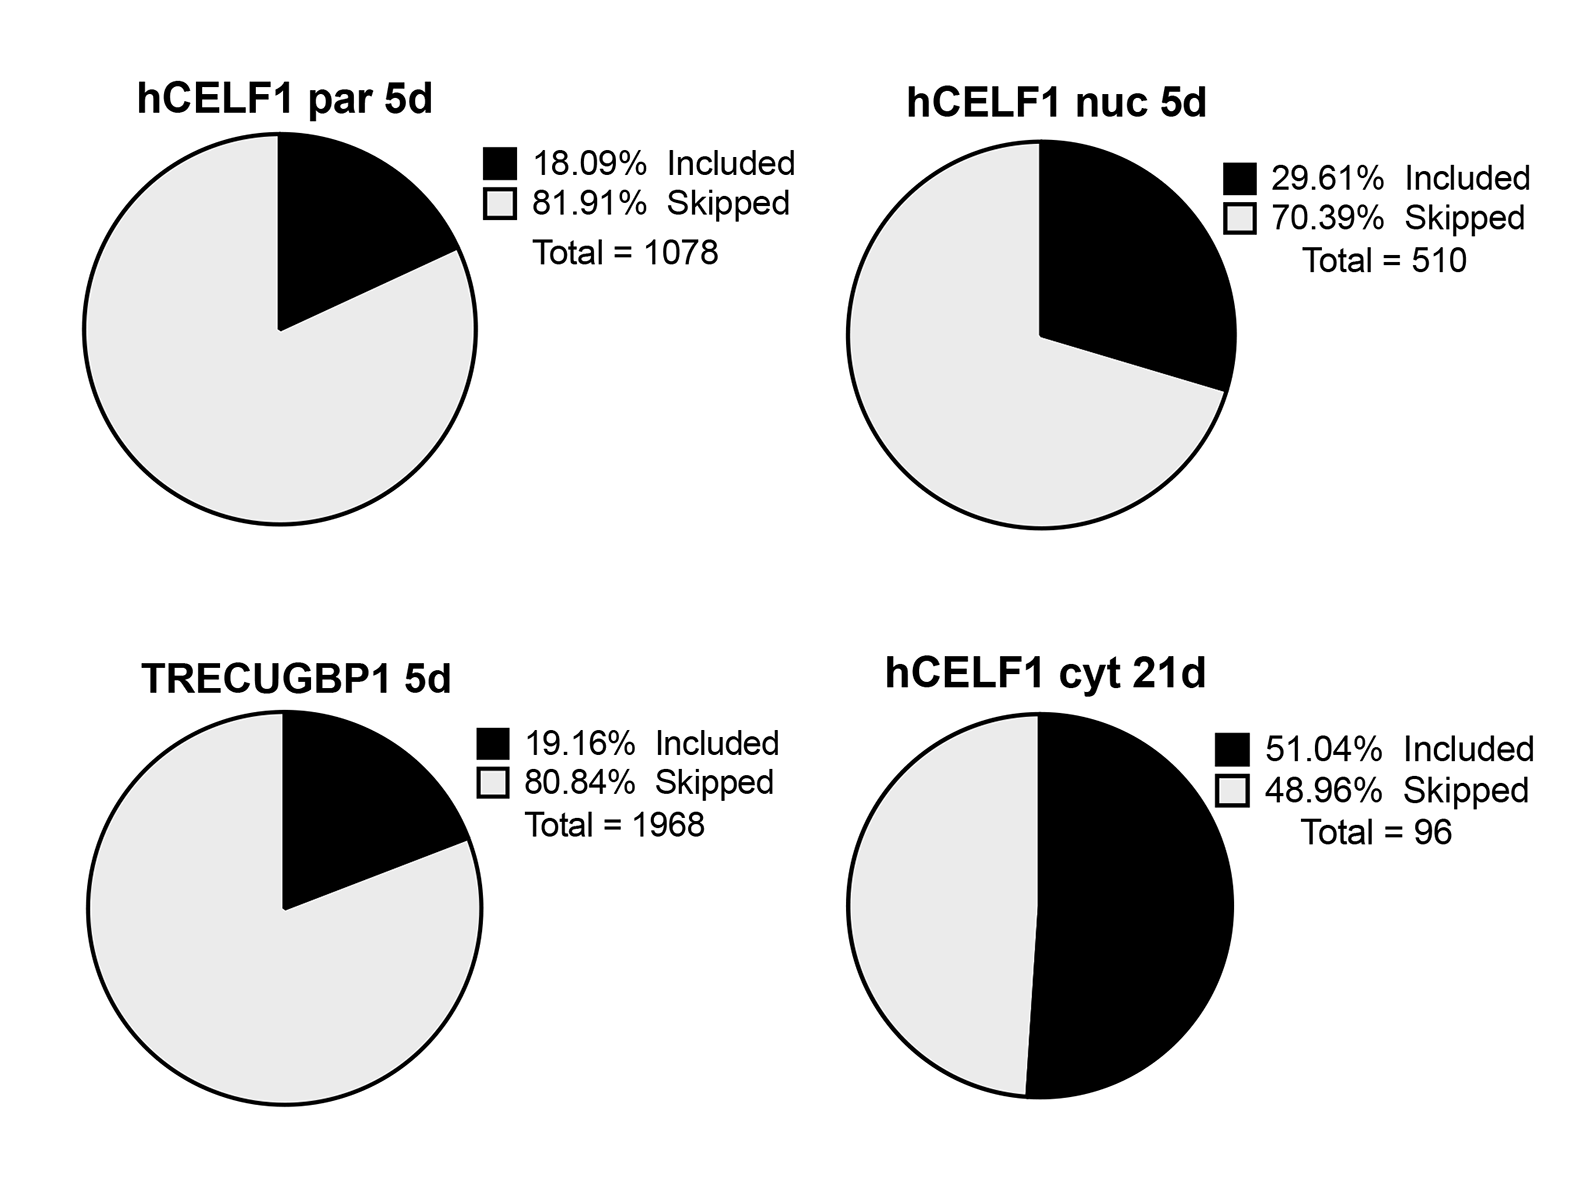
Overexpression of CELF1 for 5 days induced >1400 splicing changes in the hCELF1par line, nearly 700 splicing changes in the hCELF1nuc line, and >2600 splicing changes in the TRECUGBP1 positive control line (in which expression of exogenous CELF1 is higher), as compared to MDAF negative controls on dox (Fig. 7A). Overexpression of hCELF1cyt for 7 (data not shown) and 21 days (Fig. 7A) as compared to MDAF controls showed significantly fewer splicing changes (~160 and ~150 events total, respectively), consistent with low levels of protein in the nucleus. Alternative splicing transitions in all lines were predominantly cassette exons (>70%, Fig. 7A) with a majority of the changes demonstrating an increase in cassette exon skipping (Supplemental Material, Fig. S10).
Overexpression of hCELF1par or hCELF1nuc led to many of the same alternatively spliced genes, as compared to MDAF negative controls on dox. Of the >900 genes that displayed alternative splicing changes in the hCELF1nuc line, approximately 60% were also observed in the hCELF1par line (Fig. 7C). Furthermore, a significant proportion of these changes (80%) were also observed in the TRECUGBP1 positive control line (Fig. 7D). Only ~7% of the alternatively spliced genes that were shared between the hCELF1par and hCELF1nuc lines were also observed in animals from the hCELF1cyt line (Fig. 7E), and this set of changes was not pursued further as they do not correlate with skeletal muscle wasting. Together, this analysis has provided us with a focused set of alternative changes observed in three lines of CELF1 overexpression in which skeletal muscle wasting and myopathy are observed to be used for further investigation.
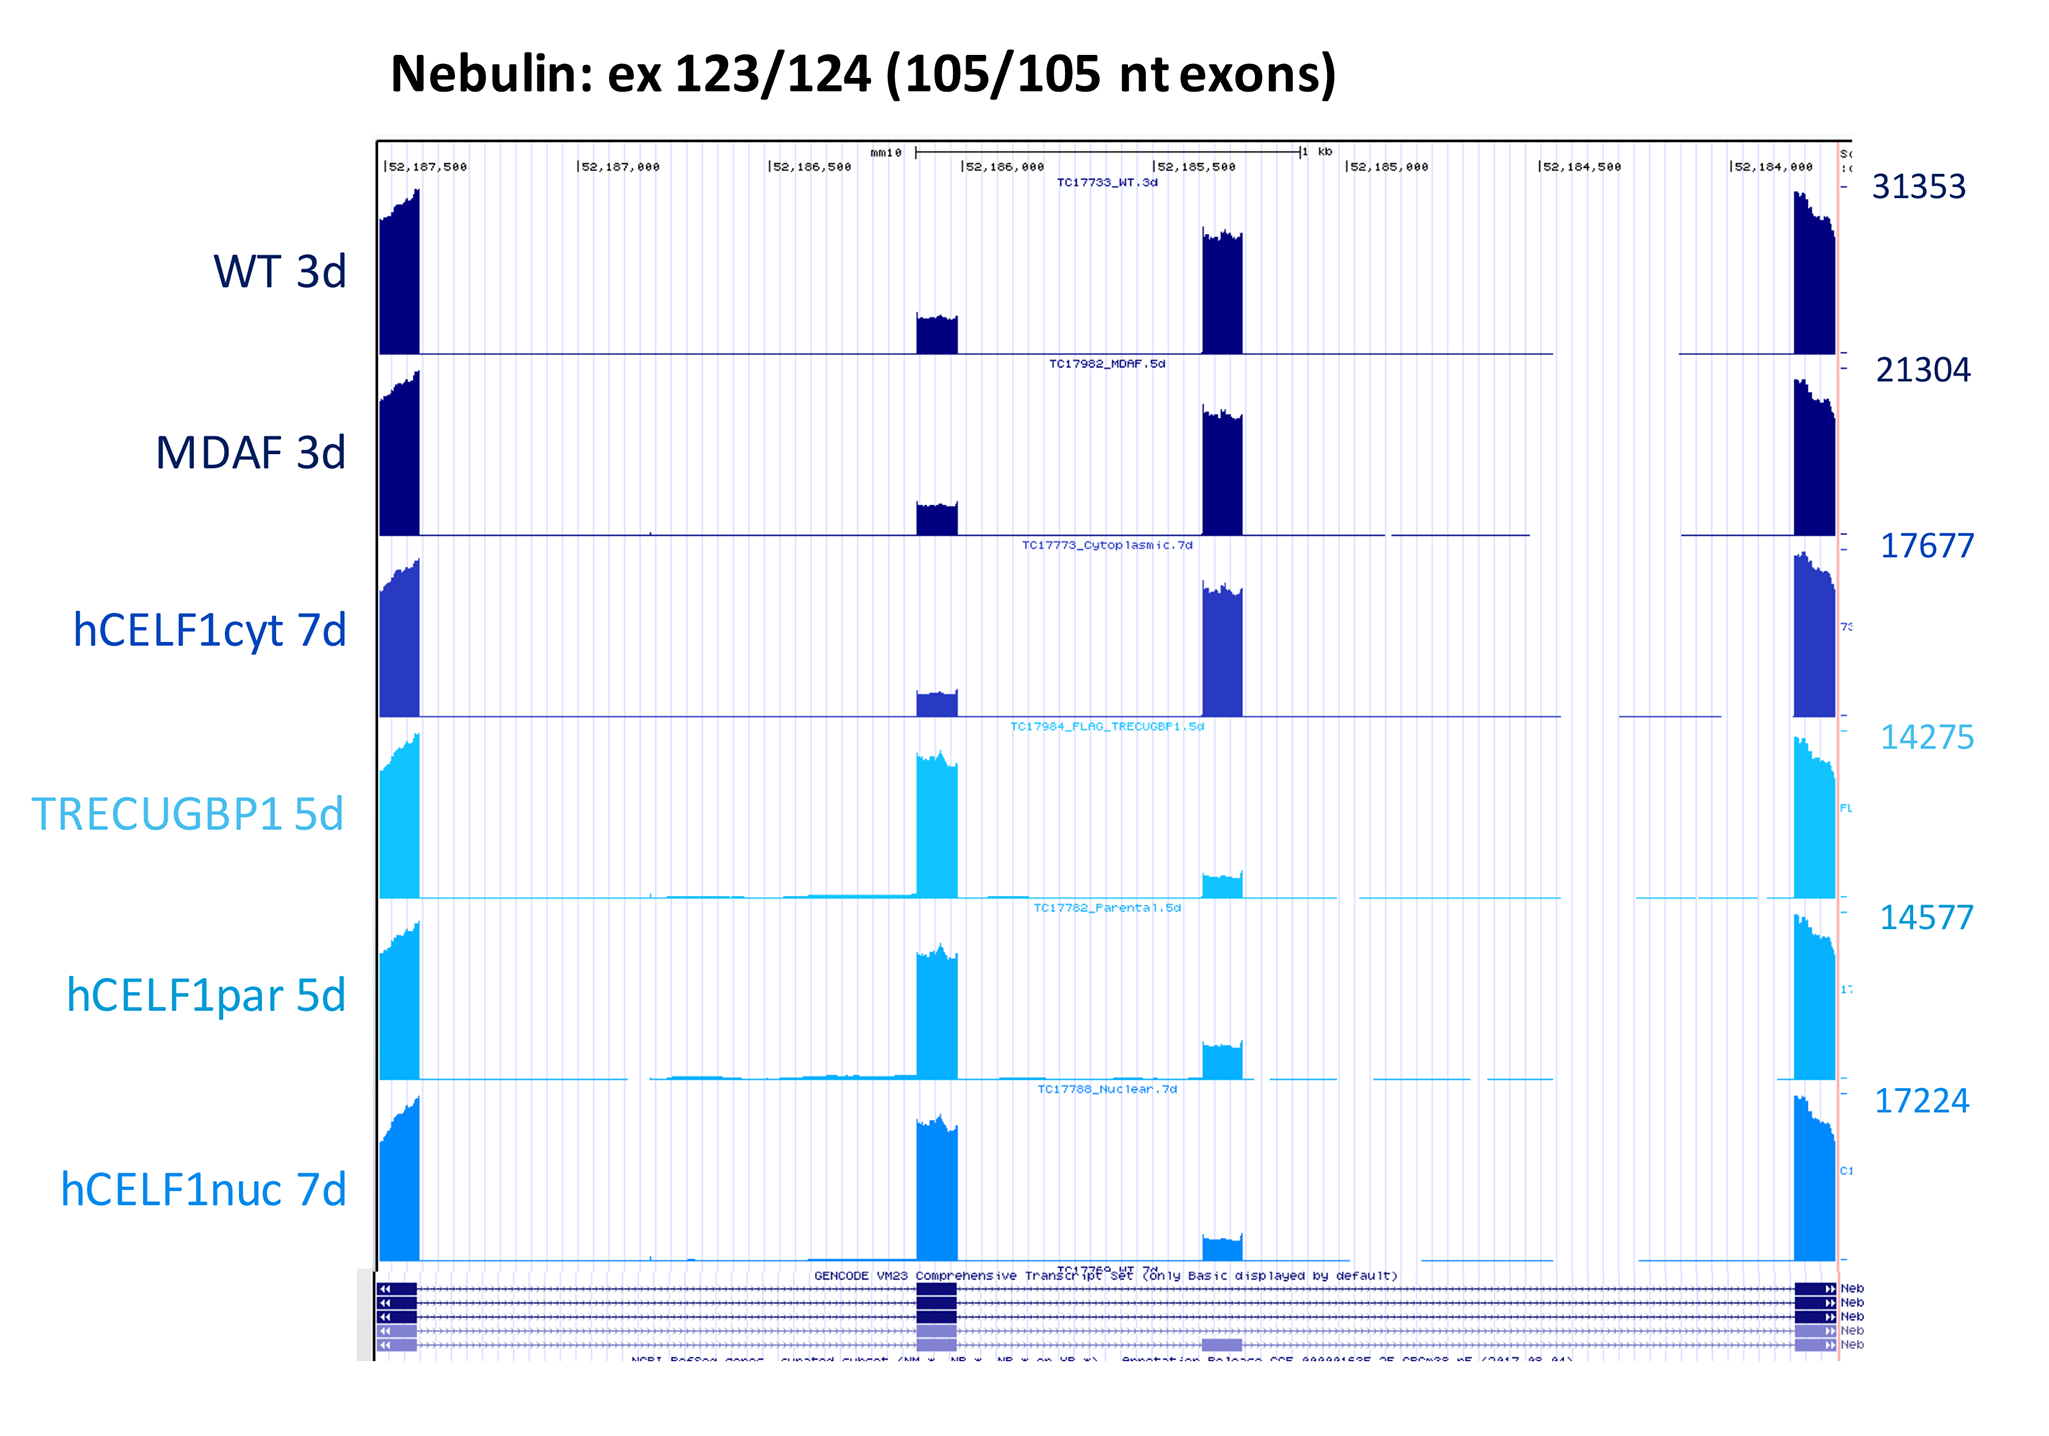
Gene ontology and functional enrichment analyses of the alternatively spliced genes shared between animals from the hCELF1par, hCELF1nuc and TRECUGBP1 lines, using the Database for Annotation, Visualization and Integrated Discovery (DAVID) (49), showed significant enrichment of genes involved in cytoskeleton dynamics, membrane dynamics, RNA processing and zinc ion binding (Fig. 7D). Among this group is a strong alternative splicing change in the developmentally regulated 105 nucleotide exons in the Nebulin transcript (exons 123/124 in mm10) (50), illustrating a transition toward the fetal from the adult splicing pattern (Supplemental Material, Fig. S11). Nebulin is an actin-binding protein localized predominantly to the thin filaments of skeletal muscle sarcomeres (51), and while the implications of this switch remain to be fully elucidated, mutations in the Nebulin gene are known to cause skeletal muscle weakness and structural abnormalities within myofibers (52). Genes involved in calcium ion transport were also enriched to a lesser degree (Fig. 7D), such as the calmodulin-dependent protein kinase II that is involved in sarcoplasmic reticulum Ca2+ transport in skeletal muscle (53).
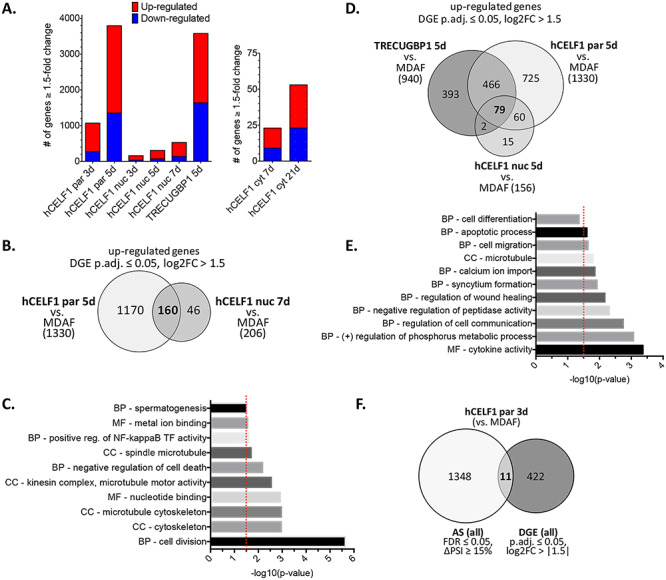
Analysis of differential gene expression (DGE) was conducted similarly to alternative splicing analysis with gene expression quantified by RSEM (54) and DGEs called DESeq2 (55). Gene expression data was highly reproducible among biological replicates (Supplemental Material, Fig. S9B). Differentially expressed genes with ≥1.5-fold change in expression and an adjusted P-value ≤ 0.05 were considered significantly altered. Animals induced to overexpress hCELF1par for 3 days displayed >1000 differentially expressed genes (Fig. 8A). Induction of hCELF1par for 5 days, when histopathological changes were first detected, led to a substantial increase to nearly 3800 differentially expressed genes. Overexpression of hCELF1nuc led to considerably fewer changes, with 163 differentially expressed genes 3 days post-induction, as compared to MDAF negative controls, and just over 300 differentially expressed genes after 5 days of hCELF1nuc overexpression. By 7 days post-induction of hCELF1nuc, ~500 genes were differentially expressed as compared to MDAF controls (Fig. 8A). A majority of the differentially expressed genes in the hCELF1par and hCELF1nuc overexpression lines were upregulated relative to MDAF negative controls (Fig. 8A).
Figure 8.
CELF1 overexpression results in widespread DGE in adult skeletal muscle. RNA-sequencing data analyzed for DGE. Animals with comparable mCherry-CELF1 protein expression and similar minimal histological defects were chosen for sequencing. (A) Differentially expressed genes displaying ≥1.5-fold change (P.adj ≤ 0.05) as compared to MDAF negative controls. (B) Overlap of DGE as compared to MDAF controls in the hCELF1par and hCELF1nuc lines induced for 5 or 7 days, respectively. (C) GO analysis of overlapping DGE between hCELF1par 5 day and hCELF1nuc 7-day induction. (D) Overlap of DGE as compared to MDAF controls in the hCELF1par, hCELF1nuc and TRECUGBP1 lines induced for 5 days. (E) GO analysis of overlapping DGE hCELF1par, hCELF1nuc and TRECUGBP1 lines induced for 5 days. (F) Genes undergoing AS transitions (∆PSI ≥ 15%) were overlapped with differentially expressed genes (log2-fold change >1.5) in hCELF1par induced for 3 days (as compared to MDAF negative controls). P, Fisher’s exact test. Red line = P-value of ≤0.032. CC, cellular compartment; BP, biological process; MF, molecular function.
In the TRECUGBP1 positive control line, with higher exogenous CELF1 expression, >3500 genes were differentially expressed (Fig. 8A). In contrast, animals induced to overexpress hCELF1cyt for 7 days displayed only 23 differentially expressed genes, as compared to MDAF negative controls on dox, and ~50 differentially expressed genes after 21 days of hCELF1cyt induction (Fig. 8A). MDAF and WT control animals compared to one another yielded 10 or fewer differentially expressed genes (data not shown), indicating that rtTA and dox had little impact to create background effects on gene expression in skeletal muscle. Together these results indicate that in addition to a wide range of alternative splicing transitions observed following CELF1 overexpression, these transgenic lines also display major alterations at the level of gene expression.
To determine the most significantly altered genes shared between hCELF1par, hCELF1nuc and TRECUGBP1 lines, we examined genes that displayed a log2-fold change ≥ |1.5| (~2.9-fold change) and an adjusted P-value ≤ 0.05. The goal here was to identify common changes following CELF1 overexpression that could be resulting in the subsequent myopathy. Animals from the hCELF1par and hCELF1nuc lines induced to overexpress CELF1 for 5 and 7 days, respectively, had a shared gene list of 178 genes, 160 of which were upregulated compared to MDAF controls (Fig. 8B); therefore we chose to focus further analysis on differentially upregulated genes. Gene ontology and functional enrichment analyses of the differentially upregulated genes shared between the hCELF1par and hCELF1nuc lines, using DAVID, showed significant enrichment of genes involved in cell division and cytoskeleton dynamics (Fig. 8C). There was particular enrichment of genes involved in the microtubule cytoskeleton, such as several microtubule kinesin-like motor proteins which have been previously shown to be involved in proper nuclear positioning during myofiber development (56).
To further narrow down the gene set, comparisons between hCELF1par, hCELF1nuc and TRECUGBP1 lines induced to overexpress CELF1 for 5 days resulted in a limited set of 82 differentially expressed genes, 79 of which were upregulated as compared to MDAF controls (Fig. 8D). Gene ontology and functional enrichment analyses of the differentially upregulated genes shared between all three lines showed significant enrichment of genes involved in cell communication and wound healing, calcium ion transport and microtubule dynamics (Fig. 8E), indicating there are likely major changes occurring to the membrane and cytoskeleton dynamics in response to CELF1 overexpression.
There was little to no overlap between genes with DGE and alternative splicing changes (Fig. 8F), suggesting independent mechanisms of transcriptional and post-transcriptional regulation following CELF1 overexpression. Interestingly, there were four genes that were both differentially expressed and alternatively spliced and also shared between hCELF1par, hCELF1nuc and TRECUGBP1 lines. Among this list, glycerophosphocholine phosphodiesterase 1 (Gpcpd1 or GDE5) was found to be downregulated ~3-fold. Under normal conditions, the Gpcpd1 transcript is expressed at high levels in mouse striated muscle (57). It has been previously shown that Gpcpd1 inhibits skeletal muscle differentiation, independent of its glycerophosphocholine phosphodiesterase activity, and is also downregulated in other instances of skeletal muscle atrophy, such as aging and denervation (57). While it will require further investigation, downregulation of Gpcpd1 could represent a general adaptation response to counteract the muscle pathology observed in these lines (57,58). Future work will entail deeper investigation into how affected mRNAs could be leading to the observed muscle pathology.
Discussion
Elevated levels of CELF1 protein in adult tissue have been shown to be pathogenic in various settings; however, the underlying mechanisms leading to the phenotypic changes associated with elevated CELF1 remain to be elucidated. The pathogenicity of elevated CELF1 protein in adult tissue can be recognized in diseases in which CELF1 is stabilized at the protein level, such as in DM1, as well as in diseases in which CELF1 contains a mutation leading to greater gene output (59). We demonstrate, for the first time, a differential response of muscle to CELF1 overexpression dependent on the cellular localization of the protein. Animals overexpressing hCELF1nuc exhibit significant muscle degeneration and necrosis, similar to animals overexpressing naturally localized hCELF1par. In contrast, animals overexpressing hCELF1cyt to the same level present with healthy muscle and little–no muscle loss. While this does not indicate that the hCELF1cyt has no role in skeletal muscle, it appears that elevated levels of CELF1 in the cytoplasm do not lead to the same pathogenic response as elevated levels in the nucleus. Of note, the mouse lines we designed in this study still express endogenous Celf1 protein. Therefore, even though we have driven overexpression in the individual compartments, endogenous Celf1 is still able to perform its normal role in both compartments. This allows us to ask specifically whether overexpression of CELF1 in one compartment leads to myopathy without complicating the system by depleting endogenous Celf1 in the other cellular compartment.
A caveat with the mouse lines generated in this study is the variable expression levels within and between lines. However, we used this variability to our advantage to directly compare animals between lines that displayed comparable levels of exogenous CELF1. In doing so, we not only identified that the pathogenic effects correlated with CELF1 protein expression levels but that mice expressing comparably low levels of hCELF1nuc still displayed skeletal muscle defects (Fig. 3), indicating that even low levels of CELF1 overexpression in the nucleus has toxic effects.
Animals overexpressing hCELF1par and hCELF1nuc displayed significant changes in alternative splicing. However, we consistently observed splicing changes in the hCELF1nuc line that were not as strong as in the hCELF1par line, indicating CELF1 activity may be partially dampened in the hCELF1nuc line, potentially due to the modifications in the CELF1 coding region to direct localization. Intriguingly, animals from the hCELF1nuc line appear to have a strikingly similar phenotype to those expressing naturally localized CELF1 (both hCELF1par and TRECUGBP1 lines), indicating that these changes are sufficient to elicit the phenotype. Furthermore, the hCELF1par line exhibits significantly more transcriptome alterations than either the hCELF1nuc or hCELF1cyt lines, indicating that perhaps CELF1 regulation of mRNAs are dependent on the protein shuttling between subcellular compartments. RNA-sequencing of our previously published TRECUGBP1 line (Figs 7 and 8) demonstrates that there are many more transcriptome alterations in the TRECUGBP1 line, even when compared to the hCELF1par line. This is likely due to the expression differences between lines since TRECUGBP1 animals express exogenous CELF1 ~8-fold over endogenous (41), whereas the lines generated in this study are in the range of 2–5-fold over endogenous (Fig. 3).
Examination of RNA-sequencing data for DGE demonstrates a set of altered genes distinct from the genes that underwent alternative splicing transitions. Since CELF1 is known to regulate mRNA stability in the cytoplasm, we examined the datasets from the hCELF1cyt line for DGE. Surprisingly fewer differentially expressed genes were identified than we might have predicted; however this is in agreement with previous literature reports, indicating that CELF1 can change both mRNA half-life and protein output without having significant impact on total transcript levels (60). Generally speaking, the effects of mRNA decay on transcript abundance are largely not predictable, and this has been ascribed to the presence of poorly understood mechanisms on the impact of RBP perturbation on expression of transcription factors as well as buffering mechanisms that can alter transcription rates in order to compensate for changes in mRNA decay rates (61–64). We do however detect a decrease specifically in the hCELF1cyt line in mRNAs encoding the protein subunits of the signal recognition particle (SRP), Srp19 and Srp68, which have previously been shown experimentally to be stabilized following Celf1 knockdown in C2C12 myoblasts (60).
While an abundance of transcriptome alterations was identified following CELF1 overexpression in skeletal muscle, we were able to identify transcriptome changes common between lines in which CELF1 overexpression elicits muscle wasting. Interestingly, cytoskeleton dynamics were altered at both the transcriptional and post-transcriptional level. Future work will entail further investigation into specific targets relevant to skeletal muscle physiology to identify the nuclear targets of CELF1 responsible for muscle wasting.
Material and Methods
Transgenic mice
Transgenic mice were developed in an FVB background by pronuclear injection of linearized transgene using standard techniques. To generate the naturally localized parental CELF1 construct (hCELF1par), the coding sequence of CELF1 is unchanged to generate control lines with the natural NES/NLS configuration. Transgenic nuclear CELF1 constructs (hCELF1nuc) were made by adding a 10-amino acid NLS to the N-terminus and changing the conserved leucines in the NES to alanines. To generate the cytoplasmic CELF1 construct (hCELF1cyt), a conserved NLS was removed, and an 11-amino acid NES was added at the N- and C-termini of CELF1. N-terminal mCherry was fused to CELF1 to prevent nuclear–cytoplasmic diffusion as it increases the protein size to 81 kDa.
Transgenic mice (FvB/N) hemizygous for either hCELF1par, hCELF1nuc or hCELF1cyt were crossed with MDAFrtTA transgenic mice (mixed C57BL/6 x DBA background), referred to as MDAF (the term MDAF was not defined in the original paper) (42) to generate F1 bitransgenic animals. MDAF transgenic mice express rtTA2S-M2, which is a modified rtTA with increased doxycycline sensitivity and lower basal activity. The MDAF transgene is driven by the rat myosin light chain 1/3 promoter/enhancer, which drives expression specifically in skeletal muscle. Genotype was confirmed by extracting genomic DNA from mouse tails using DirectPCR Lysis Reagent (Viagen Biotech) and analyzed by multiplex PCR. Primer sequences can be found in Supplemental Material, Table S1. All time points consisted of three genotypes per line: (1) bitransgenic hCELF1par/MDAF mice (or hCELF1nuc/MDAF or hCELF1cyt/MDAF), (2) MDAF littermates and (3) WT littermates. For each line and time point, n = 4–7 males and n = 4–7 females per genotype. At 10–11 weeks of age, adult bitransgenic animals were started on doxycycline-containing chow to induce mCherry-CELF1 expression. Animals from the hCELF1par line were fed chow containing 0.25 g doxycycline/kg chow, hCELF1nuc animals were fed 0.1 g doxycycline/kg chow, and hCELF1cyt animals were fed 2.0 g doxycycline/kg chow (Bio-Serv) for the time course (3, 5, 7 and 10/21 days). Control animals from each line were given the same dox concentration as corresponding bitransgenic animals from that line. All experiments involving mice were conducted in accordance with the NIH Guide for the Care and Use of Laboratory Animals and approved by the Baylor College of Medicine Institutional Animal Care and Use Committee.
C2C12 transfection and immunofluorescence
Cell culture reagents were obtained from GIBCO, Life Technologies. C2C12 cells (ATCC CRL-1772) were maintained in standard growth media (DMEM supplemented with 10% FBS and Penicillin-Streptomycin). C2C12 myoblasts were reverse transfected using TransfeX (ATCC ACS-4005) with hCELF1par, hCELF1nuc or hCELF1cyt plasmids in a 24-well plate. Transcription is driven by a constitutively active CMV promoter/enhancer. Once cells reached ~95–100% confluency 36 h post-transfection, media were changed to low-serum differentiation media (2% horse serum). Fluorescence images were obtained on the Incucyte S3 long-term imaging system (Sartorius) and are of mCherry epifluorescence, shown in red. Images in the undifferentiated state were collected 24 h post-transfection. Images in the differentiated state were collected 5 days post-differentiation.
Skeletal muscle and body weight
In a blinded manner, muscle weight and body weight of each animal was measured on an analytical balance and normalized to tibia length at the conclusion of each time point. Skeletal muscle samples were flash frozen in liquid nitrogen and kept at −80°C until use. Direct comparisons of normalized muscle weight were made between age-matched treatment groups.
Histology
Skeletal muscles were isolated and fixed in 10% formalin for at least 24 h, paraffin-embedded and cut in 10 μm cross sections. Hematoxylin and eosin staining (H&E) of quadriceps, gastrocnemius and tibialis anterior was performed using standard procedures. Images were acquired using an Olympus BX41 microscope with Olympus DP70 camera.
Immunofluorescence
Tibialis anterior muscle was frozen in OCT medium chilled over liquid nitrogen-cooled isopentane and stored at −80. Muscle was cut in 7 μm sections and immediately fixed in paraformaldehyde following sectioning. Slides were stained with DAPI and wheat germ agglutinin. Images taken on the DeltaVision LIVE Deconvolution Microscope (GE Healthcare) are of mCherry epifluorescence, shown in red.
RNA isolation and RT-PCR
Total RNA was isolated from individual skeletal muscles using TRIzol reagent (Invitrogen, 15 596–018) in a Bullet Blender (Next Advance). RT-PCR was performed using amfiSure Ultra Fidelity PCR Master Mix (GenDEPOT). Primers for analysis of alternative splicing events were designed to anneal to flanking constitutive exons. Primer sequences can be found in Supplemental Material, Table S1. PCR products were separated on a native 5% polyacrylamide gel and imaged using a Kodak E1 Logic 2200 imaging system. Percent spliced in (PSI) was calculated after standardizing for ethidium bromide staining proportional to PCR product length (PSI: intensity of top band/intensity of both bands) x 100. RNA for RNA-seq was extracted using the RNeasy Fibrous Tissue Mini Kit (Qiagen 74704) following manufacturer protocols.
Protein isolation and immunoblotting
Total protein was isolated from skeletal muscles by homogenization using a HEPES-sucrose lysis buffer (0.75 M HEPES, cOmplete™ ethylenediaminetetraacetic acid (EDTA)-free Protease Inhibitor Cocktail (Roche, 11 873 580 001), 1.0 M sucrose, 0.5 M EDTA). Cellular debris was cleared by centrifugation (14 000 x g for 15 min at 4°C). Protein samples (30 μg) were separated on a 10% Tris-glycine SDS-PAGE gel and transferred to 0.45 μm Immobilon-P PVDF membranes (EMD Millipore, IPVH00010). Membranes were stained with Ponceau S prior to immunoblotting to visualize total protein and incubated with primary antibody in 5% milk/phosphate buffered saline and 0.1% Tween-20 (PBST) (0.1% Tween-20, Sigma, P9416) overnight at 4°C. The antibodies are anti-CUGBP1(1:500, Millipore 05-621), anti-p27Kip1 (1:1000, Abcam ab32034), anti-MEF2A (1:500, Novus NBP1-95565), anti-Gapdh (1:100000, Cell Signaling 2118) and anti-Rbfox (1:250, in-house). Membranes were washed in PBST and incubated with secondary antibody in 5% milk/PBST for 1 h at room temperature [horseradish peroxidase (HRP)-conjugated goat anti-rabbit (1:5000, Invitrogen) or goat anti-mouse (1:3000, light chain specific, Jackson ImmunoResearch (115–035-174)]. Immunoreactivity was detected using West Pico HRP-chemiluminescence (Thermo Scientific) and Immobilon Western Chemiluminescent HRP Substrate (Millipore WBKLS0100). Membranes were imaged on a ChemiDoc XRS+ Imaging system (BioRad) and processed in ImageJ (NIH; Bethesda, MD). Protein signal was measured by densitometry using the ImageJ Gel Analysis tool. Background was subtracted for each band and band intensity normalized to total protein (target protein signal for each sample divided by the sum of data obtained for that sample) using total protein staining as measured by Coomassie.
Subcellular protein fractionation
The subcellular fractionation protocol was modified from Thermo Scientific Subcellular kit for tissue (87790). Modifications made to the protocol are as follows: (1) additional wash/spin steps were added after collection of the cytoplasmic fraction, and (2) additional vortex steps were added when extracting nuclear fraction. For the first modification, after collection of the cytoplasmic fraction, remaining supernatant was aspirated, pellet washed with 100uL cold PBS and centrifuged 500 x g for 5 min, and remaining supernatant aspirated before proceeding with the protocol as written. These additions yielded cleaner separation. For the second modification, after the addition of Nuclear Extraction Buffer, the vortex step was increased to 15 seconds, followed by 30 seconds on ice, vortex for an additional 5 seconds, gentle mixing in 4°C for 30 min and vortex an additional 5 seconds before proceeding to next step. These changes yielded greater protein yield from the nuclear fraction.
Illumina TruSeq RNA sample preparation protocol
The Genomic and RNA Profiling Core first conducted Sample Quality checks using the NanoDrop spectrophotometer and Agilent Bioanalyzer 2100, only those samples passing the following criteria were used for RNA-seq: RNA integrated number (RIN) ≥ 7.9, ratio A260nm/A280nm ≥ 1.8, ratio A260nm/A230nm ≥ 1.4 and ratio r28S/16S ≥ 1.5. The Illumina TruSeq Stranded mRNA library preparation protocol was then used to generate cDNA libraries starting with 250 ng of total RNA. Library prep kit: TruSeq Stranded mRNA (p/n 20 020 594), following user guide p/n 15 031 047, Rev E. ERCC RNA Spike-In Controls were added to each sample according to the manufacturer’s protocol. The resulting libraries were quantitated using the NanoDrop spectrophotometer and fragment size assessed with the Agilent Bioanalyzer. A qPCR quantitation was performed on the libraries to determine the concentration of adapter ligated fragments using Applied Biosystems ViiA7 Real-Time PCR System and a KAPA Library Quantification Kit.
RNA-sequencing
The pooled libraries were loaded onto a NovaSeq 6000 S4 flowcell and sequenced to a depth of ~150 million read pairs/sample (average 193 million). A paired-end 150 cycle run was used to sequence the flowcell on a NovaSeq 6000 Sequencing System.
Computational processing of RNA-sequencing data
The raw fastq files were first quality checked using FastQC v0.11.8 software (http://www.bioinformatics.bbsrc.ac.uk/projects/fastqc/). Fastq files were aligned to mm10 mouse reference genome (GRCm38.39) and per-gene counts quantified by RSEM (1.3.1) (54) based on the gene annotation Mus_musculus.GRCm38.89.chr.gtf. Differentially expressed genes are called with FDR <0.05 using DESeq2 (65). For splicing analysis, reads were aligned to mm10 mouse reference genome (GRCm38.89) using HISAT2 (2.1.0) (48). Based on the bam files generated from the alignment, differential splicing was analyzed using rMATS (v4.0.2) which annotated and statistically analyzed five different kinds of splicing events, cassette exon (CE), alternative 5′ splice site (AS 5′SS), alternative 3′ splice site (AS 3′SS), mutually exclusive exons (MXE) and retained intron (RI) events, using Mus_musculus.GRCm38.89.chr.gtf gene annotation. Splicing events were considered significant if passing the following criteria: reads ≥20, FDR ≤ 0.05, and ΔPSI ≥0.15.
Gene ontology analysis
The Database for Annotation, Visualization and Integrated Discovery (DAVID) v6.8 (49) was used for gene ontology analysis. Enriched categories with –log10 (P-values) ≥ 1.5 (P-value of ≤ 0.032) were considered significant.
Statistical analysis
All data were presented as mean ± standard deviation. Analysis of variance (ANOVA) was utilized to compare means between experimental groups, as appropriate. P-values were calculated using the appropriate statistical tests and post hoc corrections, indicated in figure legends.
Supplementary Material
Acknowledgements
We thank the Mouse ES Cell Core led by Jason Heaney and the Genetically Engineered Mouse Core led by Jianming Xu at Baylor College of Medicine for generating all parental, nuclear, and cytoplasmic hCELF1 mouse lines. We also thank Dr. Mendell Rimer for the MDAF-rtTA mice. Thank you to Arseniy Kolonin for critical help with constructs, and Riya Thomas for her help with immunofluorescence staining, including Figure 1 images. A special thanks to Adrienne Joseph for her help with maintenance of mouse colonies. Imaging for this project was supported by the Integrated Microscopy Core at Baylor College of Medicine with a special thanks to Hannah Johnson and Fabio Stossi for their assistance and guidance. Thank you to all members of the Cooper lab, Ashish Rao, and Joel Neilson for feedback and manuscript review.
Conflict of Interest Statement. None of the authors have any conflict of interest to disclose.
Funding
This work was supported by the National Institutes of Health [R01AR045653, R01AR060733 and R01HL045565 to T.A.C., 1R21HL145426 to Z.X., and 1F31AR073088 to D.C.C.,]; and the Muscular Dystrophy Association [602529 to T.A.C.]. The Mouse ES Cell Core led by Jason Heaney and the Genetically Engineered Mouse Core led by Jianming Xu at Baylor College of Medicine are partially supported by National Institutes of Health grant [P30CA125123]. The Integrated Microscopy Core at Baylor College of Medicine is supported by the National Institutes of Health [DK56338, and CA125123], CPRIT [RP150578, RP170719], the Dan L. Duncan Comprehensive Cancer Center, and the John S. Dunn Gulf Coast Consortium for Chemical Genomics.
References
- 1. Kalsotra A. and Cooper T.A. (2011) Functional consequences of developmentally regulated alternative splicing. Nat. Rev. Genet., 12, 715–729. [DOI] [PMC free article] [PubMed] [Google Scholar]
- 2. Nakka K., Ghigna C., Gabellini D. and Dilworth F.J. (2018) Diversification of the muscle proteome through alternative splicing. Skelet. Muscle, 8, 8. [DOI] [PMC free article] [PubMed] [Google Scholar]
- 3. Ciolli Mattioli C., Rom A., Franke V., Imami K., Arrey G., Terne M., Woehler A., Akalin A., Ulitsky I. and Chekulaeva M. (2018) Alternative 3′ UTRs direct localization of functionally diverse protein isoforms in neuronal compartments. Nucleic Acids Res., 47, 2560–2573. [DOI] [PMC free article] [PubMed] [Google Scholar]
- 4. Poulos M.G., Batra R., Charizanis K. and Swanson M.S. (2011) Developments in RNA splicing and disease. CSH Perspect. Biol., 3, a000778. [DOI] [PMC free article] [PubMed] [Google Scholar]
- 5. Manning K.S. and Cooper T.A. (2016) The roles of RNA processing in translating genotype to phenotype. Nat. Rev. Mol. Cell Bio., 18, 102–114. [DOI] [PMC free article] [PubMed] [Google Scholar]
- 6. Brinegar A.E. and Cooper T.A. (2016) Roles for RNA-binding proteins in development and disease. Brain Res., 1647, 1–8. [DOI] [PMC free article] [PubMed] [Google Scholar]
- 7. Hinkle E.R., Wiedner H.J., Black A.J. and Giudice J. (2018) RNA processing in skeletal muscle biology and disease. Biochem. Soc. Symp., 10, 1–20. [DOI] [PMC free article] [PubMed] [Google Scholar]
- 8. Conboy J.G. (2017) Developmental regulation of RNA processing by Rbfox proteins. Wiley Interdiscip. Rev. RNA, 8, e1398. [DOI] [PMC free article] [PubMed] [Google Scholar]
- 9. Takada H., Kawana T., Ito Y., Kikuno R.F., Mamada H., Araki T., Koga H., Asashima M. and Taira M. (2009) The RNA-binding protein Mex3b has a fine-tuning system for mRNA regulation in early Xenopus development. Development, 136, 2413–2422. [DOI] [PubMed] [Google Scholar]
- 10. Kishore S., Luber S. and Zavolan M. (2010) Deciphering the role of RNA-binding proteins in the post-transcriptional control of gene expression. Brief. Funct. Genomics, 9, 391–404. [DOI] [PMC free article] [PubMed] [Google Scholar]
- 11. Gilbertson S., Federspiel J.D., Hartenian E., Cristea I.M. and Glaunsinger B. (2018) Changes in mRNA abundance drive shuttling of RNA binding proteins, linking cytoplasmic RNA degradation to transcription. elife, 7, e37663. [DOI] [PMC free article] [PubMed] [Google Scholar]
- 12. Malik A.M., Miguez R.A., Li X., Ho Y.S., Feldman E.L. and Barmada S.J. (2018) Matrin 3-dependent neurotoxicity is modified by nucleic acid binding and nucleocytoplasmic localization. elife, 7, e35977. [DOI] [PMC free article] [PubMed] [Google Scholar]
- 13. Sephton C.F. and Yu G. (2015) The function of RNA-binding proteins at the synapse: implications for neurodegeneration. Cell. Mol. Life Sci., 72, 3621–3635. [DOI] [PMC free article] [PubMed] [Google Scholar]
- 14. Picchio L., Legagneux V., Deschamps S., Renaud Y., Chauveau S., Paillard L. and Jagla K. (2018) Bruno-3 regulates sarcomere components expression and contributes to muscle phenotypes of Myotonic dystrophy type 1. Dis. Model Mech., 11, dmm.031849. [DOI] [PMC free article] [PubMed] [Google Scholar]
- 15. Ladd A.N., Charlet N. and Cooper T.A. (2001) The CELF family of RNA binding proteins is implicated in cell-specific and developmentally regulated alternative splicing. Mol. Cell. Biol., 21, 1285–1296. [DOI] [PMC free article] [PubMed] [Google Scholar]
- 16. Good P.J., Chen Q., Warner S.J. and Herring D.C. (2000) A family of human RNA-binding proteins related to the Drosophila Bruno translational regulator. J. Biol. Chem., 275, 28583–28592. [DOI] [PubMed] [Google Scholar]
- 17. Philips A.V., Timchenko L.T. and Cooper T.A. (1998) Disruption of splicing regulated by a CUG-binding protein in myotonic dystrophy. Science, 280, 737–741. [DOI] [PubMed] [Google Scholar]
- 18. Timchenko L.T., Miller J.W., Timchenko N.A., DeVore D.R., Datar K.V., Lin L., Roberts R., Caskey C.T. and Swanson M.S. (1996) Identification of a (CUG) n triplet repeat RNA-binding protein and its expression in Myotonic dystrophy. Nucleic Acids Res., 24, 4407–4414. [DOI] [PMC free article] [PubMed] [Google Scholar]
- 19. Chau A. and Kalsotra A. (2015) Developmental insights into the pathology of and therapeutic strategies for DM1: back to the basics. Dev. Dynam., 244, 377–390. [DOI] [PubMed] [Google Scholar]
- 20. Chang E.T., Donahue J.M., Xiao L., Cui Y., Rao J.N., Turner D.J., Twaddell W.S., Wang J.Y. and Battafarano R.J. (2012) The RNA-binding protein CUG-BP1 increases survivin expression in oesophageal cancer cells through enhanced mRNA stability. Biochem. J., 446, 113–123. [DOI] [PMC free article] [PubMed] [Google Scholar]
- 21. Chettouh H., Fartoux L., Aoudjehane L., Wendum D., Clapéron A., Chrétien Y., Rey C., Scatton O., Soubrane O., Desbois-Mouton C. et al. (2013) Mitogenic insulin receptor-a is overexpressed in human hepatocellular carcinoma due to EGFR-mediated dysregulation of RNA splicing factors. Cancer Res., 73, 3974–3986. [DOI] [PubMed] [Google Scholar]
- 22. Gao C., Yu Z., Liu S., Xin H. and Li X. (2015) Overexpression of CUGBP1 is associated with the progression of non-small cell lung cancer. Tumor Biol., 36, 4583–4589. [DOI] [PubMed] [Google Scholar]
- 23. Chaudhury A., Cheema S., Fachini J.M., Kongchan N., Lu G., Simon L., Wang T., Mao S., Rosen D.G., Neilson J.R. et al. (2016) CELF1 is a central node in post-transcriptional regulatory programmes underlying EMT. Nat. Commun., 7, 13362. [DOI] [PMC free article] [PubMed] [Google Scholar]
- 24. Shulman J.M., Imboywa S., Giagtzoglou N., Powers M.P., Hu Y., Devenport D., Chipendo P., Chibnik L.B., Diamond A., Feany M.B. et al. (2014) Functional screening in Drosophila identifies Alzheimer’s disease susceptibility genes and implicates tau-mediated mechanisms. Hum. Mol. Genet., 23, 870–877. [DOI] [PMC free article] [PubMed] [Google Scholar]
- 25. Lambert J.C., Ibrahim-Verbaas C.A., Harold D., Naj A.C., Sims R.S., Bellenguez C., Jun G., DeStafano A.L., Bis J.C., Amouyel P. et al. (2013) Meta-analysis of 74,046 individuals identifies 11 new susceptibility loci for Alzheimer’s disease. Nat. Genet., 45, 1452–1458. [DOI] [PMC free article] [PubMed] [Google Scholar]
- 26. Ladd A.N. and Cooper T.A. (2004) Multiple domains control the subcellular localization and activity of ETR-3, a regulator of nuclear and cytoplasmic RNA processing events. J. Cell Sci., 117, 3519–3529. [DOI] [PubMed] [Google Scholar]
- 27. Dasgupta T. and Ladd A.N. (2012) The importance of CELF control: molecular and biological roles of the CUG-BP, Elav-like family of RNA-binding proteins. Wiley Interdiscip. Rev. RNA, 3, 104–121. [DOI] [PMC free article] [PubMed] [Google Scholar]
- 28. Vlasova I.A. and Bohjanen P.R. (2008) Posttranscriptional regulation of gene networks by GU-rich elements and CELF proteins. RNA Biol., 5, 201–207. [DOI] [PMC free article] [PubMed] [Google Scholar]
- 29. Takahashi N., Sasagawa N., Suzuki K. and Ischiura S. (2000) The CUG-binding protein binds specifically to UG dinucleotide repeats in a yeast three-hybrid system. Biochem. Biophys. Res. Commun., 277, 518–523. [DOI] [PubMed] [Google Scholar]
- 30. Ladd A.N., Stenberg M.G., Swanson M.S. and Cooper T.A. (2005) Dynamic balance between activation and repression regulates pre-mRNA alternative splicing during heart development. Dev. Dynam., 233, 783–793. [DOI] [PubMed] [Google Scholar]
- 31. Suzuki H., Jin Y., Otani H., Yasuda K. and Inoue K. (2002) Regulation of alternative splicing of α-actinin transcript by Bruno-like proteins. Genes Cells, 7, 133–141. [DOI] [PubMed] [Google Scholar]
- 32. Wang E.T., Ward A.J., Cherone J.M., Giudice J., Wang T.T., Treacy D.J., Lambert N.J., Freese P., Cooper T.A., Burge C.B. et al. (2015) Antagonistic regulation of mRNA expression and splicing by CELF and MBNL proteins. Genome Res., 25, 858–871. [DOI] [PMC free article] [PubMed] [Google Scholar]
- 33. Lee J.E., Lee J.Y., Wilusz J., Tian B. and Wilusz C.J. (2010) Systematic analysis of Cis-elements in unstable mRNAs demonstrates that CUGBP1 is a key regulator of mRNA decay in muscle cells. PLoS One, 5, e11201. [DOI] [PMC free article] [PubMed] [Google Scholar]
- 34. Graindorge A., Tonquèze O.L., Thuret R., Pollet N., Osborne H.B. and Audic Y. (2008) Identification of CUG-BP1/EDEN-BP target mRNAs in Xenopus tropicalis. Nucleic Acids Res., 36, 1861–1870. [DOI] [PMC free article] [PubMed] [Google Scholar]
- 35. Chang K.T., Cheng C.F., King P.C., Liu S.Y. and Wang G.S. (2017) CELF1 mediates Connexin 43 mRNA degradation in dilated cardiomyopathy. Circ. Res., 121, 1140–1152. [DOI] [PubMed] [Google Scholar]
- 36. Moraes K., Wilusz C. and Wilusz J. (2006) CUG-BP binds to RNA substrates and recruits PARN deadenylase. RNA, 12, 1084–1091. [DOI] [PMC free article] [PubMed] [Google Scholar]
- 37. Timchenko N.A., Iakova P., Cai Z.J., Smith J.R. and Timchenko L.T. (2001) Molecular basis for impaired muscle differentiation in Myotonic dystrophy. Mol. Cell. Biol., 21, 6927–6938. [DOI] [PMC free article] [PubMed] [Google Scholar]
- 38. Brinegar A.E., Xia Z., Loehr J.A., Li W., Rodney G.G. and Cooper T.A. (2017) Extensive alternative splicing transitions during postnatal skeletal muscle development are required for Ca2+ handling. elife, 6, e27192. [DOI] [PMC free article] [PubMed] [Google Scholar]
- 39. Kalsotra A., Xiao X., Ward A.J., Castle J.C., Johnson J.M., Burge C.B. and Cooper T.A. (2008) A postnatal switch of CELF and MBNL proteins reprograms alternative splicing in the developing heart. Proc. Natl. Acad. Sci. U. S. A., 105, 20333–20338. [DOI] [PMC free article] [PubMed] [Google Scholar]
- 40. Bouchard J.P., Cossette L., Bassez G. and Puymirat J. (2015) Natural history of skeletal muscle involvement in myotonic dystrophy type 1: a retrospective study in 204 cases. J. Neurol., 262, 285–293. [DOI] [PubMed] [Google Scholar]
- 41. Ward A.J., Rimer M., Killian J.M., Dowling J.J. and Cooper T.A. (2010) CUGBP1 overexpression in mouse skeletal muscle reproduces features of myotonic dystrophy type 1. Hum. Mol. Genet., 19, 3614–3622. [DOI] [PMC free article] [PubMed] [Google Scholar]
- 42. Ponomareva O.N., Ma H., Vock V.M., Ellerton E.L., Moody S.E., Dakour R., Chodosh L.A. and Rimer M. (2006) Defective neuromuscular synaptogenesis in mice expressing constitutively active ErbB2 in skeletal muscle fibers. Mol. Cell. Neurosci., 31, 334–345. [DOI] [PubMed] [Google Scholar]
- 43. Timchenko L.T., Salisbury E., Wang G.L., Nguyen H., Albrecht J.H., Hershey J.W. and Timchenko N.A. (2006) Age-specific CUGBP1-eIF2 complex increases translation of CCAAT/enhancer-binding protein beta in old liver. J. Biol. Chem., 281, 32806–32819. [DOI] [PubMed] [Google Scholar]
- 44. Timchenko N.A., Patel R., Iakova P., Cai Z.J., Quan L. and Timchenko L.T. (2004) Overexpression of CUG triplet repeat-binding protein, CUGBP1, in mice inhibits myogenesis. J. Biol. Chem., 279, 13129–13139. [DOI] [PubMed] [Google Scholar]
- 45. Zheng Y. and Miskimins W.K. (2011) CUG-binding protein represses translation of p27Kip1 mRNA through its internal ribosomal entry site. RNA Biol., 8, 365–371. [DOI] [PMC free article] [PubMed] [Google Scholar]
- 46. Kim Y.K., Mandal M., Yadava R.S., Paillard L. and Mahadevan M.S. (2014) Evaluating the effects of CELF1 deficiency in a mouse model of RNA toxicity. Hum. Mol. Genet., 23, 293–302. [DOI] [PMC free article] [PubMed] [Google Scholar]
- 47. Kim D., Langmead B. and Salzberg S.L. (2015) HISAT: a fast-spliced aligner with low memory requirements. Nat. Methods, 12, 357–360. [DOI] [PMC free article] [PubMed] [Google Scholar]
- 48. Shen S., Park J.W., Lu Z., Lin L., Henry M.D., Wu Y.N., Zhou Q. and Xing Y. (2014) rMATS: robust and flexible detection of differential alternative splicing from replicate RNA-Seq data. Proc. Natl. Acad. Sci. U. S. A., 111, E5593–E5601. [DOI] [PMC free article] [PubMed] [Google Scholar]
- 49. Huang D.W., Sherman B.T. and Lempicki R.A. (2009) Systematic and integrative analysis of large gene lists using DAVID bioinformatics resources. Nat. Protoc., 4, 44–57. [DOI] [PubMed] [Google Scholar]
- 50. Donner K., Nowak K.J., Aro M., Pelin K. and Wallgren-Pettersson C. (2006) Developmental and muscle-type-specific expression of mouse nebulin exons 127 and 128. Genomics, 88, 489–495. [DOI] [PubMed] [Google Scholar]
- 51. McElhinny A.S., Kazmierski S.T., Labeit S. and Gregorio C.C. (2003) Nebulin the nebulous, multifunctional giant of striated muscle. Trends Cardiovasc. Med., 13, 195–201. [DOI] [PubMed] [Google Scholar]
- 52. Bang M.L., Li X., Littlefield R., Bremner S., Thor A., Knowlton K.U., Lieber R.L. and Chen J. (2006) Nebulin-deficient mice exhibit shorter thin filament lengths and reduced contractile function in skeletal muscle. J. Cell Biol., 173, 905–916. [DOI] [PMC free article] [PubMed] [Google Scholar]
- 53. Tavi P., Allen D.G., Niemela P., Vuolteenaho O., Weckstrom M. and Westerblad H. (2003) Calmodulin kinase modulates Ca2+ release in mouse skeletal muscle. J. Physiol., 551, 5–12. [DOI] [PMC free article] [PubMed] [Google Scholar]
- 54. Li B. and Dewey C.N. (2011) RSEM: accurate transcript quantification from RNA-Seq data with or without a reference genome. BMC Bioinformatics, 12, 323. [DOI] [PMC free article] [PubMed] [Google Scholar]
- 55. Love M.I., Huber W. and Anders S. (2014) Moderated estimation of fold change and dispersion for RNA-seq data with DESeq2. Genome Biol., 15, 550. [DOI] [PMC free article] [PubMed] [Google Scholar]
- 56. Gache V., Gomes E.R. and Cadot B. (2017) Microtubule motors involved in nuclear movement during skeletal muscle differentiation. Mol. Biol. Cell, 28, 865–874. [DOI] [PMC free article] [PubMed] [Google Scholar]
- 57. Okazaki Y., Ohshima N., Yoshizawa I., Kamei Y., Mariggiò S., Okamoto K., Maeda M., Nogusa Y., Fujioka Y., Yanaka N. et al. (2010) A novel glycerophosphodiester phosphodiesterase, GDE5, controls skeletal muscle development via a non-enzymatic mechanism. J. Biol. Chem., 285, 27652–27663. [DOI] [PMC free article] [PubMed] [Google Scholar]
- 58. Hashimoto T., Yang B., Okazaki Y., Yoshuzawa I., Kajihara K., Kato N., Wada M. and Yanaka N. (2016) Time course analysis of skeletal muscle pathology of GDE5 transgenic mouse. PLoS One, 11, e0163299. [DOI] [PMC free article] [PubMed] [Google Scholar]
- 59. Karch C.M., Ezerskiy L.A., Bertelsen S., Alzheimer’s Disease Genetics Consortium and Goate A.M. (2016) Alzheimer’s disease risk polymorphisms regulate gene expression in the ZCWPW1 and the CELF1 loci. PLoS One, 11, e0148717. [DOI] [PMC free article] [PubMed] [Google Scholar]
- 60. Russo J., Lee J.E., López C.M., Anderson J., Nguyen T.-M.P., Heck A.M., Wilusz J. and Wilusz C.J. (2017) The CELF1 RNA-binding protein regulates decay of signal recognition particle mRNAs and limits secretion in mouse myoblasts. PLoS One, 12, e0170680. [DOI] [PMC free article] [PubMed] [Google Scholar]
- 61. Dori-Bachash M., Shalem O., Manor Y.S., Pilpel Y. and Tirosh I. (2012) Widespread promoter-mediated coordination of transcription and mRNA degradation. Genome Biol., 13, R114. [DOI] [PMC free article] [PubMed] [Google Scholar]
- 62. Maekawa S., Imamachi N., Irie T., Tani H., Matsumoto K., Mizutani R., Imamura K., Kakeda M., Yada T., Akimitsu N. et al. (2015) Analysis of RNA decay factor mediated RNA stability contributions on RNA abundance. BMC Genomics, 16, 154. [DOI] [PMC free article] [PubMed] [Google Scholar]
- 63. Lee J.E., Lee J.Y., Trembly J., Wilusz J., Tian B. and Wilusz C.J. (2012) The PARN deadenylase targets a discrete set of mRNAs for decay and regulates cell motility in mouse myoblasts. PLoS Genet., 8, e1002901. [DOI] [PMC free article] [PubMed] [Google Scholar]
- 64. Singh P., James R.S., Mee C.J. and Morozov I.Y. (2019) mRNA levels are buffered upon knockdown of RNA decay and translation factors via adjustment of transcription rates in human HepG2 cells. RNA Biol., 16, 1147–1155. [DOI] [PMC free article] [PubMed] [Google Scholar]
- 65. Anders S. and Huber W. (2010) Differential expression analysis for sequence count data. Genome Biol., 11, R106. [DOI] [PMC free article] [PubMed] [Google Scholar]
Associated Data
This section collects any data citations, data availability statements, or supplementary materials included in this article.