
Fig. 1.
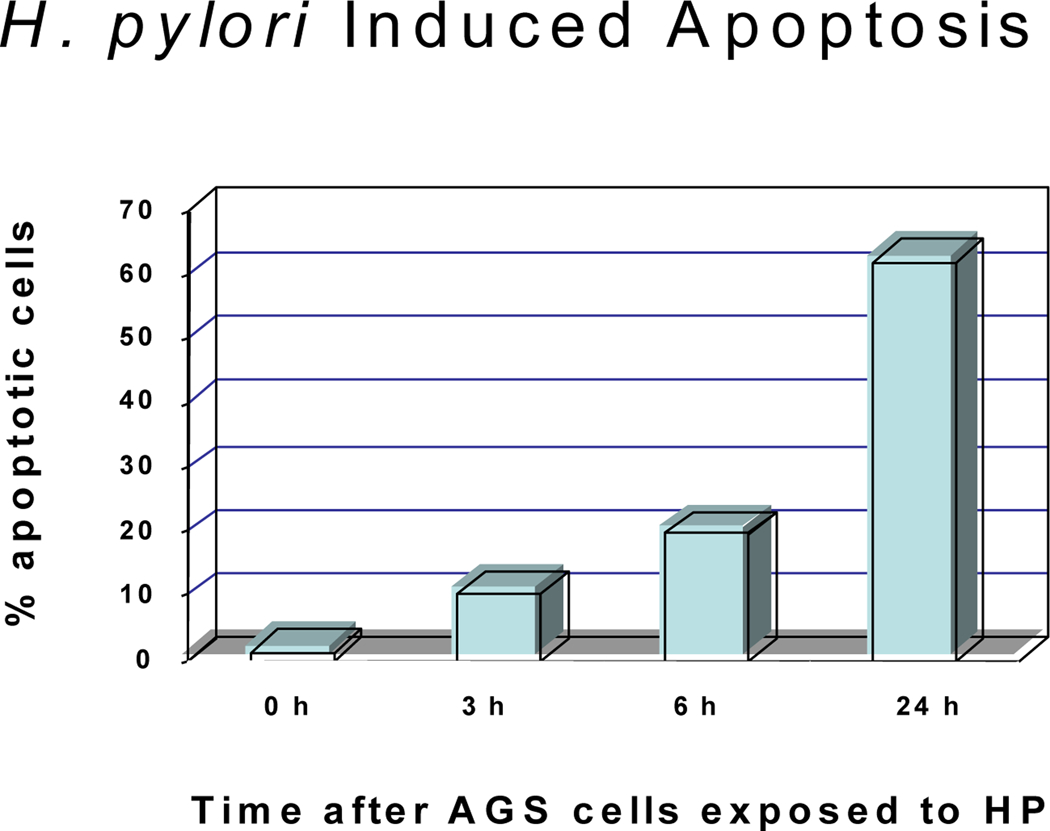

H. pylori-induced cell death and loss of mitochondrial membrane potential (Δψm). (A) Cell death detected in AGS cells exposed to H. pylori for 3, 6, and 24 hours. The cells were exposed to trypan blue (10% v/v) for 5 min. The number of viable cells was determined by light microscopy (40–100X magnification) by counting those cells that excluded the dye. Cells were counted in a randomized manner using a hemocytometer. (B). H. pylori, and mitochondrial membrane potential loss was inhibited by forced Bcl-2 expression. AGS cells (1 × 10⁶ cells/ml) were resuspended in 10 μg/ml TMRE. After incubation cells were immediately analyzed by flow cytometry. Dead cells were excluded by forward and side scatter gating. Data were accumulated by analyzing an average population of 20,000 cells. TMRE fluorescence was detectable in the PI channel (red fluorescence, emission at 590 nm). In parallel experiments AGS cells transfected with Bcl-2 (to inhibit apoptosis) were stained as explained above. Loss of Δψm was quantified by flow cytometry analysis of untransfected cells versus Bcl-2 transfected gastric cells after H. pylori treatment for indicated time periods. Bcl-2 transfected cells exhibit a significantly reduced Δψm at 3 hr after H. pylori treatment (p<0.05). In contrast, Bcl-2 transfected cells exhibit a much slower decline in membrane potential. Each sample was performed in duplicates, and the figure is representative of three assays.