

Abstract
Background
Since the outbreak of 2019 novel coronavirus (severe acute respiratory syndrome coronavirus 2 [SARS‐CoV‐2]) pneumonia, thousands of patients with fever or cough were flocked into fever clinic of designated hospitals in Wuhan, China. To date, no data have ever been reported to reflect the prevalence of coronavirus disease 2019 (COVID‐19) among these outpatients. Moreover, it is almost unknown to discriminate COVID‐19 and nucleic acid negative patients based on clinical features in the fever clinics.
Methods
The infectious status of SARS‐CoV‐2 was estimated among the outpatients. The epidemiological and clinical characteristics were compared between COVID‐19 and nucleic acid negative patients.
Results
The nucleic acid positive rate for SARS‐CoV‐2 in the outpatients from our fever clinic was 67·1%, while the majority of patients with COVID‐19 were mild cases. The predominant initial symptom in those patients with COVID‐19 was fever (78.2%), followed by cough (15.6%). Very significantly lower number of eosinophils was characterized in patients with COVID‐19 as compared with that of nucleic acid negative patients. More importantly, the proportion of subjects with eosinophil counts lower than normal levels in patients with COVID‐19 was much higher than that of nucleic acid negative patients. Fever combined with bilateral ground‐glass opacities in computed tomography imaging and eosinophil count below the normal level are probably a valuable indicator of COVID‐19 infection in those outpatients.
Conclusions
Those findings may provide critical information for the regions, such as Europe and United States that are facing the same situation as Wuhan experienced, and could be valuable to prevent those nucleic acid negative patients from misdiagnosis before antibody testing.
Keywords: COVID‐19, diagnostic indicator, eosinophil, fever clinic
Highlights
This article may provide critical information for the regions that are facing epidemic, and could be valuable to prevent those nucleic acid negative patients from misdiagnosis before antibody testing.
1. INTRODUCTION
An atypical pneumonia outbreak caused by the 2019 novel coronavirus (severe acute respiratory syndrome coronavirus 2 [SARS‐CoV‐2]) infection occurred in Wuhan, and rapidly spread to nationwide before the eve of 2020 Chinese Spring Festival in China. 1 , 2 , 3 The disease is now named as coronavirus disease 2019 (COVID‐19). Given the reality of its high capacity for disease transmission and disease severity in infected patients, 4 , 5 China has activated the first‐level major public health emergency response. Up to 25 February 2020, 78 084 patients have been diagnosed in China, and 47 441 of whom were in Wuhan. 6 The epidemic was later defined as the sixth PHEIC event in the world by World Health Organization, 7 and now became a global pandemic along with patients diagnosed in more than 190 additional countries.
The first case of COVID‐19 was characterized in Wuhan, Hubei Province in December 2019. Its clinical manifestations are very similar to those infected by the SARS‐CoV occurred in 2003. 8 , 9 Although the mortality rate of COVID‐19 in China is 3%, far lower than that of SARS (10.0%), 10 , 11 the mortality rate in Wuhan, unfortunately once reached 9.0% in the early stage of the outbreak, and similarly in Italy now. However, the mortality in Wuhan gradually decreased, suggesting that early diagnosis and treatment could significantly reduce its death rate. Upon the supports from the outsides of Wuhan, increasing cases with respiratory symptoms were accessible to laboratory tests and medical treatments from the fever clinics. Nevertheless, no data have been reported in terms of the proportion of patients with COVID‐19 among all outpatients in fever clinics, or the proportion of severe cases among all patients with COVID‐19. Similarly, no convincing evidence has been suggested to discriminate COVID‐19 from nucleic acid negative patients, or mild case from severe case of COVID‐19.
As a leading hospital in Hubei Province, Tongji Hospital serves as one of the main designated hospitals to carry out fever clinic. This study is designed to analyze the infection rate of SARS‐CoV‐2 in patients visiting fever clinic in Wuhan, and to compare the clinical features between COVID‐19 and nucleic acid negative patients based on the epidemiological, clinical, laboratory and computed tomography (CT) scan results. To further provide more information that could be considered as a worthy reference for the frontline clinicians, a “Clinical Rapid and Preliminary Sorting Score System” was proposed in case that the results for nucleic acid assays are not available or negative because of inappropriate sample collection. This system was designed to assess the possibility of COVID‐19 positivity based on the clinical characteristics and laboratory results in outpatients.
2. METHODS
2.1. Patients
In this retrospective study, we recruited all febrile patients from the fever clinic of Tongji Hospital in Wuhan, China, from 30 January to 4 February 2020, the peak time period of this pandemic in Wuhan. The COVID‐19 nucleic acid assays were conducted in Tongji Hospital. Throatswab specimens from the upper respiratory tract were collected from all outpatients twice with a 24 hours interval. Fever was defined as axillary temperature reached 37.3°C or above. Due to the strong transmission potency of those newly infected patients, fever clinics of hospitals in Wuhan were soon established to isolate and treat all suspected fever patients to identify COVID‐19 earlier and to prevent cross‐infection effectively. Tongji Hospital, as one of the biggest three first‐class grade‐A hospitals in Wuhan, also in Hubei province, is mandatory to provide treatments of infectious diseases for all fever patients from its designated fever clinic. The study was approved by the Human Assurance Committee of Tongji Hospital, and a written informed consent was obtained from each participant.
A total of 936 outpatients with COVID‐19 nucleic acid assays were recruited. The epidemiological, clinical, laboratory, and management data are obtained from each patient between 30 January and 4 February 2020. In case some of the data were missed from the records or specific clarification was necessary, we obtained those data by directly communicating with the attending doctors and healthcare providers.
According to the COVID‐19 Diagnosis and Treatment Protocol, 12 patients diagnosed as COVID‐19 were classified based on their clinical manifestations. Mild case was defined as mild clinical manifestations, with or without pneumonia changes of CT scans. Severe case was defined as: (a) respiratory distress, RR ≥ 30 times/min; (b) oxygen saturation ≤93% at rest; and (c) Pao2/Fio2 ≤ 300mm Hg (1 mm Hg = 0.133 kpa). Critical case was defined as: (a) respiratory failure requiring mechanical ventilation; (b) occurrence of shock; and (c) combined with failure of other organs and intensive care unit was required.
2.2. Flow cytometry analysis
The blood samples of patients were processed at Biosafety level 3 environment. Erythrocytes were lysed with 1X RBC lysis buffer (Invitrogen, Shanghai, China) for 15 minutes at room temperature. The cells were then washed with phosphate‐buffered saline containing 2% bovine serum albumin. For surface/intracellular staining, the cells were incubated with Alexa Flour 700‐anti‐human CD45 (2D1), Brilliant Violet 650‐antimouse/human CD11b, APC anti‐human CD193 (CCR3), PE‐anti‐human CD203c (E‐NPP3), and PE/Cyanine7 anti‐human CD117 (c‐kit) according to the manufacturer's instruction (BioLegend, Wuhan, China). SARS‐CoV‐2 antigen was stained with a previously reported Rabbit‐anti‐RP3‐NP antibody, 13 followed by staining with a FlTC‐ant‐irabbit immunoglobulin G (IgG) (H + L) (Proteintech, Shanghai, China). The cells were fixed with 4% paraformaldehyde at 4°C overnight after staining. Flow cytometry data were acquired on a MACSQuant TM flow cytometer (Miltenyi BioTech, Auburn, CA) and analyzed by the flowJo software (v10.5.3).
2.3. Data collection
Epidemiological data including patients' age and sex information, clinical symptoms, blood routine results, and CT scans were collected through the standardized data collection tables from the electronic medical records.
2.4. Statistical analysis
Categorical variables were described as count (%), and continuous measurements were described using mean and standard deviation (SD). The detection proportions of COVID‐19 positive at different time points were plotted as a figure. Proportions for categorical variables were compared using the χ 2 test, although the Fisher exact test was used when the data were limited. Means for continuous variables were compared using the Mann‐Whitney test. A “Clinical Rapid and Preliminary Sorting Score System” was proposed to assess the possibility of COVID‐19 positivity based on the clinical characteristics and laboratory results in outpatients. Specifically, the predictive proportions of COVID‐19 positivity were carried out based on the mean positive predictive value in different combinations of clinical charts, CT scan and eosinophil count. All statistical tests were two‐sided, and P < .05 was considered as statistically significant.
3. RESULTS
Since Tongji Hospital is almost located in the center of COVID‐19 epidemic, its fever clinic received 936 visitors between 30th January to 4th February 2020, which was the peak period of this outbreak. All of those 936 visitors were undergone at least twice of COVID‐19 nucleic acid assays with a 24 hours of interval, and 628 of whom were positive for the assays, and thus diagnosed as COVID‐19 (67.1%), while the rest 308 visitors were negative (32.9%). In terms of age distribution, the average age for the diagnosed patients with COVID‐19 was 53 years (±14.8 years), while the average age for nucleic acid negative patients was 49 years (±13.0 years), which was significantly younger than that of COVID‐19 patients (P < .01). Among those patients with COVID‐19, 296 are males (47.1%) and 332 are females (52.9%). In those nucleic acid negative patients, 142 are males (46.1%) and 166 are females (53.9%). No significant difference was noted between the patients with COVID‐19 and nucleic acid negative patients in terms of genders (Table 1).
Table 1.
The baseline characteristics of patients in fever clinic of Tongji Hospital according to the SARS‐CoV‐2 infection status
| Patients (N = 936) | SARS‐CoV‐2 infection status | ||
|---|---|---|---|
| Basic characteristics | Positive (N = 628) (%) | Negative (N = 308) (%) | P value a |
| Age, mean (SD), y | 53 (14.8) | 49 (13.0) | .0005 b |
| Sex | .767 | ||
| Female | 332 (52.9) | 166 (53.9) | |
| Male | 296 (47.1) | 142 (46.1) | |
| Classification of disease | |||
| Mild | 553 (88.1) | 278 (90.3) | .511 |
| Severe | 72 (11.5) | 28 (9.1) | |
| Critical | 3 (0.5) | 2 (0.7) | |
| Vital signs | |||
| T, median (IQR), °C | 37.8 (37.2‐38.2) | 37.8 (37.4‐38.3) | .704 b |
| R, median (IQR), times per minute | 24 (21‐28) | 24 (21‐28) | .277 b |
| HR, median (IQR), times per minute | 94 (89‐101) | 94 (89‐98) | .722 b |
| SpO2, median (IQR), % | 97 (95‐99) | 97 (95‐98) | .442 b |
| Initial symptoms | |||
| Fever | 491 (78.2) | 225 (73.1) | .085 |
| Cough | 98 (15.6) | 65 (21.1) | .043 |
| Fatigue | 42 (6.7) | 24 (7.8) | .587 |
| Chest tightness | 15 (2.4) | 10 (3.2) | .518 c |
| Diarrhea | 12 (1.9) | 6 (2.0) | 1.000 c |
| Muscle ache | 8 (1.3) | 2 (0.6) | .511 c |
| Dyspnea | 6 (1.0) | 2 (0.6) | 1.000 c |
| Anorexia | 3 (0.5) | 4 (1.3) | .226 c |
| Rhinobyon | 2 (0.3) | 0 | 1.000 c |
| Vomiting | 1 (0.2) | 0 | 1.000 c |
| Sore throat | 1 (0.2) | 3 (1.0) | .107 c |
| Aversion to cold | 1 (0.2) | 1 (0.3) | .550 c |
| Nausea | 1 (0.2) | 1 (0.3) | .550 c |
| Hypersomnia | 1 (0.2) | 0 | 1.000 c |
| Expectoration | 1 (0.2) | 0 | 1.000 c |
| Dizziness | 1 (0.2) | 0 | 1.000 c |
| Xerostomia | 1 (0.2) | 0 | 1.000 c |
| Chest pain | 0 | 2 (0.6) | .108 c |
| Abdominal distention | 0 | 1 (0.3) | .329 c |
Note: Data are n (%) unless specified otherwise.
Abbreviations: IQR, interquartile range; SARS‐CoV‐2, severe acute respiratory syndrome coronavirus 2.
P values comparing SARS‐CoV‐2 positive group and negative group were from χ 2 test.
P value were calculated by Mann‐Whitney test.
P values comparing SARS‐CoV‐2 positive group and negative group were from Fisher exact test.
It was noted that fever was the predominant initial symptom in COVID‐19 patients, which accounted for 78.2%, followed by cough (15.6%). Other symptoms including fatigue (6.7%), chest tightness (2.4%), diarrhea (1.9%), muscle ache (1.3%), and dyspnea (1.0%) were also observed. Only a very small proportion of patients with COVID‐19 also manifested anorexia (0.5%), rhinobyon (0.3%), vomiting (0.2%), sore throat (0.2%), aversion to cold (0.2%), nausea (0.2%), hypersomnia (0.2%), expectoration (0.2%), dizziness (0.2%), and xerostomia (0.2%). However, fever was also characterized to be the major initial symptom for those nucleic acid negative patients as well, which accounted for 73.1%, and cough accounted for 21.1% (Table 1).
Among all 936 visitors, 460 of them conducted routine blood tests, and 309 were patients with COVID‐19, while the rests were nucleic acid negative patients. The average number of lymphocytes in patients with COVID‐19 was 1.2 × 10⁹/L, while it was 1.4 × 10⁹/L for the nucleic acid negative patients, and no significant difference was observed between the two groups (P = .062). In sharp contrast, COVID‐19 patients displayed significantly lower number of platelet counts as compared with that of nucleic acid negative patients (195.30 × 10⁹ vs 216.00 × 10⁹/L; P = .026).
Remarkably, very significantly lower number of eosinophils was characterized in patients with COVID‐19 as compared with that of nucleic acid negative patients (0.02 × 10⁹ vs 0.03 × 10⁹/L; P = .002). More importantly, the proportion of subjects with eosinophil counts lower than normal levels in COVID‐19 patients was much higher than that of nucleic acid negative patients (74.11% vs 59.60%; P = .002) (Table 2). This observation prompted us to check whether the decrease of eosinophils was caused by COVID‐19 viral infection. To this end, we selected a COVID‐19 convalescent following treatment and three COVID‐19 patients still under critical condition for the study. In line with the above results from the outpatients, the active patients with COVID‐19 displayed significantly lower percentage of eosinophils as compared with the convalescent (0.26% vs 0.08%) (Figure 1A). Strikingly, immunostaining of COVID‐19 viral antigen confirmed direct infection in eosinophils (Figure 1B), and a significantly higher proportion of infected eosinophils was characterized in active patients with COVID‐19 (13.4% vs 5%) (Figure 1C). Collectively, those data support that eosinophil count could be a viable marker for confirming the diagnosis of COVID‐19.
Table 2.
The blood routine characteristics of patients visiting the heat outpatient of Tongji Hospital according to SARS‐CoV‐2 infection status
| Patients (N = 460) | SARS‐CoV‐2 infection status | ||
|---|---|---|---|
| Positive (N = 309) (%) | Negative (N = 151) (%) | P value a | |
| Leukocytes (×109 per L; normal range, 3.5‐9.5) b | |||
| Mean (SD) | 6.1 (6.1) | 5.9 (3.1) | .943 |
| Increased | 26 (6.4) | 13 (6.0) | .561 |
| Decreased | 48 (11.8) | 32 (14.8) | |
| Neutrophils (×109 per L; normal range, 1.8‐6.3) | |||
| Mean (SD) | 4.0 (2.1) | 4.2 (2.6) | .804 |
| Increased | 38 (12.3) | 19 (12.6) | .795 |
| Decreased | 25 (8.1) | 15 (9.9) | |
| Neutrophil rates (%; normal range, 40.0‐75.0) | |||
| Mean (SD) | 67.2 (12.5) | 66.0 (64.0) | .201 |
| Increased | 80 (25.9) | 35 (23.2) | .798 |
| Decreased | 5 (1.6) | 3 (2.0) | |
| Lymphocytes (×109 per L; normal range, 1.1‐3.2) | |||
| Mean (SD) | 1.2 (0.5) | 1.4 (0.7) | .062 |
| Increased | 2 (0.7) | 2 (1.3) | .211 c |
| Decreased | 144 (46.6) | 58 (38.4) | |
| Lymphocyte rates (%; normal range, 20.0‐50.0) | |||
| Mean (SD) | 23.3 (10.4) | 24.4 (10.4) | .186 |
| Increased | 3 (1.0) | 2 (1.3) | .101 c |
| Decreased | 128 (41.4) | 47 (31.1) | |
| Neutrophil to lymphocyte ratio | |||
| Mean (SD) | 4.2 (3.9) | 4.1 (4.7) | .194 |
| Platelets (×109 per L; normal range, 125.0‐350.0) | |||
| Mean (SD) | 195.3 (75.4) | 216.0 (93.2) | .026 |
| Increased | 12 (3.9) | 9 (6.0) | .387 |
| Decreased | 41 (13.3) | 15 (9.9) | |
| Hemoglobin (g/L; normal range: male [130.0‐175.0], female [115.0‐150.0]) | |||
| Mean (SD) | 137.5 (16.2) | 139.6 (15.1) | .237 |
| Increased | 3 (1.0) | 2 (1.3) | .868 c |
| Decreased | 26 (8.4) | 11 (7.3) | |
| Monocytes (× 109 per L; normal range, 0.1‐0.6) | |||
| Mean (SD) | 0.5 (0.2) | 0.5 (0.3) | .516 |
| Increased | 78 (25.2) | 41 (27.2) | .717 c |
| Decreased | 1 (0.3) | 0 | |
| Monocyte rates (%; normal range, 3.0‐10.0) | |||
| Mean (SD) | 9.1 (3.7) | 9.0 (3.5) | .977 |
| Increased | 104 (33.7) | 53 (35.1) | .746 |
| Decreased | 7 (2.3) | 5 (3.3) | |
| Eosinophils (×109 per L; normal range, 0.02‐0.52) | |||
| Mean (SD) | 0.02 (0.04) | 0.03 (0.06) | .002 |
| Decreased | 229 (74.1) | 90 (59.6) | .002 |
| Reticulocytes (×1012 per L; normal range, 0.03‐0.08) d | |||
| Mean (SD) | 0.03 (0.02) | 0.04 (0.02) | .547 |
| Increased | 5 (2.8) | 8 (9.8) | .042 |
| Decreased | 69 (39.0) | 34 (41.5) | |
| Reticulocyte rates (%; normal range, 0.5‐1.5) § | |||
| Mean (SD) | 0.7 (0.4) | 0.8 (0.5) | .199 |
| Increased | 5 (2.8) | 11 (13.4) | .003 |
| Decreased | 60 (33.9) | 30 (36.6) | |
Note: Data are n (%) and mean (SD) unless specified otherwise.
Abbreviation: SARS‐CoV‐2, severe acute respiratory syndrome coronavirus 2.
P values comparing SARS‐CoV‐2 positive group and negative group for percentages and means were from χ 2 test and Mann‐Whitney test, respectively.
The sample size is 623.
P values comparing SARS‐CoV‐2 positive group and negative group were from Fisher exact test.
The sample size is 259.
Figure 1.
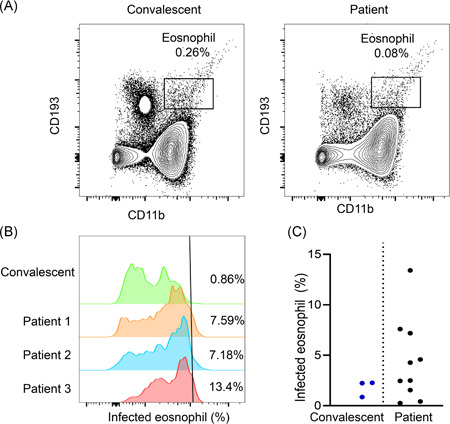
Severe acute respiratory syndrome coronavirus 2 (SARS‐CoV‐2) infection of eosinophil. A, The number of esonophil drops dramatically in patients with coronavirus disease 2019 (COVID‐19). Figures show peripheral blood mononuclear cells esonophil ratios in patients recovered from viral infection or still under critical conditions. B, Virus infection of eosinophil was analyzed with flow‐cytometry. Presence of viral antigen in eosinophil was shown. C, Percentage of infected eosinophil in patients with COVID‐19 who recovered or still under critical conditions
Seven‐hundred‐eighty out of 936 visitors performed chest CT scans at the time of visiting, and 511 were patients with COVID‐19. Remarkably, chest CT scans suggested virus‐infected pneumonia in 492 out of 511 patients with COVID‐19 (96.3%), while only 88.5% (238 out of 269) of nucleic acid negative patients obtained similar suggestion (P < .001). It is noteworthy that the typical CT images derived from patients with COVID‐19 were characterized by the ground glass‐like opacities (Figure 2), which occurred in 67·7% of patients with COVID‐19, while only 58.0% of nucleic acid negative patients displayed the above manifestation. Characteristically, the patients with COVID‐19 were more likely to have both lungs involved (90.2% vs 80.7%; P < .001). Further analysis of the lesion sites revealed that those nucleic acid negative patients were more likely to exhibit lesions in the right upper lobe (17.8% vs 11.7%; P = .019) of right lung (42.8% vs 34.8%, P = .030), and lower lobe of left lung (19.7% vs 13.5%, P = .023) (Table 3).
Figure 2.
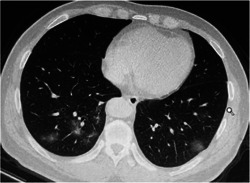
Representative images of the thoracic computed tomography (CT) scans showing multiple ground‐glass opacity and consolidation shadows in the lower lobe of both lungs. Some thickened blood vessels can be seen
Table 3.
The CT scan characteristics of patients in fever clinic of Tongji Hospital according to the SARS‐CoV‐2 infection status
| SARS‐CoV‐2 infection status | |||
|---|---|---|---|
| Patients (N = 780) | Positive (N = 511) (%) | Negative (N = 269) (%) | P value a |
| CT‐findings | |||
| Positive | 492 (96.3) | 238 (88.5) | |
| Negative | 17 (3.3) | 28 (10.4) | <.001 |
| Indetermination | 2 (0.4) | 3 (1.1) | |
| Image characteristics | |||
| Ground‐glass opacity | 346 (67.7) | 156 (58.0) | .007 |
| Patchy shadows | 209 (40.9) | 115 (42.8) | .618 |
| Pleural thickening | 148 (29.0) | 80 (29.7) | .821 |
| Lymphadenia | 145 (28.4) | 67 (24.9) | .301 |
| Fibrous stripes | 135 (26.4) | 78 (29.0) | .442 |
| Nodules | 107 (20.9) | 68 (25.3) | .167 |
| Consolidation | 42 (8.2) | 25 (9.3) | .611 |
| Aortic calcification | 32 (6.3) | 11 (4.1) | .206 |
| Emphysema | 31 (6.1) | 23 (8.6) | .194 |
| Interstitial thickening | 20 (3.9) | 8 (3.0) | .551 b |
| Pleural effusion | 18 (3.5) | 14 (5.2) | .260 |
| Pulmonary bullous | 5 (1.0) | 3 (1.1) | 1.000 b |
| Lesion region | |||
| Bilateral pulmonary | 461 (90.2) | 217 (80.7) | <.001 |
| Right lung | 178 (34.8) | 115 (42.8) | .030 |
| Left lung | 150 (29.4) | 92 (34.2) | .164 |
| Lower lobe of right lung | 70 (13.7) | 44 (16.4) | .318 |
| Middle lobe of right lung | 74 (14.5) | 50 (18.6) | .136 |
| Upper lobe of right lung | 60 (11.7) | 48 (17.8) | .019 |
| Lower lobe of left lung | 69 (13.5) | 53 (19.7) | .023 |
| Upper lobe of left lung | 70 (13.7) | 46 (17.1) | .204 |
| Subpleural | 56 (11.0) | 40 (14.9) | .114 |
Note: Data are n (%) unless specified otherwise.
Abbreviations: CT, computed tomography; SARS‐CoV‐2, severe acute respiratory syndrome coronavirus 2.
P values comparing SARS‐CoV‐2 positive group and negative group were from χ 2 test.
P values comparing SARS‐CoV‐2 positive group and negative group were from Fisher exact test.
As aforementioned (Table 1), fever and cough were the primary symptoms in both COVID‐19 and nucleic acid negative patients. To better discriminate the initial symptoms in those two types of patients to improve diagnostic feasibility, we further analyzed their initial symptoms by classifications. Remarkably, patients manifested muscle ache in the initial symptoms had the highest nucleic acid detection rate (80.0%; 95% confidence interval [CI]: 45.9‐95.0), followed by the initial symptoms coupled with dyspnea (75.0%; 95% CI: 37.7‐93.7), while the detection rate in patients with initial symptoms of fever (68.6%; 95% CI: 65.1‐71.9) or diarrhea (66.7%; 95% CI: 42.8‐84.2) was relatively lower. However, the number of patients with initial symptoms including muscle ache (10/936) or dyspnea (8 out of 936) was relatively small and, therefore, the above conclusion is worthy of further large‐scale clinical observations.
To further provide a risk assessing system that could be considered as a worthy reference for the frontline clinicians, a “Clinical Rapid and Preliminary Sorting Score System” was proposed, which was constructed by combination of symptomatic manifestations, such as fever, chest CT scan with bilateral ground‐glass opacities and eosinophil count. Interestingly, the results indicated that if the patients manifested these four characteristics (fever, bilateral CT imaging, Ground‐glass opacity and eosinophil count below the normal level), the possibility for a COVID‐19 positivity could reach up to 79.8% (95% CI: 71.97‐87.7), and the odds ratio was 2.782 (95% CI: 1.578‐4.905). Similarly, once patients only manifest bilateral lung ground‐glass changes and eosinophil count below the normal level, the possibility for a positive result in nucleic acid assay could also reach 77.0% (95% CI: 71.0‐83.0) (Table 4).
Table 4.
The nucleic acid detection rate of SARS‐CoV‐2 in patients with different clinical characteristics
| Total | SARS‐CoV‐2 positive | proportions (% [95% CI]) | |
|---|---|---|---|
| Initial symptoms | |||
| Fever | 716 | 491 | 68.6 (65.1‐71.9) |
| Cough | 163 | 98 | 60.1 (52.4‐67.4) |
| Fatigue | 66 | 42 | 63.6 (51.4‐74.3) |
| Chest tightness | 25 | 15 | 60.0 (40.2‐77.0) |
| Diarrhea | 18 | 12 | 66.7 (42.8‐84.2) |
| Muscle ache | 10 | 8 | 80.0 (45.9‐95.0) |
| Dyspnea | 8 | 6 | 75.0 (37.7‐93.7) |
| Anorexia | 7 | 3 | 42.9 (14.3‐77.1) |
| Sore throat | 4 | 1 | 25.0 (3.3‐76.3) |
| Aversion to cold | 2 | 1 | 50.0 (5.9‐94.1) |
| Various combinations | |||
| Fever and cough | 47 | 32 | 68.1 (54.8‐81.4) |
| Fever and chest tightness | 11 | 6 | 54.6 (25.1‐84.0) |
| Cough and chest tightness | 6 | 3 | 50.0 (10.0‐90.0) |
| Fever and muscle ache | 4 | 3 | 75.0 (32.6‐117.4) |
| Fever and CT positive | 396 | 264 | 66.7 (61.9‐71.1) |
| Cough and CT positive | 80 | 46 | 57.5 (46.5‐67.8) |
| Fever and CT ground‐glass opacity | 273 | 193 | 70.7 (65.0‐75.8) |
| Cough and CT ground‐glass opacity | 58 | 35 | 60.3 (47.8‐72.9) |
| Fever and CT bilateral pulmonary disease | 363 | 247 | 68.0 (63.1‐72.6) |
| Cough and CT bilateral pulmonary disease | 78 | 45 | 57.7 (46.7‐68.7) |
| CT bilateral pulmonary and ground‐glass opacity | 451 | 318 | 70.5 (66.3‐74.7) |
| Fever, CT bilateral pulmonary and ground‐glass opacity | 246 | 179 | 72.8 (66.9‐78.0) |
| Cough, CT bilateral pulmonary and ground‐glass opacity | 50 | 31 | 62.0 (48.5‐75.5) |
| Eosinophils <0.02 × 10⁹ per L | 319 | 229 | 71.8 (66.8‐76.7) |
| Fever and eosinophils <0.02 × 10⁹ per L | 264 | 197 | 74.6 (69.4‐79.9) |
| Cough and eosinophils <0.02 × 10⁹ per L | 32 | 20 | 62.5 (45.7‐79.3) |
| CT bilateral pulmonary, ground‐glass opacity and eosinophils <0.02 × 10⁹ per L | 187 | 144 | 77.0 (71.0‐83.0) |
| Fever, CT bilateral pulmonary, ground‐glass opacity and eosinophils <0.02 × 10⁹ per L | 99 | 79 | 79.8 (71.9‐87.7) |
| Cough, CT bilateral pulmonary, ground‐glass opacity and eosinophils <0.02 × 10⁹ per L | 16 | 10 | 62.5 (38.8‐86.2) |
Note: Data are n or proportion (95% CI).
Abbreviations: CI, confidence interval; CT, computed tomography; SARS‐CoV‐2, severe acute respiratory syndrome coronavirus 2.
Among 628 diagnosed patients with COVID‐19, 553 cases were mild cases (87.9%), while 75 were severe cases (11.9%). In general, the mild cases (52 ± 15.1 years) were significantly younger than that of severe cases (57 ± 11.5 years) (P = .004). Among 553 mild cases, 262 of them (47.4%) were males, and 291 (52.6%) were females. Similarly, 34 out of 75 severe cases (45.3%) were males, and the rest 41 (54.7%) were females. No preferential distribution in terms of genders was observed in either mild or severe/critical cases was observed. However, it seemed that more severe cases manifested cough in their initial symptoms as compared with that of mild cases (24% vs 14.5%; P = .033) (Table 5).
Table 5.
Epidemiological and clinical characteristics in patients with mild, severe, and critical type of COVID‐19
| SARS‐CoV‐2 infected pneumonia (COVID‐19) | |||
|---|---|---|---|
| Mild (N = 553) (%) | Severe and critical (N = 75 a ) (%) | P value b | |
| Age, mean (SD),y | 52 (15.1) | 57 (11.5) | .004 |
| ≤19 | 6 (1.1) | 0 | .010 c |
| 20‐29 | 36 (6.5) | 1 (1.3) | |
| 30‐39 | 90 (16.3) | 5 (6.7) | |
| 40‐49 | 99 (17.9) | 8 (10.7) | |
| 50‐59 | 132 (23.9) | 29 (38.7) | |
| 60‐69 | 123 (22.2) | 21 (28.0) | |
| ≥70 | 67 (12.1) | 11 (14.7) | |
| Sex | .739 | ||
| Female | 291 (52.6) | 41 (54.7) | |
| Male | 262 (47.4) | 34 (45.3) | |
| Initial symptoms | |||
| Fever | 432 (78.1) | 59 (78.7) | .914 |
| Cough | 80 (14.5) | 18 (24.0) | .033 |
| Fatigue | 38 (6.9) | 4 (5.3) | .617 |
| Chest tightness | 14 (2.5) | 1 (1.3) | .524 c |
| Diarrhea | 9 (1.6) | 3 (4.0) | .159 c |
| Muscle ache | 7 (1.3) | 1 (1.3) | .961 c |
| Dyspnea | 4 (0.7) | 2 (2.7) | .105 c |
| Anorexia | 3 (0.5) | 0 | |
| Rhinobyon | 2 (0.4) | 0 | |
| Aversion to cold | 1 (0.2) | 0 | |
| Sore throat | 1 (0.2) | 0 | |
| Hypersomnia | 1 (0.2) | 0 | |
| Expectoration | 1 (0.2) | 0 | |
| Dizziness | 1 (0.2) | 0 | |
| Nausea | 1 (0.2) | 0 | |
| Vomiting | 1 (0.2) | 0 | |
| Xerostomia | 1 (0.2) | 0 | |
Note: Data are n (%) unless specified otherwise. respectively.
Abbreviations: COVID‐19, coronavirus disease 2019; SARS‐CoV‐2, severe acute respiratory syndrome coronavirus 2.
There are 72 severe patients and three critical patients.
P values comparing SARS‐CoV‐2 positive group and negative group for pecentages and means were from χ 2 test and Mann‐Whitney test.
P values comparing SARS‐CoV‐2 positive group and negative group were from Fisher exact test.
4. DISCUSSION
This is the first retrospective study with large sample size of visitors from a single fever clinic in Wuhan, China. Based on the analysis of the initial clinical symptoms of 936 visitors in the fever clinic of Tongji hospital and the estimation of basic reproductive number (R0) in previous studies, 14 , 15 person‐to‐person transmission, particularly in the crowded public places, is likely the major style contributing to the COVID‐19 outbreak. This transmission style exacerbated the outbreak in Wuhan significantly from late January to early February of 2020. Given that Tongji Hospital is located in the center of this epidemic, the number of visitors in its fever clinic was far beyond of its capacity. In particular, From 30th January to 4th February 2020, 5686 COVID‐19 cases were confirmed in Wuhan, while 628 of which were diagnosed in Tongji Hospital, which accounted for 11.0% of the total diagnosed cases. 16 , 17 Among 936 visitors included in this study, the detection rate for SARS‐CoV‐2 reached up to 67% (628 out of 936). Interestingly, there is no statistical difference in sex distribution between patients with COVID‐19 and nucleic acid negative patients, suggesting that SARS‐CoV‐2 is susceptible to both sex. This finding is different from Chen et al 18 reported, but consistent with the data published by Wang et al. 14 This discrepancy is likely caused by the small sample size included by Chen and his colleagues. However, all studies including our own indicated that aged subjects are more susceptible to SARS‐CoV‐2 infection.
The primary symptoms of patients with COVID‐19 were fever and cough, which were similar to the clinical manifestations of SARS and Middle East respiratory syndrome (MERS). 19 , 20 , 21 In general, patients with COVID are difficult to be discriminated from nucleic acid negative patients based on symptoms, such as fever, cough and others. Therefore, we first assessed the relationship between the first symptom(s) and the positive rate of SARS‐CoV‐2 detection. Remarkably, visitors initially complained with muscle ache displayed up to 80% positively of SARS‐CoV‐2, followed by dyspnea (75%), indicating that initial symptoms manifested by muscle ache or dyspnea could be more critical for a quick assessment for possibility of SARS‐CoV‐2 infection, as fever and cough are also common in those nucleic acid negative visitors. However, only eight patients (1.3%) were found with aching muscle in our study, while a study in the hospitalized patients revealed that around 23.1% patients with COVID‐19 manifested muscle ache. 22 This discrepancy is probably due to the differences of disease severity (ie, early stage in outpatients vs progressed stage in hospitalized patients). Given the fact that the number of patients with aching muscle is limited, further investigations with large‐scale of patients would be necessary.
Intriguingly, we did not found a significant difference in terms of lymphocytes at the time of visiting between patients with COVID‐19 and nucleic acid negative patients, while the number of eosinophils at the time of visiting was significantly lower in patients with COVID‐19 as compared with that of nucleic acid negative patients. The mechanisms underlying decreased eosinophils in patients with COIVD‐19 are currently unknown. However, previous studies suggested that eosinophils function as innate immune cells to efficiently eliminate the invaded respiratory syncytial virus (RSV). 23 It would be, therefore, logical to assume that the reduced number of eosinophils could be caused by the exhaustion owing to the clearance of invaded SARS‐CoV‐2 in COVID‐19 patients. to address this question, we examined peripheral blood samples from a COVID‐19 convalescent and three active patients with COVID‐19. Indeed, COVID‐19 viral antigen was detected in eosinophils originated from active patients, and more importantly, the active patients displayed significantly lower levels of eosinophils than that of convalescent, which was consistent with our previous report. 13
CT‐scans suggested virus‐infected pneumonia in 492 out of 511 SARS‐CoV‐2‐infected visitors (96.3%), which is consistent with the findings from Jinyintan Hospital. 1 Similar as SARS or MERS, the typical images derived from chest CT scan are the ground glass‐like opacities. 24 , 25 , 26 It is worthy of note that a large proportion of nucleic acid negative patients also manifested changes of CT imagines. Unfortunately, serological assays for detection of coronavirus specific antibodies were not available at that time, and therefore, we were unable to test coronavirus specific antibodies immunoglobulin M (IgM) or IgG to exclude those nucleic acid negative patients from COVID‐19. In fact, pneumonia can be caused by atypical pathogens, such as swine flu virus, parainfluenza virus, RSV, adenovirus, mycoplasma, chlamydia, and legionella, which shares very similar radiological features including bilateral multiple lobules with glass‐like opacities as COVID‐19. 27 As a result, the changes of CT imagines in nucleic acid negative patients could be attributed to the atypical pathogen infection, such as influenza A or B. Indeed, studies in our Children fever clinic 28 and our later observations in inpatients (unpublished data) confirmed this assumption, and many of them were influenza A infected patients. More recently, the Chinese Guideline of Diagnosis and Treatment of COVID‐19 (seventh Edition) was released, 29 which requires additional “serological test for coronavirus specific antibody of IgM and IgG” to exclude those nucleic acid negative patients from COVID‐19. Among 308 patients in nucleic acid negative non‐diagnostic group, if those patient can be tested for antibodies at the clinic, some may be diagnosed COVID‐19.
In general, antibodies specific for COVID‐19 virus could not be detected until day 10 following infection, and track records for all of our outpatients revealed that none of them had more than day 6 of the initial symptoms before visiting the fever clinic (1‐6 days). Therefore, it seems that nucleic acid assay is the only way to reach a confirmative diagnosis of COVID‐19 during the early stage of infection. Unfortunately, false negative result could be produced in certain patients, which would delay the diagnosis and give timely treatment for saving their lives. To make a preliminary assessment whether a patient was COVID‐19 in case that nucleic acid assays are not available or negative because of inappropriate sample collection, we proposed a system by combining the initial symptoms, laboratory tests, and chest CT scans. Remarkably, fever combined with muscle ache can reach a 75.0% possibility for a positive result in nucleic acid assays, while the possibility of nucleic acid positive could reach up to 79.8% once fever combines with bilateral lung ground glass‐like changes in CT scans and eosinophil count below normal level. In particular, by combining bilateral lung ground glass‐like changes in CT‐scans with eosinophils below normal level only can also reach 77.0% possibility to be positive for nucleic acid assay. Together, this system could be useful for helping those nucleic acid negative patients and regions lack of nucleic acid detection kits from misdiagnosis before antibody testing.
One major limitation for our study is that we could not track their records after visiting our fever clinic. Once a confirmative diagnosis reached, only those severe and critical patients with COVID‐19 were arranged for hospitalized treatment by the Outbreak Control Center under city government based on the available bed units in the designated hospitals in Wuhan, and the purpose of this policy was designed to increase the efficiency for the use of limited bed units at that time. For those patients with mild symptoms or nucleic acid negative patients were advised for home quarantine for 14 days. Therefore, we cannot track those patients for their location of admission and for obtaining additional medical histories. However, the situation was changed later upon the arrival of medical staff from outsides and the establishment of cabin hospitals and two additional infectious hospitals.
In summary, this retrospective study included 936 visitors from the fever clinic of Tongji Hospital from 30th January to 4th February 2020, which was the peak time of this outbreak. The detection rate for COVID‐19 was as high as 67.1%. By analysis with different groups, we demonstrated that muscle ache and fever could be two independent markers for early assessing the possibility of COVID‐19, while eosinophil counts below normal levels could a viable marker to assess the possibility of a patient being diagnosed as COVID‐19 by combining other initial symptoms, laboratory tests and chest CT scan. Those data may provide critical information for the regions, such as Europe and United States that are facing the same situation as Wuhan experienced, and could be valuable to prevent those nucleic acid negative patients from misdiagnosis before antibody testing.
AUTHOR CONTRIBUTIONS
HZ, LL, GL, and WL collected the epidemiological and clinical data. WL and XL contributed to the statistical analysis. YW and LL drafted the origin manuscript. C‐Y W, PZ, XY, LX, and YL revised the final manuscript. All authors contributed to data acquisition, data analysis, or data interpretation, and reviewed and approved the final version.
CONFLICT OF INTERESTS
The authors declare that there are no conflict of interests.
ACKNOWLEDGMENTS
This study was supported by the National Natural Science Foundation of China [Grants 81874149, 81974456, and 81530024]; the Clinical Research Physician Program of Tongji Medical College, Huazhong University of Science and Technology [Grant 5001540075]; SARS‐CoV‐2 Pneumonia Emergency Technology Public Relations Project [2020FCA009].
Wei Y, Lu Y, Xia L, et al. Analysis of 2019 novel coronavirus infection and clinical characteristics of outpatients: An epidemiological study from a fever clinic in Wuhan, China. J Med Virol. 2020;92:2758–2767. 10.1002/jmv.26175
Contributor Information
Gang Li, Email: ligang@tjh.tjmu.edu.cn.
Xinying Li, Email: m201975321@hust.edu.cn.
Li Liu, Email: liul2012@hust.edu.cn.
Wenhua Liu, Email: liuwh_2013@126.com.
Peng Zhou, Email: peng.zhou@wh.iov.cn.
Cong‐Yi Wang, Email: wangcy@tjh.tjmu.edu.cn.
Huilan Zhang, Email: huilanz_76@163.com.
REFERENCES
- 1. Huang C, Wang Y, Li X, et al. Clinical features of patients infected with 2019 novel coronavirus in Wuhan, China. Lancet. 2020;395:497‐506. 10.1016/S0140-6736(20)30183-5 [DOI] [PMC free article] [PubMed] [Google Scholar]
- 2. Hui DS, I Azhar E, Madani TA, et al. The continuing 2019nCoV epidemic threat of novel coronaviruses to global health the latest 2019 novel coronavirus outbreak in Wuhan, China. Int J Infect Dis. 2020;91:264‐266. [DOI] [PMC free article] [PubMed] [Google Scholar]
- 3. Lu H, Stratton CW, Tang YW. Outbreak of pneumonia of unknown etiology in Wuhan China: the mystery and the miracle. J Med Virol. 2020;92:401‐402. 10.1002/jmv.25678 [DOI] [PMC free article] [PubMed] [Google Scholar]
- 4. Riou J, Althaus CL. Pattern of early human‐to‐human transmission of Wuhan 2019 novel coronavirus (SARS‐CoV‐2), December 2019 to January 2020. Euro Surveill. 2020;25(4). 10.2807/1560-7917.ES.2020.25.4.2000058 [DOI] [PMC free article] [PubMed] [Google Scholar]
- 5. Chan JF, Yuan S, Kok 5. KH, et al. A familial cluster of pneumonia associated with the 2019 novel coronavirus indicating person‐to‐person transmission: a study of a family cluster [published online ahead of print, 2020 Jan 24]. Lancet. 2020;S0140‐6736(20):30154‐30159. 10.1016/S0140-6736(20)30154-92807/1560-7917.ES.2020.25.4.2000058 [DOI] [PMC free article] [PubMed] [Google Scholar]
- 6. Johns Hopkins University . The latest situation of new coronavirus pneumonia as of 24:00 on February. http://www.nhc.gov.cn/xcs/yqfkdt/202002/741ce06130284a77bfbf699483c0fb60.shtml. Date last updated: 25 Feburary 2020.
- 7. World Health Organization . Statement on the second meeting of the International Health Regulations (2005) Emergency Committee regarding the outbreak of novel coronavirus (SARS‐CoV‐2). https://www.who.int/news-room/detail/30-01-2020-statement-on-the-second-meeting-of-the-international-health-regulations-(2005)-emergency-committee-regarding-the-outbreak-of-novel-coronavirus-(SARS-CoV-2). Date last updated: 25 Feburary 2020.
- 8. Zhu N, Zhang D, Wang W, et al. A novel coronavirus from patients with pneumonia in China, 2019. N Engl J Med. 2020;382:727‐733. 10.1056/NEJMoa2001017 [DOI] [PMC free article] [PubMed] [Google Scholar]
- 9. Ksiazek TG, Erdman D, Goldsmith CS, et al. A novel coronavirus associated with severe acute respiratory syndrome. N Engl J Med. 2003;348:1953‐1966. [DOI] [PubMed] [Google Scholar]
- 10. Chen J. Pathogenicity and transmissibility of SARS‐CoV‐2‐A quick overview and comparison with other emerging viruses. Microbes Infect. 2020;S1286‐4579(20):30026‐5. 10.1016/j.micinf.2020.01.004 [DOI] [PMC free article] [PubMed] [Google Scholar]
- 11. Leung GM, Hedley AJ, Ho LM, et al. The epidemiology of severe acute respiratory syndrome in the 2003 Hong Kong epidemic: an analysis of all 1755 patients. Ann Intern Med. 2004 Nov 2;141(9):662‐673. [DOI] [PubMed] [Google Scholar]
- 12. National Health Commission . Notice on issuing a new coronavirus infected pneumonia diagnosis and treatment plan (Trial Version 5) http://www.gov.cn/zhengce/zhengceku/2020-02/05/content_5474791.htm. Accessed on 24 March.
- 13. Zhang H, Zhou P, Wei Y, et al. Histopathologic changes and SARS–CoV‐2 immunostaining in the lung of a patient with COVID‐19. Ann Intern Med. 2020;172:629‐632. 10.7326/M20-0533 [DOI] [PMC free article] [PubMed] [Google Scholar]
- 14. Wang D, Hu B, Hu C, et al. Clinical characteristics of 138 hospitalized patients with 2019 novel coronavirus‐infected pneumonia in Wuhan. China.JAMA. 2020. 10.1001/jama.2020.1585 [DOI] [PMC free article] [PubMed] [Google Scholar]
- 15. Li Q, Guan X, Wu P, et al. early transmission dynamics in Wuhan, China, of novel coronavirus‐infected pneumonia. N Engl J Med. 2020. 10.1056/NEJMoa2001316 [DOI] [PMC free article] [PubMed] [Google Scholar]
- 16. 30 January 2020 pneumonia epidemic situation of C SARS‐CoV‐2 infection in Hubei province, China‐Hubei Provincial Health Committee. http://wjw.hubei.gov.cn/bmdt/ztzl/fkxxgzbdgrfyyq/xxfb/202001/t20200131_2016682.shtml
- 17. 4 February 2020 pneumonia epidemic situation of SARS‐CoV‐2 infection in Hubei province, China‐Hubei Provincial Health Committee. http://wjw.hubei.gov.cn/fbjd/dtyw/202002/t20200205_2019293.shtml
- 18. Chen N, Zhou M, Dong X, et al. Epidemiological and clinical characteristics of 99 cases of 2019 novel coronaviruspneumonia in Wuhan, China: a descriptive study. Lancet. 2020;395:507‐513. 10.1016/S0140-6736(20)30211-7 [DOI] [PMC free article] [PubMed] [Google Scholar]
- 19. Booth CM, Matukas LM, Tomlinson GA, et al. Clinical features and short‐term outcomes of 144 patients with SARS in the greater Toronto area. JAMA. 2003;289(21):2801‐2809. 10.1001/jama.289.21.JOC30885 [DOI] [PubMed] [Google Scholar]
- 20. Yin Y, Wunderink RG. MERS, SARS and other coronaviruses as causes of pneumonia. Respirology. 2018;23(2):130‐137. 10.1111/resp.13196 [DOI] [PMC free article] [PubMed] [Google Scholar]
- 21. Zumla A, Hui DS, Perlman S. Middle East respiratory syndrome. Lancet. 2015;386(9997):995‐1007. 10.1016/S0140-6736(15)60454-8 [DOI] [PMC free article] [PubMed] [Google Scholar]
- 22. Chang D, Lin M, Wei L, et al. Epidemiologic and clinical characteristics of novel coronavirus infections involving 13 patients outside Wuhan, China. JAMA. 2020;323:1092. [DOI] [PMC free article] [PubMed] [Google Scholar]
- 23. Phipps S, Lam CE, Mahalingam S, et al. Eosinophils contribute to innate antiviral immunity and promote clearance of respiratory syncytial virus. Blood. 2007;110(5):1578‐1586. 10.1182/blood-2007-01-071340 [DOI] [PubMed] [Google Scholar]
- 24. Chung M, Bernheim A, Mei X, et al. CT imaging features of 2019 novel coronavirus (SARS‐CoV‐2). Radiology. 2020:200230. [DOI] [PMC free article] [PubMed] [Google Scholar]
- 25. Ketai L, Paul NS, Wong KT. Radiology of severe acute respiratory syndrome (SARS): the emerging pathologic‐radiologic correlates of an emerging disease. J Thorac Imaging. 2006;21(4):276‐283. [DOI] [PubMed] [Google Scholar]
- 26. Chu WCW, Li AM, Ng AWH, et al. Thin‐section CT 12 months after the diagnosis of severe acute respiratory syndrome in pediatric patients. AJR Am J Roentgenol. 2006;186(6):1707‐1714. [DOI] [PubMed] [Google Scholar]
- 27. Ai J, Zhang H, Xu T, et al. Optimizing diagnostic strategy for novel coronavirus pneumonia, a multi‐center study in Eastern China. medRxiv preprint. 10.1101/2020.02.13.20022673 [DOI] [Google Scholar]
- 28. Liu W, Zhang Q, Chen J, et al. Detection of Covid‐19 in children in early January 2020 in Wuhan, China. N Engl J Med. 2020;382:1370‐1371. 10.1056/NEJMc2003717 [DOI] [PMC free article] [PubMed] [Google Scholar]
- 29. National Health Commission. Notice on issuing a nw coronary virus pneumonia diagnosis and treatment plan (Trial Version 7) http://www.nhc.gov.cn/yzygj/s7653p/202003/46c9294a7dfe4cef80dc7f5912eb1989.shtml?spm=C73544894212.P59511941341.0.0. Accessed on 14 May.