

Abstract
Since the outbreak in China in late 2019, the novel coronavirus (COVID‐19) has spread around the world and has come to dominate online conversations. By linking 2.3 million Twitter users to locations within the United States, we study in aggregate how political characteristics of the locations affect the evolution of online discussions about COVID‐19. We show that COVID‐19 chatter in the United States is largely shaped by political polarization. Partisanship correlates with sentiment toward government measures and the tendency to share health and prevention messaging. Cross‐ideological interactions are modulated by user segregation and polarized network structure. We also observe a correlation between user engagement with topics related to public health and the varying impact of the disease outbreak in different U.S. states. These findings may help inform policies both online and offline. Decision‐makers may calibrate their use of online platforms to measure the effectiveness of public health campaigns, and to monitor the reception of national and state‐level policies, by tracking in real‐time discussions in a highly polarized social media ecosystem.
Keywords: communication dynamics, content analysis, coronavirus, COVID‐19, geospatial analysis, network analysis, partisanship, polarization, social media platforms, user behavior modeling
1. INTRODUCTION
Coronavirus (COVID‐19) has swept quickly across the globe, resulting in over 350,000 deaths as of the time of this writing. The highly infectious disease has pushed governments worldwide to impose restrictions to slow the spread, including halting businesses and requiring people to shelter at home. The resulting reduction in economic activity has led to the highest unemployment rates in the United States since the Great Depression and the largest stock market volatility since the 2008 recession.
The topic of coronavirus has since taken over online discussion platforms. One such example is Twitter, where coronavirus‐related topics have been consistently trending since January 2020. Every day, a flood of information including government announcements, breaking news, and personal COVID‐19 stories spread on Twitter. As of May 2020, there are also many pre‐print papers providing preliminary analyses of online discussions surrounding COVID‐19 (Alshaabi et al., 2020; Barrios & Hochberg, 2020; Cinelli et al., 2020; Ferrara, 2020; Gallotti, Valle, Castaldo, Sacco, & De Domenico, 2020; Gao et al., 2020; Kleinberg, van der Vegt, & Mozes, 2020; Pennycook, McPhetres, & Zhang, 2020; Schild et al., 2020; Singh et al., 2020; Uscinski et al., 2020).
In this work, we examine geographic differences in online COVID‐19 discourse. In the United States, regulatory responses to COVID‐19 vary by state; by April 2020, all states had imposed some form of social distancing or quarantine regulations (Gershman, 2020). However, each state has taken policy adoptions at their own pace, with varying degrees of severity when it comes to enforcing such policies (National Governors Association, 2020), and equally significant differences in easing restrictions. The timing of the pandemic, coinciding with a presidential election year in the United States, has amplified partisan differences in public opinion response.
Our goal in this study is to quantify partisan and geographic differences in online conversations about COVID‐19 in the United States. Our research sheds light on the varying degrees of the efficacy of policy interventions, which can, therefore, help policymakers design targeted public health campaigns. To accomplish this, we approach the problem from three perspectives. First, we analyze the geospatial aspects of COVID‐19 through comparisons of Twitter activity and hashtag usage across the United States. Second, we investigate the temporal evolution of topics through hashtag clusters. Finally, we explore the characteristics of cross‐ideological interactions among users with different political preferences.
1.1. Outline of contributions
Our main contributions are as follows:
We leverage a large Twitter dataset reflecting the COVID‐19 chatter of 2.3 million users based in the United States and develop metrics to quantify content geo‐specific popularity (using hashtags as topic markers).
We show that Democratic‐ and Republican‐leaning states differ considerably in topics of popular conversations pertaining to COVID‐19. Conversation topics on both sides are largely political in nature, but opinions are polarized along partisan lines.
We also provide evidence that popular topics relating to COVID‐19 continuously change as a reflection of the unfolding real‐world events: for example, we illustrate a sharp rise in discussions about health and prevention in March across all states, as the pandemic worsened in the United States.
Finally, we portray cross‐ideological interactions and characterize the role user segregation plays in the context of polarization and information spread.
2. DATA
2.1. COVID‐19 twitter data
We rely on our publicly available COVID‐19 Twitter dataset collected between January 21, 2020, and April 3, 2020 (Chen, Lerman, & Ferrara, 2020). This dataset comprises of tweets that contain tracked keywords or were posted by tracked accounts. Approximately 20 keywords were handpicked and continuously tracked to provide a global and real‐time overview of the chatter related to COVID‐19. Since the Twitter API matches keywords contained as sub‐strings and is not case‐sensitive, terms such as “CoronavirusOutbreak” will be matched by simply tracking the keyword “corona.” We list examples of tracked keywords in Table 1. The official accounts we track include WHO, CDCgov, and HHSGov.
TABLE 1.
Examples of tracked keywords (case insensitive) we used to collect our data and when we begin tracking them
| Keywords | Since | Keywords | Since |
|---|---|---|---|
| Corona | 1/21/20 | Corona virus | 1/21/20 |
| Wuhan | 1/21/20 | COVID‐19 | 2/16/20 |
| Epidemic | 1/2/20 | SARS‐CoV‐2 | 3/6/20 |
| Outbreak | 1/21/20 | Pandemic | 3/12/20 |
| Ncov | 1/21/20 | COVD | 3/12/20 |
This dataset records over 87 million tweets from 13 million unique users. Each tweet is categorized as an original tweet, a retweet (with or without a comment), or a reply. On a tweet‐level, we have information regarding the date and the language of the tweet. On a user‐level, we have snapshots of user metadata including their screen name, account creation date, follower and following count, and the self‐reported profile location at the time of the tweet collection. A small percentage of tweets also come with a place object containing geo‐location data (lat/long of the device used to post).
2.2. Geocoded U.S. dataset
For the purpose of geospatial analysis, we aim to associate tweets with the U.S. state from which they originate. While DC is technically not a state, we will refer to it as a state for convenience. Less than 1% of all tweets in our dataset are officially geotagged by Twitter with the Place object. The majority of geocoding comes from self‐reported user profile locations, which are available for 65% of the users in our dataset. We implemented a fast fuzzy text matching algorithm to detect locations in the United States by searching for state names or their abbreviation codes. We also searched for the names of the top 25 most populous cities by the latest (2018) population estimates reported by the U.S. Census Bureau (2020); finally, we matched some of the most popular nicknames (e.g., NYC for New York City, Philly for Philadelphia, etc.). With this dictionary, we performed iterative string matching. We only labeled ambiguous tokens such as “Washington” (for “Washington state” or “Washington, DC”), if there is corroborating evidence in the text. For example, “Washington” alone was considered inconclusive, but would be classified as “Washington state” if it appears alongside “Seattle.”
Out of the 34 M tweets with location information, 42% originate from the United States and 85% of these tweets are associated with some state. In Table 2, we summarize descriptive statistics of this portion of data, which we call the U.S. dataset. Most of the activity is concentrated in 20 states (Table 3), which account for 83% of all traffic volume. Similar to prior geo‐based studies on Twitter activity in the United States (Cheng, Caverlee, & Lee, 2010; Conover et al., 2013), the majority of tweets in our dataset originate from California, Texas, New York, and Florida.
TABLE 2.
Statistics of the full dataset and the U.S. dataset
| Time period | 1/21–4/3 |
|---|---|
| Full dataset | |
| No. of total tweets | 87 million |
| No. of (original) tweets | 10 million |
| No. of reply tweets | 4.8 million |
| No. of retweets | 17 million |
| No. of users | 18 million |
| No. of tweets with place | 635,000 |
| No. of tweets with location | 56 million |
| U.S. dataset | |
| No. of tweets in the United States | 14.5 million |
| No. of users in the United States | 2.3 million |
| No. of tweets in a U.S. state | 12.4 million |
| No. of users in a U.S. state | 1.8 million |
TABLE 3.
Dataset statistics of the top 10 most active states
| State | Partisanship | N | % |
|---|---|---|---|
| CA | Democratic | 2,007,490 | 16 |
| TX | Republican | 1,268,246 | 10 |
| NY | Democratic | 1,184,178 | 10 |
| FL | Republican | 880,832 | 7 |
| IL | Democratic | 447,082 | 4 |
| PA | Split | 386,996 | 3 |
| OH | Republican | 344,356 | 3 |
| GA | Republican | 343,094 | 3 |
| DC | Democratic | 328,965 | 3 |
| NC | Split | 325,048 | 3 |
Note: N is the number of tweets geo‐tagged with the state, and % is the fraction of all tweets geo‐tagged United States.
For validation, an external human annotator manually verified a stratified random sample of locations tagged as a U.S. state. We report a predictive positive value (TP/(TP + FP)) of 96.3%, or 98.2% for the top 20 most active states. As such, we are confident of the accuracy of locations with inferred geotags.
2.3. State partisanship
As a proxy for a state's partisanship level, we use the party that controls the state‐level legislature as of January 20, 2020 (National Conference of State Legislatures). States for which the same party holds the legislative chambers and governorship are controlled by the corresponding party, and states with different parties holding the legislative chambers and governorship are considered split states. The state partisanship for the top 10 states by tweet volume is indicated in Table 3.
2.4. Inauthentic accounts
Research on inauthentic accounts (bots, trolls, etc.) suggests that they can play a role in the diffusion of propaganda or incendiary sentiments (Broniatowski et al., 2018; Stella, Ferrara, & De Domenico, 2018; Subrahmanian et al., 2016). Recent work on COVID‐19 suggests that bot‐like accounts share significantly more political conspiracies than other users (Ferrara, 2020). Following the recommendation of (Ferrara, 2020), we exclude accounts in the top 10% of the bot scores distribution obtained using Botometer, a bot detection API (Davis, Varol, Ferrara, Flammini, & Menczer, 2016), resulting in approximately 15,000 accounts and 240,000 associated tweets filtered out of the U.S. dataset.
3. HASHTAG DETECTION
3.1. Geo‐trending hashtags
We aim to identify important hashtags, investigate where they are important, and how long they are consistently trending. From a scan of all hashtags (case insensitive) present in the dataset, we obtain a list of approximately one million unique hashtags, of which 638 are used more than 10,000 times. Out of these hashtags, we identify those that are over‐represented in the United States. To accomplish this, we define the geo‐based popularity of a hashtag as the Importance Ratio (IR) of hashtags h and location l as follows:
| (1) |
where P(h| l) is the probability of observing hashtag h used in tweets geotagged in location l , and P(h) is the probability of observing hashtag h used in the full dataset. An IR ratio greater than 1 indicates that the hashtag h trends proportionally more regionally in location l than worldwide. For the following analyses, we limit our discussion to hashtags over‐represented (IR >1) either nationally across the United States or regionally in a U.S. state. This effectively filters out most of the generic coronavirus related hashtags (e.g., #coronavirus, #COVID19). In total, we found 125 hashtags with an IR >1 in the United States, which we refer to as ℋUS . We use ℋstates to denote all hashtags in ℋUS as well as an additional 305 hashtags with an IR >1 regionally in a U.S. state.
3.2. Hashtag clustering
To understand the content of online discussions, we conduct clustering analysis on the 125 hashtags (ℋUS) trending in the United States. We de‐duplicate synonymous hashtags, including misspellings of the same word (e.g., #coronarvirus) or words with semantically identical meanings to reduce the noise. Additionally, we remove hashtags with ambiguous or overly broad meanings, such as #america or #breaking. We report the hashtags we de‐duplicated and removed in the Supporting Information (SI). After filtering, we obtain 95 hashtags for clustering analysis. Our cluster detection method follows a two‐step hierarchical paradigm described below.
3.2.1. Temporal clusters
We first set out to detect hashtag clusters from the time series of cluster usage by adopting the recently‐proposed multidimensional time‐series clustering framework named dipm‐SC (Ozer, Sapienza, Abeliuk, Muric, & Ferrara, 2020), which is specifically designed to cluster social media time series. The shift window is set to 3 days for two reasons. The first is to average out inconsistencies due to data collection, for example, spurious missing data. Second, a manual scan of the daily hashtags with the greatest IR values in the United States suggests that some popular topics last at most a few days. To find the most optimal k , the number of clusters, following the dipm‐SC framework (Ozer et al., 2020), we explore the temporal shapes of clustering results. We find that k = 4 produces the most non‐overlapping temporal trajectory peaks.
3.2.2. Semantic subclusters
After partitioning the hashtags into temporal clusters, we employ the Louvain community detection algorithm on each cluster (Blondel, Guillaume, Lambiotte, & Lefebvre, 2008). To achieve this, we build a user‐based weighted hashtag usage network G h = (V h , E h ). V h represents the set of hashtags and (h 1, h 2) ∈ E h indicates the use of both hashtags h 1 and h 2 by some user. The weight of an edge w(h 1, h 2) corresponds to the number of unique users that have used both hashtags. By applying the community detection algorithm on each temporal cluster, we obtain semantically similar sub‐clusters.
4. RESULTS
In Section 4.1, we begin by considering the overall Twitter trend to contextualize our understanding of Twitter usage in relation to COVID‐19. We then proceed to analyze state‐aggregated content consumption and distribution. In Section 4.2, we conduct an aggregated analysis of hashtag adoption in the United States using state partisanship as a proxy. In Section 4.3, we proceed to compare the characteristics of intra‐state communication with inter‐state communication. We then investigate individual users and their hashtag adoption by exploring hashtag clusters. In Section 4.4, we unravel the various topics of discussion detected by clustering algorithms. Finally, in Section 4.5, we study the cross‐ideological interactions.
4.1. United States on twitter
In this section, we provide some background information about COVID‐19 to contextualize our understanding of the Twitter activity. Figure 1 depicts the number of original tweets and retweets that are geotagged as the United States each day. The contour of the retweet activity resembles an exaggerated version of the original tweet curve, which is expected of most Twitter activities. To facilitate comparison between the Twitter activity and COVID‐19 case counts, we also plot the cumulative case counts (confirmed cases and deaths) in the United States compiled by the New York Times (2020). The timeline of important events revolving around COVID‐19 that occurred in the United States during the observation period is also displayed (Taylor, 2020; Wallach & Myers, 2020). This list is not intended to be exhaustive but rather paints a holistic and factually accurate picture of some coronavirus events as they unfolded in the United States.
FIGURE 1.
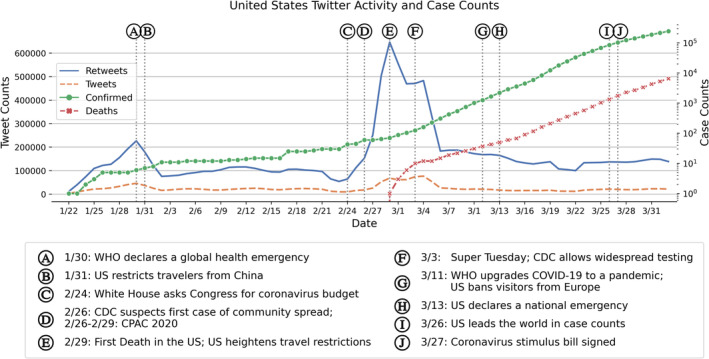
The time series of tweet and retweet volume in the United States averaged over a sliding window of 3 days (left y‐axis), and the log‐scaled daily confirmed and death cases in the United States (right y‐axis). Key events are bubbled and described on the bottom
The U.S. Twitter activity experienced two peaks in traffic volume. Interestingly, one can observe spikes in Twitter activity aligned with changes in infection and death rates; most prominently, the biggest activity spike occurs on February 29, 2020, when the first death due to COVID‐19 was reported in the United States. Following the second peak, user engagement falls to a stable stream of around 100–200 thousand tweets per day in our dataset. The spread of the virus, however, during that same period grew exponentially. This trend is observed not only at the national level but also at a state‐level for every state. We now discuss major events that coincided with the Twitter traffic peaks.
4.1.1. First peak: January 30
In agreement with prior studies on the internet discourse of COVID‐19 (Alshaabi et al., 2020; Cinelli et al., 2020), we observe that the Twitter activity volume peaked in late January. This peak occurred when the World Health Organization (WHO) first declared a global health emergency at the end of January 2020. Although the global focus was still on the worsening development of COVID‐19 cases in China, many other countries were seeing their first cases of the disease. At this point, all cases could be traced back to recent travel history to China and the Centers for Disease Control and Prevention (CDC) maintained that the risk of a coronavirus outbreak in the United States was low.
4.1.2. Second peak: February 27 to March 5
Twitter activity sharply rose at the end of February, which was when the coronavirus situation was rapidly worsening in the United States. We consider this a major turning point for the coronavirus situation in the United States. In only a few days, the White House asked Congress for supplemental funding to combat the outbreak, the CDC (2020) began to suspect the first case of community spread, the first COVID‐19 death in the United States was recorded in Seattle, Washington, and the White House imposed further travel restrictions and advisories on foreign countries. Many major political events also took place during this timeframe. The 2020 Conservative Political Action Conference (CPAC) was held from February 26 to 29, and Super Tuesday for the Democratic presidential election primaries took place on March 3. In Section 4.2, we will show that hashtags related to CPAC 2020 and Super Tuesday were trending disproportionately in our dataset. These events further drove discussions of politics and COVID‐19 up on Twitter.
4.2. Partisan divide
Next, we gauge the party preference of the majority of residents from each state using the state partisanship.
Table 4 lists the aggregated trending hashtags in the United States, ℋUS , ranked by IR, in Democratic‐leaning states, split states, Republican‐leaning states, and collectively across the United States. We highlight hashtags that are tied to a political leader or topic, which we further subdivide into hashtags supportive of the Trump 2020 re‐election campaign, left‐leaning, and other politically relevant hashtags. Most of the top hashtags are color‐coded, which indicates that they are political in nature. In fact, some of the left‐leaning hashtags (blue) are politically inflammatory by directly attacking elected officials. Two other hashtags not highlighted are also politically relevant: #medicareforall champions a U.S. health care system reform, and #familiesfirst references the Families First Coronavirus Response Act. With the exception of #Seattle, which was the location of the initial outbreak and the first death in the United States, no other hashtags were explicitly about outbreak locations. In the face of a pandemic, this suggests that people engaging in online conversations discuss governmental response and policy changes more so than the latest news or COVID‐19 facts.
TABLE 4.
Hashtags with the highest geo‐trending Importance Ratios (IR) in Democratic‐leaning, split control, Republican‐leaning and all states in the United States
| Democratic‐leaning states | Hashtag N IR | Republican‐leaning states | United States (all) | ||||||||
|---|---|---|---|---|---|---|---|---|---|---|---|
| Hashtag | N | IR | Hashtag | N | IR | Hashtag | N | IR | Hashtag | N | IR |
| Seattle | 352.2 | 4.90 | smartnews | 285.2 | 3.98 | florida | 510.3 | 3.97 | pencedemic | 8,957 | 3.44 |
| pencedemic | 421.7 | 3.21 | familiesfirst | 126.4 | 3.01 | fisa | 255.8 | 3.72 | cpac2020 | 6,575 | 3.27 |
| medicareforall | 324.8 | 3.19 | trumpcrash | 157.4 | 2.98 | trump2020 | 727.7 | 3.57 | smartnews | 9,792 | 3.05 |
| familiesfirst | 232.4 | 3.00 | trumpliesaboutcoronavirus | 221.2 | 2.96 | democrats | 643.7 | 3.35 | trump2020 | 15,971 | 2.93 |
| trumpvirus | 1,154.3 | 2.83 | trumpviruscoverup | 137.8 | 2.94 | kag2020 | 482.3 | 3.29 | kag | 17,189 | 2.88 |
| trumpviruscoverup | 244.0 | 2.81 | medtwitter | 118.6 | 2.92 | Oann | 490.0 | 3.24 | usmca | 5,524 | 2.81 |
| demdebate | 415.9 | 2.79 | trumppandemic | 134.6 | 2.86 | stateoftheunion | 229.3 | 3.23 | democrats | 15,122 | 2.81 |
| onevoicel | 337.2 | 2.76 | onevoicel | 219.6 | 2.85 | usmca | 237.3 | 3.20 | trumpvirus | 27,492 | 2.79 |
| covid19us | 502.2 | 2.64 | demdebate | 241.4 | 2.82 | kag | 744.2 | 3.20 | trumpviruscoverup | 6,220 | 2.79 |
| trumppandemic | 240.2 | 2.63 | publichealth | 246.2 | 2.76 | michaelbloomberg | 777.3 | 3.14 | kag2020 | 10,732 | 2.78 |
Note: We color code hashtags that belong to the same category. Red: Trump's 2020 re‐election campaign slogans; Blue: politically‐charged left‐leaning hashtags; Yellow: other politically relevant hashtags. N is the average hashtag usage in the given states.
Comparing the top hashtags across party lines, we observe that the top hashtags in Democratic‐leaning states are overwhelmingly critical of the federal administration, whereas the Republican‐leaning states generate presidential support and use slogans of the Trump 2020 re‐election campaign. The topics in split control states and holistically in the United States are more equally split. The characteristics of trending hashtag topics suggest that state partisanship translates well into predicting the polarizing attitudes toward the response to the COVID‐19 crisis by the current administration.
This finding indicates a certain disparity in political attitudes between red and blue states. While this is not necessarily applicable for every user from those states, it serves as evidence partisanship plays a non‐negligible role in the polarity of COVID‐19 conversations. On the one hand, our results are consistent with a recent survey conducted by Green and Tyson (2020), which showed that there is a wide partisan gap in views on the current administration's response to the outbreak. On the other hand, another explanation for the disparity may be attributed to geographical realities. Contagious epidemics are more likely to spread to transportation hubs or metropolitan areas, which, in the United States, are predominately left‐leaning. Indeed, barring any erroneous case counts due to test kit insufficiencies, Republican‐leaning states between the coasts had considerably fewer confirmed cases in the early stages of COVID‐19 spread than Democratic‐leaning states along the coasts. As a result, the predominantly Democratic states, such as California and New York, were some of the first to take immediate action to curb the disease's spread. People living in Democratic states were impacted early on in terms of not only COVID‐19 case counts but also an overwhelmed healthcare system, reduced economic activity, and disruption to daily life, which subsequently explains their initial adverse reaction to the crisis. Combining the digital traces of public discourse with the progression of real‐world events, we theorize that both the views induced by partisanship and the devastating impacts of reality contributed to polarized and inflammatory reactions of Democratic‐leaning states.
4.3. Intra‐state activity
For a highly contagious disease such as COVID‐19, local measures of social distancing and quarantine are effective methods to curb spreading. Under these circumstances, localized communication and information sharing is particularly important. Retweeting, as the main form of rebroadcasting on Twitter, increases the visibility and spread of content (Boyd, Golder, & Lotan, 2010), which can be crucial to the timely delivery of local news during a pandemic. To examine the dynamics of local communication, we focus on retweets that occur within the same state (intra‐state) and retweets that cross state boundaries (inter‐state).
4.3.1. Intra‐state retweet volume
For each day t in our dataset we construct a weighted directed retweet network. Owing to the vast number of users, the network is very sparse with many low weight edges. Thus, to reduce the complexity of the network, we apply a multi‐scale backbone extraction algorithm (Serrano, Boguna, & Vespignani, 2009) to analytically identify statistically significant edges with a significant value of α = .05. This algorithm does not penalize low weight edges, thereby preserving the heterogeneity of the weight distribution. The retweet network backbone is then converted to a state retweet network by coalescing users in the same state into one node. A directed edge (s i , s j ) in with weight w(s i , s j ) represents how often users in state s i retweet from users in state s j . In the context of retweet activity, is the strength of retweets within a state, is the strength of retweets consumed by a state, and is the strength of retweets produced by a state.
Figure 2 depicts the ratio of intra‐state retweet strength w intra over the retweet consumption strength w out for each state. Using February 29—the day the United States reported its first COVID‐19 death—as a point of division, we observe a clear distinction between the intra‐state retweet engagement in the first half of our study period (μ 1 = .25) and the second half (μ 2 = .39). Using a paired t‐test on the mean intra‐state retweet ratios for each state, we conclude that retweet levels after February 29 are significantly greater than the retweet ratios before ( p < 10−3 ). The increase in intra‐state communication occurs with the rapid expansion of COVID‐19 in the United States.
FIGURE 2.
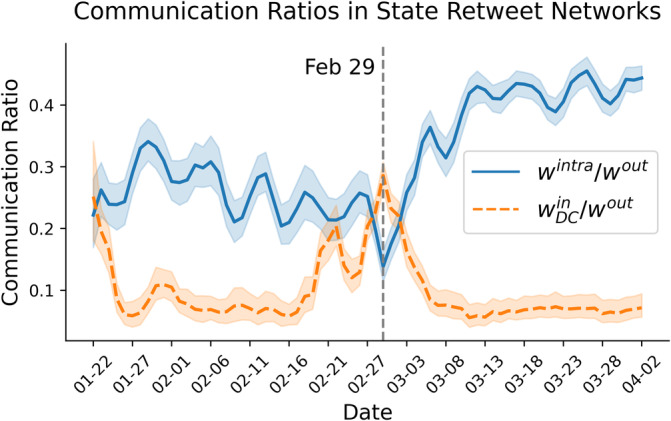
Daily trajectories of the intra‐ and inter‐state communication ratios with a bootstrapped 95% confidence interval. Blue: the ratio of intra‐state retweets out of retweets consumed by each state. Orange: the ratio of retweets produced from DC out of retweets consumed by each state. Vertical line: day of the first reported death in the United States
Interestingly, this growth is immediately preceded by a large dip in intra‐state communication on February 29, which is attributed to a shared increase in retweets produced from DC (orange line). The trajectory of the proportion of retweets from DC closely resembles the general U.S. retweet activity trend (cf., Figure 1). In light of our prior analysis, we conjecture that the increase in retweets from DC is in part due to the series of political events concerning top U.S. officials located in DC.
4.3.2. Intra‐state hashtags
We examine hashtags used in an inter‐ versus intra‐state context to identify the distinctiveness of conversations exchanged within states. Suppose is the number of times a hashtag h is used in a state s under the retweet context t ∈ {inter, intra}. The probabilities P(h| intra) and P(h| inter) of the use of hashtag h given a retweet context is given by:
| (2) |
where S is the set of all U.S. states and is the total appearance of a hashtag h in all the retweets consumed by state s . We rank the top intra‐state and top intra‐state hashtags in Table 5.
TABLE 5.
The top inter‐ and intra‐state hashtags ranked by P(h| inter) and P(h| intra), respectively
| Top inter‐state | P(⋅) | Top intra‐state | P(⋅) |
|---|---|---|---|
| #trumpvirus | .91 | #flattenthecurve | .31 |
| #china | .91 | #socialdistancing | .28 |
| #pandemic | .91 | #coronavirus | .18 |
| #hoax | .91 | #washyourhands | .18 |
| #maga | .90 | #publichealth | .17 |
| #americafirst | .89 | #podcast | .17 |
| #trump | .87 | #stopthespread | .16 |
| #dobbs | .86 | #health | .15 |
| #demdebate | .85 | #quarantinelife | .15 |
| #coronavirususa | .85 | #stayhomesavelives | .15 |
The results highlight the uniqueness of intra‐state communication, wherein people are considerably more concerned with spreading actionable messages of health and prevention. Matters of politics are most likely to be exchanged across states. We also note that the top inter‐ and intra‐ hashtag trends are the same for all states, regardless of their partisanship, indicating the unified characteristics intra‐state Twitter content.
4.4. Hashtag cluster analysis
We now consider the use of hashtags for content analysis. Figure 3 illustrates the time‐series popularity gain trajectories of the four temporal hashtag clusters detected by dipm‐SC. As a source of validation, the popularity gain trajectories in Figure 3 bear close resemblance to the time‐series of daily hashtag usage partitioned by their temporal cluster membership, which can be found in the SI. The hashtags belonging to each temporal cluster and semantic sub‐cluster are reported in Table 6. We removed sub‐clusters that have fewer than four hashtags to direct our attention to major sub‐clusters.
FIGURE 3.
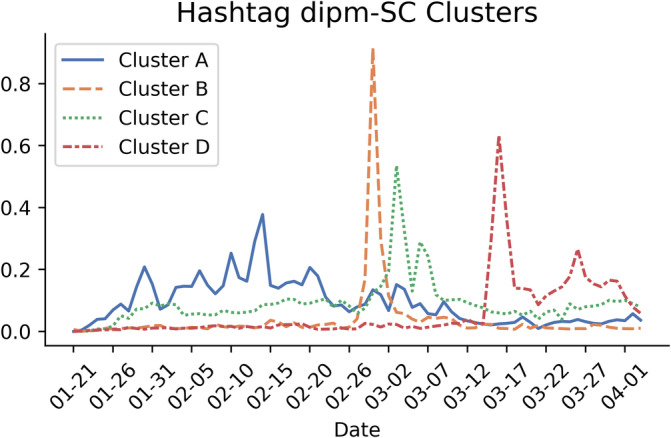
Popularity gain trajectories of the temporal hashtag clusters detected using the dipm‐SC method (Ozer et al., 2020)
TABLE 6.
The temporal hashtag clusters detected by the dipm‐SC method (Ozer et al., 2020), and the semantically similar sub‐clusters detected by the Louvain method (Blondel et al., 2008)
| Clusters | Hashtags | |
|---|---|---|
| A | 1 | #americafirst #billgates #bioweapon #qanon |
| 2 | #ai #economy #epidemic #freespeech #freezerohedge #health #hiv #iot #oil #oott #outbreak #ukraine | |
| 3 | #censorship #coronaviruscanada #coronavirusjapan #coronavirustruth #flu | |
| B | 1 | #cpac2020 #demdebate #fisa #pencedemic #supertuesday #trumpcrash |
| 2 |
#hoax #influenza #nasa #trumpliesaboutcoronavirus #trumpvirus #trumpviruscoverup #washington |
|
| C | 1 |
#aids #coronavirus #donaldtrump #ebola #foxnews #icymi #onevoice1 #pandemic #podcast #publichealth #washyourhands |
| 2 | #cdc #climatechange #climatecrisis #media #medicareforall #trump #trump2020 | |
| 3 | #business #california #cnn #florida #healthcare #newyork #nyc #science #stocks #tech #vaccine | |
| 4 | #fakenews #kag #maga #wwg1wga | |
| D | 1 | #coronapocalypse #covidiot #dontbeaspreader #familiesfirst #ppe #trumppandemic |
| 2 | #flattenthecurve #getmeppe #medtwitter #socialdistancing #stopthespread | |
Note: Only sub‐clusters with at least 4 hashtags are shown. Sub‐clusters of subjective but ideologically unifying hashtags are in bold.
The first temporal cluster (A), which spans the first 30 days in our data, covers the accumulating interest in the outbreak. Specifically, A1 contains hashtags related to conspiracy theories of the origin of COVID‐19. The hashtag #bioweapon traces back to the debunked fringe theory that the coronavirus was deliberately engineered (Stevenson, 2020). Clusters A2 and A3 show how the outbreak is affecting worldwide health and economy, as well as how it compares to other diseases such as the flu and HIV.
Temporal cluster B, which spikes in popularity in late February, corresponds to major political events that took place at the time (CPAC2020, Democratic presidential election debates, and Super Tuesday in B1). In particular, B2 exhibits disapproving sentiments directed at the federal administration, with #hoax being the public's response to the President describing the disease as the Democrats' “new hoax” (Rieder, 2020).
Cluster C peaks shortly after, in early March. It includes a variety of different topics and is comparatively more spread out over time than other clusters. Overall, it exhibits an increased awareness in public health and prevention (C1), concerns for its impact on the economy (C3), and a resurgence of the President's re‐election campaign (C4).
By mid‐March, as many states begin issuing stay‐at‐home orders, public response shifts unitedly toward urgency, public health, and COVID‐19 prevention (cluster D). During this time, the popularity of previous clusters of hashtags, most of which politically relevant, dropped drastically. Many of the trending hashtags in cluster D explicitly call attention to actionable preventive measures such as social distancing and hand‐washing. We also note that most of these hashtags appeared in the top intra‐state hashtags in Table 5. Furthermore, the timing of this cluster corresponds with the accumulating engagement in intra‐state communication (see Section 4.3), which serves as corroborating evidence that local measures of health and prevention are the most emphasized issue during this period.
To confirm the exploding popularity of hashtags in cluster D around mid‐March, we perform statistical analysis on the usage of cluster D hashtags before and on or after March 12, the day on which cluster D's popularity emerges. A paired t‐test displays that the average daily usage of each hashtag before March 12 (μ 1 = 5.90) is significantly lower than the average daily usage after on or after March 12 (μ 2 = 305.55) (P < 102).
The temporal hashtag clusters reveal that the trending topics of discussion are consistent with the real‐world events, and the semantic sub‐clusters reveal the divided conversations users engage in. The first three temporal clusters (A, B, and C) are either extremely politically charged or concerned with the real‐world impact of the pandemic. Many of the sub‐clusters display strongly polarizing sentiments that, as we previously showed (Section 4.2), are related to partisanship. Moreover, we see that sentiments supporting the federal government are persistent and recurring, covering a period from late January to early March. Attitudes against the President, on the other hand, are only observed briefly but emphatically during the few days in late February/early March.
The last temporal cluster (D) underscores the public's collective amplifying attention on health and prevention. The lack of political content also indicates this shift in focus from politically fueled discussions on COVID‐19.
4.5. Cross‐ideological interactions
Many of the detected hashtags clusters form polar opposite topics. Hence, we wish to gain insights into the characteristics of users who tweet certain topics. For the purpose of cross‐ideological interactions analyses, among all sub‐clusters, we select four sub‐clusters from Table 6 (indicated in bold) that exhibit polarized dynamics. We label them as follows:
A1: Conspiracy
B2: Right‐leaning
C4: Left‐leaning/Neutral
D2: Health/Prevention
We consider the users geotagged in the United States who have tweeted at least one hashtag from the above hashtag sub‐clusters. With respect to the four sub‐clusters, A1 and C4 share the biggest fraction of common users. Users of both sub‐clusters A1 and C4 make up for 50% of A1 users and 40% of C4 users. Together, there are 29,732 users who used hashtags from A1 or C4, and a comparable total of 28,316 users who used hashtags from B2. The hashtag sub‐cluster with the biggest user base is D2 (health/prevention) with 32,987 unique users. In total, nearly 50% of all users geotagged with a U.S. state engaged in the usage of at least one of the four hashtag sub‐clusters.
Since the number of users online and the topics of interest vary considerably over time, we avoid a direct comparison of users or their hashtag usage overlap. Instead, we estimate cross‐ideological interactions by comparing the retweet interaction among users of different hashtags sub‐clusters. Retweeting is commonly understood as a form of approval or endorsement (Boyd et al., 2010). Therefore, users are much more likely to retweet from someone they share similar ideologies with. By removing time‐varying factors from the equation, we can better capture the ideological differences across user groups. We now describe our qualitative methods to measure cross‐ideological interactions.
4.5.1. Retweet likelihood
From the retweet network, we can quantify how likely users of one hashtag sub‐cluster are to retweet from users of another sub‐cluster. Suppose U i is the set of users who used hashtags from sub‐cluster i . Let w(U i , U j ) be the number of times a user from U i retweets a user from U j . It follows that the likelihood of U i users retweeting from U j users, given how often U i users retweet each other, yields from the ratio.
| (3) |
A large retweet likelihood ratio (R(U i ← U j ) > 1) indicates that users in U i are more likely to retweet from users in U j than from someone of their own (U i ), representing a strong cross‐ideological interaction. Conversely, a small retweet likelihood ratio (R(U i ← U j ) < 1) means that users in U i are more likely to retweet from someone within their own group than from an external group U j , signaling a weak cross‐ideological interaction. This retweet likelihood ratio is not symmetric: that is, R(U i ← U j ) ≠ R(U j ← U i ).
Table 7 show that some hashtag users are more likely to retweet users of other hashtags. Conspiracy and right‐leaning users are more likely to retweet the other group than from their own (1.40 and 1.16). By contrast, conspiracy and left‐leaning/neutral users are less likely to retweet each other (0.86 and 0.71). However, we also observe that users of hashtags in the right‐leaning spectrum and in the left‐leaning or neutral spectrum are likely to retweet each other (both 1.16). A possible explanation is that many users use ideologically clashing hashtags in the same tweet so to maximize its exposure to users of both sides of the spectrum (Conover et al., 2011).
TABLE 7.
The retweet likelihood ratio R(U i ← U j ) of hashtag sub‐clusters i (rows) and j (columns) (see Equation (3))
| R(U i ← U j ) | A1 | C4 | B2 | D2 |
|---|---|---|---|---|
| Conspiracy (A1) | — | 1.40 | 0.86 | 0.44 |
| Right‐leaning (C4) | 1.16 | — | 1.16 | 0.58 |
| Left‐leaning/neutral (B2) | 0.71 | 1.16 | — | 0.83 |
| Health/prevention (D2) | 1.20 | 1.94 | 2.75 | — |
The largest drop in retweet likelihood ratio occurs between users of right‐leaning hashtags and users of health/prevention hashtags. Right‐leaning users are 0.58 as likely to retweet from health/prevention hashtag users and the conspiracy users are even less likely (0.44). In comparison, left‐leaning or neutral are more likely than their conservative counterparts to retweet from health/prevention hashtag users (0.83).
Overall, users of health/prevention hashtags form a much less tight‐knit community: they are more likely to retweet from users of other hashtag sub‐clusters than from their own. This suggests that these hashtags come from a more diverse selection of users. Nonetheless, their users are twice as likely to retweet from left‐leaning/neutral than right‐leaning users, indicating that they resonate more with left‐leaning or neutral users.
4.5.2. User segregation
We visualize the retweet network of users of the four hashtag sub‐clusters in Figure 4. For visualization purposes, we randomly sample 20,000 nodes (users) and then plot the largest connected component. The graph is then laid out using ForceAtlas2 (Jacomy et al., 2014) and color‐coded according to the communities detected by the Louvain method (Blondel et al., 2008). We color nodes from the top three communities, which make up for 83% of all nodes.
FIGURE 4.

The retweet network of users of hashtag sub‐clusters A1, B2, C4, and D2 laid out using ForceAtlas2 (Jacomy, Venturini, Heymann, & Bastian, 2014). The top 3 detected communities are colored accordingly. The red community is composed of mostly right‐leaning users (A1 and C4), and the blue and yellow communities are mostly left‐leaning/neutral users (B2). Users of health/prevention hashtags (D2) are twice as represented in the blue than the red community
Figure 4 displays clear segregation of politically opposing communities. The red community consists of 77% users who posted conspiracy (A1) or conservative (C4) hashtags. On the opposite side of the plot, the blue and yellow communities consist of 75% and 81% of users, respectively, who posted hashtags that are critical of the federal administration (B2). Users who used health/prevention (D2) hashtags are scattered, but they are more represented in the blue and yellow communities (27% and 17%) than in the red community (13%). This supports our previous finding that users of health/prevention hashtags are more closely tied to left‐leaning/neutral users.
5. DISCUSSION
To understand the topics of discussion related to the evolution of COVID‐19, we examined the usage of hashtags in the United States from the geospatial and temporal dimensions. We also studied the characteristics of interactions among users holding diverging opinions.
Our first observation is that the American public frames the coronavirus pandemic on Twitter as a core political issue. The vast majority of hashtags relevant to the United States directly references key political leaders or major political events that took place. Given that there is a presidential election taking place in 2020, it is not surprising to see coronavirus at the center of attention in the political agendas. However, there is an indication of the emergence and spread of conspiracy theories, during the early stages of our study period. Related research also shows that social bots are partially responsible for this (Ferrara, 2020), which could exacerbate the spread of conspiracies online. On the other side of the spectrum, there exist users who are overly critical of the White House's actions. Consequently, these polarizing discussions on Twitter increasingly politicize the issue of COVID‐19, deviating the public's attention from the core focus that is the pandemic.
We also illustrate that online dialogue exhibits a clear attitude divide that splits along partisan and ideological lines. Users from liberal‐leaning states frequently tweet content critical of political elites, whereas users from conservative‐leaning states persistently utilize hashtags in support of the President. Correspondingly, we observe two segregated communities at the user‐level. Emerging from the user base induced by ideologically distinct hashtag sub‐clusters—conspiracy, right‐leaning, left‐leaning/neutral, health/prevention—are two polarizing communities largely divided by their political ideology. Comparing users who tweet right‐leaning hashtags with users who tweet left‐leaning/neutral hashtags, the former group is less likely to interact with users who tweet health and prevention hashtags.
This would suggest that users on the right‐leaning and conspiracy thinking side are associated with the aversion in promoting awareness of health and prevention. We find evidence in support of this finding in related work. A recent survey conducted by Uscinski et al. (2020) harvardmisinfo revealed that those with a psychological predisposition of conspiracy thinking or those in support of the current administration are likely to believe the virus has been exaggerated. Another study on partisanship views also concludes that Republicans are less likely than Democrats to see the pandemic as a serious threat Green and Tyson (2020). Using smartphone location data, Barrios & Hochberg (2020) showed that counties with a higher percentage of conservatives are less likely to adhere to stay home (or shelter‐in‐place) orders. Thus, we argue that since these users are more likely to believe the current situation is overstated, they are also less inclined to promote health, safety, and adequate social distancing against the virus.
Since partisan cues guide the evolution of COVID‐19 beliefs and discussions, partisan predispositions have the potential to also impact the efficacy of health campaigns and public policies. Through observing the topics of discussion, we additionally see that elected officials continue to influence conversations about the pandemic, granting them the potential to shape public opinion. Government leaders can utilize these findings to more effectively relay corrective information to their constituents.
Nevertheless, as the virus takes a foothold in the United States, we find that all states collectively steer the conversation to public health and preventive awareness as part of the increasing communication within states. Arising from this crisis is a shared sense of urgency and strengthened local community engagement, implying that people could be growing more receptive to state policy changes in preventing the spread of the virus.
As many in the United States battle with the lack of adequate health care and economic insecurity, the implications of COVID‐19 are far greater than what can be observed on Twitter. Consequently, more in‐depth analyses from a social science perspective are warranted for further investigation. While this work suggests that the use of natural language processing and network science techniques can provide some insights into COVID‐19 online discussion, we also hope that it will motivate other social scientists and data scientists to apply a diverse toolkit of investigation methods to our publicly‐released Twitter dataset (Chen et al., 2020).
Supporting information
Appendix S1. Supporting Information.
ACKNOWLEDGMENT
This work was supported by AFOSR Award Number #FA9550‐17‐1‐0327.
Biographies
Julie Jiang is currently pursuing her PhD in Computer Science at the University of Southern California and is a student researcher at the Information Sciences Institute, USC. She obtained her B.S. from Tufts University in Applied Mathematics and Computer Science in 2019. Her research focuses on applying machine learning methods for computational social sciences applications.

Emily Chen is a PhD student in Computer Science at the Information Sciences Institute at the University of Southern California. Prior to her time at USC, Emily completed her BS in Computer Engineering at the University of Illinois Urbana‐Champaign in 2017. She is currently working under the supervision of Dr Emilio Ferrara, and her research interests lie in machine learning, computational social sciences, and human behavior analysis.

Shen Yan is a PhD student in Computer Science at the University of Southern California, Information Sciences Institute. She received her MS degree at State Key Laboratory of Information Security, Institute of Information Engineering, Chinese Academy of Sciences in 2017, and BE degree from Hebei University of Technology, Tianjin, China in 2014. Her research interests include machine learning, computational social science, and data privacy.

Kristina Lerman is a Principal Scientist at the University of Southern California Information Sciences Institute and holds a joint appointment as a Research Associate Professor in the USC Computer Science Department. Trained as a physicist, she now applies network analysis and machine learning to problems in computational social science, including crowdsourcing, social network, and social media analysis. Her recent work on modeling and understanding cognitive biases in social networks has been covered by the Washington Post, Wall Street Journal, and MIT Tech Review.

Emilio Ferrara is a Research Assistant Professor of Computer Science, Research Team Leader at the Information Sciences Institute, and Associate Director of Data Science programs at USC. His research is at the intersection between theory, methods, and applications to study socio‐technical systems and information networks. He is concerned with understanding the implications of technology and networks on human behavior, and their effects on society at large. His work spans from studying the Web and social networks, to collaboration systems and academic networks, from team science to online crowds. Ferrara has published over 150 articles on social networks, machine learning, and network science appeared in venues like the Proceeding of the National Academy of Sciences, and Communications of the ACM. Ferrara received the 2016 DARPA Young Faculty Award, the 2016 Complex Systems Society Junior Scientific Award, the 2018 DARPA Director's Fellowship, and the 2019 USC Viterbi Research Award.

Jiang J, Chen E, Yan S, Lerman K, Ferrara E. Political polarization drives online conversations about COVID‐19 in the United States. Hum Behav & Emerg Tech. 2020;2:200–211. 10.1002/hbe2.202
Peer Review The peer review history for this article is available at https://publons.com/publon/10.1002/hbe2.202.
Funding information AFOSR, Grant/Award Number: FA9550‐17‐1‐0327
REFERENCES
- Alshaabi, T. , Minot, J. R. , Arnold, M. V. , Adams, J. L. , Dewhurst, D. R. , Reagan, A. J. , Muhamad, R. , Danforth, C. M. , & Dodds, P. S. (2020). How the world's collective attention is being paid to a pandemic: COVID‐19 related 1‐gram time series for 24 languages on Twitter. arXiv preprint arXiv:2003.12614. [DOI] [PMC free article] [PubMed]
- Barrios, J. M. , & Hochberg, Y. (2020). Risk perception through the lens of politics in the time of the COVID‐19 pandemic (Working Paper No. 27008). Cambridge, MA: National Bureau of Economic Research. 10.3386/w27008 [DOI] [Google Scholar]
- Blondel, V. D. , Guillaume, J.‐L. , Lambiotte, R. , & Lefebvre, E. (2008). Fast unfolding of communities in large networks. Journal of Statistical Mechanics: Theory and Experiment, 2008(10), P10008. 10.1088/1742-5468/2008/10/p10008 [DOI] [Google Scholar]
- Boyd, D. , Golder, S. , & Lotan, G. (2010). Tweet, tweet, retweet: Conversational aspects of retweeting on Twitter. In 2010 43rd Hawaii International Conference on System Sciences. Los Alamitos, CA: IEEE. 10.1109/HICSS.2010.412 [DOI] [Google Scholar]
- Broniatowski, D. A. , Jamison, A. M. , Qi, S. , AlKulaib, L. , Chen, T. , Benton, A. , … Dredze, M. (2018). Weaponized health communication: Twitter bots and Russian trolls amplify the vaccine debate. American Journal of Public Health, 108(10), 1378–1384. 10.2105/AJPH.2018.304567 [DOI] [PMC free article] [PubMed] [Google Scholar]
- Centers for Disease Control and Prevention . (2020). CDC confirms possible instance of community spread of COVID‐19 in U.S. Department of Health and Human Services. Atlanta, GA: Author. https://www.cdc.gov/media/releases/2020/s0226-Covid-19-spread.html [Google Scholar]
- Chen, E. , Lerman, K. , & Ferrara, E. (2020). Tracking social media discourse about the covid‐19 pandemic: Development of a public coronavirus twitter data set. JMIR Public Health and Surveillance, 6(2), e19273. 10.2196/19273 [DOI] [PMC free article] [PubMed] [Google Scholar]
- Cheng, Z. , Caverlee, J. , & Lee, K. (2010). You are where you tweet: A content‐based approach to geo‐locating Twitter users. In Proceedings of the 19th ACM international conference on information and knowledge management. New York, NY: Association for Computing Machinery. 10.1145/1871437.1871535 [DOI] [Google Scholar]
- Cinelli, M. , Quattrociocchi, W. , Galeazzi, A. , Valensise, M. , Brugnoli, E. , Schmidt, A. L. , Zola, P. , Zollo, F. , & Scala, A. (2020). The COVID‐19 social media infodemic. arXiv preprint arXiv:2003.05004. [DOI] [PMC free article] [PubMed]
- Conover, M. D. , Ratkiewicz, J. , Francisco, M. , Gonçalves, B. , Menczer, F. , & Flammini, A. (2011). Political polarization on Twitter. In Fifth International AAAI Conference on Weblogs and Social Media. Menlo Park, CA: AAAI. [Google Scholar]
- Conover, M. D. , Davis, C. , Ferrara, E. , McKelvey, K. , Menczer, F. , & Flammini, A. (2013). The geospatial characteristics of a social movement communication network. PLoS One, 8(3), 1–8. 10.1371/journal.pone.0055957 [DOI] [PMC free article] [PubMed] [Google Scholar]
- Davis, C. A. , Varol, O. , Ferrara, E. , Flammini, A. , & Menczer, F. (2016). Botornot: A system to evaluate social bots. In Proceedings of the 25th International Conference on World Wide Web. Republic and Canton of Geneva, CHE: International World Wide Web Conferences Steering Committee. 10.1145/2872518.2889302 [DOI] [Google Scholar]
- Ferrara, E. (2020). What types of covid‐19 conspiracies are populated by twitter bots? First Monday, 25(6). 10.5210/fm.v25i6.10633 [DOI] [Google Scholar]
- Gallotti, R. , Valle, F. , Castaldo, N. , Sacco, P. , & De Domenico, M. (2020). Assessing the risks of “infodemics” in response to COVID‐19 epidemics. medRxiv. 10.1101/2020.04.08.20057968 [DOI] [PubMed] [Google Scholar]
- Gao, J. , Zheng, P. , Jia, Y. , Chen, H. , Mao, Y. , Chen, S. , … Dai, J. (2020). Mental health problems and social media exposure during COVID‐19 outbreak. PLoS One, 15(4), 1–10. 10.1371/journal.pone.0231924 [DOI] [PMC free article] [PubMed] [Google Scholar]
- Gershman, J. (2020, April 20). A guide to state coronavirus lockdowns. The Wall Street Journal. https://www.wsj.com/articles/a-state-by-state-guide-to-coronavirus-lockdowns-11584749351 [Google Scholar]
- Green, T. V. , & Tyson, A. (2020). 5 facts about partisan reactions to COVID‐19 in the U.S. Washington, DC: Pew Research Center. https://www.pewresearch.org/fact‐tank/2020/04/02/5‐facts‐about‐partisan‐reactions‐to‐covid‐19‐in‐the‐u‐s/ [Google Scholar]
- Jacomy, M. , Venturini, T. , Heymann, S. , & Bastian, M. (2014). ForceAtlas2, a continuous graph layout algorithm for handy network visualization designed for the Gephi software. PLoS One, 9(6), e98679. 10.1371/journal.pone.0098679 [DOI] [PMC free article] [PubMed] [Google Scholar]
- Kleinberg, B. , van der Vegt, I. , & Mozes, M. (2020). Measuring emotions in the COVID‐19 real world worry dataset. arXiv preprint arXiv:2004.04225.
- National Conference of State Legislatures . (2020). State partisan composition. Retrieved from https://www.ncsl.org/research/about-state-legislatures/partisan-composition.aspx
- National Governors Association . (2020). Coronavirus: What you need to know. Washington, DC: National Governors Association NGA. Retrieved from https://www.nga.org/coronavirus/ [Google Scholar]
- Ozer, M. , Sapienza, A. , Abeliuk, A. , Muric, G. , & Ferrara, E. (2020). Discovering patterns of online popularity from time series. Expert Systems with Applications, 151, 113337. 10.1016/j.eswa.2020.113337 [DOI] [Google Scholar]
- Pennycook, G. , McPhetres, J. , Zhang, Y. , & Rand, D. (2020). Fighting COVID‐19 misinformation on social media: Experimental evidence for a scalable accuracy nudge intervention. PsyArXiv. 10.31234/osf.io/uhbk9 [DOI] [PMC free article] [PubMed] [Google Scholar]
- Rieder, R. (2020). Trump and the “New Hoax”. FactCheck.org. Retrieved from https://www.factcheck.org/2020/03/trump-and-the-new-hoax/
- Schild, L. , Ling, C. , Blackburn, J. , Stringhini, G. , Zhang, Y. , & Zannettou, S. (2020). “Go eat a bat, Chang!”: An early look on the emergence of sinophobic behavior on web communities in the face of COVID‐19. arXiv preprint arXiv:2004.04046.
- Serrano, M. A. , Boguna, M. , & Vespignani, A. (2009). Extracting the multiscale backbone of complex weighted networks. Proceedings of the National Academy of Sciences, 106(16), 64836488. 10.1073/pnas.0808904106 [DOI] [PMC free article] [PubMed] [Google Scholar]
- Singh, L. , Bansal, S. , Bode, L. , Budak, C. , Chi, G. , Kawin‐tiranon, K. , Padden, C. , Vanarsdall, R. , Vraga, E. , & Wang, Y. (2020). A first look at COVID‐19 information and misinformation sharing on twitter. arXiv preprint arXiv:2003.13907.
- Stella, M. , Ferrara, E. , & De Domenico, M. (2018). Bots increase exposure to negative and inflammatory content in online social systems. Proceedings of the National Academy of Sciences, 115(49), 12435–12440. [DOI] [PMC free article] [PubMed] [Google Scholar]
- Stevenson, A. (2020, February 18). Senator Tom Cotton repeats fringe theory of coronavirus origins. The New York Times. https://www.nytimes.com/2020/02/17/business/media/coronavirus-tom-cotton-china.html
- Subrahmanian, V. , Azaria, A. , Durst, S. , Kagan, V. , Gal‐styan, A. , Lerman, K. , … Menczer, F. (2016). The DARPA Twitter bot challenge. Computer, 49(06), 3846–3846. 10.1109/MC.2016.183 [DOI] [Google Scholar]
- Taylor, D. B. (2020, April 14). A timeline of the coronavirus pandemic. The New York Times. https://www.nytimes.com/article/coronavirus-timeline.html
- The New York Times . (2020, May 7). Coronavirus in the U.S.: Latest map and case count. The New York Times. https://www.nytimes.com/interactive/2020/us/coronavirus-us-cases.html
- United States Census Bureau . (2020, March 24). City and town population totals: 2010‐2018. Department of Commerce. https://www.census.gov/data/tables/time‐series/demo/popest/2010s‐total‐cities‐and‐towns.html
- Uscinski, J. E. , Enders, A. M. , Klofstad, C. A. , Seelig, M. I. , Funchion, R. , John Everett, C. , … (2020). Why do people believe COVID‐19 conspiracy theories? The Harvard Kennedy School (HKS) Misinformation Review, 1(3). 10.37016/mr-2020-015 [DOI] [PMC free article] [PubMed] [Google Scholar]
- Wallach, P. A. , & Myers, J. (2020). The federal government's coronavirus response‐public health timeline. Washington, DC: Brookings Institution. https://www.brookings.edu/research/the‐federal‐governments‐coronavirus‐actions‐and‐failures‐timeline‐and‐themes/ [Google Scholar]
Associated Data
This section collects any data citations, data availability statements, or supplementary materials included in this article.
Supplementary Materials
Appendix S1. Supporting Information.