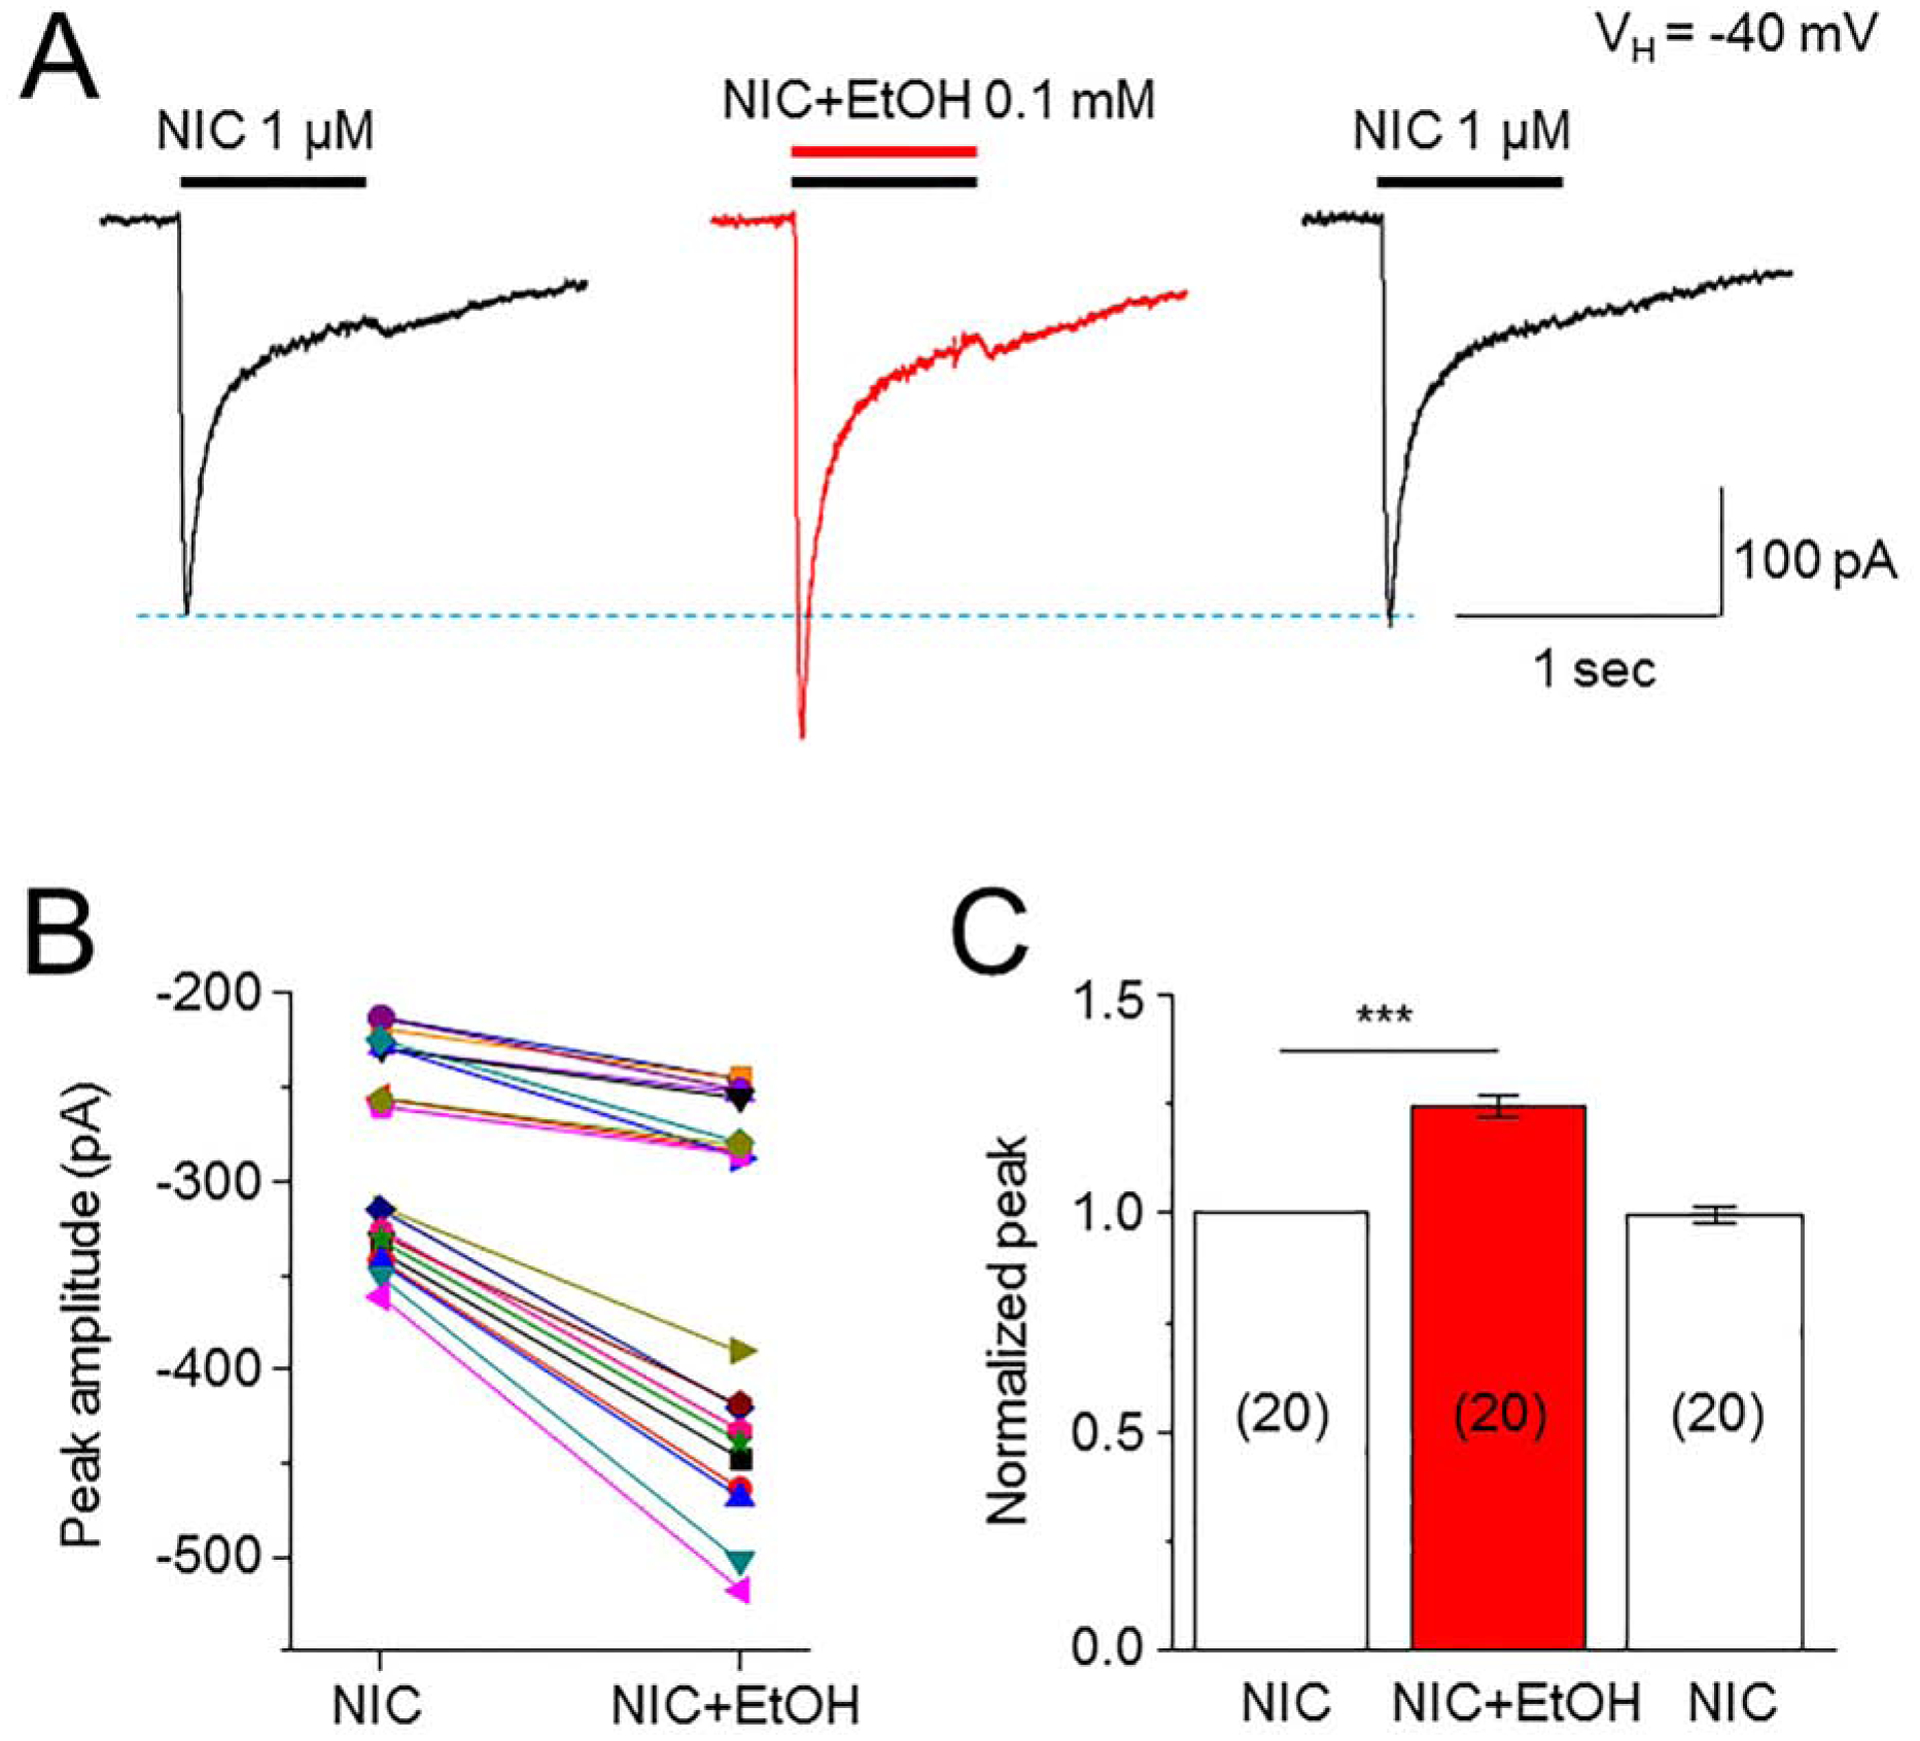
Fig. 1. Effects of low dose EtOH on α6*-nAChR-mediated whole-cell currents.

A: Typical traces demonstrate 1 μM NIC-induced inward current before, during and after washout of 0.1 mM EtOH. EtOH and NIC were co-applied. All three traces were recorded from the same cell. B: Comparison of peak amplitudes of NIC-induced inward currents before and during EtOH exposure. C: Bar graph summarizes the normalized peak amplitude of NIC-induced current before, during and after washout of EtOH. In this and all following figures the number inside each column indicates the number of cells tested, *** indicates p<0.001.
