Abstract
Since 1997, S’COOL has engaged interested participants worldwide in observing clouds and comparing data from ground and satellite sources to inform validation efforts for several NASA Earth science missions.
Scientists are increasingly interested in crowd-sourced data but have concerns about its accuracy. Begun nearly 20 years ago, the Students’ Cloud Observations Online (S’COOL) project, introduced to BAMS readers in Chambers et al. (2003), offers a unique opportunity to inform this question. S’COOL arose from a confluence of education and science needs. Teachers are able to engage students in real-world science, while NASA obtains extensive ground-based data on clouds. Here we examine the record of participation and the information gathered to assess the value of crowd-sourced Earth system data and to illuminate important considerations for scientists considering involving a wider community in their work.
Imager-based cloud retrievals (cloud/no cloud and cloud properties such as phase, optical depth, and height) are some of the foundational data sources used to determine scene characteristics within each footprint of the Clouds and the Earth’s Radiant Energy System (CERES; Wielicki et al. 1996) instrument. This information is needed to analyze the radiation balance throughout the day, a precursor to understanding the Earth radiation budget (ERB) at climatological time scales (Loeb et al. 2009). Thus, it is very important to understand the accuracy of cloud retrievals as biases can influence the CERES-derived ERB. Meanwhile, students in classrooms around the world learn about clouds and the scientific process as part of the school curriculum, and many adults observe the sky individually or through hobby clubs and organizations. S’COOL connects these interests by engaging students and others in cloud observations and analysis.
The accuracy of CERES Moderate Resolution Imaging Spectroradiometer (MODIS; Minnis et al. 2011) and geostationary (herein “GEO”) imager cloud retrievals has typically been determined based on comparison with highly accurate products derived from ground- or space-based lidar [e.g., the Cloud-Aerosol Lidar and Infrared Pathfinder Satellite Observations (CALIPSO); Minnis et al. 2008] and radar (Smith et al. 2008). Space-based observations are essential for validation as they provide global observations throughout the year, which enables identification of retrieval inadequacies that might not be detected with observations from a fixed site. Unfortunately, satellites such as CALIPSO observe much of the globe only twice per day in tropical and midlatitude regions (~1:30 a.m./p.m. local time). CALIPSO observations are collected only near the centerline (i.e., nadir) of the MODIS swath. These near-nadir and near-solar-noon CALIPSO observations do not permit evaluation of cloud retrieval algorithm accuracy at all hours of the day. This is a key unknown within the cloud retrieval community as variable solar illumination and viewing angle can have a significant impact on algorithm performance (Minnis 1989; Várnai and Marshak 2007).
On the other hand, the combination of the human eye and mind is perhaps the best “remote sensor” for identifying the presence of clouds and characterizing basic properties such as cloud type (stratiform, cumuliform, or cirroform), cloud cover (partly versus mostly cloudy or overcast), and cloud opacity (transparent, translucent, or opaque). Galaxy Zoo, a citizen science initiative in which participants visually classify galaxy morphologies from Sloan Digital Sky Survey imagery, successfully demonstrated the ability of nonspecialists to accurately identify such visual information and provide research-quality data (Lintott et al. 2008; Willett et al. 2013). People can also provide observations at any time during daylight hours— and sometimes at night—helping to fill a critical data gap for validation of satellite cloud retrievals. S’COOL’s main goal is to engage and maintain a large cadre of observers who collect this valuable ground truth data.
The cloud properties reported by S’COOL observers (see report form https://scool.larc.nasa.gov/pdf/forme-ol.pdf) were selected to be aligned with those derived by the CERES cloud algorithms, including cloud coverage, height, layering, and visual opacity. CERES instruments fly on the TRMM, Terra, Aqua, and Suomi-National Polar-Orbiting Partnership (Suomi-NPP) satellites, with additional launches planned in 2017 and beyond (http://ceres.larc.nasa.gov). S’COOL observations are also relevant to other satellites in the afternoon constellation or A-Train, especially CALIPSO and CloudSat. Observations have been essentially unchanged since S’COOL began; thus, the entire set of observations can be analyzed and compared from ground and space views.
CHARACTERIZING S’COOL GROUND OBSERVATION DATA
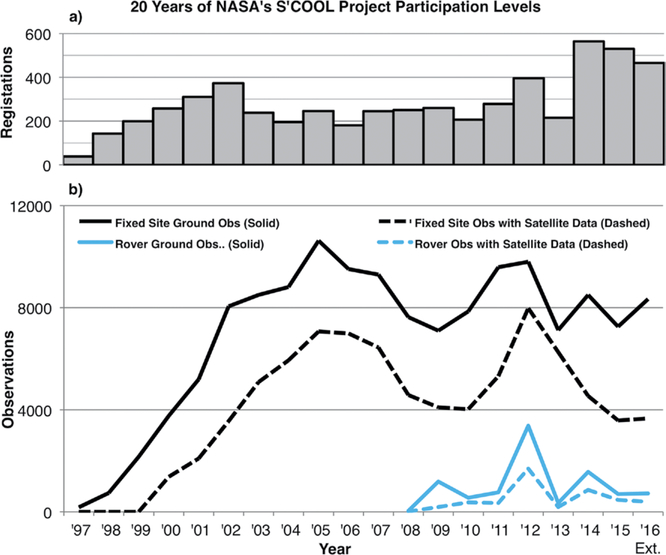
The observations collected by S’COOL can be characterized by time, space, source, amount, length of observations, and correspondence to satellite overpasses. As shown in Fig. 1, during the first 5 years of the project the number of observations reported increased steadily. Since then, school-based observations (solid black lines) have held fairly steady for over a decade, averaging ~8,500 observations/year. New participants continue to register at a rate of several hundred per year. This lasting interest rests on connecting NASA’s research focus on Earth’s energy budget with the benefits of widely distributed ground data through a simple, accessible, and educationally relevant cloud observation project.
Fig. 1.
History of S’COOL participation: (a) Number of new participants that registered for the S’COOL Project each year. (b) Number of ground observations submitted by fixed site participants (solid black line), and subset that coincides with CERES satellite cloud retrieval data (dashed black line). Observations and subset coinciding with satellite data from Rovers are also shown (solid and dashed blue lines). Note that 2016 data, available through the month of May, was extrapolated for comparison to past years.
In 2008, leveraging geolocation tools such as Google Maps enabled participants to easily request satellite overpass times for any location on Earth. This allowed us to invite participation other than from teacher-led formal education settings at fixed sites (for which the team previously did a manual confirmation of geolocation). S’COOL identifies such nonfixed site participants as “Rovers,” since the initial impetus for such a capability came from home schooling families traveling around in recreational vehicles. Adding this Rover option was simple because S’COOL welcomes anyone with no training required. The website offers information and background material for those who are motivated to explore it. The only distinction between Rovers and fixed site S’COOL observers is the way they are geolocated. Information about the Rover option has been spread primarily by word of mouth, though it was featured in the fall 2014 NASA #SkyScience campaign; thus, participation has varied from year to year (blue curves in Fig. 1).
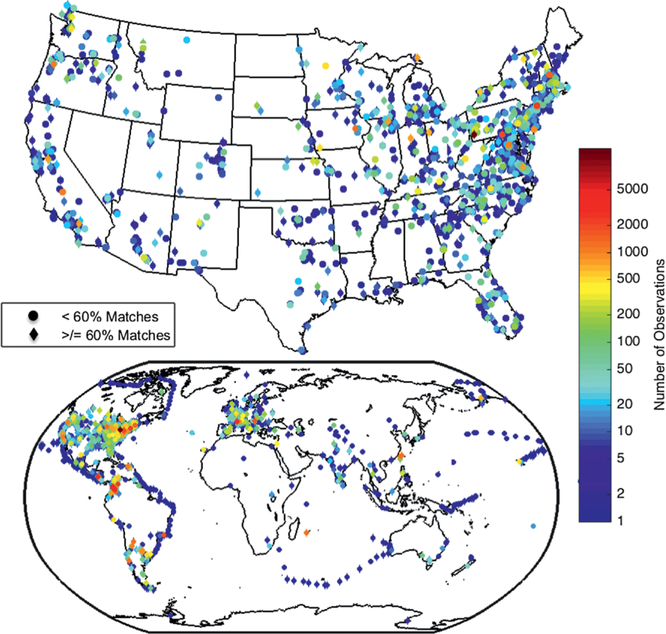
As of May 2016, S’COOL participants have submitted over 144,500 ground observations from 77 countries around the world (Fig. 2). Ground observations correspond in space (0.4° lat/lon radius circle) and time (±15 min) to CERES satellite data in ~62% of cases for fixed S’COOL observation sites (primarily schools) and 50% of cases for nonfixed sites (Rovers). We have received observations from all ocean basins thanks to several special Rovers including the Around the Americas ship (2009; www.aroundtheamericas.org), a solo ocean rower (2010/11; www.rozsavage.com/expeditions), an instrumented cargo ship during the Marine Atmospheric Radiation Measurement (ARM) GPCI Investigation of Clouds (MAGIC; Lewis and Teixeira 2015) field campaign, and an expedition to Heard Island in early 2016 (http://go.usa.gov/cJ2Xe). The S’COOL Rover option enables such groups to easily contribute observations from parts of the world where surface-based observations are rare.
Fig. 2.
S’COOL Project participation spans the globe. Colored icons, plotted from least to most observations, show total observations at each location since the beginning of the project, increasing from blue to red. Diamonds (circles) represent locations where ≥60% (<60%) of observations correspond to satellite data. (An up-to-date version of this map may be found at http://scool.larc.nasa.gov/background-latestmap.html.)
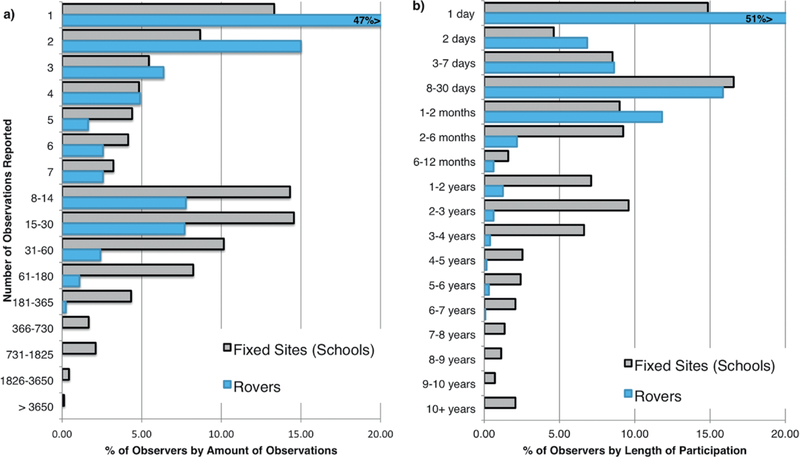
Since participation is entirely voluntary, it is instructive to examine the amount and length of reporting. Figure 3 shows the distribution of the number of observations reported and the time from first to last observation. This figure represents only the ~32% of fixed site participants who register for S’COOL then actually report data; there is no registration process for Rovers. [For comparison, the recent experience in the GLOBE Program (Kennedy and Henderson 2003) is that ~10% of registered educators report data; T. Andersen 2016, personal communication.] The least involved 20% of those reporting submit only 1–2 observations (1 for Rovers), while the most involved 20% report 60 or more times (7 for Rovers). In terms of length of participation, Fig. 3b shows a peak at about two months, corresponding more or less to a school term. Interestingly enough, this peak also shows up among Rover participants (blue bars). Many fixed sites continue observing for 1–3 years and several dozen have stayed involved for over a decade. The Rover option has been available only since 2008, but even there some observers have been engaged for more than 5 years. This is similar to the experience in other crowd-sourcing projects, where a small number of participants get very engaged while many others participate on a casual basis.
Fig. 3.
S’COOL and Rover amount and length of observations. (a) Histogram showing the distribution of observers by number of observations reported; (b) distribution by length of participation (from first to last observation). Some observers report more than one observation on a single day.
A subset of S’COOL observations has extra value. Since Aqua’s launch in 2002, over 1,000 observations north of 40°N correspond to both Terra and Aqua overpasses within the 15-min time matching window as their polar orbits converge at the poles. Since this usually occurs with very different viewing geometry, the cloud retrievals are often not entirely consistent for the two satellites. Thus, an independent view from the ground can be especially useful. Since 2011 we also have over 2,000 double matches with the Suomi-NPP satellite and Aqua/Terra; many of these have similar viewing geometry. And after the addition of GEO matching less than a year ago, over 1,400 GEO/CERES double matches are already available, allowing comparison of cloud retrievals between 40°S and 50°N latitude. (These all can be explored here: http://scool.larc.nasa.gov/en_query_double_matches.html.) The S’COOL community thus provides an extensive (spatially and temporally) ground truth dataset, recording views of clouds and the atmosphere from the ground up—a collection not attainable by scientists alone.
CONNECTION TO SATELLITE DATA
S’COOL has progressed from the beginning of the project when 1) obtaining corresponding satellite data from CERES on TRMM for a ground observation took literally years, to 2) routine processing for CERES on Terra and Aqua with matches in ~6 months, to 3) leveraging Fast Longwave and Shortwave Radiative Flux (FLASHFlux) processing (Kratz et al. 2014), which produced Terra/Aqua satellite results within a week, and to 4) today, automating an interface to GEO satellite data that produces results within 24 h. This increasingly rapid feedback has been key to engaging participants, especially as technology expectations in general have increased. Adding GEO data also greatly increases the observing opportunities for which we can provide matching satellite data. This is very helpful for school-based observers constrained by a daily academic schedule, as well as for Rovers. It also provides a source of ground truth data to assess the CERES Time Interpolation Spatial Averaging algorithms, which rely on geostationary cloud retrievals and are critical to producing correct monthly average energy budget parameters.
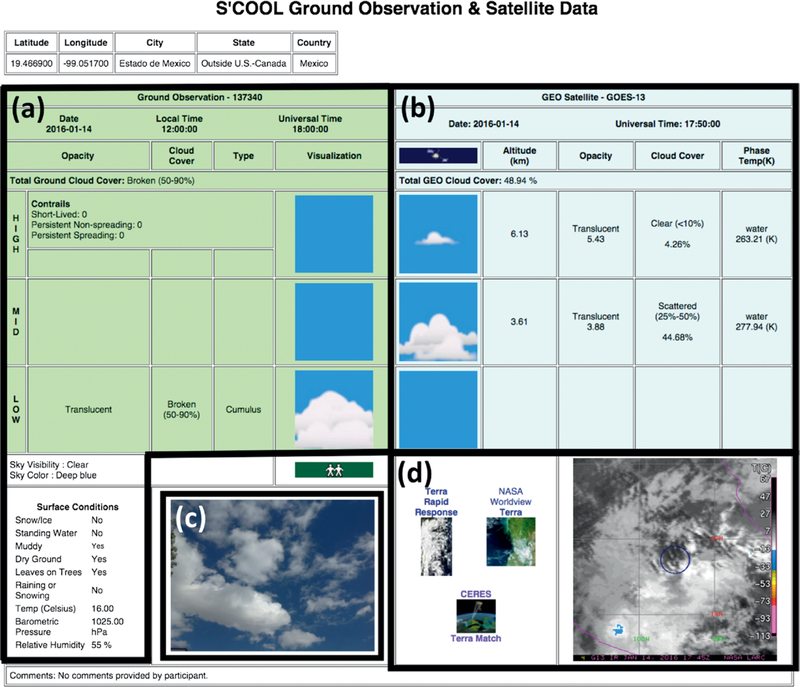
Since algorithms for higher-level CERES data products use data from MODIS instruments [Visible Infrared Imaging Radiometer Suite (VIIRS) on Suomi-NPP], in 2000 we leveraged the MODIS Rapid Response site (http://rapidfire.sci.gsfc.nasa.gov/realtime) and later the NASA Worldview tool (https://worldview.earthdata.nasa.gov) to give participants increasingly customized satellite imagery corresponding to their report from the ground. First, Rapid Response enabled a direct link to the MODIS 5-min data granule containing the ground observation site; then Worldview provided the capability to specify a 1° by 1° subset of a MODIS image centered on the observer’s location. In 2014, we added yet another dimension to ground observation reports by accepting participant photos. Figure 4 shows an example of the current report layout sent to participants, with key features highlighted. Observations that include both ground photos and satellite images (over 1,000 so far; see http://scool.larc.nasa.gov/cgi-bin/ObsPhoto.cgi) create a rich collection to explore patterns as well as help participants compare and analyze matches and understand the different strengths and weaknesses of satellite imagery and ground-based human observation.
Fig. 4.
A sample of the ground and satellite comparison visualization that S’COOL participants receive when their observation report corresponds to a satellite overpass. This example aligns to both GEO and CERES overpasses. Readers may explore many more reports at https://scool.larc.nasa.gov/en_query_alldata.html. (a) Reported ground observation. (b) Corresponding satellite retrieved cloud properties. (c) Submitted ground photo. (d) Corresponding satellite imagery—in this case a GEO image centered on the observer’s location, and links to the corresponding MODIS image (in both Rapid Response and Worldview). Also shown is a link to a similar visualization (CERES Terra Match) for CERES rather than GEO.
SCIENTIFIC USE OF S’COOL OBSERVATIONS
An in-depth assessment of S’COOL data for the period March 2000 (Terra launch) to May 2015 has been conducted. This was the first comprehensive analysis since Chambers et al. (2004). In that time the database of S’COOL observations matched to satellite data had grown eightfold.
Using S’COOL observations to validate CERES cloud detection algorithms
We first compared S’COOL and CERES MODIS cloud detections. Based on the S’COOL observation, the sky was either classified as clear (<5% cloud cover) or cloudy (≥5% cover). Table 1 shows a comparison of S’COOL and CERES MODIS cloud detection using 72,501 S’COOL-MODIS matches from the study period. We found 87.2% agreement between ground observations and satellite detection. These results match MODIS-CALIPSO cloud detection comparisons, which also show an agreement of 87% (P. Minnis 2016, personal communication), and provide confidence in S’COOL observers’ ability to discern and accurately report the presence of clouds.
Table 1.
Test of cloud mask: comparison of S’COOL participant cloud reports with CERES MODIS cloud retrievals from Mar 2000 to May 2015.
| S’COOL clear | S’COOL cloudy | |
|---|---|---|
| CERES MODIS clear | 8,099 | 2,407 |
| CERES MODIS cloudy | 6,901 | 55,094 |
Percentage of correct cloud/no cloud detections: 87.2%
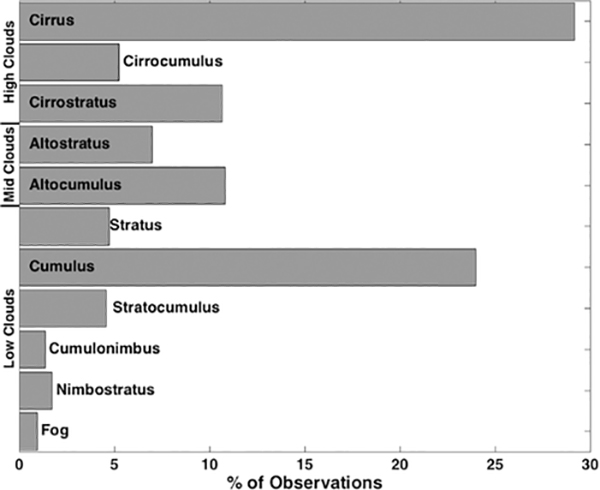
The 12.8% of cases with disagreement between S’COOL observations and CERES MODIS retrievals may shed light on areas of weakness in the CERES MODIS cloud detection algorithm. Examination of the ground-reported cloud types for these cases (Fig. 5) reveals that the cloud types most frequently missed by the CERES MODIS cloud mask are cirroform clouds (45%) and cumulus clouds (24%). These cloud types are known to be challenging for satellite retrievals: cirrus clouds can be too optically transparent for satellites to detect, while cumulus clouds can be too small to be resolved by the 1-2-km MODIS pixels.
Fig. 5.
Frequency of occurrence for each cloud type reported by S’COOL observers when the CERES algorithm failed to detect any clouds present. Cirrus (and other cirroform) and cumulus clouds are the most frequently missed cloud types.
Assessing the value of opacity reporting
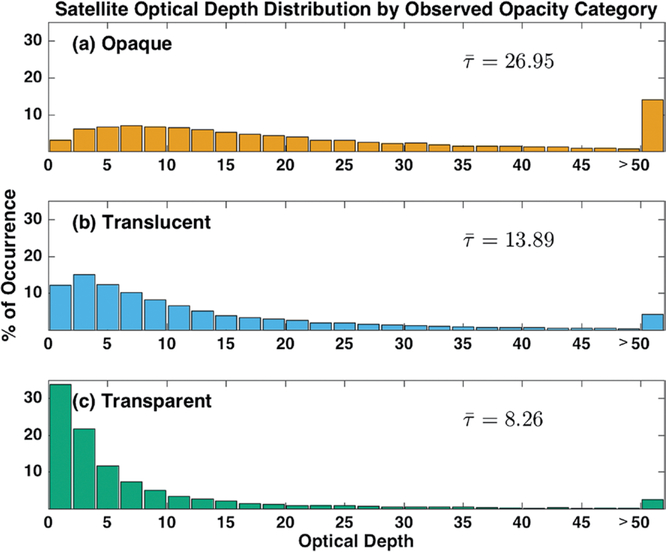
Ground observations of cloud opacity are intended to evaluate the relative accuracy of CERES MODIS cloud optical depth retrievals. Experience has shown this is the most subjective and challenging aspect for ground observers. Many cloud scenes have variable opacity, and it is difficult for a human observer to “take an average” in the way that the satellite does. To assess whether S’COOL observers have skill in this area, Fig. 6 shows histograms representing the frequency of satellite-based optical depth ranges for each of the S’COOL opacity classifications (opaque, translucent, and transparent). Increasing optical depths were retrieved on average, as the reported clouds were increasingly opaque from the S’COOL observer’s perspective. The comparison shown here indicates that the observer reports do have some level of skill.
Fig. 6.
The CERES MODIS optical depth retrieval distribution as a function of the three S’COOL observer cloud opacity categories: (a) opaque, (b) translucent, and (c) transparent. On average, observers are correctly classifying opacity: the mean optical depth () decreases and the peak in percent occurrence shifts toward a lower optical depth value from (a) to (c). The peak at >50 optical depth for the transparent and translucent categories is an artifact of the matching process and does not reflect a deficiency in observer skill.
Using active remote sensing instruments to validate S’COOL observations
One uncertainty in using crowd-sourced observations as a validation data source is of course the accuracy of the observations themselves. We address this by utilizing the CALIPSO lidar and CloudSat radar (Stephens et al. 2002) active remote sensing instruments, launched in 2006, which provide high vertical resolution two-dimensional (time or Earth latitude/longitude versus altitude) profiles of cloud boundaries. Collocated S’COOL and CALIPSO/CloudSat observations are rare (<0.3% of matched pairs) because of the narrow lidar/radar instrument swaths, but when available provide the opportunity to evaluate cloud identification and layering reported from the ground. We developed display software in MATLAB that overlays the CALIPSO/CloudSat 2B-GEOPROF-lidar (herein CCGL) product (Mace and Zhang 2014) with the S’COOL observation information, providing the S’COOL team and potentially S’COOL observers themselves further insight into the strengths and weaknesses of their observations.
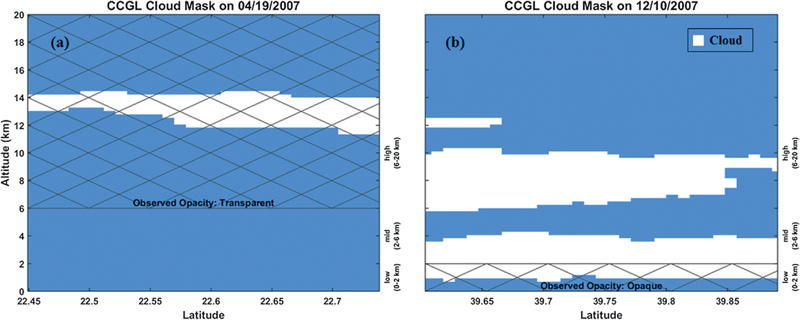
Figure 7 provides examples of these collocated data for two cases that exemplify some of the characteristics of S’COOL observations. For the case in Fig. 7a, the two datasets both agree on the presence of a single high cloud layer, confirming the accuracy of the S’COOL observation. On the other hand, Fig. 7b is a case where the S’COOL observer only observed a single low-level cloud layer, while the CCGL product shows that two higher cloud layers were present. The ground observer reported that the low-level cloud layer was opaque and overcast, indicating that it was too thick to see through, therefore preventing observation of any overlying cloud layers. This situation is not unusual, and the more commonly available passive satellite instruments may not see the low layer in such a case. Ground observations from S’COOL provide a useful complementary view in such a case, providing a more complete understanding of the cloud column.
Fig. 7.
CCGL cloud mask (blue = sky; white = cloud) overlaid with a collocated S’COOL observation. The hatched overlay indicates the cloud height category reported by the S’COOL observer. (a) A case where the S’COOL observer accurately reported a single high cloud layer. (b) A case where the S’COOL observers were unable to see the CCGL-detected cloud layers above the low-level cloud they reported due to the high opacity and overcast coverage of the low-level cloud. Similarly, a passive satellite instrument would see only the top layer.
Only 43 matches with CCGL data products are available so far, preventing any statistically significant analysis of ground observer accuracy at this time. However of these, 6 cases (14%) are similar to Fig. 7b in that low overcast cloud blocked the ground observer’s view of higher clouds. Over a quarter of matches agree on all cloud levels, while about half (23 cases) report a cloud layer below the lowest CCGL layer. This indicates either that CCGL missed some low clouds, or that ground observers have a tendency to underestimate cloud height, or both. Only two cases are in complete disagreement: in one the observer reported clear sky despite extensive cloudiness in CCGL. In the other the ground observer reported high clouds that CCGL did not. The combination of CALIPSO and CloudSat provides the best vertical profile of cloud conditions available, but it is limited in resolution and sampling such that small, isolated clouds can be missed.
Other uses of S’COOL observations
To our knowledge, one researcher outside the CERES team has used S’COOL data (Shiffman 2004). This study was part of a project to develop artificial intelligence approaches to cloud detection. S’COOL data were used as the “gold standard” to assess automatically learned decision trees for detecting clouds from satellite images.
The above analyses validate participant data, showing high value in cloud occurrence reporting and moderate value in ground reports of cloud opacity. While data are limited, they also demonstrate that cloud height reports from ground observers have value, despite a possible tendency for underestimation. This shows that crowd-sourced data can fill a gap in validation of satellite cloud retrievals. S’COOL has provided a robust scientific-quality dataset not otherwise available for CERES science.
DISCUSSION: CONSIDERATIONS FOR SUCCESS
S’COOL’s success in collecting useful validation data depends in part on a well-designed observation protocol grounded in a thorough understanding of cloud properties and cloud retrieval. More significant, however, is the large number of participants and their ongoing commitment, reflected in Fig. 3, to contributing data that will be of value to NASA’s scientific community. (See sidebar for an update on students from the previous study.) Our experiences suggest several key considerations for other programs that may be interested in collecting data by involving members of the public.
S’COOL gains the benefit of insights into satellite data products only when participants’ needs are met: motivating and retaining participants depends on continuous improvement. Experience and evaluation findings confirm that S’COOL’s success is driven by its dual commitments to science and the participant experience, primarily in an educational setting. An external evaluation by the Bach Center for Evaluation and Research (2006) identified S’COOL’s potential and achievements as an effective classroom instructional activity, embodying science, technology, engineering, and math (STEM) practices while emphasizing and developing twenty-first century skills. This suggested that for classroom-based observers—our most dedicated, as shown by the gray bars in Fig. 3—it is critical for S’COOL to model strong instructional practices that teachers look for in a project.
More recently, the S’COOL team conducted a follow-up project evaluation focused on the experience of participants, primarily K-12 classroom educators (Martin and McCrea 2015). Educators find that S’COOL’s setup and resources meet their classroom needs (related to standards, curriculum, and performance assessment) and help to interest their students in the processes of science. Students are highly driven and motivated to participate because they are able to contribute to NASA and fill an unmet need through their ground observations. Educators identified a variety of skills and competencies related to the scientific process that S’COOL participation can help develop, from careful observation and detailed recording, to critical thinking, to cloud identification and classification. Additionally, because the S’COOL team is accessible and highly responsive, educators are able to get quick answers when needed to support S’COOL’s classroom impact. S’COOL’s new GEO option also meets a frequently cited need of educators, who often had trouble reconciling their daily class schedules with the limited and varying CERES overpass times. Through ongoing feedback from educators, S’COOL has learned to adapt to the realities and constraints of K-12 classrooms, while still maintaining a science-driven data collection program.
In an environment where opportunities to crowd source data are proliferating, additional considerations arise related to convenience, ease of use, and confusion that participants may encounter. S’COOL is addressing these concerns by turning to collaborators and partners to expand our participation base in a way that minimizes additional burden to S’COOL observers. In the next 6 months, S’COOL will be integrated into the Global Learning and Observations to Benefit the Environment (GLOBE) Program (www.globe.gov). GLOBE has also engaged schools in cloud observations since the mid-1990s, but without the tie to synchronous/collocated satellite remote sensing. This larger platform will enable NASA to engage a broader community in this authentic science experience and will offer a one-stop experience for participants. The GLOBE community will benefit from the ability to compare to satellite data. We have also worked with GLOBE to design and develop a GLOBE Observer app for mobile devices (www.globe.gov/globe-data/data-entry/globe-observer), which makes it even simpler for people to observe and report on clouds anytime and anywhere.
Our experiences suggest that responsiveness to the interests and needs of participants plays a critical role in collecting a large, high-quality dataset that, in turn, meets the interests and needs of the scientific community. NASA’s CERES S’COOL Project has grown up through two decades of advancements in technology, evolution of understandings in science literacy, and the blossoming of information technology mediated citizen involvement in the scientific enterprise. In the process, S’COOL observers have successfully produced a scientifically valid dataset that addresses challenges in satellite cloud retrievals. Today the project serves as an exemplar of an authentic STEM experience that is open to all.
WHERE ARE THEY NOW? UPDATE ON STUDENTS FROM THE 2003 BAMS COVER.
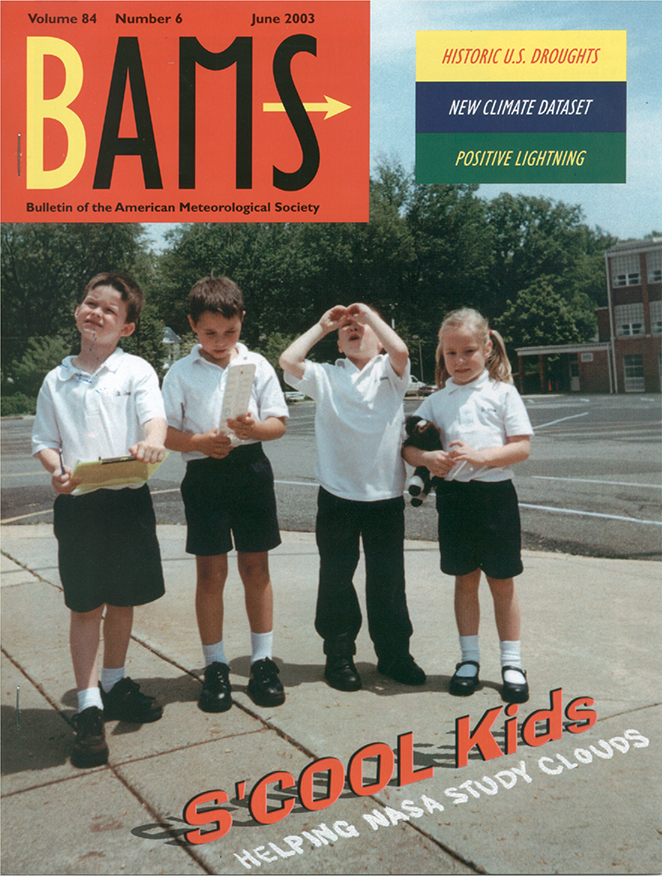
While writing this update, we reached out to Saint James School to see whether we could track down the students featured on the cover and find out what impact S’COOL participation had on them. We were able to connect with two of them (now age 19) and ask a series of questions. Table SBI contains some of their edited responses.
Fig. SB1.
The cover of the Jun 2003 issue of BAMS [containing Chambers et al. (2003)] featured four very young S’COOL participants: kindergarten students at Saint James School in Falls Church, Virginia.
Table SBI.
Update from two of the four kindergarten students, now aged 19, featured on the BAMS cover for the Chambers et al. (2003) article.
| Do you remember participating? | I remember parts of the program vividly. I remember doing the observations looking at the clouds. To this day I maintain a good knowledge of cloud types from that experience back in kindergarten. The satellite overpass times were variable, so the observations occurred at many different times during the school day. I also remember taking the picture, it was haphazard. I mimed holding binoculars for the picture. Yes, the science department gave me many great opportunities at St. James, and this was one that stood out. |
| Did it have any impact? | It helped me get interested in extracurricular science programs. For example, I participated in the Team American Rocket Challenge for 5 years. I went to national finals with this project once. Then I participated in the NASA Student Launch Initiative for 2 years and had successful operations/flights each year. In high school (2015), I worked in meteorology, measuring thermal lift in microclimates for a school science project which won first place at regional finals, and went to Virginia State Science Fair finals. It was definitely something to remember. |
| Are you interested in a science-related field now? | I have broad interests including science/technology and human systems. No. |
| Did this have any impact on classmates? | When we were doing the project, everyone seemed interested and engaged. It is hard to tell, but I am sure it made an impact on some. I have many friends pursuing science-related degrees. |
| What are you doing now? | I am hoping to pursue an internship with NASA headquarters for my gap year before college. ROTC and studying business. |
ACKNOWLEDGMENTS
Funding for S’COOL has been provided by NASA’s Earth Science Division and through the CERES Project. We thank Douglas Spangenberg for his assistance with integrating GEO cloud retrieval data within the S’COOL Project using the University of Wisconsin-Madison Space Science and Engineering Center’s McIDAS software.
Footnotes
The data in this paper are the result of the efforts of the S’COOL educator, student, and Rover volunteers, without whom none of this work would be possible. Their efforts are individually recognized in this downloadable Google Earth file: https://scool.larc.nasa.gov/google/All_SCOOLs.kml.
Contributor Information
LIN H. CHAMBERS, NASA Langley Research Center, Hampton, Virginia.
MEGAN A. MCKEOWN, Texas A&M, College Station, Texas
TINA M. ROGERSON, Science Systems and Applications, Inc., Hampton, Virginia
KRISTOPHER M. BEDKA, NASA Langley Research Center, Hampton, Virginia.
REFERENCES
- Bach Center for Evaluation and Research, 2006: Evaluation of the CERES S’COOL Project. Internal Evaluation Rep., 31 pp. [Available online at http://scool.larc.nasa.gov/pdf/scoolevaluation-1.pdf.] [Google Scholar]
- Chambers LH, Young DF, Costulis PK, Detweiler PT, Stoddard DB, Sepulveda R, Watkins JD, and Falcone A, 2003: The CERES S’COOL Project. Bull. Amer. Meteor. Soc, 84, 759–765, doi: 10.1175/BAMS-84-6-759. [DOI] [Google Scholar]
- Stoddard DB, Costulis PK, and Young DF, 2004: Students as ground observers for satellite cloud retrieval validation. 13th Conf. on Satellite Meteorology and Oceanography, Norfolk, VA, Amer. Meteor. Soc, 62 [Available online at https://ams.confex.com/ams/13SATMET/techprogram/paper_78967.htm.] [Google Scholar]
- Kennedy TJ, and Henderson S, 2003: The GLOBE Program: Bringing together students, teachers and scientists to increase scientific understanding of the Earth through research. Child. Youth Environ, 13, 217–227. [Google Scholar]
- Kratz DP, Stackhouse PW Jr., Gupta SK, Wilber AC, Sawaengphokhai P, and McGarragh GR, 2014: The Fast Longwave and Shortwave Flux (FLASHFlux) data product: Single scanner footprint fluxes. J. Appl. Meteor. Climatol, 53, 1059–1079, doi: 10.1175/JAMC-D-13-061.1. [DOI] [Google Scholar]
- Lewis ER, and Teixeira J, 2015: Dispelling clouds of uncertainty. Eos, 96, doi: 10.1029/2015EO031303. [DOI] [Google Scholar]
- Lintott CJ, and Coauthors, 2008: Galaxy Zoo: Morphologies derived from visual inspection of galaxies from the Sloan Digital Sky Survey. Mon. Not. Roy. Astron. Soc, 389, 1179–1189, doi: 10.1111/j.1365-2966.2008.13689.x. [DOI] [Google Scholar]
- Loeb NG, Wielicki BA, Doelling DR, Smith GL, Keyes DF, Kato S, Manalo-Smith N, and Wong T, 2009: Toward optimal closure of the earth’s top-of-atmosphere radiation budget. J. Climate, 22, 748–766, doi: 10.1175/2008JCLI2637.1. [DOI] [Google Scholar]
- Mace GG, and Zhang Q, 2014: The CloudSat radar-lidar geometrical profile product (RL-GeoProf): Updates, improvements, and selected results. J. Geophys. Res. Atmos, 119, 9441–9462, doi: 10.1002/2013JD021374. [DOI] [Google Scholar]
- Martin AM, and McCrea S, 2015: S’COOL user experience evaluation. Internal Evaluation Rep., 14 pp. [Available online at http://scool.larc.nasa.gov/pdf/2015_SCOOL_User_Experience_Evaluation_FINAL_1_16.pdf.] [Google Scholar]
- Minnis P, 1989: Viewing zenith angle dependence of cloudiness determined from coincident GOES East and GOES West data. J. Geophys. Res, 94, 2303–2320, doi: 10.1029/JD094iD02p02303. [DOI] [Google Scholar]
- Minnis P, Yost CR, Sun-Mack S, and Chen Y, 2008: Estimating the top altitude of optically thick ice clouds from thermal infrared satellite observations using CALIPSO data. Geophys. Res. Lett, 35, L12801, doi: 10.1029/2008GL033947. [DOI] [Google Scholar]
- Minnis P, and Coauthors, 2011: CERES Edition-2 cloud property retrievals using TRMM VIRS and Terra and Aqua MODIS data—Part I: Algorithms. IEEE Trans. Geosci. Remote Sens, 49, 4374–4400, doi: 10.1109/TGRS.2011.2144601. [DOI] [Google Scholar]
- Shiffman S, 2004: Cloud detection from satellite imagery: A comparison of expert-generated and automatically-generated decision trees. NASA Tech Doc., 5 pp. [Available online at https://ti.arc.nasa.gov/m/pub-archive/917h/0917%20(Shiffman).pdf.] [Google Scholar]
- Smith WL Jr., Minnis P, Finney H, Palikonda R, and Khaiyer MM, 2008: An evaluation of operational GOES-derived single-layer cloud top heights with ARSCL data over the ARM Southern Great Plains site. Geophys. Res. Lett, 35, L13820, doi: 10.1029/2008GL034275. [DOI] [Google Scholar]
- Stephens GL, and Coauthors, 2002: The CloudSat mission and the A-Train: A new dimension of space-based observations of clouds and precipitation. Bull. Amer. Meteor. Soc, 83, 1771–1790, doi: 10.1175/BAMS-83-12-1771. [DOI] [Google Scholar]
- Várnai T, and Marshak A, 2007: View angle dependence of cloud optical thicknesses retrieved by Moderate Resolution Imaging Spectroradiometer (MODIS). J. Geophys. Res, 112, D06203, doi: 10.1029/2005JD006912. [DOI] [Google Scholar]
- Wielicki BA, Barkstrom BR, Harrison EF, Lee RB, Smith GL, and Cooper JE, 1996: Clouds and the Earth’s Radiant Energy System (CERES): An Earth Observing System experiment. Bull. Amer. Meteor. Soc, 77, 853–868, doi:. [DOI] [Google Scholar]
- Willett KW, and Coauthors, 2013: Galaxy Zoo 2: Detailed morphological classifications for 304 122 galaxies from the Sloan Digital Sky Survey. Mon. Not. Roy. Astron. Soc, 435, 2835–2860, doi: 10.1093/mnras/stt1458. [DOI] [Google Scholar]


