Abstract
In this study, an approach has been developed for differentiating between local and remote pollution over Taiwan, based on homogeneity perspective (variations of the standard deviation) of both AERONET measurements and NASA MERRA aerosol reanalysis (version 2, MERRA-2) over a 15-year period (2002 – 2017). The analysis of seasonal variations of the standard deviation of aerosol optical depth (AOD) measurements at six AERONET sites and MERRA AOD data in Taiwan showed that, in spring when remote aerosols dominate, the standard deviation is almost three times lower than that in autumn, when aerosols from local sources dominate. This finding was supported by MERRA AOD over the open ocean area: total AOD data were used to differentiate between local and remote pollution over both Taiwan and the open ocean area in the vicinity of Taiwan. Over Taiwan, MERRA total AOD showed a primary maximum in spring and a secondary one in autumn. Over the open ocean area, where there are no local sources of anthropogenic aerosols, MERRA total AOD showed only one maximum in spring and no maximum in autumn. This suggests that, in Taiwan, the maximum in autumn is attributed to local air pollution, while the pronounced maximum in spring is mainly caused by air pollution from continental Asia. The analyses of spatial distribution of 15-year monthly mean MERRA winds confirmed the above-mentioned results. Furthermore, similar to total AOD, MERRA sulfate AOD peaked in autumn over Taiwan, but not over the oceanic area: this indicates the contribution of local emissions of anthropogenic aerosols from the industrial sector. The standard deviation of MERRA sulfate AOD in spring is two-three times lower than the standard deviation in autumn: this is additional evidence that, in spring, sulfate aerosols from remote sources are predominant; while in autumn sulfate aerosols from local sources dominate.
Keywords: Local pollution, Remote pollution, AERONET, MERRA aerosol reanalysis, MERRA-2, Taiwan
INTRODUCTION
Aerosols are an important factor in the atmospheric hydrological cycle and radiation budget, affecting cloud formation, precipitation processes, and climate, including atmospheric processes and climate in the area of Taiwan (Tu and Chou, 2013). Regional air quality is influenced by air pollution from local and remote sources. Differentiating between local and remote pollution is essential to the understanding of their effects. This topic of differentiation between local and remote pollution of similar chemical composition and optical properties was investigated mainly by using the modeling approach (e.g. Bollasina et al., 2014, Cowan and Cai, 2011, Kishcha et al., 2016).
Taiwan is a suitable region for the exploration of this topic. This is because this region is characterized by significant intrusions of anthropogenic aerosols (including emissions of biomass burning) transported from Indochina, on the one hand, and by pollution from local industrial and transportation activities (Chen et al., 1999, Lin et al., 2005, Yen et al., 2013, Provensal at al., 2017, Wang et al., 2016). During certain periods or days in spring, Taiwan is also impacted by the advection of dust originating from the Gobi desert (Chen et al., 2004, Lin et al., 2007, Wang et al., 2012). Sea salt aerosols, which come from the surrounding sea areas, noticeably contribute to air quality in this island (Li et al., 2016).
Taking into account the above-mentioned significant intrusions of air pollution from remote sources into the Taiwan region as well as the presence of local pollution, it is reasonable to suggest that the air pollution in Taiwan seasonally changes in view of differences in its origin. In the current study, an approach based on homogeneity perspective has been developed to differentiate between local and remote pollution contributing to seasonal variations of aerosol content over Taiwan. This was carried out using 15-year (from July 2002 to June 2017) aerosol optical depth (AOD) measurements from the local network of AERONET sunphotometer stations, as well as AOD data from NASA MERRA aerosol reanalysis (version 2, MERRA-2) based on the up-to-date GEOS-5 model with aerosol data assimilation.
METHODOLOGY AND DATA
Method
As mentioned, in order to differentiate between contributions from local and remote pollution to seasonal variations, we used AERONET AOD monthly data from six monitoring sunphotometer stations located in Taiwan (Table 1 and Fig. 1) together with AOD data from NASA MERRA aerosol reanalysis (version 2, MERRA-2). Level 2.0 version of AERONET data (calibrated and screened for clouds) at a standard wavelength of 500 nm was used to analyze seasonal variations of both AERONET AOD and its standard deviation as a measure of AOD homogeneity. Furthermore, we analyzed seasonal variations of monthly AOD data from the NASA MERRA aerosol reanalysis over the Taiwan area (22N – 25.5N; 120E – 122E) and those over the open ocean area in the vicinity of Taiwan (25.5N – 29N; 122.5E – 124.5E).
Table 1.
Geographical coordinates of the AERONET monitoring sites and their periods of measurements.
| Monitoring site | Geographical coordinates (degrees) | Elevation (m.a.s.l.) | Years of measurements |
|---|---|---|---|
| Low elevated sites: | |||
| Taipei_CWB | 25.02oN; 121.50oE | 26 | 2002 – 2016 |
| EPA_NCU | 24.97oN; 121.18oE | 144 | 2006 – 2016 |
| NCU_Taiwan | 24.97oN; 121.18oE | 171 | 2002 – 2013 |
| Chiayi | 23.48oN; 120.48oE | 27 | 2013 – 2017 |
| Cheng-Kung_Univ | 23.00oN; 120.22oE | 50 | 2002 – 2016 |
| High elevated site | |||
| Lulin | 23.47oN; 120.87oE | 2868 | 2006 – 2016 |
Fig. 1.
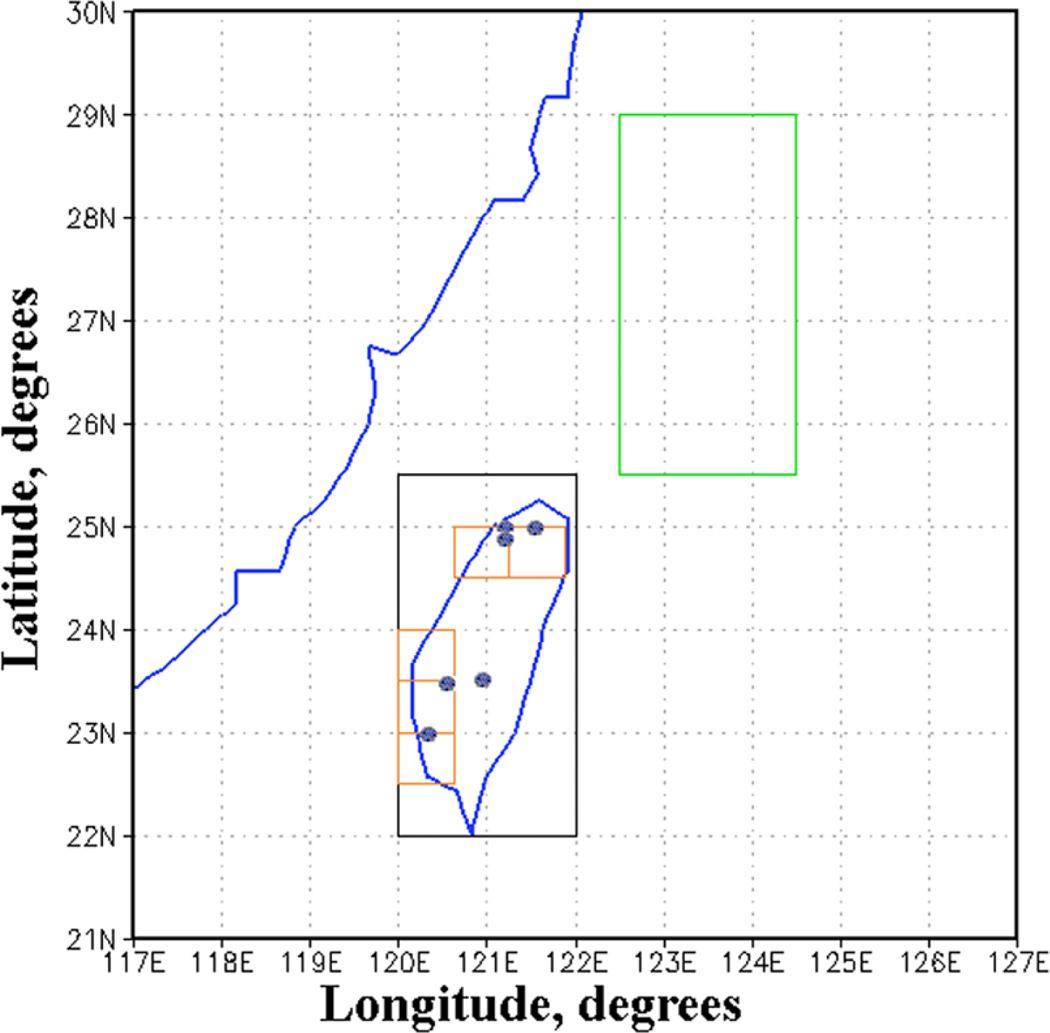
Map of the region under study. The black box shows the Taiwan area (22.0N – 25.5N; 120E – 122E), and the green box shows the open ocean area in the vicinity of Taiwan (25.5N – 29N; 122.5E – 124.5E). The circles designate the location of AERONET monitoring sites (Table 1). The five small orange boxes (of 0.5o latitude by 0.625o longitude each) are the GEOS-5 model grid boxes located close to the low-elevated AERONET monitoring sites.
MERRA AOD data during the 15-year period under consideration were used to analyze the spatial distribution of various aerosol species over Taiwan and surrounding areas, as well as their contribution to total AOD. To differentiate between local and remote sulfate aerosols of similar chemical composition and optical properties, we analyzed seasonal variations of MERRA sulfate AOD (and its standard deviation as a measure of AOD homogeneity) using sulfate AOD values averaged separately over five GEOS-5 model grid boxes (0.5o latitude by 0.625o longitude each). These boxes were located close to the low-elevated AERONET monitoring sites (Fig. 1, the orange boxes).
Analyses of atmospheric dynamics are essential to support our findings based on both AERONET AOD measurements and reanalysis data. To this end, spatial distributions of 15-year monthly mean MERRA wind vectors in the 700 – 800 hPa layer were analyzed.
MERRA aerosol reanalysis (version 2, MERRA-2)
The NASA Goddard Earth Observing System (GEOS) Model, Version 5, GEOS-5 model is the latest version of the NASA Global Modeling and Assimilation Office (GMAO) Earth system model (Randles et al., 2017, Buchard et al., 2017). GEOS-5 contains components for simulating atmospheric circulation and composition (including atmospheric data assimilation), ocean circulation and biogeochemistry, and land surface processes. Moreover, GEOS-5 includes a module representing atmospheric aerosols (Colarco et al., 2010). This aerosol module is based on a version of the Goddard Chemistry, Aerosol, Radiation and Transport (GOCART) model (Chin et al., 2002), which includes production, transport, and loss processes for the five aerosol species such as desert dust, sulfate, sea salt, black and organic carbon. Interaction between the aerosol species is not included in the model. Both dust and sea salt have wind speed dependent emission functions, while sulfate and carbonaceous species have emissions principally from fossil fuel combustion, biomass burning and bio-fuel consumption, with additional biogenic sources of organic carbon. The sulfate and carbonaceous aerosol emissions used in the GEOS-5 model were derived from a variety of inventories, which were described by Randles et al. (2017, their Table 1). Loss processes for all aerosols include dry and wet deposition, and convective scavenging.
The GEOS-5 model simulates the concentration of the above-mentioned five aerosol species all over the world with a grid spacing of 0.5o latitude by 0.625o longitude. It also includes assimilation of AOD observations from the MODIS sensor on both NASA Terra and Aqua satellites; bias-corrected AOD from the Advanced Very High Resolution Radiometer (AVHRR) instruments; AOD retrievals from the Multiangle Imaging SpectroRadiometer (MISR) over bright surfaces, and ground-based Aerosol Robotic Network (AERONET) direct measurements of AOD (Randles et al., 2017). The outputs of GEOS-5 model runs from 1980 until the present were used to extend the NASA MERRA reanalysis database to its version 2 (aka MERRA-2) which includes AOD of sulfates, organic carbon, black carbon, mineral dust and sea salt. Note that the MERRA AOD data of various aerosol species are not based on direct observations of those species: these data are based on the above mentioned GEOS-5 model runs. AOD data from MERRA-2 were evaluated and validated by Randles et al. (2017) and Buchard et al. (2017). In the current study, we used the 15-year (from July 2002 to June 2017) monthly AOD dataset from MERRA-2. During this specified period, AOD measurements from the MODIS sensor on board the Aqua and Terra satellites as well as AOD measurements from the MISR sensor were regularly available for data assimilation in GEOS-5.
RESULTS
Spatial distribution of 15-year mean MERRA AOD of various aerosol species
MERRA aerosol reanalysis allowed us to analyze the spatial distribution of various aerosol species over Taiwan and surrounding areas. First, we analyzed a spatial distribution of MERRA total AOD. The obtained spatial distribution of 15-year mean reanalysis total AOD showed that, because of the proximity of Taiwan to continental Asia, this area is characterized by a significant level of air pollution (Fig. 2). Consequently, a large part of air pollution over Taiwan has anthropogenic origin being caused by industrial, agricultural and transportation activities in continental Asia. As mentioned in the Introduction, previous studies showed that anthropogenic aerosols are frequently transported by synoptic wind systems towards Taiwan (Chen et al., 1999, Lin et al., 2005, Provensal at al., 2017, Wang et al., 2016).
Fig. 2.
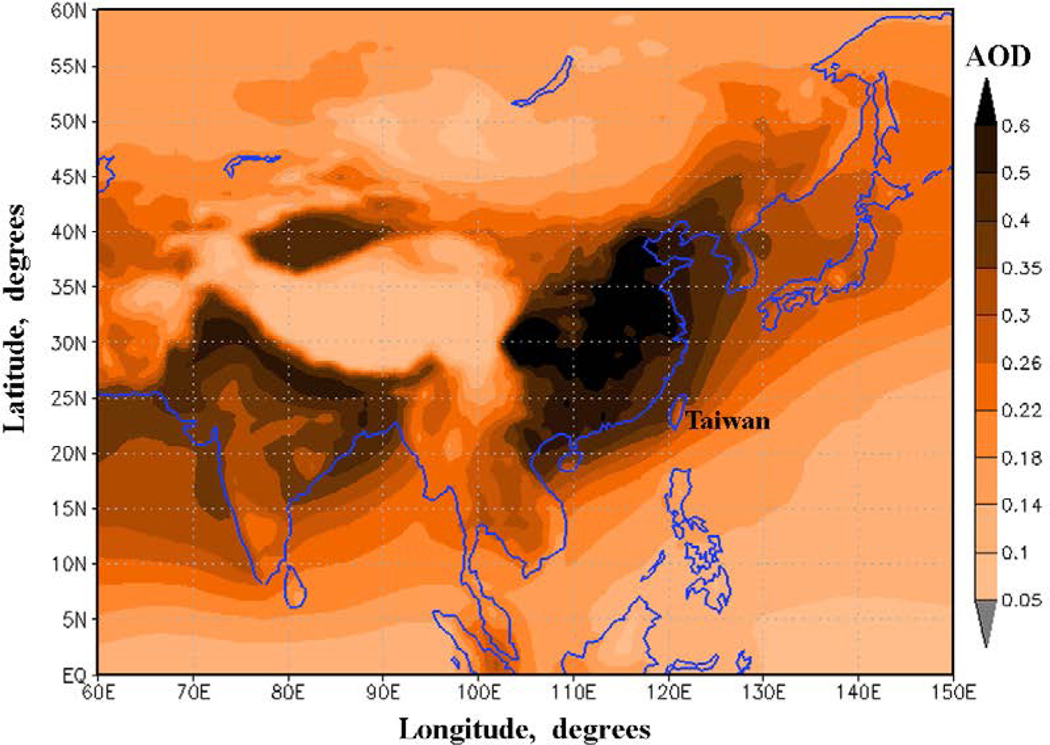
Spatial distribution of 15-year mean total AOD based on NASA MERRA aerosol reanalysis data (2002 – 2017).
Then we analyzed the contribution of three major air pollutants contributing to total AOD using MERRA AOD data. As illustrated in Fig. 3a, sulfates are the major contributor to total AOD over Taiwan: they are responsible for 59% of the 15-year mean MERRA total AOD. In all seasons, sulfates remain the major contributor to total AOD over Taiwan (Fig. 4). With respect to organic and black carbon AOD, the spatial distribution of AOD shows that carbonaceous aerosols are the second largest contributor to the air pollution, responsible for 18% of the 15-year mean MERRA total AOD (Fig. 3b). Carbonaceous aerosols reveal significant seasonal variations with a maximum in spring, with respect to their contribution to total AOD over Taiwan (Fig. 4). With respect to desert dust, reanalysis data showed that the Pacific Ocean and Taiwan in particular, was almost free from dust, on average during the whole 15-year period under study (Fig. 3c). During the spring season, the boundary of the dusty area is located close to Taiwan, while in winter, summer and autumn, Taiwan is usually unaffected by desert dust (Fig. 4). As mentioned in the Introduction, during certain periods or days in spring, Taiwan is impacted by the advection of dust (Chen et al., 2004, Lin et al., 2007, Wang et al., 2012). However, such short dusty periods cannot be revealed from Figs. 3c and 4. In the current study, we do not provide analysis of daily datasets, but a mean situation for a long-term (15-year) time period.
Fig. 3.
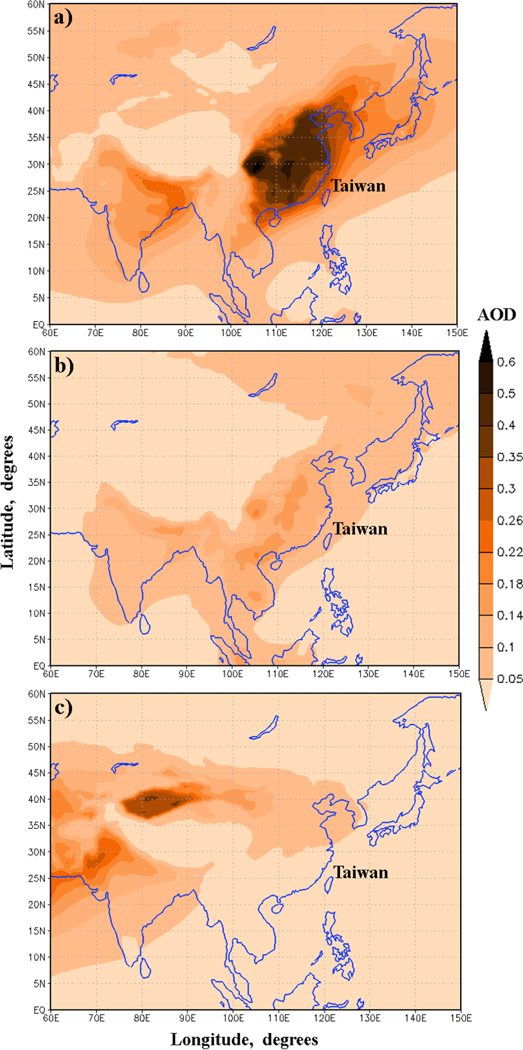
Spatial distribution of 15-year mean MERRA AOD of (a) sulfate aerosols, (b) organic and black carbon, and (c) desert dust aerosols.
Fig. 4.
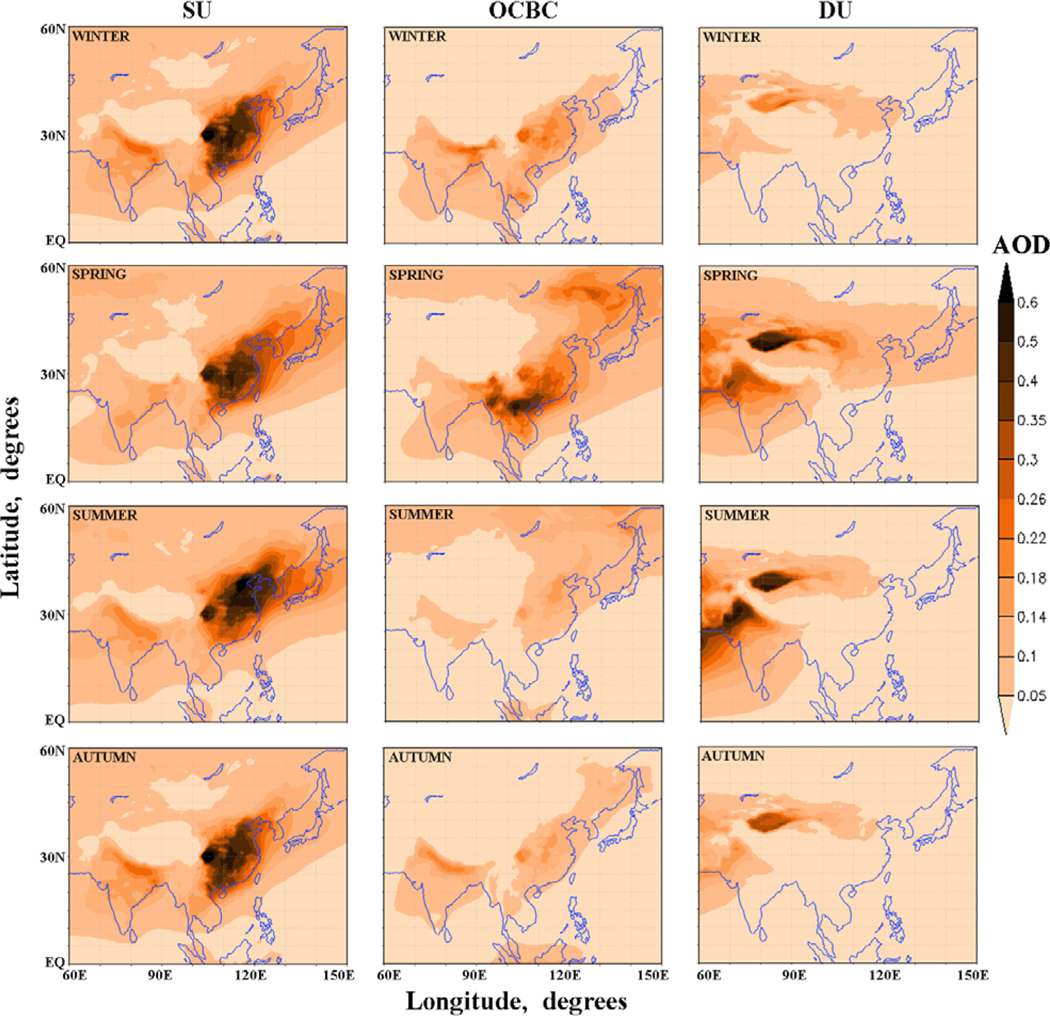
Spatial distribution of 15-year seasonal mean MERRA AOD of sulfate aerosols (SU, left column), organic and black carbon (OCBC, central column), and desert dust aerosols (DU, right column) in winter, spring, summer and autumn.
Distinguishing between local and remote pollution in Taiwan
Figure 5 represents seasonal variations of total AOD based on the AERONET network of sun photometer measurements in Taiwan, over the 15-year period under study. One can see seasonal variations with the primary maximum in the spring season (March - April) and the secondary (less pronounced) maximum in the autumn season (September – October). AOD from the low-elevated AERONET monitoring sites (AERONET-L in Fig. 5) is significantly higher than AOD from the high-elevated site in Lulin (AERONET-H). This indicates that, around the year, the main part of air pollution in Taiwan is vertically distributed below 2800 m a.s.l.. Note that the AOD measurements at the high-elevated site in Lulin showed only AOD maximum in spring but no noticeable maximum in autumn (Fig. 5). The MERRA Total AOD was capable of reproducing each of the two maxima in spring and autumn. Averaged over both the high and low elevated parts of the Taiwan area, the MERRA AOD is located between AERONET-L and AERONET-H, indicating reasonable correspondence between MERRA AOD and AERONET AOD measurements (Fig. 5).
Fig. 5.
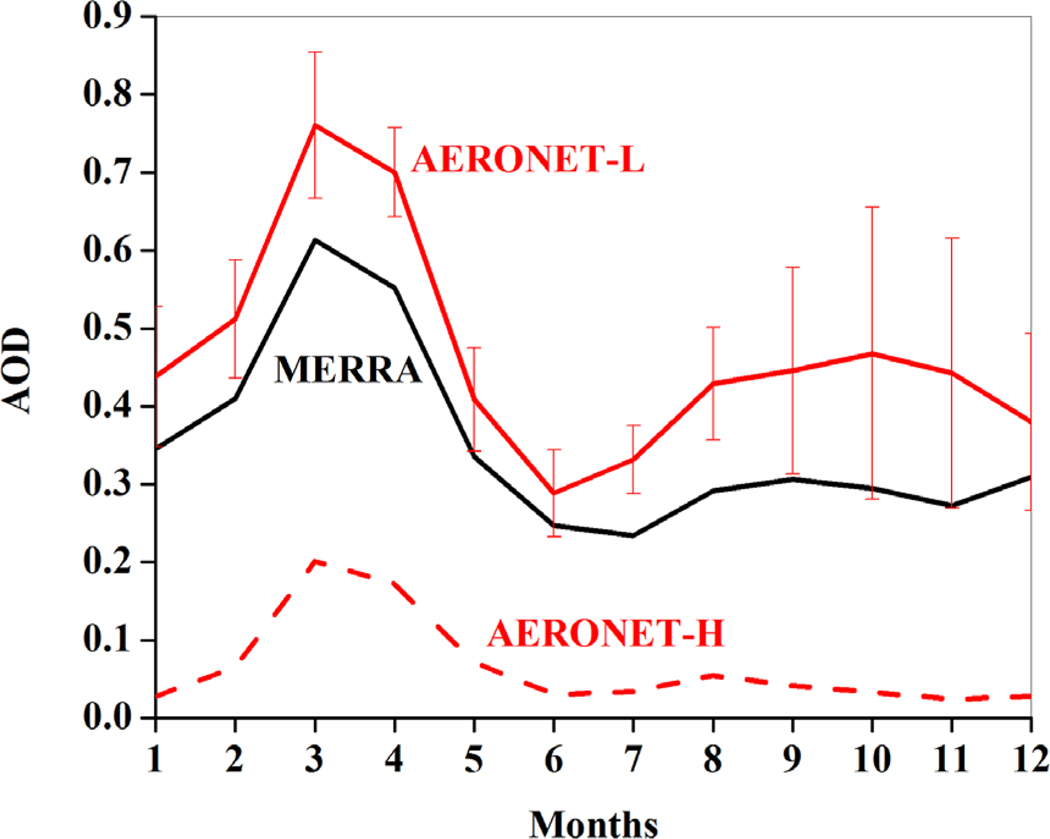
Comparison of monthly mean variations of aerosol optical depth (AOD) between AERONET sun photometer measurements and NASA MERRA total AOD in Taiwan (22N – 22.5N; 120E – 122E) over the 15-year period (2002 – 2017). AERONET-L represents AOD averaged over the five low-elevated AERONET monitoring sites (Table 1), and AERONETH represents AOD from the high-elevated Lulin site. The red vertical lines designate the standard deviation of AOD from the five low-elevated sites.
We analyzed month-to-month variations of the standard deviation of AERONET AOD data (in percentage to average AOD) from the five low-elevated monitoring sites (Fig. 6). The standard deviation of AERONET measurements is the measure of their variability. This graph clearly shows that, in spring (March – April), the standard deviation is almost three times lower than that in autumn (October). Based on these variations of standard deviation of AERONET measurements, it is reasonable to suggest that, in the case of predominant aerosols originating from remote sources, these aerosols should be more evenly distributed over Taiwan than local aerosols. Consequently, in the case of predominant remote aerosols, the variability of AERONET AOD measurements taken at different sites in Taiwan should be relatively low. By contrast, in the case of predominant aerosols originating from some local sources in Taiwan, the variability of AERONET measurements taken at different sites in Taiwan should be relatively high. Thus, our finding that the standard deviation in spring is almost three times lower than the standard deviation in autumn (Fig. 6) indicates that, in spring, aerosols from remote sources are predominant; while, in autumn, aerosols from local sources dominate.
Fig. 6.
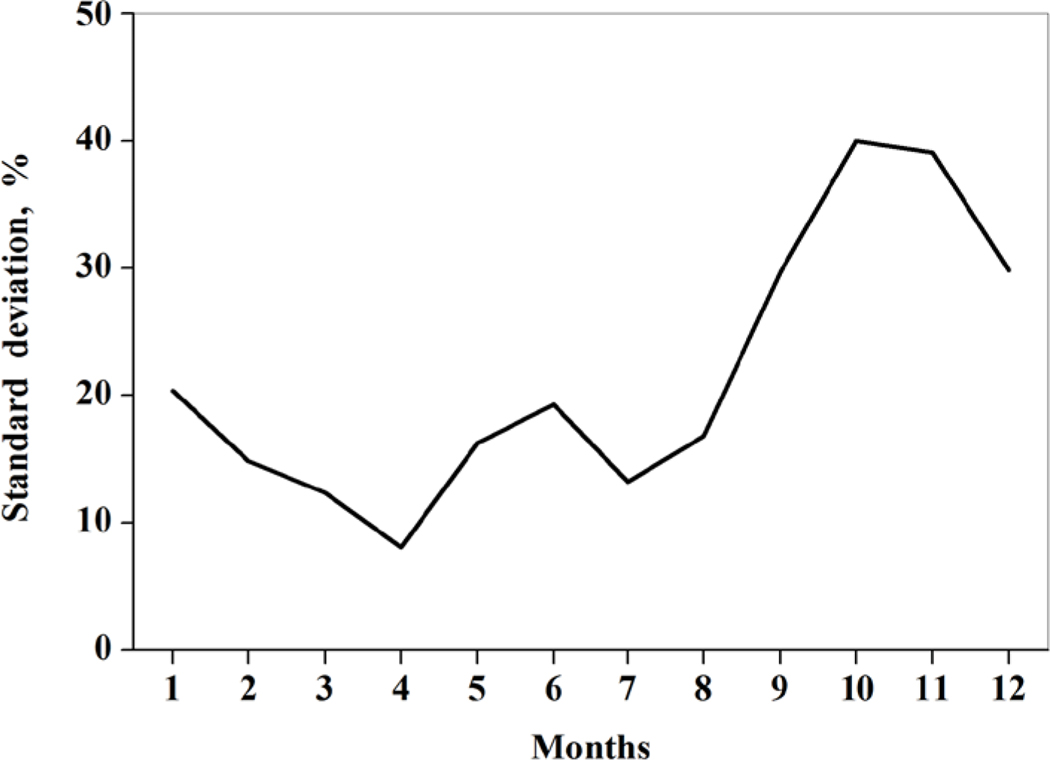
Monthly mean variations of the standard deviation of AERONET AOD data (in percentage to average AOD) from the five low-elevated monitoring sites.
This finding is supported by the analysis of spatial distributions of 15-year monthly mean MERRA wind vectors in the 700 – 800 hPa layer (Fig. 7). The 700–800 hPa layer is considered as indicative of wind in the lower troposphere, where aerosol transport mainly occurs (Yu et al., 2008, Guo et al., 2017, Kishcha et al., 2014). One can see that, in the spring season (March), prevailing strong west and south-west winds blow mainly from land to sea, causing transport of anthropogenic air pollution (including biomass burning) from its sources in continental Asia towards Taiwan (Fig. 7a). Therefore, in spring, aerosols from remote sources are likely to be predominant. By contrast, in autumn (October), weak east winds are observed over Taiwan, indicating insignificant transport of continental air pollution towards Taiwan (Fig. 7b). Therefore, in autumn, aerosols from local sources are likely to dominate.
Fig. 7.
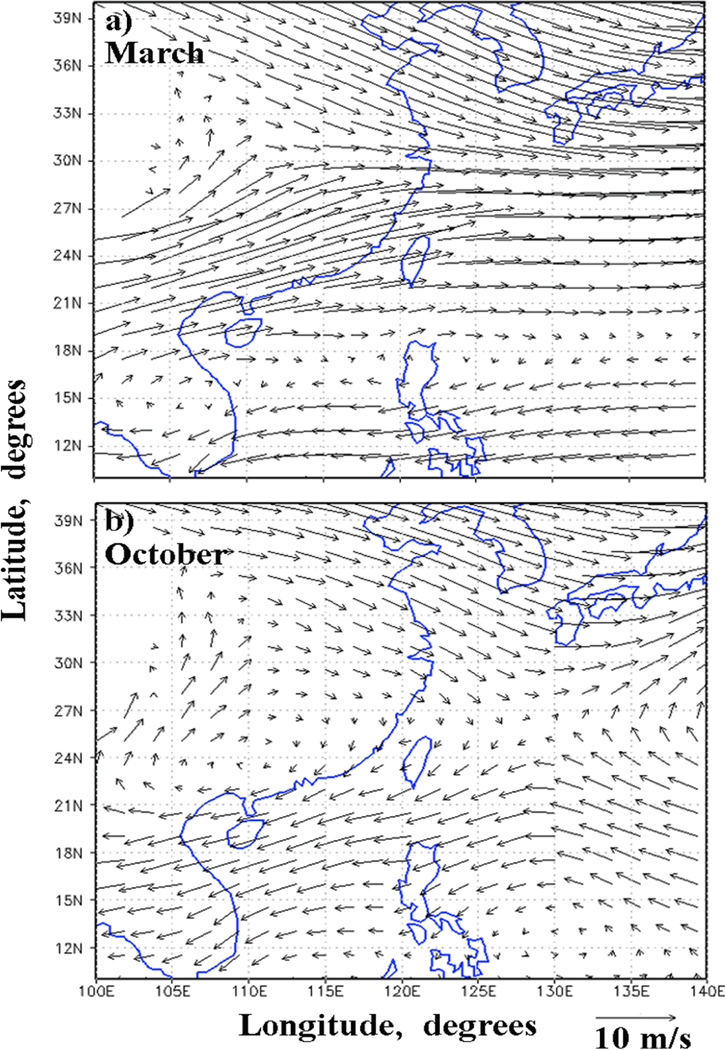
Spatial distribution of 15-year mean MERRA wind vectors in the 700 – 800 hPa layer in (a) March, and (b) October.
Moreover, our finding (about the origin of the AOD maxima in spring and autumn) is also supported by the analysis of seasonal variations of MERRA total AOD over the open ocean area in the vicinity of Taiwan, where there are no local sources of anthropogenic aerosols (25.5N – 29N; 122.5E – 124.5E) (Fig. 1). This open ocean area and the Taiwan area (22.0N – 25.5N; 120E – 122E) are equally distant from the coast of continental Asia (Fig. 1). A comparison of seasonal variations of 15-year mean MERRA total AOD over these two areas showed that, over the open ocean area, there is no maximum in the autumn season but only one maximum in the spring season (Fig. 8 a and b). The absence of the AOD maximum in autumn over the open ocean area and its presence over Taiwan (in accordance with both MERRA AOD and AERONET measurements (Fig. 8a)) is evidence of the local origin of this AOD maximum in autumn. The presence of the AOD maximum in spring over both the open ocean area and the Taiwan area (in accordance with MERRA AOD) is evidence of the remote origin of the AOD maximum in spring. Thus, our approach allowed us to differentiate between local and remote pollution contributing to the seasonal variation in total AOD over Taiwan.
Fig. 8.
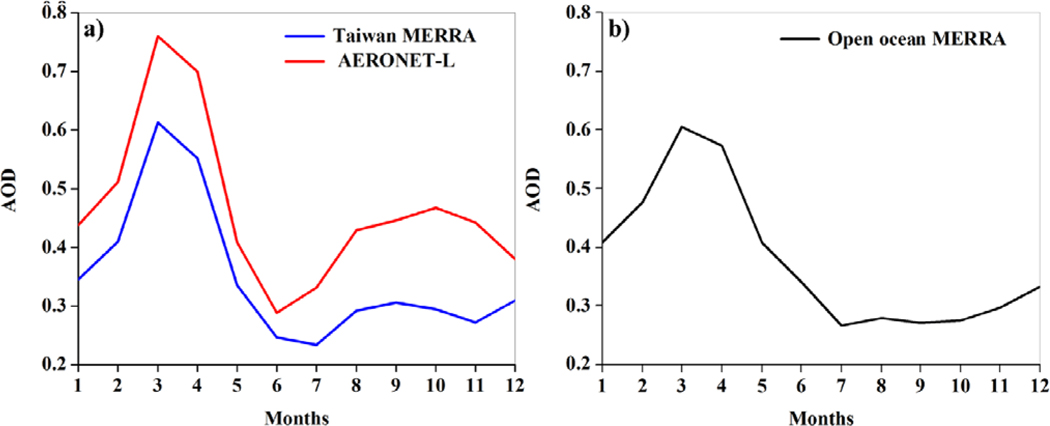
Comparison of monthly mean variations of MERRA total AOD over (a) Taiwan (22.0N – 25.5N; 120E – 122E) and over (b) the open sea area in the vicinity of Taiwan (25.5N – 29N; 122.5E – 124.5E), over the 15-year period (2002 – 2017). AERONET-L represents AOD averaged over the five low-elevated AERONET monitoring sites.
The fact that AOD measurements at the high-elevated site in Lulin showed the AOD maximum in spring (Fig. 5) is a clear indication that aerosols from remote sources can be transported at altitudes above 2800 m. Furthermore, the absence of noticeable AOD maximum in autumn at this site is an indication that aerosols from local sources are vertically distributed below 2800 m.
Local and remote sulfate pollutants in Taiwan
MERRA aerosol reanalysis allowed us to examine separately AOD of various aerosol species over both Taiwan and the open ocean area. In accordance with MERRA AOD, during the spring season, sulfate and carbonaceous aerosols are two major contributors to total AOD (Fig. 9 a and b). The transport of these anthropogenic aerosols from South East Asia towards Taiwan in spring was studied by Lin et al. (2013). They discussed the climatology and main atmospheric flow patterns controlling this transport.
Fig. 9.
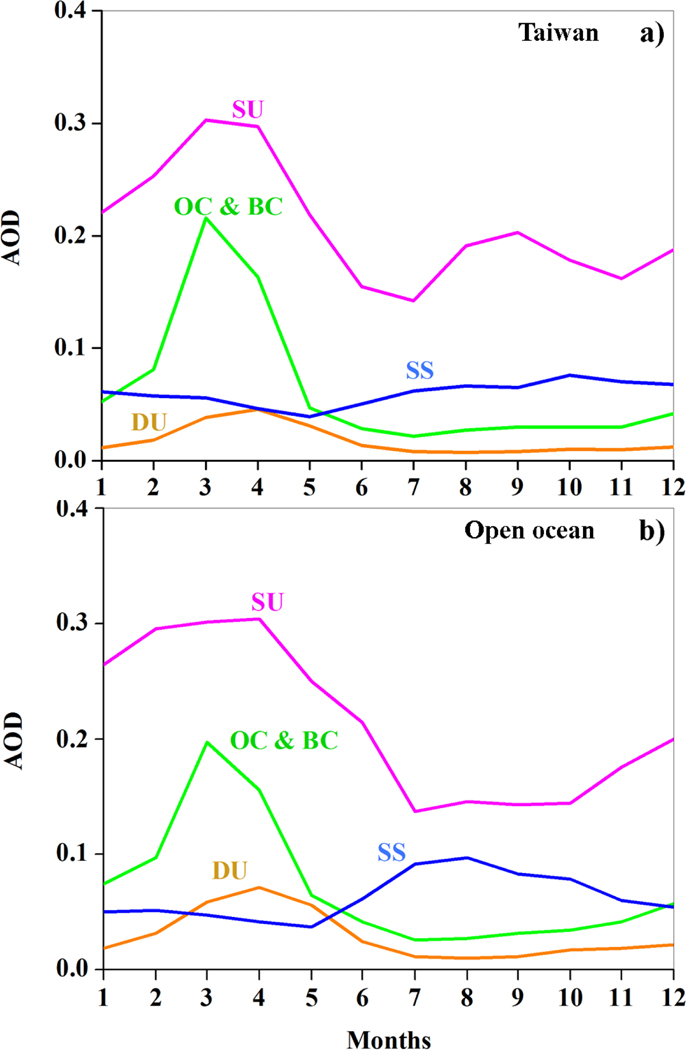
Comparison of monthly mean variations of MERRA AOD of various aerosol species (such as sulfates (SU), organic and black carbon (OC & BC), desert dust (DU) and sea salt (SS)) over (a) Taiwan (22.0N – 25.5N; 120E – 122E) and over (b) the open ocean area in the vicinity of Taiwan (25.5N – 29N; 122.5E – 124.5E), over the 15-year period (2002 – 2017).
By contrast to the spring season, during the autumn season, MERRA AOD showed that sulfate aerosols are the main contributor to total AOD over Taiwan; while the contribution of carbonaceous aerosols is essentially lower (Figs. 9a and 9b). Therefore, based on MERRA AOD, both local and remote sulfate pollutants contribute to the seasonal variations of AOD in Taiwan. Our approach allowed us to distinguish between the sulfate pollutants according to their origin. In particular, MERRA AOD showed the absence of sulfate AOD maximum in autumn in the open ocean area and its presence in the Taiwan area (Figs. 9a and 9b). This indicates the local origin of this sulfate AOD maximum in autumn. Furthermore, we estimated seasonal variations of MERRA sulfate AOD over the 15-year study period (2002 – 2017) separately over the five model grid boxes (of 0.5o latitude by 0.625o longitude each). These five boxes were located close to the low-elevated AERONET monitoring sites in Taiwan (Fig. 1, the orange boxes). Figure 9 represents seasonal variations of MERRA sulfate AOD averaged for these five grid boxes together with the AOD standard deviation. One can see the pronounced sulfate AOD maximum in spring and the less pronounced maximum in autumn. Similar to AERONET AOD, the standard deviation of MERRA sulfate AOD in spring is two-three times lower than the standard deviation in autumn (Fig. 10). This is additional evidence that, in spring, sulfate aerosols from remote sources are predominant; while in autumn sulfate aerosols from local sources dominate. Thus, our approach allowed us to differentiate between the contributions of local and remote sulfate aerosols to the seasonal variation in sulfate AOD in Taiwan. This was similar to our approach to total AOD.
Fig. 10.
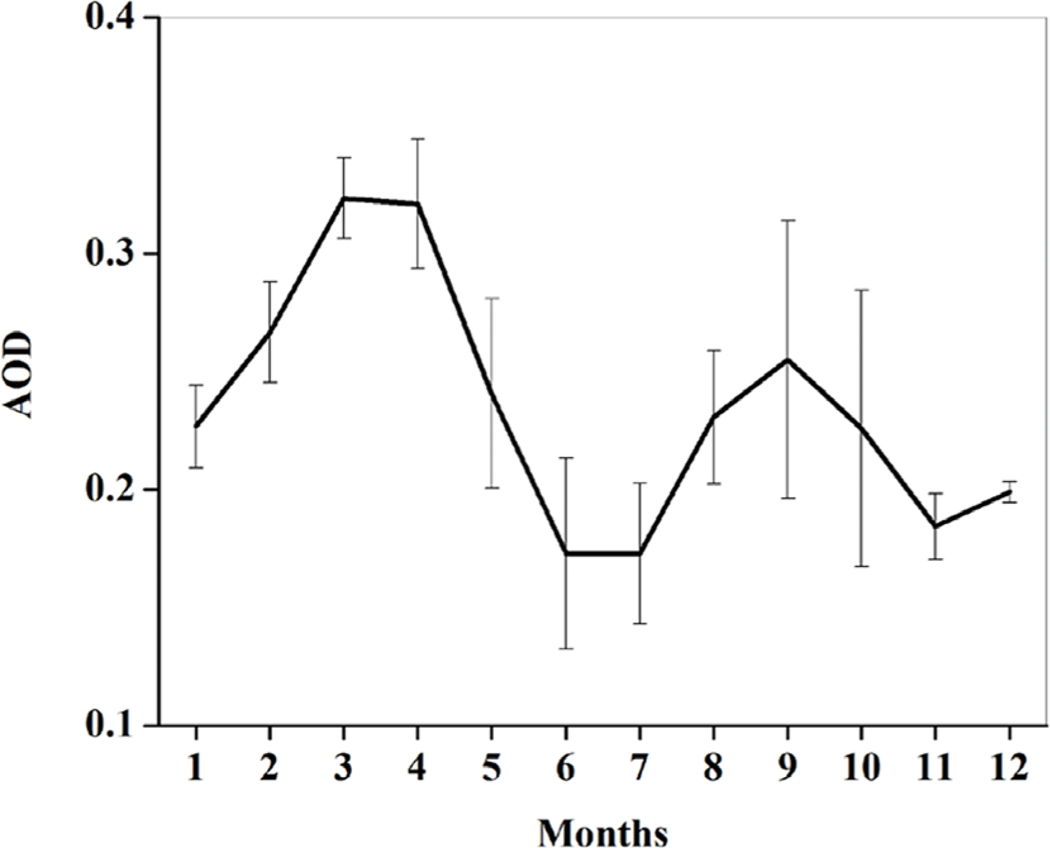
Monthly mean variations of MERRA sulfate AOD averaged for the specified five model grid boxes (located close to the low-elevated AERONET monitoring sites), over the 15-year period (2002 – 2017). The vertical lines designate the standard deviation of AOD.
By contrast to sulfate pollution, for carbonaceous aerosols, similar seasonal variations were obtained over both Taiwan and the open ocean area (where there are no local sources of carbonaceous aerosols) (Fig. 9). In particular, MERRA showed only one pronounced carbonaceous aerosol maximum in spring and no maximum in autumn. This is an indication (based on MERRA AOD of carbonaceous aerosols) that, in spring, in Taiwan, carbonaceous aerosols from remote sources in Indochina are predominant.
CONCLUSIONS
In this study, an approach has been developed for differentiating between local and remote pollution in Taiwan, based on homogeneity perspective of both AERONET measurements and NASA MERRA aerosol reanalysis (version 2, MERRA-2) over a 15-year period (2002 – 2017). The analysis of seasonal variations of the standard deviation of AERONET aerosol optical depth (AOD) measurements and MERRA AOD data in Taiwan showed that, in spring, aerosols from remote sources are predominant: by contrast, in autumn, aerosols from local sources dominate. In spring, when remote aerosols dominate, the AOD standard deviation is almost three times lower than that in autumn. This finding was supported by MERRA AOD over the open ocean area: MERRA total AOD data were used to differentiate between local and remote pollution over both Taiwan and the open ocean area in the vicinity of Taiwan. Over Taiwan, MERRA total AOD showed the primary maximum in spring and the secondary one in autumn. Over the open ocean area, where there are no local sources of anthropogenic aerosols, MERRA total AOD showed only one maximum in spring and no maximum in autumn. Consequently, the maximum in autumn is determined by local air pollution, while the pronounced maximum in spring is determined mainly by air pollution from continental Asia. The analyses of spatial distribution of 15-year monthly mean MERRA winds confirmed the above-mentioned results.
MERRA AOD for various aerosol species showed that, in Taiwan, both local and remote sulfate pollutants contribute to seasonal variations of AOD. Similar to total AOD, MERRA sulfate AOD exhibited the absence of its maximum in autumn over the open ocean area and its presence over Taiwan: this indicates the local origin of the sulfate AOD maximum in autumn. Furthermore, similar to AERONET AOD, the standard deviation of MERRA sulfate AOD in spring is two-three times lower than the standard deviation in autumn. This is additional evidence that, in spring, sulfate aerosols from remote sources predominate; while in autumn sulfate aerosols from local sources dominate.
AOD measurements at the high-elevated AERONET site of Lulin showed only the AOD maximum in spring and no noticeable maximum in autumn. This indicated that aerosols from remote sources were transported at altitudes above 2800 m in spring, while aerosols from local sources in autumn were vertically distributed below 2800 m.
ACKNOWLEDGMENTS
The following MERRA-2 datasets were used in this study: a) tavgM_2d_aer_Nx (GMAO 2015a) and b) instM_3d_ana_Np (GMAO 2015b).
References
- Bollasina MA, Ming Y, Ramaswamy V, Schwarzkopf MD and Naik V (2014). Contribution of local and remote anthropogenic aerosols to the twentieth century weakening of the South Asian Monsoon, Geophys. Res. Lett. 41: 680–687, doi: 10.1002/2013GL058183. [DOI] [Google Scholar]
- Buchard V, Randles A, da Silva AM, Darmenov A, Colarco PR, Ggovindaraju R, Ferrare R, Hair J, Beyersdorf AJ, Ziemba LD and Yu H (2017). The MERRA-2 Aerosol Reanalysis, 1980 Onward. Part II: Evaluation and Case Studies. J. of Climate 30: 6851–6872, DOI: 10.1175/JCLI-D-16-0613.1 [DOI] [PMC free article] [PubMed] [Google Scholar]
- Chen ML, Mao TF and Lin IK (1999). The PM2.5 and PM10 particles in urban areas of Taiwan. Sci. Total Environ. 226: 227–235. [DOI] [PubMed] [Google Scholar]
- Chen YS, Sheen PC, Chen ER, Liu YK, Wu TN and Yang CY (2004). Effects of Asian dust storm events on daily mortality in Taipei, Taiwan. Environ. Res. 95: 151–155. [DOI] [PubMed] [Google Scholar]
- Chin M, Ginoux P, Kinne S, Torres O, Holben B, Duncan BN, Martin RV, Logan J, Higurashi A and Nakajima T (2002). Tropospheric aerosol optical thickness from the GOCART model and comparisons with satellite and sun photometer measurements, J. Atmos. Sci. 59: 461–483, doi: 10.1175/1520-0469(2002)059. [DOI] [Google Scholar]
- Colarco P, da Silva A, Chin M, and Diehl T (2010). Online simulations of global aerosol distributions in the NASA GEOS-4 model and comparisons to satellite and ground-based aerosol optical depth. J. Geophys. Res. Atmos. 115: D14207, doi: 10.1029/2009JD012820. [DOI] [Google Scholar]
- Cowan T, and Cai W (2011). The impact of Asian and non-Asian anthropogenic aerosols on 20th century Asian summer monsoon. Geophys. Res. Lett. 38: L11703, doi: 10.1029/2011GL047268. [DOI] [Google Scholar]
- GMAO (2015a). MERRA-2 tavgM_2d_aer_Nx: 2d, Monthly mean, Time-averaged, Single-Level, Assimilation, Aerosol Diagnostics V5.12.4, Greenbelt, MD, USA, Goddard Earth Sciences Data and Information Services Center (GES DISC), Accessed August 2017, doi: 10.5067/FH9A0MLJPC7N; [DOI] [Google Scholar]
- GMAO (2015b). MERRA-2 instM_3d_ana_Np: 3d, Monthly mean, Instantaneous, Pressure-Level, Analysis, Analyzed Meteorological Fields V5.12.4, Greenbelt, MD, USA, Goddard Earth Sciences Data and Information Services Center (GES DISC), Accessed November 2017, doi: 10.5067/V92O8XZ30XBI. [DOI] [Google Scholar]
- Guo J, Lou M, Miao Y, Wang Y, Zeng Z, Liu H, He J, Xu H, Wang F, Min M, Zhai P (2017). Trans-Pacific transport of dust aerosols from East Asia: Insights gained from multiple observations and modeling. Environmental Pollution: 230, 1030–1039. [DOI] [PubMed] [Google Scholar]
- Kishcha P, da Silva AM, Starobinets B, Alpert P (2014), Air pollution over the Ganges basin and northwest Bay of Bengal in the early postmonsoon season based on NASA MERRAero data, J. Geophys. Res. Atmos., 119, doi: 10.1002/2013JD020328. [DOI] [Google Scholar]
- Kishcha P, Rieger D, Metzger J, Starobinets B, Bangert M, Vogel H, Schaettler U, Corsmeier U, Alpert P, and Vogel B (2016). Modeling of a strong dust event in the complex terrain of the Dead Sea valley during the passage of a gust front. Tellus B 68: 29751, 10.3402/tellusb.v68.29751. [DOI] [Google Scholar]
- Li T-C, Yuan C-S, Hung C-H, Lin H-Y, Huang H-C, and Lee C-L (2016). Chemical Characteristics of Marine Fine Aerosols over Sea and at Offshore Islands during Three Cruise Sampling Campaigns in the Taiwan Strait– Sea Salts and Anthropogenic Particles, Atmos. Chem. Phys. Discuss.: 10.5194/acp-2016-384. [DOI] [Google Scholar]
- Lin CY, Liu SC, Chou CCK, Huang SJ, Liu CM, Kuo CH and Young CY (2005). Long-range transport of aerosols and their impact on the air quality of Taiwan. Atmos. Environ. 39: 6066–6076. [Google Scholar]
- Lin C-Y, Wang Z, Chen W-N, Chang S-Y, Chou CCK, Sugimoto N, and Zhao X (2007). Long-range transport of Asian dust and air pollutants to Taiwan: observed evidence and model simulation, Atmos. Chem. Phys. 7: 423–434, 10.5194/acp-7-4232007. [DOI] [Google Scholar]
- Lin N-H, Si-Chee Tsay S-C, Maring HB et al. (2013). An overview of regional experiments on biomass burning aerosols and related pollutants in Southeast Asia: From BASE-ASIA and the Dongsha Experiment to 7-SEAS. Atmos. Environ. 78: 1–19. [Google Scholar]
- Provencal S, Buchard V, da Silva AM, Leduc R, Barrette N, Elhacham E, Wang SH (2017). Evaluation of PM2.5 surface concentration simulated by version 1 of NASA’s MERRA aerosol reanalysis over Israel and Taiwan. Aerosol and Air Quality Research 17: 253–261. [DOI] [PMC free article] [PubMed] [Google Scholar]
- Randles CA, da Silva AM, Buchard V, Colarco PR, Darmenov A, Govindaraju R, Smirnov A, Holben B, Ferrare R, Hair J, Shinozuka Y and Flynn CJ (2017). The MERRA-2 Aerosol Reanalysis, 1980 Onward. Part I: System Description and Data Assimilation Evaluation. J. of Climate 30: 6823–6850, DOI: 10.1175/JCLI-D-16-0609.1 [DOI] [PMC free article] [PubMed] [Google Scholar]
- Tu JY, Chou C (2013). Changes in precipitation frequency and intensity in the vicinity of Taiwan: typhoon versus non-typhoon events. Environ. Res. Lett, 8, 014023, doi: 10.1088/1748-9326/8/1/014023 [DOI] [Google Scholar]
- Wang SH, Hsu NC, Tsay SC, Lin NH, Sayer AM, Huang SJ, Lau WKM (2012), Can Asian dust trigger phytoplankton blooms in the oligotrophic northern South China Sea? Geophys. Res. Lett, 39, L05811, doi: 10.1029/2011GL050415. [DOI] [Google Scholar]
- Wang S-H, Hung W-T, Chang S-C, Yen M-C (2016). Transport characteristics of Chinese haze over Northern Taiwan in winter, 2005–2014. Atmospheric Environment, 126, 76–86. doi: 10.1016/j.atmosenv.2015.11.043. [DOI] [Google Scholar]
- Yen MC, Peng CM, Chen TC, Chen CS, Lin NH, Tzeng RY, Lee YN, Lin CC (2013). Climate and weather characteristics in association with the active fires in northern Southeast Asia and spring air pollution in Taiwan during 2010 7-SEAS/Dongsha Experiment. Atmospheric Environment 78: 35–50. [Google Scholar]
- Yu HLA, Remer LA, Chin M, Bian H, Kleidman R, Diehl T (2008). A satellite-based assessment of transpacific transport of pollution aerosol, J. Geophys. Res, 113, D14S12, doi: 10.1029/2007JD009349. [DOI] [Google Scholar]


