Abstract
Aging impairs tissue repair. This is pronounced in skeletal muscle, whose regeneration by muscle stem cells (MuSCs) is robust in young adult animals but inefficient in older organisms. Despite this functional decline, old MuSCs are amenable to rejuvenation through strategies that improve the systemic milieu, such as heterochronic parabiosis. One such strategy, exercise, has long been appreciated for its benefits on healthspan, but its effects on aged stem cell function in the context of tissue regeneration are incompletely understood. Here we show that exercise in the form of voluntary wheel running accelerates muscle repair in old animals and improves old MuSC function. Through transcriptional profiling and genetic studies, we discovered that the restoration of old MuSC activation ability hinges on restoration of Cyclin D1, whose expression declines with age in MuSCs. Pharmacologic studies revealed that Cyclin D1 maintains MuSC activation capacity by repressing TGFβ signaling. Taken together, these studies demonstrate that voluntary exercise is a practicable intervention for old MuSC rejuvenation. Furthermore, this work highlights the distinct role of Cyclin D1 in stem cell quiescence.
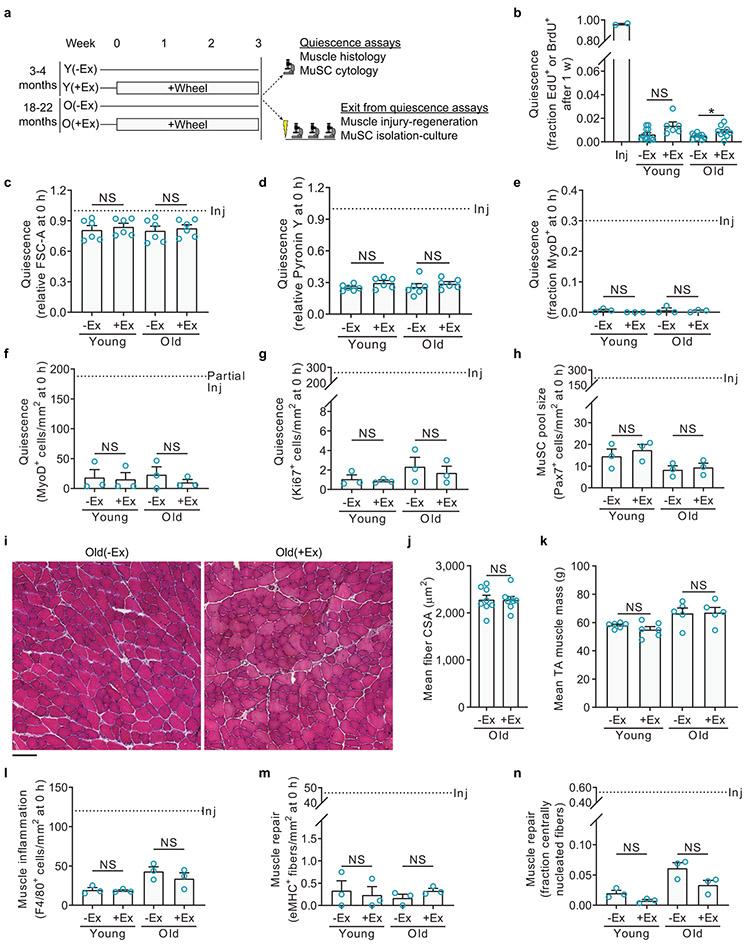
To study the effects of exercise on MuSC function and muscle regeneration, we used an established model of exercise in rodents1,2: we provided young adult and old mice three weeks of access to freely-rotating running wheels (+Ex) or, as the control condition, to locked wheels (−Ex) (Extended Data Fig. 1a). Within a week, young and old mice reached a stable exercise routine, running 10.0 ± 2.0 (n=39, mean ± SD) and 4.9 ± 2.7 (n=91, mean ± SD) km/night, respectively. This short-term, non-strenuous, voluntary exercise regimen was selected to avoid confounding the study of stem cell quiescence by the muscle injury and overt MuSC activation known to occur during resistance training or more intense endurance exercise3-6. With voluntary wheel running, MuSCs exhibited at most minor changes from quiescence in any marker for cells in a proliferative or activated state, including thymidine analog incorporation, total RNA content, cell size, Ki67 expression, and MyoD expression (Extended Data Fig. 1b-g). Voluntary wheel running also did not induce a significant increase in the total number of MuSCs (Extended Data Fig. 1h) and caused at most minor changes in muscle size or signs of muscle damage such as inflammation or fiber degeneration (Extended Data Fig. 1i-n). Our results are consistent with previous observations that voluntary wheel running does not expand the MuSC pool in adult mice3. This is in contrast to resistance exercise, which causes muscle hypertrophy and the activation of MuSCs and many other cell types in muscle5–8, to exercise in the postnatal development period, which can expand the MuSC pool3, and forced endurance exercise, which above a certain intensity level causes animal stress, muscle injury, and also activates MuSCs3,4. In a prior study of voluntary wheel running in adult mice, exercise increased the expression of myogenic genes and Wnt signaling in muscle, but MuSC pool size, MuSC function, and muscle repair ability were not examined9. In summary, voluntary wheel running is a form of exercise that allow analysis of the MuSC populations that remain in a quiescent state.
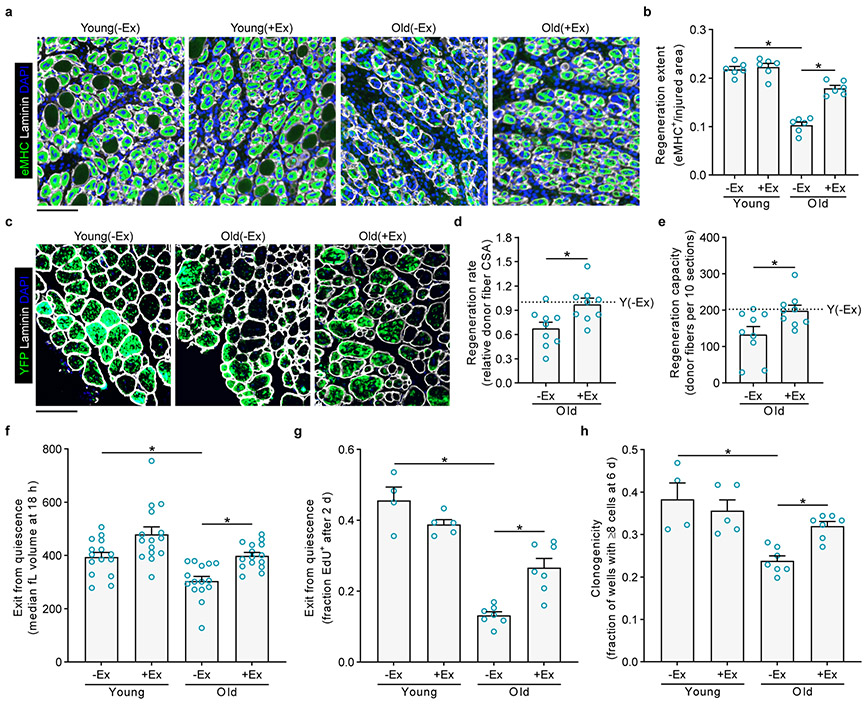
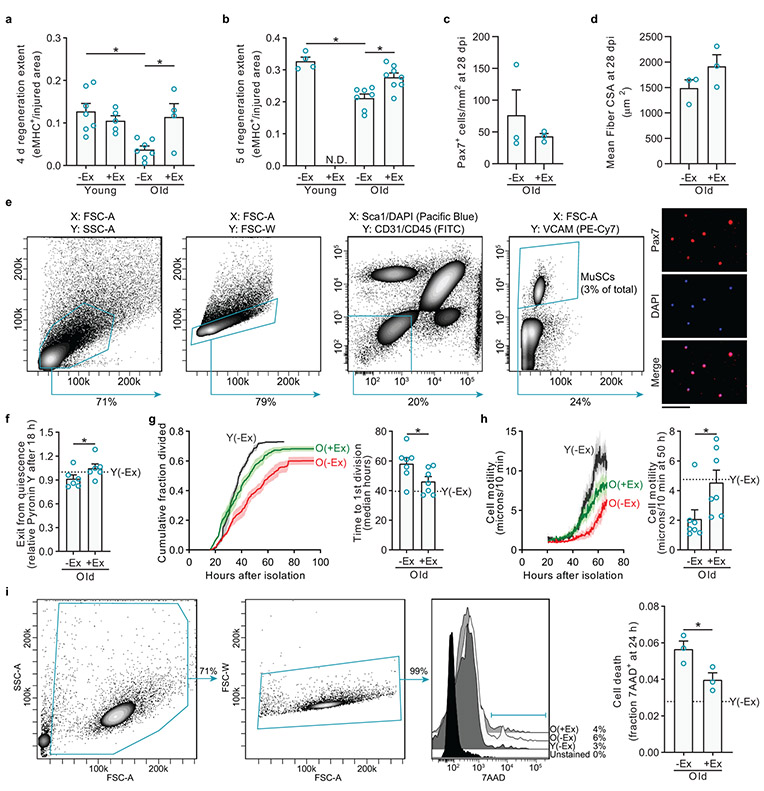
We first tested the effects of exercise on muscle regeneration, the primary function of adult MuSCs. After three weeks of free or locked wheel access, we removed mice from exercise cages and injured the tibialis anterior (TA) muscles with barium chloride. After either four to five days or twenty-eight days of recovery, we isolated the TA muscles and examined regeneration histologically (Fig. 1a, b and Extended Data Fig. 2a-d). Compared to young(−Ex) mice, old(−Ex) mice were delayed in the formation of new muscle, as is well-established10. Exercise significantly accelerated the regeneration efficiency of muscle in old mice toward more youthful levels. Notably, exercise did not benefit young muscle repair, even when examined at an earlier time point (Extended Data Fig. 2a).
Fig. 1 ∣. Exercise improves old muscle repair and MuSC function.
a, Three weeks after exercise or no exercise, mice were transferred to new cages without wheels, and TA muscles were injured. After 4.5 days, muscles were isolated and stained to detect regeneration. b, The injured area occupied by eMHC+ myofibers was quantified (n=6 mice per group). c, Ten thousand freshly isolated YFP+ MuSCs from each donor mouse were transplanted into pre-injured TA muscles of host NOD-SCID mice. Ten days after transplantation, muscles were stained to detect donor-derived (YFP+) myofibers. d, The mean cross-sectional areas (CSA) of YFP+ myofibers were quantified and then normalized to the mean Y(−Ex) level in each experiment (n=9 for O(−Ex), 9 for O(+Ex), and 6 for Y(−Ex) muscles). e, The numbers of YFP+ myofibers in recipient muscles were counted (n=9 for O(−Ex), 9 for O(+Ex), and 6 for Y(−Ex) muscles). f, FACS-isolated MuSCs were cultured, and enlargement was measured with a Coulter counter (n=15 mice per group). g, MuSCs were cultured continuously in EdU to assess S-phase progression (n=4 for Y(−Ex), 5 for Y(+Ex), 7 for O(−Ex), and 7 for O(+Ex) mice). h, Single MuSCs were sorted during FACS isolation into individual wells to assess clonogenic capacity (n=4 for Y(−Ex), 5 for Y(+Ex), 7 for O(−Ex), and 7 for O(+Ex) mice). Scale bars in a, c, 100 μm. Data are summarized with mean + s.e.m. *P<0.05; two-tailed Welch’s t-test in b, d-h.
To examine the extent to which exercise rejuvenates old muscle repair through intrinsic changes in MuSCs, we performed transplantation assays, in which old MuSCs are known to exhibit severe defects11,12. Donor mice were tamoxifen-treated Pax7CreER; R26RYFP, thus expressing YFP specifically in adult MuSCs13. We transplanted MuSCs from old(−Ex) or old(+Ex) mice, or from young(−Ex) mice, into injured muscles of young hosts. Ten days later, we examined host muscles for the presence of YFP-labeled muscle fibers. Compared to young(−Ex) donor MuSCs, old(−Ex) donor MuSCs formed smaller and fewer fibers (Fig. 1c-e). Both parameters were significantly restored back to young levels by exercise.
Old MuSCs harbor striking defects in activation compared to young MuSCs14,15. Because exercise accelerated muscle repair, we hypothesized that exercise would restore old MuSC activation. To test this, we FACS-isolated MuSCs (Extended Data Fig. 2e) from young and old mice without or with exercise and assayed their activation over time in culture using a battery of assays. One of the earliest processes of MuSC activation is enlargement in size, which we measured eighteen hours after isolation using a Coulter counter. We found that old MuSCs had defects in enlargement compared to young MuSCs, and this was restored by exercise (Fig. 1f). We also found that accrual of total RNA, another measure of cell growth during the exit from quiescence, was also increased with exercise in old MuSCs (Extended Data Fig. 2f). Old MuSCs had a lower rate of entry into this first S-phase, as measured by EdU incorporation, compared to young MuSCs, and this was rescued by exercise (Fig. 1g). Analysis of other aspects of activation, completion of the first division and gain in motility, further demonstrated that exercise enhanced the rate at which old MuSCs activate (Extended Data Fig. 2g, h). Analysis of MuSC death during activation revealed that exercise improved MuSC survival (Extended Data Fig. 2i). In addition, exercise increased clone formation by old MuSCs (Fig. 1h). Taken together, these experiments show that non-strenuous voluntary exercise improves old MuSC function, not because exercise itself activates MuSCs, but rather because exercise prepares these cells for activation.
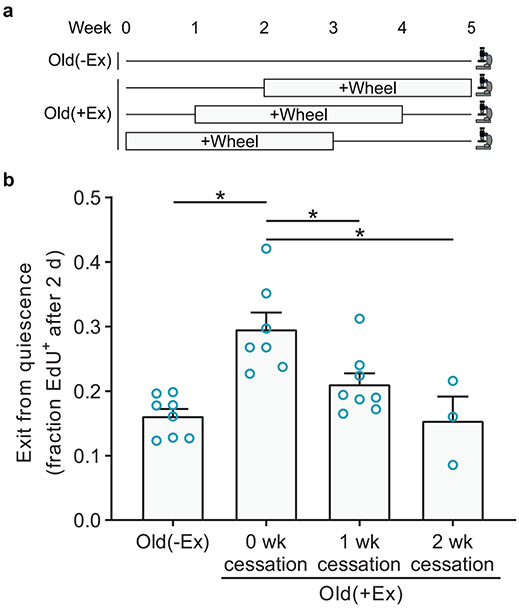
To investigate the perdurance of old MuSC enhancement by exercise, we compared the activation rates of MuSCs from old(−Ex) mice, from old(+Ex) mice, and from old(+Ex) mice that had exercised for three weeks and then had their wheels removed for one or two weeks (Extended Data Fig. 3a). The benefit of exercise on old MuSC activation was significantly diminished one week after exercise cessation and completely gone, back to old(−Ex) levels, two weeks after exercise cessation (Extended Data Fig. 3b).
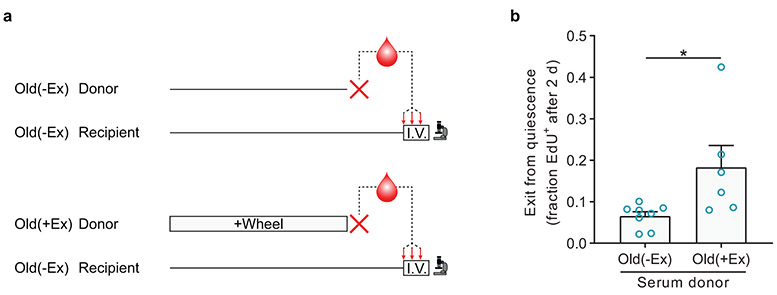
To examine whether the benefits of exercise on old MuSCs could be mediated at least partly through humoral factors, we collected serum from old(−Ex) and old(+Ex) mice. We then intravenously injected this serum into old(−Ex) mice at 0.3 mL daily (about 15% of total blood volume) for three consecutive days. On the fourth day, we isolated MuSCs from these recipient mice and tested activation rate in the ex vivo EdU incorporation assay (Extended Data Fig. 4a). Compared to injections of serum from old(−Ex) mice, injections of serum from old(+Ex) mice increased the activation rate of old MuSCs (Extended Data Fig. 4b).
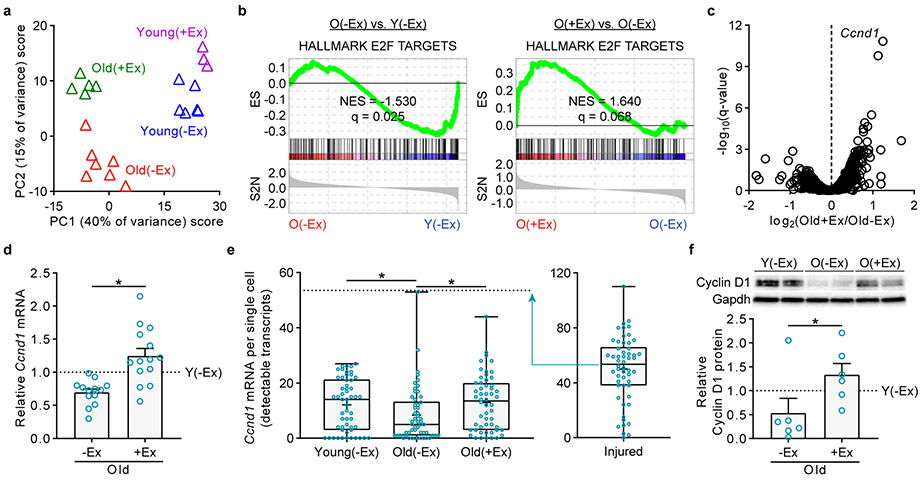
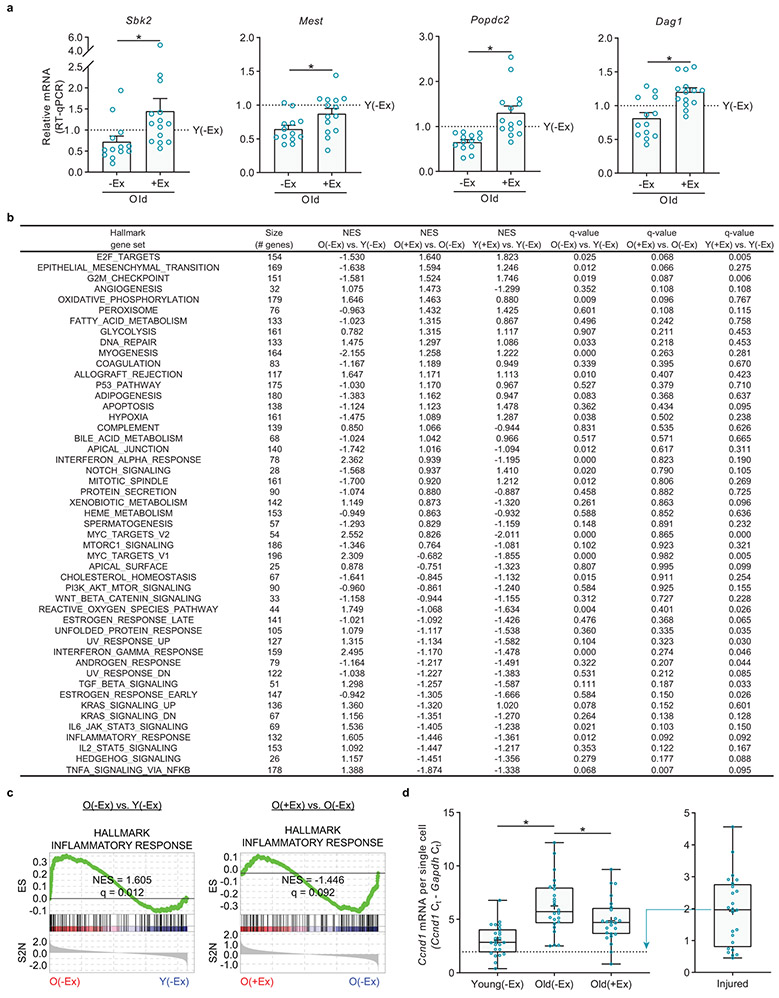
These functional studies show that exercise alters old MuSCs in their quiescent state. To probe the molecular changes underlying these phenotypic improvements, we performed RNA-Seq on young and old quiescent MuSCs from non-exercised and exercised mice. Globally, exercise partially rejuvenated the transcriptional changes of aging: principal component analysis (PCA) revealed patterns of genes that were changed with aging but not restored by exercise, as well as patterns that were changed with aging and restored by exercise (Fig. 2a). At a 10% false discovery rate (FDR), 248 genes differed between old(−Ex) and old(+Ex) MuSCs, 130 of which could be considered rejuvenated in the context of the old(−Ex) versus young(−Ex) comparison. We performed RT-qPCR to validate the changes for select rejuvenated genes implicated in muscle development and regeneration (Extended Data Fig. 5a). By contrast, young(−Ex) MuSCs were transcriptomically similar to young(+Ex) MuSCs, with only 35 genes differing at a 10% FDR.
Fig. 2 ∣. Exercise partly restores the old MuSC transcriptome and enhances Cyclin D1 expression.
a, PCA of RNA-Seq profiles of MuSCs from young or old, non-exercised or exercised mice. Each profile represents the MuSCs of an individual mouse. b, GSEA enrichment plots for the E2F TARGETS gene set, representing cell cycle genes. c, Volcano plot of transcripts in the RNA-Seq profiles of MuSCs from old non-exercised or old exercised mice. Ccnd1 is labeled as the transcript most strongly upregulated by exercise. d, RT-qPCR for Ccnd1 in MuSCs from mice independent of those used in the RNA-Seq experiment. Ct values were normalized first to the mean of Gapdh, Hprt, and Actb1 and then to the mean Y(−Ex) level in each experiment (n=13 for O(−Ex), 14 for O(+Ex), and 13 for Y(−Ex) mice). e, Single-molecule RNA-FISH for Ccnd1 in freshly isolated MuSCs. For comparison, also shown are results for Y(Activated) MuSCs isolated from mice three days after injury (n=54 cells in each group, pooled from 3 Y(−Ex), 4 O(+Ex), 4 O(−Ex), and 3 Y(Activated) mice). f, Western blot analysis of Cyclin D1 in MuSCs. Each lane represents a pool of two to three mice. Shown is a representative blot and quantification of two blots (n=6 for O(−Ex), 6 for O(+Ex), and 5 for Y(−Ex) lanes). ES, running enrichment score; NES, normalized enrichment score; S2N, GSEA Signal2Noise ranking metric in b. Data are summarized with mean and s.e.m. in d, f, box-and-whisker plots (bottom whisker, min; box bottom, 25th percentile; box middle, median; box top, 75th percentile; top whisker, max; “+”, mean) in e. *P<0.05; two-tailed Welch’s t-test in d, e; two-tailed Mann-Whitney U-test in f.
To explore the pathways involved in the benefits of exercise, we performed gene set enrichment analysis (GSEA) using the Hallmark gene set collection. Compared to young(−Ex) MuSCs, old(−Ex) MuSCs exhibited upregulation of inflammation (including TGFβ, NF-κB, IL-6, and IFNα/γ) and oxidative stress response gene sets and downregulation of cell cycle-promoting, myogenesis, and Notch signaling gene sets (Fig. 2b and Extended Data Fig. 5b, c). In old MuSCs, exercise restored the cell cycle and myogenesis gene sets but not the Notch signaling gene set. Exercise suppressed some of the inflammation (TGFβ, NF-κB, and IL-6) but not other inflammation (IFNα/γ) or oxidative stress response gene sets. Gene sets changed by exercise in old MuSCs that were not altered by aging included angiogenesis (upregulated) and Hedgehog and IL-2 signaling (downregulated). To summarize, exercise ameliorates some but not all molecular signatures of cell stress in old MuSCs and restores some patterns of genes likely to be important for MuSC function.
To investigate more deeply the mechanisms by which exercise enhances old MuSCs, we examined the transcriptional differences between old(−Ex) MuSCs and old(+Ex) MuSCs in the RNA-Seq data (Fig. 2c). The top hit of this analysis was the transcript Ccnd1, which was strongly decreased during aging and restored by exercise. We confirmed this result with RT-qPCR using samples independent of those used in the RNA-Seq (Fig. 2d). To determine whether these differences in Ccnd1 expression in MuSCs might represent a large change in a small subset of cells, we analyzed expression at a single-cell level. Using RNA-FISH, we found that levels of Ccnd1 transcript changed across the population at large, rather than only in a few high-expressing MuSCs (Fig. 2e). This was corroborated by single-cell RT-qPCR experiments (Extended Data Fig. 5d). Western blot analyses demonstrated that protein levels of Cyclin D1 were also restored by exercise (Fig. 2f). Thus, MuSCs in the quiescent state differentially express Cyclin D1 based on age and exercise history.
Cyclin D1 has been extensively studied in the context of myoblast expansion and differentiation. At these stages of myogenesis, which notably occur multiple days after MuSCs exit from quiescence, Cyclin D1 is upregulated and functions to sustain progenitor cell expansion and prevent premature differentiation16-18. The functions of Cyclin D1 in MuSC quiescence and exit from quiescence, despite the observation that Cyclin D1 is expressed in the quiescent state, however, are not known. Cyclin D1 is known to influence stem cell-related transcriptional networks 19,20 and has been examined in other stem cell populations, such as developing and adult hematopoietic stem cells21,22, adult mammary epithelial stem cells23, developing and postnatal neural stem cells24,25, and human embryonic stem cells20,26. In these other cell types, Cyclin D1 has been found to affect proliferation and differentiation, but its roles in early stem cell exit from quiescence in response to regenerative requirements have not been studied. Intriguingly, Cyclin D1 has been shown not only to be involved in exit from quiescence in culture27,28, but to be important for adult Schwann cell exit from quiescence in vivo29. We set out to determine the role of Cyclin D1 in quiescent, adult MuSCs.
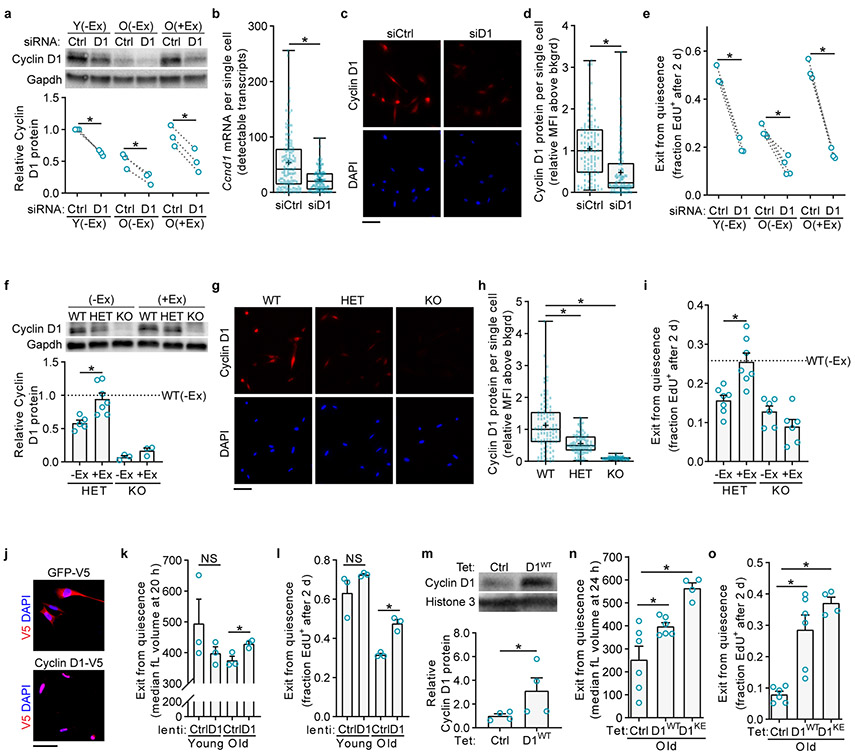
We first investigated whether exercise restores activation rate in old MuSCs through Cyclin D1. To counter the induction of Cyclin D1 by exercise, we transfected freshly isolated MuSCs with a pool of siRNAs targeting Ccnd1 (siD1), or a pool of control siRNAs that do not target any known mouse transcripts (siCtrl). Western blot analyses one day after isolation and transfection showed that siD1 treatment reduced Cyclin D1 to about half of siCtrl levels, for any MuSC age and exercise history (Fig. 3a). Therefore, this knockdown reduced Cyclin D1 levels in old(+Ex) MuSCs back to the levels in old(−Ex) MuSCs. RNA-FISH and immunofluorescence analyses of individual cells confirmed that this knockdown affected the population as a whole rather than just a few cells (Fig. 3b-d). Examining MuSC activation ability through the ex vivo EdU incorporation assay, we found that Cyclin D1-depleted old(+Ex) MuSCs, unlike control old(+Ex) MuSCs, were no longer improved relative to control old(−Ex) MuSCs (Fig. 3e). Thus, countering the induction of Cyclin D1 by exercise attenuates the restoration of activation by exercise in old MuSCs.
Fig. 3 ∣. Exercise improves MuSC activation through Cyclin D1.
a, Freshly isolated MuSCs were transfected with non-targeting (Ctrl) or Ccnd1-targeting (D1) siRNA pools. One day later, MuSCs were harvested for Western blot. Shown is a representative blot and quantification of three blots. Each lane represents a pool of two to four mice split into the two siRNA conditions (n=3 lanes per group). b, Ccnd1 single-molecule RNA-FISH on MuSCs transfected as in a and fixed after two days (n=127 cells in each group, pooled from 2 mice split into the two siRNA conditions). c-d, Cyclin D1 immunofluorescence on MuSCs transfected as in a and fixed after two days (n=99 cells per group, pooled from 8 mice split into the two siRNA conditions). e, MuSCs transfected as in a were grown continuously in EdU (n=3 for Y(−Ex), 4 for O(−Ex), and 3 for O(+Ex) mice). f, Western blot of MuSCs from WT, HET, or KO mice, without or with exercise. Shown is a representative blot and quantification of three blots. Each lane represents a pool of one to four mice (n=5 for HET(−Ex), 7 for HET(+Ex), 3 for KO(−Ex), 3 for KO(+Ex), and 12 for WT(−Ex) lanes). g-h, Cyclin D1 immunofluorescence on MuSCs from WT, HET, or KO mice fixed after two days (n=99 cells per group, pooled from 6 WT, 3 HET, and 2 KO mice). i, Lower hindlimb muscles were injured to activate MuSCs in vivo. After 1.5 days, mice received an intraperitoneal injection of EdU. MuSCs from these muscles were isolated twelve hours later for EdU staining (n=7 for HET(−Ex), 7 for HET(+Ex), 6 for KO(−Ex), 6 for KO(+Ex), and 11 for WT(−Ex) mice). j, MuSCs from each mouse were split into the two infection conditions: GFP-V5 (Ctrl) lentiviruses vs. Ccnd1-V5 (D1) lentiviruses. During the infection, MuSCs were held in Tubastatin A (TubA) to maintain quiescence. After three days, MuSCs were fixed and stained for the V5 tag. Analysis of these images showed infection rates of 47 ± 9% (n=3, mean ± SD) for lentiCtrl and 54 ± 3% (n=3, mean ± SD) for lentiD1 infections k, MuSCs from each mouse were infected with Ctrl or D1 lentiviruses immediately upon isolation, and enlargement was measured with a Coulter counter (n=3 mice per group). l, MuSCs infected as in j were activated in the presence of EdU for two days by removing TubA (n=3 mice per group). m, Western blot of MuSCs from TetCtrl and TetD1WT mice. Shown is a representative blot and quantification of two blots. Each lane represents MuSCs from one mouse (n=4 lanes per group). n-o, Exit from quiescence was measured by cell size (n) and S-phase entry (o) (n=6 for TetCtrl, 6 for TetD1WT, and 4 for TetD1KE hindlimbs). Scale bars in c, g, j, 50 μm. Data are summarized with mean and s.e.m. in f, i, m-o, box-and-whisker plots (bottom whisker, min; box bottom, 25th percentile; box middle, median; box top, 75th percentile; top whisker, max; “+”, mean) in b, d, h. NS, not significant; *P<0.05; one-tailed ratio paired t-test in a, one-tailed Welch’s t-test in b, d, h, i, n, o, one-tailed unpaired t-test in k, one-tailed paired t-test between groups connected by dotted lines in e, l, one-tailed Welch’s t-test between O(−Ex)(siCtrl) and O(+Ex)(siD1) in e and between Y(lentiCtrl) and O(lentiCtrl) in l, one-tailed Mann-Whitney U-test in f, m.
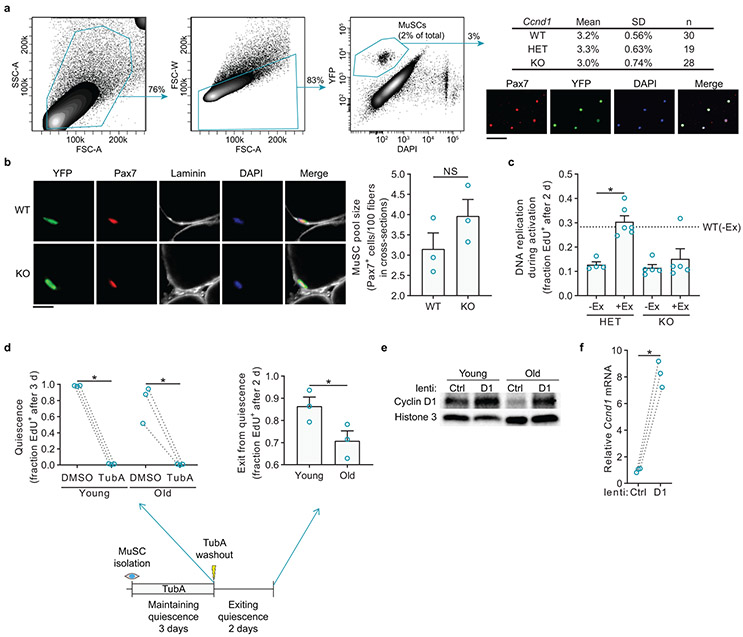
We then turned to a genetic model of Cyclin D1 reduction. This allowed us to test whether Cyclin D1 is important for activation of MuSCs and for the benefits of exercise in vivo after injury. This further allowed us to circumvent the possibility of off-target effects of the Ccnd1 siRNA pool. Therefore, we obtained mice with conditional loss-of-function alleles of Ccnd1, in which the first and third introns of the Ccnd1 gene contain loxP sites30. We bred Pax7CreER; R26RYFP mice with mice that were Ccnd1+/+, Ccnd1flox/+, or Ccnd1flox/flox, generating mice in which tamoxifen administration caused MuSC-specific ablation of zero (WT), one (HET), or both (KO) alleles of Ccnd1. We then allowed the mice no access or access to running wheels. Western blot analyses showed that Cyclin D1 levels were halved in HET MuSCs and restored to WT levels by exercise, similar to old MuSCs (Fig. 3f). KO MuSCs expressed negligible levels of Cyclin D1, and these levels were not increased significantly by exercise. Immunofluorescence analyses confirmed that these reductions in Cyclin D1 expression occurred in the populations at large rather than in a few cells (Fig. 3g, h). Standard histology and flow cytometry analyses showed that short-term (six weeks) or long-term (nine months) loss of Cyclin D1 in MuSCs did not alter MuSC number or cause MuSCs to exit their sublaminar location (Extended Data Fig. 6a, b). To evaluate MuSC activation rates in vivo, we injured TA and gastrocnemius muscles, injected EdU intraperitoneally at 1.5 days after injury, and collected MuSCs from these muscles for analysis of EdU incorporation at two days after injury. Compared to young(WT) MuSCs, young(HET) MuSCs and young(KO) MuSCs were impaired in S-phase entry during activation (Fig. 3i). This impairment was rescued by exercise in young(HET) MuSCs, but not in young(KO) MuSCs. Similar results were obtained in ex vivo EdU incorporation assays of activation (Extended Data Fig. 6c). Thus, Cyclin D1 is crucial for MuSC activation ability, and exercise benefits MuSC activation through Cyclin D1 restoration.
To examine the extent to which upregulation of Cyclin D1 would restore youthful properties to old MuSCs, we generated lentiviral vectors to increase expression of Cyclin D1 in MuSCs (Fig. 3j, Extended data Fig. 6e, f). Increased Cyclin D1 expression in old MuSCs accelerated enlargement compared to old MuSCs infected with a control lentivirus (Fig. 3k). We then tested the effects of increased Cyclin D1 expression on MuSCs maintained in quiescence ex vivo (Extended Data Fig. 6d). When the cells were then allowed to activate in the presence of EdU, increased Cyclin D1 led to an acceleration of the exit from quiescence of old but not young MuSCs (Fig. 3l).
To investigate the effects of Cyclin D1 upregulation in vivo on old MuSC activation, we generated mice in which Cyclin D1 can be induced specifically in MuSCs. For this, we used Pax7rtTA mice crossed with mice transgenic for Ccnd1 controlled by the tetracycline responsive element (TRE)31,32. We studied the wild-type form of Cyclin D1 as well as a mutant form of Cyclin D1 (K112E) that cannot activate Cdk4/633-35. We aged the mice to twenty months of age and then administered doxycycline to Pax7rtTA mice transgenic for wild-type Ccnd1 (TetD1WT), transgenic for K112E Ccnd1 (TetD1KE), or without a Cyclin D1 transgene (TetCtrl). Western blot assays showed that Cyclin D1 was induced two-fold by doxycycline in MuSCs from mice containing the transgene compared to mice lacking the transgene (Fig. 3m). Analysis of activation by assaying ex vivo cell enlargement or EdU incorporation showed that increased expression of Cyclin D1 (including the mutant form that does not activate Cdk4/6) in old MuSCs restored activation rate (Fig. 3n, o). Taken together, these rescue experiments ex vivo and in vivo indicate that Cyclin D1 upregulation is sufficient to improve old MuSC activation.
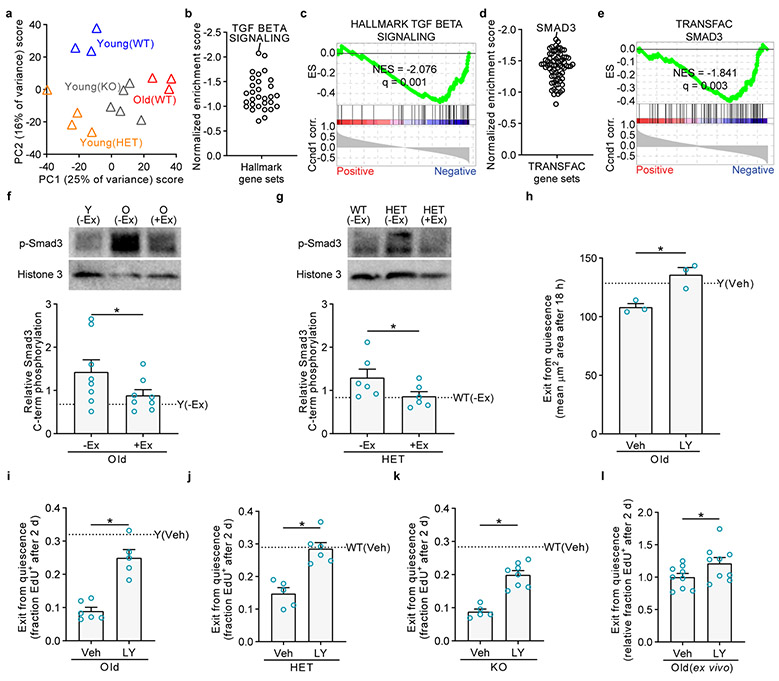
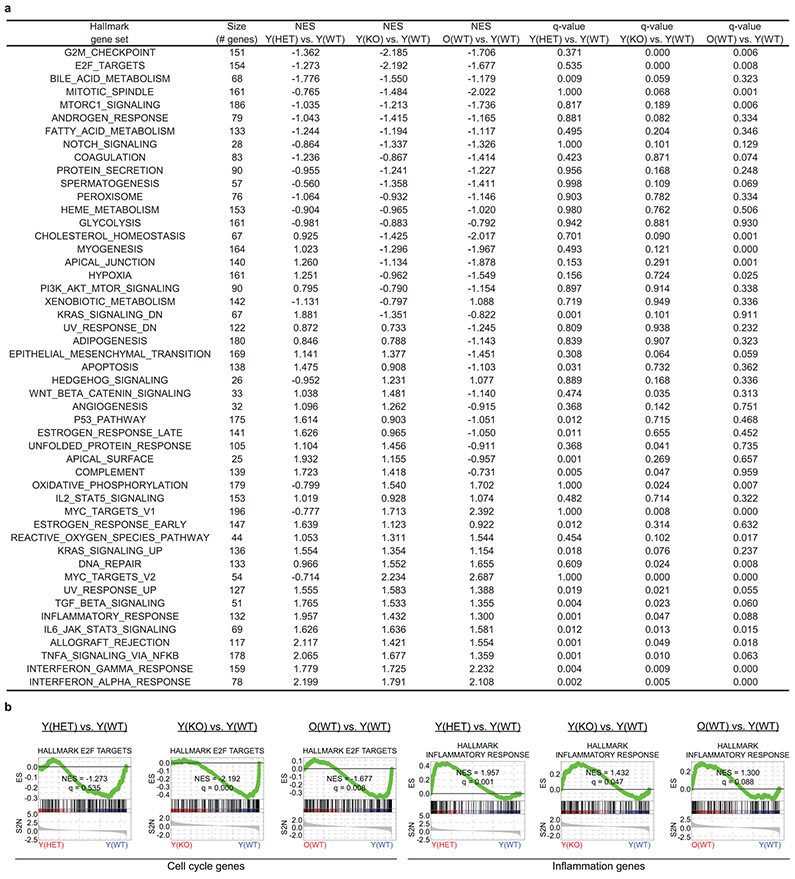
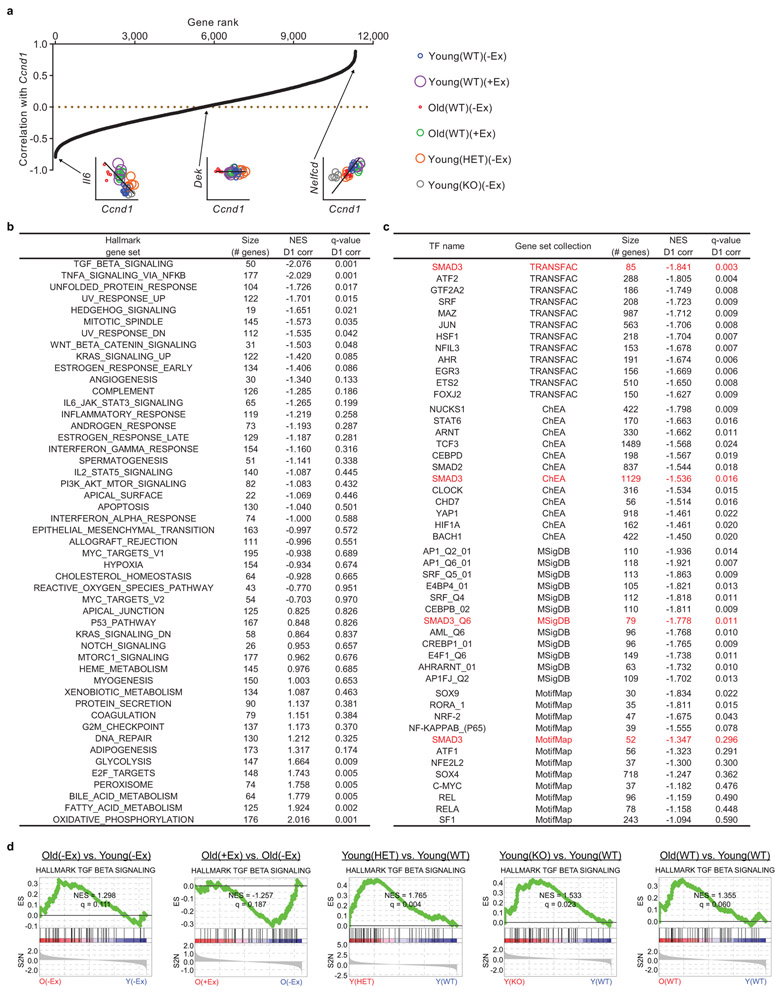
Next, we investigated molecular roles of Cyclin D1 in quiescent MuSCs and performed RNA-Seq on young(WT), young(HET), and young(KO) MuSCs, as well as old(WT) MuSCs for comparison. Loss of Cyclin D1 from quiescent young MuSCs resulted in broad transcriptomic changes (Fig. 4a). At a 10% FDR, 633 genes were differentially expressed between young(WT) and young(HET) MuSCs, and 530 genes were differentially expressed between young(WT) and young(KO) MuSCs. Indeed, Cyclin D1 deficiency caused the young MuSC transcriptome to resemble that of old MuSCs. GSEA showed that Cyclin D1 deletion resulted in the upregulation of some of the gene sets also upregulated with aging, such as TGFβ, IFNα/γ, and NF-κB/inflammatory gene sets, and, as with aging, the downregulation of cell cycle-promoting gene sets (Extended Data Fig. 7). Gene sets changed in Cyclin D1-deficient MuSCs that did not mimic aging included apical surface polarity and epithelial-mesenchymal transition gene sets.
Fig. 4 ∣. Cyclin D1 represses TGFβ signaling activity in quiescent MuSCs.
a, PCA of RNA-Seq profiles of MuSCs from young WT, HET, or KO mice (with respect to Ccnd1), or old WT mice. Each profile represents the MuSCs of an individual mouse. b, GSEA was performed with the Hallmark gene sets using the Ccnd1 correlation coefficients. Shown are the normalized enrichment score values for the negatively enriched sets. TGFβ signaling is labeled as the top negatively correlated gene set. c, Enrichment plot for the TGFβ signaling gene set. d, GSEA using experimentally determined TFT gene sets in the TRANSFAC/Harmonizome database. Smad3 is labeled as the transcription factor with the top negatively correlated TFT gene set. e, Enrichment plot for the Smad3 TFT gene set. f-g, Western blots on freshly isolated MuSCs to assess for activating C-terminal phosphorylation of Smad3. Each lane’s phospho-Smad3 level was normalized to Histone 3 and then to the grand mean of each blot; blots quantified in each figure contained equals numbers of each replicate type. f, MuSCs were from Y(−Ex), O(−Ex), and O(+Ex) mice. Shown is a representative blot and quantification of three blots. Each lane represents a pool of one to three mice (n=8 lanes per group). g, MuSCs were from WT(−Ex), HET(−Ex), and HET(+Ex) mice. Shown is a representative blot and quantification of two blots. Each lane represents MuSCs from one mouse (n=6 lanes per group). h-k, Mice were treated with TGFβ Receptor 1 inhibitor (LY, LY364947) or vehicle (Veh, DMSO) via intraperitoneal injection daily for five days. h, On the sixth day, FACS-isolated MuSCs were cultured and then fixed to analyze cell enlargement by staining for α-tubulin and quantifying cell area (n=3 for O(DMSO), 3 for O(LY364947), and 1 for Y(DMSO) mice). i-k, On the sixth day, MuSCs were isolated and cultured continuously with EdU to assess S-phase progression. i, n=6 for O(DMSO), 5 for O(LY364947), and 2 for Y(DMSO) mice. j, n=5 for HET(DMSO), 6 for HET(LY364947), and 6 for WT(DMSO) mice. k, n=5 for KO(DMSO), 8 for KO(LY364947), and 4 for WT(DMSO) mice. l, MuSCs isolated from old WT mice were treated with TGFβ Receptor 1 inhibitor (LY, LY364947) or vehicle (Veh, DMSO) for twelve hours. During the treatment, MuSCs were held in Tubastatin A (TubA) to maintain quiescence. MuSCs were then activated in the presence of EdU for two days by removing TubA (n=9 mice per group). ES, running enrichment score; NES, normalized enrichment score in c, e. Data are summarized with mean + s.e.m. *P<0.05; one-tailed unpaired t-test in f-g-l; two-tailed Welch’s t-test in h-k.
Because Cyclin D1 is present in non-cycling MuSCs, and because K112E Cyclin D1 induction restored old MuSC activation, we sought to identify potential non-canonical functions of Cyclin D1 in quiescent MuSCs. In terms of non-canonical roles beyond Rb inactivation, Cyclin D1 is known for repressing the activity of numerous transcription factors36,37, which was intriguing in light of the global transcriptome changes observed when Cyclin D1 was deleted from quiescent MuSCs. We therefore conducted a focused analysis of our RNA-Seq datasets with the following question: in the context of aging, exercise, and genetic deficiency of Cyclin D1, which transcription factors are repressed by Cyclin D1 in quiescent MuSCs? As our approach, we calculated the correlation of each gene’s expression level with the expression level of Cyclin D1 across all samples, weighting samples so that each group – young(WT)(−Ex), young(WT)(+Ex), old(WT)(−Ex), old(WT)(+Ex), young(HET)(−Ex), and young(KO)(−Ex) – contributed equally to the final correlation coefficient (Extended Data Fig. 8a). This generated a single list of genes and their correlation coefficients with Cyclin D1, allowing standard analysis by GSEA. We analyzed the Hallmark gene set collection and four independent collections of transcription factor target (TFT) genes, two based on binding determined in ChIP-Seq/ChIP-chip studies, and two based on computationally predicted motif presence (Extended Data Fig. 8b, c). The most prominent Hallmark gene set anticorrelated with Cyclin D1 was TGFβ signaling (Fig. 4b, c), which was matched by anticorrelation of Smad3 TFT gene sets (Fig. 4d, e and Extended Data Fig. 8c). Retrospective analysis of pairwise RNA-Seq data comparisons confirmed that the TGFβ signaling gene set was increased in old MuSCs compared to young MuSCs, HET MuSCs compared to WT MuSCs, and KO MuSCs compared to WT MuSCs, and was decreased in old(+Ex) MuSCs compared to old(−Ex) MuSCs (Extended Data Fig. 8d). We corroborated these results by analyzing the activating C-terminal phosphorylation of Smad3 in MuSCs in Western blots, finding that Smad3 activation was higher in old and genetically Cyclin D1-deficient MuSCs and was lower after exercise (Fig. 4f, g). Also anticorrelated with Cyclin D1 in these analyses was TNFα-NF-κB signaling, as well as TFT gene sets of transcription factors known or likely to be non-canonically regulated by Cyclin D1, such as the p65/RelA subunit of NF-κB, C/EBPβ, and Hif1α-ARNT31,38,39, and TFT gene sets of transcription factors involved in cellular stress and inflammation, such as Nrf2/NFE2L2, AhR, HSF1, and Atf2 (Extended Data Fig. 8b, c).
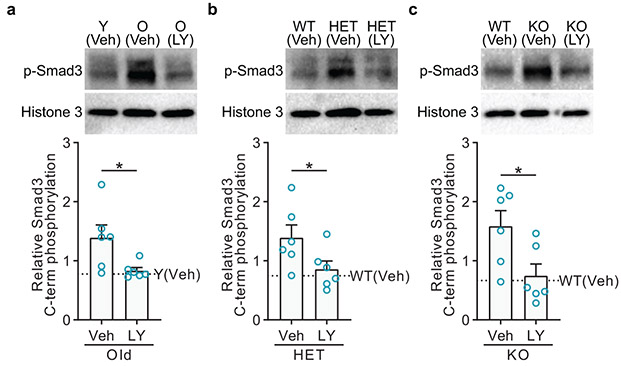
Because TGFβ signaling and Smad3 activity are strongly anticorrelated with Cyclin D1 levels in MuSCs in the context of aging and exercise, because Cyclin D1 is known in the literature to repress Smad326,40, and because excessive TGFβ signaling suppresses MuSC function41,42, we hypothesized that inhibition of TGFβ-Smad3 signaling would improve MuSC activation in genetically Cyclin D1-deficient MuSCs and in old MuSCs. Although TGFβ inhibition improves muscle repair in old mice41,42, the cellular targets responding to that inhibition have not been demonstrated. To suppress TGFβ-Smad3 signaling in quiescent MuSCs in vivo, we used the small-molecule LY364947, which inhibits TGFβ Receptor 1 and has been shown to act directly on the MuSC lineage in vitro41,43. Intraperitoneal administration of LY364947 inhibited Smad3 C-terminal phosphorylation in MuSCs (Extended Data Fig. 9a-c). LY364947 treatment of old mice resulted in improved activation of MuSCs as assayed by ex vivo cell enlargement and EdU incorporation (Fig. 4h, i). In addition, LY364947 treatment also improved the activation ability of young(HET) and young(KO) MuSCs (Fig. 4j, k), showing that the effects of loss of Cyclin D1 could be ameliorated by TGFβ-Smad3 signaling suppression. To test whether the inhibition of TGFβ signaling systemically might be acting directly on MuSCs, we treated MuSCs ex vivo with LY364947 and found that this accelerated their exit from quiescence (Fig. 4l). This repression of Smad3 by Cyclin D1 may be through linker phosphorylation by Cdk4, as has been shown40, direct binding, a common mechanism of action of Cyclin D136,37, or through indirect effects on TGFβ-Smad3 pathway components or other impinging pathways44. Together, these experiments show that Cyclin D1 is important for suppressing TGFβ signaling in quiescent MuSCs, although additional effects of inhibition of TGFβ signaling could also contribute to enhancement of MuSC function.
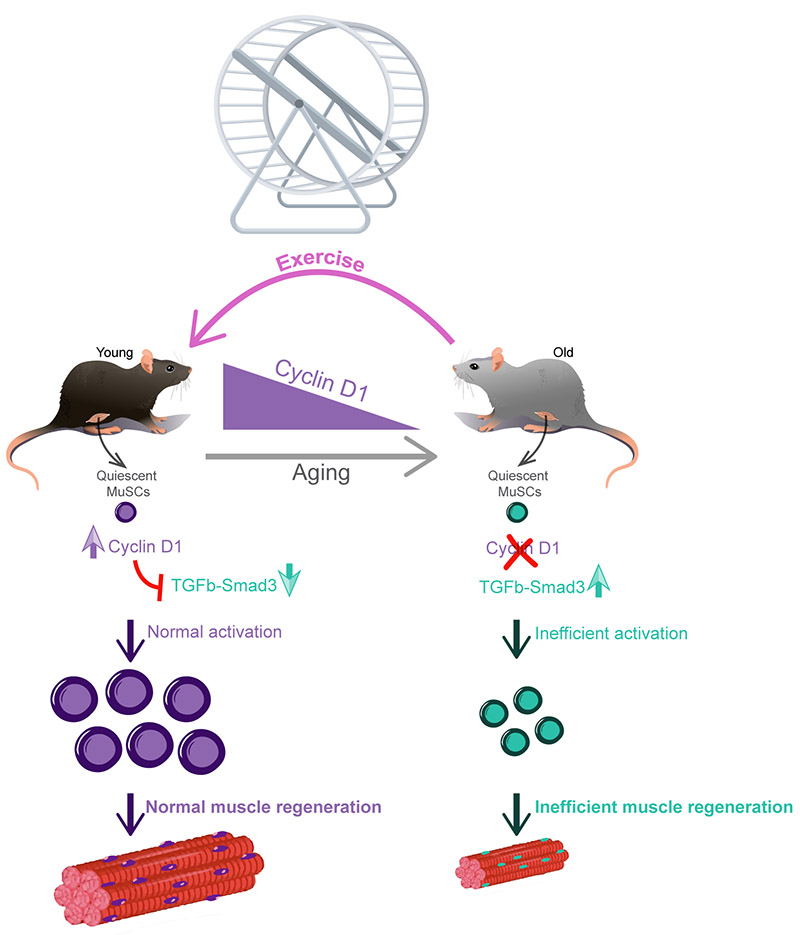
In conclusion, we show that voluntary, non-strenuous exercise accelerates muscle repair and improves MuSC function of old mice (Fig. 5). These improvements in MuSC activation ability hinge on the restoration back toward youthful levels of Cyclin D1, which in quiescent MuSCs is necessary and sufficient for prompt activation. Cyclin D1 expression is associated with restraint of the pro-aging TGFβ-Smad3 signaling axis. Thus, this work has uncovered a new practicable intervention for old MuSC rejuvenation, novel roles for Cyclin D1 in quiescent stem cells, and specific molecular circuits deranged in old MuSCs that can be ameliorated through exercise or pharmacologic intervention.
Fig. 5 ∣. Schematic of old MuSC rejuvenation by exercise.
Aging impairs MuSC activation, which encompasses the first MuSC division after stimulation and includes processes such as cell enlargement and DNA replication. Voluntary wheel running for three weeks in old mice restores MuSC activation ability and muscle regeneration. Mechanistically, this rejuvenation occurs through restoration of the expression of Cyclin D1 in quiescent MuSCs which plays a distinct role of preparing these cells for efficient activation. This function of Cyclin D1 in stem cell readiness for activation involves suppression of the pro-aging TGFβ-Smad3 signaling pathway during the quiescence state. Taken together, this work demonstrates that voluntary exercise is a practicable intervention for old MuSCs rejuvenation.
METHODS
Animals.
Animal procedures were approved by the Administrative Panel on Laboratory Animal Care of the VA Palo Alto Health Care System. Young C57BL/6J mice (strain 000664) and R26RYFP mice on the C57BL/6J background (strain 006148) were purchased from The Jackson Laboratory. NOD-SCID mice were purchased from Taconic Biosciences. Old C57BL/6N mice were obtained from Charles River Laboratories through the National Institute on Aging. Pax7CreER mice on the C57BL/6 x 129/SvJ background were kindly provided by Dr. Charles Keller (Oregon Health & Science University). Ccnd1flox mice on the C57BL/6J x 129/Sv background were kindly provided by Dr. Peter Sicinski (Dana-Farber Cancer Institute). TRE-Ccnd1WT and TRE-Ccnd1K112E mice on the FVB background were kindly provided by Dr. Richard Pestell (Thomas Jefferson University). Pax7rtTA mice were generated by genOway on the C57BL/6J background (details below). Mice were housed in specific pathogen-free conditions in barrier-protected rooms under a twelve-hour light-dark cycle and were fed ad libitum. All mice used for analysis were male. Young adult mice, Pax7CreER mice and Ccnd1flox mice were 3-4 months old, R26RYFP mice were either 4 or 20-22 months old, NOD-SCID mice were 4-5 months old, and old mice were 18-22 months old. When possible, littermate controls were used.
Exercise.
Mice were housed individually for three weeks in polycarbonate cages with 12.7 cm-diameter wheels equipped with optical rotation sensors (Lafayette Instrument Co. 80820). For non-exercised control mice housed with locked wheels, rubber brakes or cable ties were used to immobilize the wheels.
Muscle injury.
Mice were anesthetized with isoflurane. For regeneration assays, each TA muscle received 30 μL 1.2% barium chloride (Sigma) distributed over ten intramuscular punctures. For MuSC isolation, each lower hindlimb (TA and gastrocnemius muscles) received 50 μL barium chloride distributed over thirty intramuscular punctures. Mice then received routine post-operative buprenorphine analgesia and enrofloxacin antibiotic care.
MuSC isolation.
MuSC isolation by FACS was performed as previously described45,46 using surface antigen-based isolation (Extended Data Fig. 2e) and YFP-based isolation (Extended Data Fig. 6a), with the inclusion of DAPI (0.5 μg/mL) as a viability stain. Briefly, hindlimb and triceps muscles were harvested, thinly chopped with scissors, and digested using Collagenase II and Dispase (Invitrogen). MuSCs were then dissociated from the myofibers with a 20G needle and the resulting cellular suspension was filtered using 40-μm cell strainers. Sorters used for the final isolation of a pure MuSC population were Aria II and Aria III machines (BD Biosciences). YFP-based isolation was used in the transplant experiments and for all samples with the (WT), (HET), or (KO) descriptor; otherwise, MuSC isolations were done by immunophenotype-based sorting (CD31- CD45+ Sca1- VCAM+). Purity was routinely assessed by plating an aliquot of cells and fixing one hour later with 4% formaldehyde. These samples were then stained with antibodies to detect Pax7 (1:50, DSHB AB_528428) and, for YFP-based sorts, antibodies to detect YFP (10 μg/mL, Abcam ab13970).
MuSC transplantation.
At three months of age, Pax7CreER; R26RYFP mice received tamoxifen (80 mg/kg in 100% corn oil via intraperitoneal injection daily for seven days) to label MuSCs with YFP. Mice were then aged until use as MuSC donors. Host TA muscles of young NOD-SCID mice were injured one day before transplantation. Each muscle was transplanted with 10,000 freshly isolated YFP-positive MuSCs. Each transplant was performed in a volume of 20 μL over a single injection track using a Hamilton syringe (Gastight 1800 series), injecting at 0.1 μL/second. Ten days after transplantation, TA muscles were collected for analysis.
MuSC culture.
Unless otherwise indicated, MuSCs were cultured at 21,000 cells/cm2 in Ham’s F-10 media containing 10% horse serum, 100 U/mL penicillin, and 100 μg/mL streptomycin. MuSCs were plated on glass chamber slides coated with poly-D-lysine (0.1 mg/mL, EMD Millipore) and ECM (25 μg/mL, Sigma) for assays involving immunofluorescence or on plastic tissue-culture plates coated with ECM for assays involving time-lapse microscopy, cell volume measurements, RNA content measurements, or Western blot analysis.
Cyclin D1 knockdown in culture.
FACS-isolated MuSCs were plated at 40,000 cells/cm2 in Ham’s F-10 media containing 10% fetal bovine serum for immediate reverse transfection using Lipofectamine 2000 (Thermo Fisher) and Ccnd1-targeting or non-targeting SMARTpool ON-TARGETplus siRNAs (Dharmacon) at 50 nM. After four hours, media was changed to Ham’s F-10 media containing 10% horse serum, 100 U/mL penicillin, and 100 μg/mL streptomycin, with the addition of 10 μM EdU for S-phase entry assays.
Cyclin D1 overexpression in culture.
Ccnd1 human cDNA in the pDONR221 backbone was obtained from the Harvard PlasmID repository (HsCD00040407). EGFP cDNA in the pDONR221 backbone was obtained through Addgene as a gift from David Root (Addgene plasmid #25899), as was pLEX_306 (Addgene plasmid #41391). Using the Gateway recombination-based cloning system (Thermo Fisher), each cDNA was cloned into the pLEX_306 destination vector, which contains a PGK promoter and a C-terminal V5 tag. Final constructs were sequenced to confirm the absence of mutations. Ccnd1-V5 or GFP-V5 lentiviruses were produced in HEK 293T cells by co-transfecting the pLEX_306 vector with psPAX2 packaging and pMD2.G envelope plasmids (ratio 3:2:1). Viral supernatants at forty-eight and seventy-two hours were combined, filtered through 0.45-μm PVDF, and concentrated with the PEG-it Virus Precipitation Solution (System Biosciences). FACS-isolated MuSCs were plated at a density of 40,000 cells/cm2 in Ham’s F-10 media containing 10% horse serum, 100 U/mL penicillin, 100 μg/mL streptomycin, and 40 μM Tubastatin A (Cayman 10559). Tubastatin A is a derivative of tubacin, the HDAC inhibitor47. One hour after plating, cells were infected by adding equal volumes of viral concentrates and polybrene (10 μg/mL), performing spinoculation (2,550 g for one hour), and then washing twice with Tubastatin A-containing media. Subsequently, Tubastatin A-containing media was replaced daily. Seventy-two hours after infection, MuSCs were released from Tubastatin A by washing four times and then cultured in Ham’s F-10 media containing 10% horse serum, 100 U/mL penicillin, and 100 μg/mL streptomycin, with the addition of 10 μM EdU for S-phase entry assays. To assess S-phase entry, cells were then fixed after a further forty-eight hours. To assess infection efficiency, cells were fixed immediately at the end of the seventy-two hours and stained with antibodies against V5 (11.2 μg/mL, Thermo Fisher R960-25). To assess overexpression levels, cells were lysed immediately at the end of the seventy-two hours for the indicated assays.
Cyclin D1 deletion in MuSCs in vivo.
Mice with floxed alleles of Ccnd1 that generate null recombination alleles have been published previously30. Pax7CreER mice containing IRES followed by CreER knocked in to the 3’UTR of Pax7 have been published previously13. R26RYFP mice containing a transcription termination sequence flanked by loxP sites (loxP-stop-loxP) before EYFP in the Rosa26 locus have been published previously48. Lines were maintained as Pax7CreER/CreER; Ccnd1flox/flox, Pax7CreER/CreER; Ccnd1+/+, R26RYFP/YFP; Ccnd1flox/flox, and R26RYFP/YFP; Ccnd1+/+ mice. Experimental animals (Pax7CreER/+; R26RYFP/+; Ccnd1+/+, Pax7CreER/+; R26RYFP/+; Ccnd1flox/+, and Pax7CreER/+; R26RYFP/+; Ccnd1flox/flox) were generated by intercrossing appropriate lines and then confirming genotype by tail-tip PCR. Tamoxifen (Sigma) was administered to all animals at the ages indicated via intraperitoneal injection at 80 mg/kg in 100% corn oil daily for seven days. MuSCs were isolated based on YFP expression via FACS as described above.
Cyclin D1 overexpression in MuSCs in vivo.
TRE-Ccnd1WT and TRE-Ccnd1K112E mice transgenic for human Ccnd1 with or without the K112E mutation under TRE regulation have been published previously31,32. Pax7rtTA mice contain rtTA-M2 followed by an IRES, mouse Pax7, and polyadenylation tail knocked in to the first exon of the Pax7 locus. Both lines were maintained by breeding heterozygous animals to wild-type animals. Experimental animals (Pax7rtTA/+, Pax7rtTA/+; TRE-Ccnd1WT, and Pax7rtTA/+; TRE-Ccnd1K112E) were generated by intercrossing the two lines and aging the appropriate genotypes until use. All transgenic animals were treated for seven days with doxycycline by providing doxycycline hyclate chow (Envigo, TD.120769), delivering a daily dose of 2-3 mg doxycycline based on consumption of 4-5 grams each day. On the sixth and seventh days, doxycycline hyclate (Thermo Fisher ICN19895510) was injected intraperitoneally at 50 mg/kg in 0.9% NaCl. MuSCs were isolated on the eighth day based on immunophenotype via FACS as described above.
Serum transfers.
Serum was isolated from mice via post-mortem cardiac puncture and stored at -80°C until use. Recipient mice were all old(−Ex) animals and were injected via tail vein with 0.3 mL serum daily for three days before analysis on the fourth day.
TGFβ Receptor 1 inhibition.
LY364947 (Cayman) was dissolved in PBS containing 2% DMSO and administered via intraperitoneal injection daily for five consecutive days at 0.2 mg/kg. For vehicle control mice, injections consisted of PBS containing 2% DMSO. Analyses were conducted on the sixth day. For ex vivo experiments, MuSCs isolated from old WT mice were treated with TGFβ Receptor 1 inhibitor (LY364947 at 3.7 nM) or vehicle (Veh, DMSO) for twelve hours. During the treatment, MuSCs were held in Tubastatin A (TubA) to maintain quiescence. MuSCs were then activated in the presence of EdU for two days by removing TubA.
TA muscle histology.
To test for MuSC regenerative ability in transplantation assays, muscles were fixed with 0.5% formaldehyde for several hours, cryoprotected with 20% sucrose, and frozen. Transverse 7-μm sections were generated and stained for laminin using a rat anti-laminin α1 antibody (1:1000, EMD Millipore MAB1903) and for YFP using a rabbit anti-GFP antibody (10 μg/mL, Thermo Fisher A11122). DAPI was used to visualize nuclei. For each muscle, ten sections, collected at evenly spaced intervals along the rostro-caudal axis of the muscle, were analyzed in a blinded fashion for YFP-positive fiber area and number in Volocity software.
To test for MuSC quiescence after exercise, muscles were fresh-frozen in liquid nitrogen-cooled isopentane. Transverse 10-μm sections were generated, fixed with 2% formaldehyde, and stained for laminin using a rat anti-laminin α2 antibody (1.5 μg/mL, Abcam ab11576). After heat-induced epitope retrieval (HIER) as described49, antibodies against Ki67 (rabbit, 20 μg/mL, Abcam ab15580) and Pax7 (mouse, 1:50, DSHB AB_528428) or MyoD1 (mouse, 10 μg/mL, BD Biosciences 554130) were applied with the M.O.M. Basic Kit (Vector Laboratories). Briefly, immediately after laminin staining, samples were boiled for forty-five minutes in HIER buffer (10 mM sodium citrate, 0.05% Tween-20, pH 6.0). After this boiling step, samples were incubated with M.O.M. blocking buffer for two hours and stained overnight for either Ki67, Pax7, or MyoD1. DAPI was used to visualize nuclei. Images were quantified manually using Volocity. To assess for muscle inflammation and repair after exercise, muscles were fresh-frozen, sectioned, and fixed as described above. For macrophage detection, sections were stained with a rabbit anti-laminin antibody (1 μg/mL, Sigma L9393) and with an antibody against macrophages (rat anti-F4/80, 10 μg/mL, Thermo Fisher 14-4801-82). For eMHC detection, sections were first stained for laminin using a rat anti-laminin α2 antibody (1.5 μg/mL, Abcam ab11576). After HIER, an antibody against eMHC (mouse, 1:50, DSHB F1.652) was applied using the M.O.M. kit. DAPI was used to visualize nuclei. Images were quantified manually using Volocity.
To assess myofiber cross-sectional area after exercise, muscles were fixed, cryoprotected, and frozen as described above, and transverse 8-μm sections midway along the muscle proximal-distal axis were stained with hematoxylin and eosin. Average cross-sectional areas were determined by automatically quantifying the total fiber area with the SIOX segmentation plugin for ImageJ and manually counting the number of fibers.
To assess MuSC pool size after Cyclin D1 deletion from MuSCs, muscles were fixed, cryoprotected, and frozen as described above, and transverse 7-μm sections were stained for laminin using a rat anti-laminin α2 antibody (10 μg/mL, Abcam ab11576) and for YFP using a rabbit anti-GFP antibody (10 μg/mL, Thermo Fisher A11122). After HIER, antibodies against Pax7 (1:10, DSHB AB_528428) were applied with the M.O.M. Kit. DAPI was used to visualize nuclei. Pax7-positive cells and fiber numbers were quantified manually using Adobe Photoshop.
To assess for muscle regeneration after injury, injured TA muscles were fresh-frozen in liquid nitrogen-cooled isopentane. Transverse 7-μm sections were generated and fixed with 2% formaldehyde. Laminin was detected using a rabbit anti-laminin antibody (1 μg/mL, Sigma L9393). Regenerating myofibers were detected using a mouse anti-eMHC antibody (1 μg/mL, DSHB F1.652) applied with the M.O.M. Kit. DAPI was used to stain nuclei. Sections were imaged with a Zeiss Observer Z1 fluorescent microscope equipped with a Hamamatsu Orca-ER camera. Non-injured or non-muscle areas (areas with large myofibers lacking central nuclei or areas containing aponeurosis tissue) were manually excluded, and then the fraction of each area occupied by eMHC was quantified automatically using Volocity software (PerkinElmer).
MuSC flow cytometry.
To test for cell size and RNA content in quiescence, FACS-isolated MuSCs were immediately blocked for forty-five minutes at 37°C with Ham’s F-10 containing 10% horse serum and 10 μM Hoechst 33342 (Thermo Fisher), stained with 0.1 mg/mL Pyronin Y (Santa Cruz sc-203755) for fifteen minutes at 37°C in Ham’s F-10 containing 10% horse serum, and analyzed on an Aria III machine. Forward scatter values for cell size and PE or PE-Cy5 values for RNA content were normalized to the mean young(−Ex) level of each experiment.
To test cell size and RNA content in MuSCs exiting quiescence, FACS-isolated MuSCs were plated in Ham’s F-10 media containing 20% fetal bovine serum, 2.5 ng/mL bFGF (PeproTech), 100 U/mL penicillin, and 100 μg/mL streptomycin. Eighteen hours later (unless otherwise indicated), cells were trypsinized gently using TrypLE Select (Thermo Fisher). For cell size, cells were then immediately assayed with a Moxi Flow combined Coulter counter and flow cytometer (Orflo Technologies). For RNA content, MuSCs were stained with Hoechst 33342 and Pyronin Y as above.
To assess for cell survival, FACS-isolated MuSCs were grown for one day. Detached cells were collected and pooled with attached cells after gentle detachment with TrypLE Select. Cells were then stained with 7AAD (2.5 μg/mL, BioLegend) to mark dead cells and assayed on an Aria II machine.
MuSC immunocytochemistry.
To quantify Cyclin D1 protein expression, MuSCs were fixed with 4% formaldehyde and then stained with antibodies against Cyclin D1 (2 μg/mL, Abcam ab134175) and counterstained with DAPI. The mean fluorescence intensity over each DAPI-positive region was determined automatically with Volocity software. Background staining, calculated as the mean fluorescence intensity over the DAPI-negative area of each frame, was subtracted. To ensure equal cell numbers for the visualization of single-cell data distributions in graphs, the same number of cells, equal to that in the specimen with the fewest cells, was randomly sampled from each specimen using the “sample” function in R.
To assess for MyoD1 expression, MuSCs were fixed with 4% formaldehyde and then stained with antibodies against MyoD1 (mouse, 1:100, Dako M3512) and counterstained with DAPI. The fraction of MyoD1-positive cells was determined automatically using Volocity software.
In experiments where cell area was assessed by immunocytochemistry, FACS-isolated MuSCs were grown for eighteen hours and then fixed with 25°C 4% formaldehyde followed by -20°C methanol to preserve cytoskeletal architecture. Cells were stained using an antibody against α-tubulin (0.2 μg/mL, Sigma T6199) and counterstained with DAPI. Areas occupied by α-tubulin were quantified automatically using the contour functions (findContours, contourArea, and arcLength) of the OpenCV2 Python library.
S-phase entry.
To assess S-phase entry of MuSCs exiting quiescence in culture, FACS-isolated MuSCs were plated with 10 μM EdU (Thermo Fisher). After two days, cells were fixed and stained with the Click-iT EdU Imaging Kit (Thermo Fisher) and DAPI. The fraction of EdU-positive cells was determined automatically with Volocity software.
To assess S-phase entry of MuSCs after injury in vivo, lower hindlimb muscles were injured, and 1.5 days later, mice received 50 mg/kg EdU via intraperitoneal injection. After another twelve hours, MuSCs were FACS-isolated and fixed two hours after plating. Cells were then stained and quantified as described above.
To assess S-phase entry of MuSCs in the absence of injury in vivo, mice received 0.8 mg/mL EdU or BrdU (Sigma) in the drinking water along with 2% sucrose throughout the final week of exercise. MuSCs were then FACS-isolated and fixed two hours after plating. Cells were stained with an anti-BrdU antibody (5 μg/mL, Bio-Rad OBT0030G) or with the Click-iT EdU Imaging Kit. Cells were counterstained with DAPI. The fraction of BrdU-positive or EdU-positive cells was determined automatically using Volocity software.
Clonogenicity.
FACS-isolated MuSCs were immediately re-stained with DAPI to exclude dead cells and re-sorted as one cell per well into 96-well plates (Corning) coated with 1 μg/mL collagen (Sigma) and 10 μg/mL laminin (Thermo Fisher). Cells were cultured in Ham’s F-10 medium with 20% horse serum, 5 ng/mL bFGF, 100 U/mL penicillin, and 100 μg/mL streptomycin for six days, with bFGF replenished daily50. Cells were then stained with Hoechst 33342 (2 ng/mL) and CellTracker Green CMFDA (1 μM, Thermo Fisher) to aid visualization, fixed, and counted.
Motility and time to first division.
MuSCs were plated at 7,800 cells/cm2 to facilitate single-cell tracking. After allowing the cells to adhere overnight, plates were transferred to a Zeiss Axiophot 200M microscope coupled to an AxioCam and maintained at 37°C in 5% carbon dioxide. Images were captured every ten minutes. Cells were segmented with iTrack4U51. For motility, segmented images were stabilized with the Image Stabilizer plugin for ImageJ and tracked with the wrMTrck plugin for ImageJ52 to determine the average distance traversed by all the cells of an image frame between sequential image frames. The median velocity in each well, and then the mean of the technical replicate wells for each mouse, was used to calculate biological replicate motility values. For division times, segmented images were analyzed with the Baxter Laboratory KTH-SE cell tracking program53 (www.codesolorzano.com/Challenges/CTC/KTH-SE_2013.html) to determine over time the fraction of cells present in the first image frame, excluding the cells that migrated out of the frame, that had completed cytokinesis. The mean of the technical replicate wells for each mouse was used to calculate biological replicate first division times.
RNA-Seq.
FACS-purified quiescent MuSCs from individual mice were snap-frozen, and RNA was extracted with the Nucleospin RNA XS kit (Machery-Nagel). RNA (10 ng) was reverse transcribed using oligo(dT) priming with the SMARTer Ultra Low Input system (Takara). The cDNA was then sheared with a Covaris S2 ultrasonicator. End repair, multiplexed adaptor ligation, and 13-15 cycles of library amplification were performed using the Ovation Ultralow Multiplex system (NuGEN). Libraries underwent paired-end 101-bp sequencing at the Stanford Genome Sequencing Service Center with an Illumina HiSeq 2000 to a depth of 20-40 million reads.
For RNA-Seq processing, reads were adapter- and quality-trimmed with trim_galore (www.bioinformatics.babraham.ac.uk/projects/trim_galore) (quality cutoff 20, adaptor stringency 1, final length filter 50). Trimmed reads were mapped to mm10 (Ensembl release 89, no patches) using transcript annotations from GENCODE with STAR54 (mismatch cutoff 4% of read length, no non-canonical junction alignments). Exonic reads that mapped uniquely (~70% of total reads) were summarized over genes with the featureCounts module of the Subread package55.
For RNA-Seq gene expression analysis, genes lacking an Entrez ID or lacking a raw FPKM value of at least 1.5 in at least three samples were filtered out, resulting in 11,337 genes. Raw count data were then normalized for library preparation and sample collection batch effects using RUVs56 (variation factors k=6). Differential gene expression analysis was performed for genes with a normalized FPKM value of at least 6 in at least three samples using edgeR57, with Cox-Reid estimations of tagwise dispersions and negative binomial GLM likelihood ratio tests. The Benjamini-Hochberg FDR control for multiple hypothesis testing was used to produce q-values. GSEA58 for coherent biological processes was performed using the MSigDB Hallmark gene sets59 (enrichment statistic p=1, ranking metric Signal2Noise, expressed gene set size range 15-500, which excluded only HALLMARK PANCREAS BETA CELLS). FDR q-values were calculated by gene permutation.
For the Ccnd1 correlation analysis, Ccnd1 Pearson correlation coefficients were calculated using log-transformed post-normalization FPKM values, using the “weights” package in R (https://CRAN.R-project.org/package=weights). To give each replicate group equal contribution to the correlation coefficient, sample weights were assigned to be 1/(group size). GSEA was performed in Pre-Ranked mode (enrichment statistic p=1, ranking metric Ccnd1 Pearson correlation coefficient). The Hallmark gene sets size range was 15-500. TFT gene sets were the TRANSFAC Curated gene sets60,61, the MotifMap gene sets62, and the ChEA gene sets63, all obtained from the Harmonizome database64, and the MSigDB TFT gene sets65, with size range 25-2100. For these TFT gene sets, multiple hypothesis testing was minimized by pre-analysis exclusion of gene sets associated with non-transcription factors or transcription factors that had no or minimal expression (no RNA-Seq FPKM greater than six in any young(WT)(−Ex) or old(WT)(−Ex) MuSC profile). FDR q-values were calculated by gene permutation.
Immunoblotting.
Equal numbers of MuSCs from pools of one to four mice were lysed in Laemmli buffer (3% SDS, 15% glycerol, 0.5% 2-mercaptoethanol, 0.015% bromophenol blue, 100 mM Tris-Cl pH 6.8) followed by boiling and centrifugation. Supernatants containing whole-cell extracts were resolved by SDS-PAGE and then transferred to PVDF membranes and stained with antibodies to detect the following proteins: Cyclin D1 (0.2 μg/mL, Abcam ab134175), Smad2/3 phosphorylated at the C-terminus (1:200, BD Biosciences 624084), Gapdh (1 μg/mL, Thermo Fisher AM4300), and Histone 3 (1:10,000, EMD Millipore 07-690). Bands were detected with WesternBright Sirius or Quantum ECL reagents (Advansta) and imaged with a ChemiDoc XRS+ (Bio-Rad). Intensities were quantified with ImageJ and normalized first to Gapdh or Histone 3 and then the mean young(WT)(−Ex) level of each blot unless otherwise indicated.
RT-qPCR.
RNA was isolated using the RNeasy Plus Micro Kit (Qiagen) and reverse transcribed using the High-Capacity cDNA Reverse Transcription Kit (Thermo Fisher). Quantitative PCR was performed with the LightCycler 480 I SYBR Green PCR Master Mix (Roche). Technical triplicate or duplicate Ct values were averaged and normalized to the mean of Gapdh, Hprt, and Actb1 housekeeping transcript values. Within each experiment, expression levels were normalized to the mean young(WT)(−Ex) level. Primer sequences were, from 5’ to 3’:
Ccnd1: AGACCATTCCCTTGACTGC, AAGCAGTTCCATTTGCAGC
Sbk2: TGGGGACCTAATCACCTTCATC, GCCATGCGAGTGAATGTGT
Mest: CTCCAGAACCGCAGAATCAAC, AGATACCTCCATTCGACAGACAG
Popdc2: GTGTCCGGGTGAATACCCTC, CAGCGTCAAGACCTGCTCA
Dag1: CTTGAGGCGTCCATGCACT, GGCAATTAAATCCGTTGGAATGC
Gapdh: TCAAGAAGGTGGTGAAGCAG, GTTGAAGTCGCAGGAGACAA
Hprt: CAGTACAGCCCCAAAATGGTTA, AGTCTGGCCTGTATCCAACA
Actb1: GATCATTGCTCCTCCTGAGC, ACATCTGCTGGAAGGTGGAC
Single-molecule RNA-FISH.
FACS-isolated MuSCs were immediately re-stained with DAPI and re-sorted to minimize debris. Cells were cytospun onto glass slides coated with poly-D-lysine and ECM and prepared for smFISH as described previously66. Briefly, cells were fixed with 4% formaldehyde and permeabilized with 70% ethanol overnight at 4°C. Cells were equilibrated in 10% formamide and stained overnight with a library of forty-eight Stellaris RNA-FISH probes (Biosearch Technologies) specific to Ccnd1. Cells were washed, mounted in 2X SSC Buffer, and counterstained with DAPI. Images were deconvolved with Volocity software, and transcript counts were quantified with FISH-quant67. The same number of cells was randomly sampled from each specimen as described in the “MuSC immunocytochemistry” section.
Single-cell RT-qPCR.
FACS-isolated MuSCs immediately re-stained with DAPI and re-sorted as one cell per well into 96-well plates prepared with the CellsDirect One-Step qRT-PCR Kit (Thermo Fisher). Primers were added, and reverse transcription followed by twenty cycles of pre-amplification was performed. Reactions were then treated with Exonuclease I (NEB) to remove primers and diluted ten-fold. Primers for qPCR were prepared with Assay Loading Reagent (Fluidigm), SsoFast EvaGreen SuperMix with Low ROX (Bio-Rad), and DNA Binding Dye Sample Loading Reagent (Fluidigm) in 48.48 Dynamic Array IFC chips (Fluidigm). Samples were added to each PCR mixture, and qPCR was conducted with the IFC Controller MX in the BioMark System (Fluidigm). Primer sequences were, from 5’ to 3’:
Ccnd1: GCCGAGAAGTTGTGCATCTA, GTTCACCAGAAGCAGTTCCA
Gapdh: TCAAGAAGGTGGTGAAGCAG, GTTGAAGTCGCAGGAGACAA
Statistics.
No statistical methods were used to predetermine sample size. The experiments were not randomized, and the investigators were not blinded to allocation during experiments and outcome assessment. For unpaired experiments, data points represent biological replicates and are summarized with a column showing the mean and an error bar showing the s.e.m., except for experiments analyzing single cells, for which data are summarized with a box-and-whisker plot (indicating the min, 25th percentile, median, 75th percentile, and max) and a “+” showing the mean. For paired experiments, each individual sample is shown as a pair of points connected between the different conditions. Groups were compared in unpaired experiments using two-tailed Welch’s t-tests or, for non-parametric data, two-tailed Mann-Whitney U-tests. When in specific follow-up experiments the null hypothesis clearly included differences in one direction, one-tailed tests were used. When the same sample was split into two conditions, two-tailed paired t-tests were used; when the effect was that of a fold-change rather than a change in absolute values, two-tailed ratio paired t-tests were used. Specific data representation details and statistical procedures are also indicated in the figure legends.
Reporting Summary.
Detailed information on experimental design and reagents can be found on the Nature Research Reporting Summary associated with this article.
Extended Data
Extended Data Fig. 1. Effects of voluntary wheel running on muscle.
a, Non-strenuous voluntary exercise by wheel running in mice. Young or old mice are provided access to a freely rotating wheel or to a locked wheel as a control. Three weeks later, muscles are either assayed with MuSCs in their quiescent state, without injury or MuSC isolation, or assayed for MuSC exit from quiescence, induced by experimental injury or MuSC isolation into culture.
b, Throughout the final week of locked wheel (−Ex) or free wheel (+Ex) access, thymidine analog (EdU or BrdU) was administered continuously in the drinking water. MuSCs were FACS-isolated and immediately fixed for EdU staining. For comparison, also shown are the results from young mice receiving muscle injury at the time of onset of labeling (n=12 for Y(−Ex), 6 for Y(+Ex), 9 for O(−Ex), 9 for O(+Ex), and 2 for Inj mice).
c, FACS-isolated MuSCs were assayed for cell size based on forward scatter in flow cytometry. For comparison, also shown are results from young muscles injured three days prior to analysis. Data were normalized to the mean injured level in each experiment (n=5 for Y(−Ex), 5 for Y(+Ex), 6 for O(−Ex), 6 for O(+Ex), and 3 for Inj mice).
d, FACS-isolated MuSCs were assayed for RNA content based on Pyronin Y intensity in flow cytometry. For comparison, also shown are results from young muscles injured three days prior to analysis. Data were normalized to the mean injured level in each experiment (n=5 for Y(−Ex), 5 for Y(+Ex), 6 for O(−Ex), 6 for O(+Ex), and 3 for Inj mice).
e, FACS-isolated MuSCs were assayed for MyoD expression based on immunocytochemistry. For comparison, also shown are results from young muscles partially injured three days prior to analysis (n=3 for Y(−Ex), 3 for Y(+Ex), 3 for O(−Ex), 3 for O(+Ex), and 1 for Inj mice).
f-h, TA muscles were sectioned and assayed for MyoD-expressing cells (f), Ki67-expressing cells (g), and Pax7-expressing cells (h) by immunohistochemistry. For comparison, also shown are results from young muscles injured seven days prior to analysis (n=3 mice per group).
i, TA muscle cross-sections were stained with H&E. Representative images (quantified in (j) are shown).
j, The mean CSA of myofibers was quantified (n=8 mice per group).
k, For each mouse, left and right TA muscles were isolated and their weights averaged (n=6 for Y(−Ex), 6 for Y(+Ex), 5 for O(−Ex), and 5 for O(+Ex) mice).
l-n, TA muscles were sectioned and assayed for macrophages expressing F4/80 (l), regenerating myofibers expressing eMHC (m), and regenerating myofibers with central nuclei (n) by immunohistochemistry. For comparison, also shown are results from muscles injured seven days prior to analysis (n=3 mice per group).
Scale bar in a, 100 μm. Data are summarized with mean + s.e.m. NS, not significant; *P<0.05; two-tailed Welch’s t-test in b-h, j-n.
Extended Data Fig 2. Exercise improves multiple aspects of old MuSC regenerative ability.
a-d, Exercise and muscle injury were performed as in Fig. 1a. After either four days (a), five days (b) or twenty-eight days (c-d), muscles were isolated and stained to examine regeneration. a-b, Muscles were sectioned and assayed for eMHC+ myofibers (a, n=7 for Y(−Ex), 5 for Y(+Ex), 7 for O(−Ex), and 4 for O(+Ex) mice. b, n=4 for Y(−Ex), 7 for O(−Ex), and 8 for O(+Ex) mice. Y(+Ex) at five days was not done (N.D.)). c-d, Twenty-eight days post-injury (dpi), the mean cross-sectional areas (CSA) of myofibers (c) and the number of Pax7-expressing cells (d) were quantified (n=3 mice per group).
e, Gating strategy for FACS isolation of MuSCs, following a published protocol24,25. Purity of isolated MuSCs is >98% as assessed by routine staining for Pax7 of cells fixed one hour after plating.
f, FACS-isolated MuSCs were cultured for eighteen hours and then analyzed for RNA content by flow cytometry based on Pyronin Y staining (n=6 mice per group).
g, FACS-isolated MuSCs were tracked by time-lapse microscopy to determine time to first division (n=7 for O(−Ex), 7 for O(+Ex), and 5 for Y(−Ex) mice).
h, FACS-isolated MuSCs were tracked by time-lapse microscopy to determine the distance migrated by each cell between serial images (n=7 for O(−Ex), 7 for O(+Ex), and 5 for Y(−Ex) mice).
i, FACS-isolated MuSCs were cultured for one day and then stained with 7AAD to determine viability by flow cytometry. Shown is the gating strategy for analysis and the quantification of the fraction of dead cells (n=3 mice per condition).
Scale bar in e, 50 μm. Data are summarized with mean + s.e.m. *P<0.05; one-tailed Welch’s t-test in a-d, f-i.
Extended Data Fig. 3. The exercise-induced improvement in old MuSC activation gradually subsides after exercise cessation.
a, Mice were given no access or free access to a running wheel, followed by wheel removal for zero, one, or two weeks. The onset of exercise was staggered so that MuSC isolation was performed at the same time for all groups.
b, FACS-isolated MuSCs were cultured continuously in EdU to assess S-phase progression (n=8 for O(−Ex), 7 for O(+Ex)(0 wk), 8 for O(+Ex)(1 wk), and 3 for O(+Ex)(2 wk) mice). Data are summarized with mean + s.e.m. *P<0.05; two-tailed Welch’s t-test in b.
Extended Data Fig. 4. The exercise-induced improvement in old MuSC activation is transferable through serum.
a, Old recipient mice that had never exercised received three consecutive daily tail-vein injections with serum collected from old non-exercising or exercising mice. MuSCs were isolated from recipient mice one day after the last injection.
b, FACS-isolated MuSCs were cultured continuously in EdU to assess S-phase progression (n=8 recipient mice for O(−Ex), comprising 4, 3, and 1 recipients for three different serum pools, and n=6 recipient mice for O(+Ex), comprising 3, 2, and 1 recipients for three different serum pools). Data are summarized with mean + s.e.m. *P<0.05; two-tailed Mann-Whitney U-test in b.
Extended Data Fig. 5. Transcriptional effects of aging and exercise in quiescent MuSCs.
a, RT-qPCR in MuSCs from mice independent of those used in the RNA-Seq experiment. Ct values were normalized first to the mean of Gapdh, Hprt, and Actb1 and then to the mean Y(−Ex) level in each experiment, with Y(−Ex) shown as a dotted line at relative expression 1.0 for comparison (n=13 for O(−Ex), 14 for O(+Ex), and 13 for Y(−Ex) mice).
b, GSEA results for the Hallmark gene sets in comparisons of RNA-Seq profiles for O(−Ex) vs. Y(−Ex), O(+Ex) vs. O(−Ex), and Y(+Ex) vs. Y(−Ex) MuSCs. Gene sets are in descending order based on the O(+Ex) vs. O(−Ex) NES.
c, Enrichment plots for the INFLAMMATORY RESPONSE gene set.
d, Single-cell RT-qPCR for Ccnd1 in freshly isolated MuSCs. For comparison, also shown are results for young MuSCs isolated three days after injury. The pairs on each chip were O(−Ex) vs. O(+Ex) and Y(−Ex) vs. Injured (n=24 cells from one mouse in each group).
Data are summarized with mean and s.e.m. in a, box-and-whisker plots (bottom whisker, min; box bottom, 25th percentile; box middle, median; box top, 75th percentile; top whisker, max; “+”, mean) in d. NES, normalized enrichment score in b, c; ES, running enrichment score; S2N, GSEA Signal2Noise ranking metric in c. *P<0.05; two-tailed Welch’s t-test in a, d.
Extended Data Fig. 6. Characterization of Cyclin D1 reduction and expression in MuSCs.
a, Gating strategy for FACS isolation of YFP+ MuSCs after tamoxifen administration to transgenic mice. Shown are MuSC yields in terms of the percentage of size- and doublet-gated cells that are YFP+DAPI−; NS, WT vs. HET and WT vs. KO (n values represent individual mice). Purity of isolated MuSCs is >94% or >98% as assessed by routine staining and quantification of YFP or Pax7, respectively, of cells fixed one hour after plating.
b, TA muscles were isolated from twelve-month-old mice that had received tamoxifen injections at three months of age. Muscle sections were stained for Pax7 to identify MuSCs, YFP to identify recombined cells, and laminin to delimit muscle fibers and MuSCs from the interstitium. No MuSCs or YFP+ cells were identified in the interstitium, and no YFP+ cells were Pax7−. The MuSC pool was quantified by counting Pax7+ cells in sections (n=3 mice per group).
c, FACS-isolated MuSCs were cultured continuously in the presence of EdU to assess S-phase progression (n=4 for HET(−Ex), 6 for HET(+Ex), 5 for KO(−Ex), 5 for KO(+Ex), and 6 for WT(−Ex) mice).
d, To confirm maintenance of ex vivo quiescence by TubA, MuSCs were kept in culture for three days either in quiescence (with TubA) or during activation (with DMSO vehicle) in the continuous presence of EdU and then fixed for analysis. MuSCs were then released for two days in the presence of EdU by removing TubA. MuSCs were then fixed for analysis of exit from quiescence (n=3 mice per condition).
e, MuSCs were infected as in Fig. 3j for three days and then harvested for Western blot. Each lane represents a pool of three to six mice split into the two infection conditions.
f, MuSCs infected as in Fig. 3j were harvested for RT-qPCR analysis (n=3 mice per group).
Scale bar in a, 50 μm, in b, 10 μm. Data are summarized with mean + s.e.m. NS, not significant; *P<0.05; two-tailed Welch’s t-test in a-c, one-tailed Welch’s t-test in d, one-tailed ratio paired t-test in f.
Extended Data Fig. 7. Gene sets altered by Cyclin D1 reduction and by aging in MuSCs.
a, GSEA results for the Hallmark gene sets in comparisons of RNA-Seq profiles for Y(HET) vs. Y(WT), Y(KO) vs. Y(WT), and O(WT) vs. Y(WT) MuSCs. Gene sets are in ascending order based on the mean NES.
b, Enrichment plots for gene sets representing cell cycle genes (E2F TARGETS) and inflammation genes (INFLAMMATORY RESPONSE).
NES, normalized enrichment score in a, b; ES, running enrichment score; S2N, GSEA Signal2Noise ranking metric in b.
Extended Data Fig. 8. TGFβ-Smad3 activity is anti-correlated with Ccnd1 in MuSCs.
a, For each gene in the RNA-Seq datasets, a weighted correlation coefficient against Ccnd1 was calculated across all samples. Shown are examples of negative, zero, and positive correlations, in which expression is plotted in log scale and point size conveys sample weight.
b, GSEA results for the Hallmark gene sets using the Ccnd1 correlation coefficient of each gene across all samples. Gene sets are in ascending order based on NES.
c, GSEA results for TFT gene sets obtained from the Harmonizome database that are experimentally determined (TRANSFAC and ChEA) and computationally predicted (MSigDB and MotifMap). Shown are the top twelve anticorrelated gene sets based on NES for each gene set collection (total gene sets screened: 72 for TRANSFAC, 74 for ChEA, 140 for MSigDB, and 34 for MotifMap). Smad3 is highlighted in each collection.
d, Enrichment plots for the Hallmark gene set TGF BETA SIGNALING in each of the previously mentioned RNA-Seq comparisons.
NES, normalized enrichment score in b-d; ES, running enrichment score; S2N, GSEA Signal2Noise ranking metric in d.
Extended Data Fig. 9. TGFβ-Smad3 activity in MuSCs with aging, Cyclin D1 deficiency, and pharmacologic modulation.
a-c, Western blots on freshly isolated MuSCs to assess for activating C-terminal phosphorylation of Smad3. Each lane’s phospho-Smad3 level was normalized first to Histone 3 and then to the grand mean of each blot; blots quantified in each figure contained equals numbers of each replicate type.
a, MuSCs were from Y(Veh), O(Veh), and O(LY) mice. Shown is a representative blot and quantification of two blots. Each lane represents MuSCs from one mouse (n=6 lanes per group).
b, MuSCs were from WT(Veh), HET(Veh), and HET(LY) mice. Shown is a representative blot and quantification of two blots. Each lane represents MuSCs from one mouse (n=6 lanes per group).
c, MuSCs were from WT(Veh), KO(Veh), and KO(LY) mice. Shown is a representative blot and quantification of two blots. Each lane represents MuSCs from one mouse (n=6 lanes per group). *P<0.05; one-tailed Mann-Whitney U-test in a-e.
Supplementary Material
Acknowledgements
We thank Joseph T. Rodgers, Ling Liu, and Zurine De Miguel for intellectual support, and Mark Wagner and Igor Akimenko for technical assistance. This work was supported by funding from the Stanford University School of Medicine Medical Scientist Training Program (T32 GM007365) and CIRM Scholar Training Program (TG2 01159) to J.O.B., funding from the NIH (TR01 AG047820) to T.W-C. and T.A.R., and funding from the Glenn Foundation for Medical Research, the NIH (P01 AG036695, R37 AG023806, and R01 AR062185), and the Department of Veterans Affairs (Merit Review) to T.A.R.
Footnotes
Data availability. The data that support the findings of this study are available from the corresponding author upon request. RNA-Seq data have been deposited in the NCBI Gene Expression Omnibus with the accession code GSE77178.
Competing interests The authors declare no competing interests.
REFERENCES
- 1.Sherwin C Voluntary wheel running: a review and novel interpretation. Anim. Behav 56, 11–27 (1998). [DOI] [PubMed] [Google Scholar]
- 2.van Praag H, Shubert T, Zhao C & Gage FH Exercise enhances learning and hippocampal neurogenesis in aged mice. J. Neurosci. Off. J. Soc. Neurosci 25, 8680–8685 (2005). [DOI] [PMC free article] [PubMed] [Google Scholar]
- 3.Abreu P, Mendes SVD, Ceccatto VM & Hirabara SM Satellite cell activation induced by aerobic muscle adaptation in response to endurance exercise in humans and rodents. Life Sci. 170, 33–40 (2017). [DOI] [PubMed] [Google Scholar]
- 4.Kurosaka M, Naito H, Ogura Y, Machida S & Katamoto S Satellite cell pool enhancement in rat plantaris muscle by endurance training depends on intensity rather than duration. Acta Physiol. Oxf. Engl 205, 159–166 (2012). [DOI] [PubMed] [Google Scholar]
- 5.Dungan CM et al. Elevated myonuclear density during skeletal muscle hypertrophy in response to training is reversed during detraining. Am. J. Physiol. Cell Physiol 316, C649–C654 (2019). [DOI] [PMC free article] [PubMed] [Google Scholar]
- 6.Egner IM, Bruusgaard JC & Gundersen K Satellite cell depletion prevents fiber hypertrophy in skeletal muscle. Dev. Camb. Engl 143, 2898–2906 (2016). [DOI] [PubMed] [Google Scholar]
- 7.Kadi F, Johansson F, Johansson R, Sjöström M & Henriksson J Effects of one bout of endurance exercise on the expression of myogenin in human quadriceps muscle. Histochem. Cell Biol 121, 329–334 (2004). [DOI] [PubMed] [Google Scholar]
- 8.Begue G et al. Early activation of rat skeletal muscle IL-6/STAT1/STAT3 dependent gene expression in resistance exercise linked to hypertrophy. PloS One 8, e57141 (2013). [DOI] [PMC free article] [PubMed] [Google Scholar]
- 9.Fujimaki S, Hidaka R, Asashima M, Takemasa T & Kuwabara T Wnt protein-mediated satellite cell conversion in adult and aged mice following voluntary wheel running. J. Biol. Chem 289, 7399–7412 (2014). [DOI] [PMC free article] [PubMed] [Google Scholar]
- 10.Conboy IM et al. Rejuvenation of aged progenitor cells by exposure to a young systemic environment. Nature 433, 760–764 (2005). [DOI] [PubMed] [Google Scholar]
- 11.Cosgrove BD et al. Rejuvenation of the muscle stem cell population restores strength to injured aged muscles. Nat. Med 20, 255–264 (2014). [DOI] [PMC free article] [PubMed] [Google Scholar]
- 12.Price FD et al. Inhibition of JAK-STAT signaling stimulates adult satellite cell function. Nat. Med 20, 1174–1181 (2014). [DOI] [PMC free article] [PubMed] [Google Scholar]
- 13.Nishijo K et al. Biomarker system for studying muscle, stem cells, and cancer in vivo. FASEB J. Off. Publ. Fed. Am. Soc. Exp. Biol 23, 2681–2690 (2009). [DOI] [PMC free article] [PubMed] [Google Scholar]
- 14.Schultz E & Lipton BH Skeletal muscle satellite cells: changes in proliferation potential as a function of age. Mech. Ageing Dev 20, 377–383 (1982). [DOI] [PubMed] [Google Scholar]
- 15.Conboy IM, Conboy MJ, Smythe GM & Rando TA Notch-mediated restoration of regenerative potential to aged muscle. Science 302, 1575–1577 (2003). [DOI] [PubMed] [Google Scholar]
- 16.Rao SS & Kohtz DS Positive and negative regulation of D-type cyclin expression in skeletal myoblasts by basic fibroblast growth factor and transforming growth factor beta. A role for cyclin D1 in control of myoblast differentiation. J. Biol. Chem 270, 4093–4100 (1995). [DOI] [PubMed] [Google Scholar]
- 17.Skapek SX, Rhee J, Spicer DB & Lassar AB Inhibition of myogenic differentiation in proliferating myoblasts by cyclin D1-dependent kinase. Science 267, 1022–1024 (1995). [DOI] [PubMed] [Google Scholar]
- 18.Panda AC et al. Novel RNA-binding activity of MYF5 enhances Ccnd1/Cyclin D1 mRNA translation during myogenesis. Nucleic Acids Res. 44, 2393–2408 (2016). [DOI] [PMC free article] [PubMed] [Google Scholar]
- 19.Ju X et al. Identification of a cyclin D1 network in prostate cancer that antagonizes epithelial-mesenchymal restraint. Cancer Res. 74, 508–519 (2014). [DOI] [PMC free article] [PubMed] [Google Scholar]
- 20.Pauklin S, Madrigal P, Bertero A & Vallier L Initiation of stem cell differentiation involves cell cycle-dependent regulation of developmental genes by Cyclin D. Genes Dev. 30, 421–433 (2016). [DOI] [PMC free article] [PubMed] [Google Scholar]
- 21.Zou P et al. p57(Kip2) and p27(Kip1) cooperate to maintain hematopoietic stem cell quiescence through interactions with Hsc70. Cell Stem Cell 9, 247–261 (2011). [DOI] [PubMed] [Google Scholar]
- 22.Chaves-Ferreira M et al. The cyclin D1 carboxyl regulatory domain controls the division and differentiation of hematopoietic cells. Biol. Direct 11, 21 (2016). [DOI] [PMC free article] [PubMed] [Google Scholar]
- 23.Jeselsohn R et al. Cyclin D1 kinase activity is required for the self-renewal of mammary stem and progenitor cells that are targets of MMTV-ErbB2 tumorigenesis. Cancer Cell 17, 65–76 (2010). [DOI] [PMC free article] [PubMed] [Google Scholar]
- 24.Ma J et al. Proliferation and differentiation of neural stem cells are selectively regulated by knockout of cyclin D1. J. Mol. Neurosci. MN 42, 35–43 (2010). [DOI] [PubMed] [Google Scholar]
- 25.Bizen N et al. A growth-promoting signaling component cyclin D1 in neural stem cells has antiastrogliogenic function to execute self-renewal. Stem Cells Dayt. Ohio 32, 1602–1615 (2014). [DOI] [PubMed] [Google Scholar]
- 26.Pauklin S & Vallier L The cell-cycle state of stem cells determines cell fate propensity. Cell 155, 135–147 (2013). [DOI] [PMC free article] [PubMed] [Google Scholar]
- 27.Quelle DE et al. Overexpression of mouse D-type cyclins accelerates G1 phase in rodent fibroblasts. Genes Dev. 7, 1559–1571 (1993). [DOI] [PubMed] [Google Scholar]
- 28.Resnitzky D, Gossen M, Bujard H & Reed SI Acceleration of the G1/S phase transition by expression of cyclins D1 and E with an inducible system. Mol. Cell. Biol 14, 1669–1679 (1994). [DOI] [PMC free article] [PubMed] [Google Scholar]
- 29.Kim HA et al. A developmentally regulated switch directs regenerative growth of Schwann cells through cyclin D1. Neuron 26, 405–416 (2000). [DOI] [PubMed] [Google Scholar]
- 30.Choi YJ et al. The requirement for cyclin D function in tumor maintenance. Cancer Cell 22, 438–451 (2012). [DOI] [PMC free article] [PubMed] [Google Scholar]
- 31.Casimiro MC et al. ChIP sequencing of cyclin D1 reveals a transcriptional role in chromosomal instability in mice. J. Clin. Invest 122, 833–843 (2012). [DOI] [PMC free article] [PubMed] [Google Scholar]
- 32.Casimiro MC et al. Kinase-independent role of cyclin D1 in chromosomal instability and mammary tumorigenesis. Oncotarget 6, 8525–8538 (2015). [DOI] [PMC free article] [PubMed] [Google Scholar]
- 33.Hinds PW, Dowdy SF, Eaton EN, Arnold A & Weinberg RA Function of a human cyclin gene as an oncogene. Proc. Natl. Acad. Sci. U. S. A 91, 709–713 (1994). [DOI] [PMC free article] [PubMed] [Google Scholar]
- 34.Du Z, Tong X & Ye X Cyclin D1 promotes cell cycle progression through enhancing NDR1/2 kinase activity independent of cyclin-dependent kinase 4. J. Biol. Chem 288, 26678–26687 (2013). [DOI] [PMC free article] [PubMed] [Google Scholar]
- 35.Li Z et al. Alternate cyclin D1 mRNA splicing modulates p27KIP1 binding and cell migration. J. Biol. Chem 283, 7007–7015 (2008). [DOI] [PubMed] [Google Scholar]
- 36.Hydbring P, Malumbres M & Sicinski P Non-canonical functions of cell cycle cyclins and cyclin-dependent kinases. Nat. Rev. Mol. Cell Biol 17, 280–292 (2016). [DOI] [PMC free article] [PubMed] [Google Scholar]
- 37.Pestell RG New roles of cyclin D1. Am. J. Pathol 183, 3–9 (2013). [DOI] [PMC free article] [PubMed] [Google Scholar]
- 38.Rubio MF et al. Cyclin D1 is a NF-κB corepressor. Biochim. Biophys. Acta 1823, 1119–1131 (2012). [DOI] [PubMed] [Google Scholar]
- 39.Liu Q et al. Cyclin D1 and C/EBPβ LAP1 operate in a common pathway to promote mammary epithelial cell differentiation. Mol. Cell. Biol 34, 3168–3179 (2014). [DOI] [PMC free article] [PubMed] [Google Scholar]
- 40.Matsuura I et al. Cyclin-dependent kinases regulate the antiproliferative function of Smads. Nature 430, 226–231 (2004). [DOI] [PubMed] [Google Scholar]
- 41.Carlson ME, Hsu M & Conboy IM Imbalance between pSmad3 and Notch induces CDK inhibitors in old muscle stem cells. Nature 454, 528–532 (2008). [DOI] [PMC free article] [PubMed] [Google Scholar]
- 42.Yousef H et al. Systemic attenuation of the TGF-β pathway by a single drug simultaneously rejuvenates hippocampal neurogenesis and myogenesis in the same old mammal. Oncotarget 6, 11959–11978 (2015). [DOI] [PMC free article] [PubMed] [Google Scholar]
- 43.Sawyer JS et al. Synthesis and activity of new aryl- and heteroaryl-substituted pyrazole inhibitors of the transforming growth factor-beta type I receptor kinase domain. J. Med. Chem 46, 3953–3956 (2003). [DOI] [PubMed] [Google Scholar]
- 44.Luo K Signaling Cross Talk between TGF-β/Smad and Other Signaling Pathways. Cold Spring Harb. Perspect. Biol 9, (2017). [DOI] [PMC free article] [PubMed] [Google Scholar]
- 45.Liu L et al. Chromatin modifications as determinants of muscle stem cell quiescence and chronological aging. Cell Rep. 4, 189–204 (2013). [DOI] [PMC free article] [PubMed] [Google Scholar]
- 46.Liu L, Cheung TH, Charville GW & Rando TA Isolation of skeletal muscle stem cells by fluorescence-activated cell sorting. Nat. Protoc 10, 1612–1624 (2015). [DOI] [PMC free article] [PubMed] [Google Scholar]
- 47.Butler KV et al. Rational design and simple chemistry yield a superior, neuroprotective HDAC6 inhibitor, tubastatin A. J. Am. Chem. Soc 132, 10842–10846 (2010). [DOI] [PMC free article] [PubMed] [Google Scholar]
- 48.Srinivas S et al. Cre reporter strains produced by targeted insertion of EYFP and ECFP into the ROSA26 locus. BMC Dev. Biol 1, 4 (2001). [DOI] [PMC free article] [PubMed] [Google Scholar]
- 49.Luo D et al. Deltex2 represses MyoD expression and inhibits myogenic differentiation by acting as a negative regulator of Jmjd1c. Proc. Natl. Acad. Sci. U. S. A 114, E3071–E3080 (2017). [DOI] [PMC free article] [PubMed] [Google Scholar]
- 50.Burzyn D et al. A special population of regulatory T cells potentiates muscle repair. Cell 155, 1282–1295 (2013). [DOI] [PMC free article] [PubMed] [Google Scholar]
- 51.Cordelières FP et al. Automated cell tracking and analysis in phase-contrast videos (iTrack4U): development of Java software based on combined mean-shift processes. PloS One 8, e81266 (2013). [DOI] [PMC free article] [PubMed] [Google Scholar]
- 52.Nussbaum-Krammer CI, Neto MF, Brielmann RM, Pedersen JS & Morimoto RI Investigating the spreading and toxicity of prion-like proteins using the metazoan model organism C elegans. J. Vis. Exp. JoVE 52321 (2015) doi: 10.3791/52321. [DOI] [PMC free article] [PubMed] [Google Scholar]
- 53.Gilbert PM et al. Substrate elasticity regulates skeletal muscle stem cell self-renewal in culture. Science 329, 1078–1081 (2010). [DOI] [PMC free article] [PubMed] [Google Scholar]
- 54.Dobin A et al. STAR: ultrafast universal RNA-seq aligner. Bioinforma. Oxf. Engl 29, 15–21 (2013). [DOI] [PMC free article] [PubMed] [Google Scholar]
- 55.Liao Y, Smyth GK & Shi W featureCounts: an efficient general purpose program for assigning sequence reads to genomic features. Bioinforma. Oxf. Engl 30, 923–930 (2014). [DOI] [PubMed] [Google Scholar]
- 56.Risso D, Ngai J, Speed TP & Dudoit S Normalization of RNA-seq data using factor analysis of control genes or samples. Nat. Biotechnol 32, 896–902 (2014). [DOI] [PMC free article] [PubMed] [Google Scholar]
- 57.Robinson MD, McCarthy DJ & Smyth GK edgeR: a Bioconductor package for differential expression analysis of digital gene expression data. Bioinforma. Oxf. Engl 26, 139–140 (2010). [DOI] [PMC free article] [PubMed] [Google Scholar]
- 58.Subramanian A et al. Gene set enrichment analysis: a knowledge-based approach for interpreting genome-wide expression profiles. Proc. Natl. Acad. Sci. U. S. A 102, 15545–15550 (2005). [DOI] [PMC free article] [PubMed] [Google Scholar]
- 59.Liberzon A et al. The Molecular Signatures Database (MSigDB) hallmark gene set collection. Cell Syst. 1, 417–425 (2015). [DOI] [PMC free article] [PubMed] [Google Scholar]
- 60.Wingender E Compilation of transcription regulating proteins. Nucleic Acids Res. 16, 1879–1902 (1988). [DOI] [PMC free article] [PubMed] [Google Scholar]
- 61.Matys V et al. TRANSFAC and its module TRANSCompel: transcriptional gene regulation in eukaryotes. Nucleic Acids Res. 34, D108–110 (2006). [DOI] [PMC free article] [PubMed] [Google Scholar]
- 62.Daily K, Patel VR, Rigor P, Xie X & Baldi P MotifMap: integrative genome-wide maps of regulatory motif sites for model species. BMC Bioinformatics 12, 495 (2011). [DOI] [PMC free article] [PubMed] [Google Scholar]
- 63.Lachmann A et al. ChEA: transcription factor regulation inferred from integrating genome-wide ChIP-X experiments. Bioinforma. Oxf. Engl 26, 2438–2444 (2010). [DOI] [PMC free article] [PubMed] [Google Scholar]
- 64.Rouillard AD et al. The harmonizome: a collection of processed datasets gathered to serve and mine knowledge about genes and proteins. Database J. Biol. Databases Curation 2016, (2016). [DOI] [PMC free article] [PubMed] [Google Scholar]
- 65.Xie X et al. Systematic discovery of regulatory motifs in human promoters and 3’ UTRs by comparison of several mammals. Nature 434, 338–345 (2005). [DOI] [PMC free article] [PubMed] [Google Scholar]
- 66.Raj A, van den Bogaard P, Rifkin SA, van Oudenaarden A & Tyagi S Imaging individual mRNA molecules using multiple singly labeled probes. Nat. Methods 5, 877–879 (2008). [DOI] [PMC free article] [PubMed] [Google Scholar]
- 67.Mueller F et al. FISH-quant: automatic counting of transcripts in 3D FISH images. Nat. Methods 10, 277–278 (2013). [DOI] [PubMed] [Google Scholar]
Associated Data
This section collects any data citations, data availability statements, or supplementary materials included in this article.


