Abstract
The primary energy sources of mammalian cells are proteins, fats and sugars that are processed by well-known biochemical mechanisms that have been discovered and studied in 1G (terrestrial gravity). Here we sought to determine how simulated microgravity (sim-μG) impacts both energy and lipid metabolism in oligodendrocytes (OLs), the myelin forming cells in the central nervous system. We report increased mitochondrial respiration and increased glycolysis 24 hours after exposure to sim-μG. Moreover, examination of the secretome after three days exposure of OLs to sim-μG confirmed increased the Krebs cycle (Krebs & Weitzman et al., 1987), flux in sim-μG. The secretome study also revealed a significant increase in the synthesis of fatty acids and complex lipids such as, 1,2-dipalmitoyl-GPC (5.67), lysolipids like 1-oleoyl-GPE (4.48) were also increased by microgravity. Although longer chain lipids were not observed in this study, it is possible that at longer time points OLs would have continued moving forward toward the synthesis of lipids that constitute myelin. For centuries, basic developmental biology research has been the pillar to an array of discoveries that have led to clinical applications; we believe that studies using microgravity will open new avenues to our understanding of the brain in health and disease, in particular, to the discovery of new molecules and mechanisms impossible to unveil while in 1G.
Keywords: Oligodendrocytes, myelination, simulated microgravity, lipid metabolism, energy metabolism, mitochondrial function
Caption for Graphical Abstract
This chart represents what is known about oligodendrocyte (OL) development in culture. Most studies have dealt with the synthesis of structural proteins and enzymes proper of the lineage as well as specific to developmental stages. Here we report a novel finding where membrane forming lipids were secreted by OL progenitors (OLP) exposed to weightlessness during 3 days, but not when OLPs were maintained in 1G. Examples of two lipids enriched in the secretome of these cells are shown.
INTRODUCTION
The central nervous system of all animal species has evolved in a one-G or terrestrial gravity (1G) environment and is functionally influenced by its presence. The absence of gravity presents a unique opportunity to gain new insights into basic neural development and function. Oligodendrocytes (OLs) are the glial cells of the central nervous system (CNS) that synthesize and maintain myelin (rev. Baumann and Pham Ding 2000). OLs form compact segments of myelin membrane that coils around the axon and allows for the saltatory conduction of electric impulses, also known as a “neural transmission”.
During the active phase of myelination, OLs require a constant source of energy to generate an enormous amount of lipids in a short time. OL can myelinate up to 50 different axons at a time and thus, the lack of mature OLs or myelin can lead to severe life-long disabilities like cerebral palsy, multiple sclerosis (MS) and other conditions. Once myelination is completed, OLs have synthesized ~40% of the total lipids in the human brain (Norton W., 1981). The abundance of myelin; accounts for ~30% of the dry weight of the human brain. Studies have shown that the overall ratio of proteins to lipids is approximately, 1 to 186 in myelin (O’Brien and Sampson 1965). The enrichment of lipids in myelin is basically due to myelin basic protein (MBP) which extrudes most proteins from the compacted myelin sheath (Aggarwal et al., 2011). Cholesterol, galactosylceramide and ethanolamine plasmalogen are the most significant lipids in myelin accounting for 65% of the total lipid dry weight.
The effects of reduced gravity on physiological and pathological processes are poorly understood. However, recent studies performed in astronauts having been in orbital flight had depicted some pathophysiological effects. Among such effects are muscular atrophy, osteopenia, hematological alterations of red cell morphology and weakened immune response. (Graebe et al., 2004; Damm et al., 2013; Nabavi et al., 2011; Plett et al., 2004). A subset of astronauts on International Space Station missions have shown visual deterioration that is considered one of the greatest human health risks of spaceflight.
Studies with cells cultured in microgravity have shown that microgravity induces apoptosis, alters the cytoskeleton and affects signal transduction, cell differentiation, proliferation, migration and adhesion differently depending on the cell type (rev. Studer et al., 2011). We have pioneered the study of simulated microgravity on neural cells, in particular OLs. The first steps included adapting common cell culture hardware in order to be used in conjunction with the simulated microgravity (sim-μG) producing robot, “the 3D-clinostat” (Mitsubishi Heavy Industries). Once suitable conditions were established, we used this innovative culture system to study the impact of sim-μG on OLs. We first examined the impact of sim-μG on oligodendrocyte progenitors (OLPs) development. We subjected rodent and human OLPs to short exposures (24 – 72 hours) to sim-μG and revealed that OLPs displayed an enhanced and sustained proliferation with a concomitant shortening of the cell cycle in sim-μG by utilizing BrdU and time-lapse microscopy. Exposure to sim-μG also increased the migratory properties of the OLPs (Espinosa et al., 2013).
Cellular metabolism is essential for providing the necessary energy for synthesis of components required for cell structure and function. Normal cells use oxidative phosphorylation in the presence of oxygen to generate adenosine triphosphate (ATP) as a cellular fuel. Fatty acids (FAs) are a critical source of energy for mitochondrial oxidation and cellular ATP generation. OLs possess a broad plasticity that can be extensively modulated by external stimuli. Here we sought to determine the impact of sim-μG on A) energy metabolism of post-mitotic human (Hu) HuOLs after exposure to weightlessness; B) to assess lipidomic changes in the secretome of OLs produced while exposed to weightlessness. Our results indicate that mitochondrial function is enhanced in OLs by sim-μG vs. OLs maintained in 1G. Moreover, elevated energy demand in OLs while in sim-μG led to an increased use of glycolysis to support energetics.
This enhanced requirement for energy appears to be accounted for, at least in part, by increased lipids secreted by OLs. Notably cholesterol, laurate, 5-dodecenoate, palmitoleate, and eicosenoate. These surprising findings indicate that sim-μG preserves, and potentially enhances, metabolic reactions that are required for membrane synthesis and myelinogenesis.
MATERIALS AND METHODS
Human cells
Human tissue experiments were approved by the Office of the Human Subject Committee. Cultures were prepared with fetal human tissue specimens donated by the Department of Pathology and Laboratory of Medicine at UCLA. Samples were de-identified in accordance with NIH guidelines. Anonymous, preserved specimens are donated for medical research purposes and are IRB exempt. (www.pathology.ucla.edu/TPCL.html).
Human embryonic brain derived NSCs and OLPs preparation for sim-μG studies
De-identified donated human pre-shelved specimens were obtained from Pathology. Human fetal cortical tissue samples (17 weeks of gestation) were used as the source of neural progenitors. We previously reported the human cell culture preparation (Espinosa et al., 2013) which is described in Figure 1. We have previously designed a series of developmental stage-specific chemically defined “stem” cell culture media for neural stem cells (NSCs) propagation and maintenance of their pluripotent stage. (Espinosa et al., 2002; Espinosa et al., 2009). For the purpose of fate restriction and OL phenotype induction we used the oligodendrocyte specification medium (OSM). The formulation of OSM includes the minimum and sufficient nutrients to support OLPs developmental stage and their proliferation. For OL specification NSCs can be transferred to oligodendrocyte specification medium (OSM) that induces neural stem cell commitment to the OL lineage (Espinosa et al., 2002). These proliferative OLPs can be maintained in this medium as needed to increase cell numbers.
Fig. 1. Preparation of NSCs from 17 weeks’ human embryonic brain and OL specification.
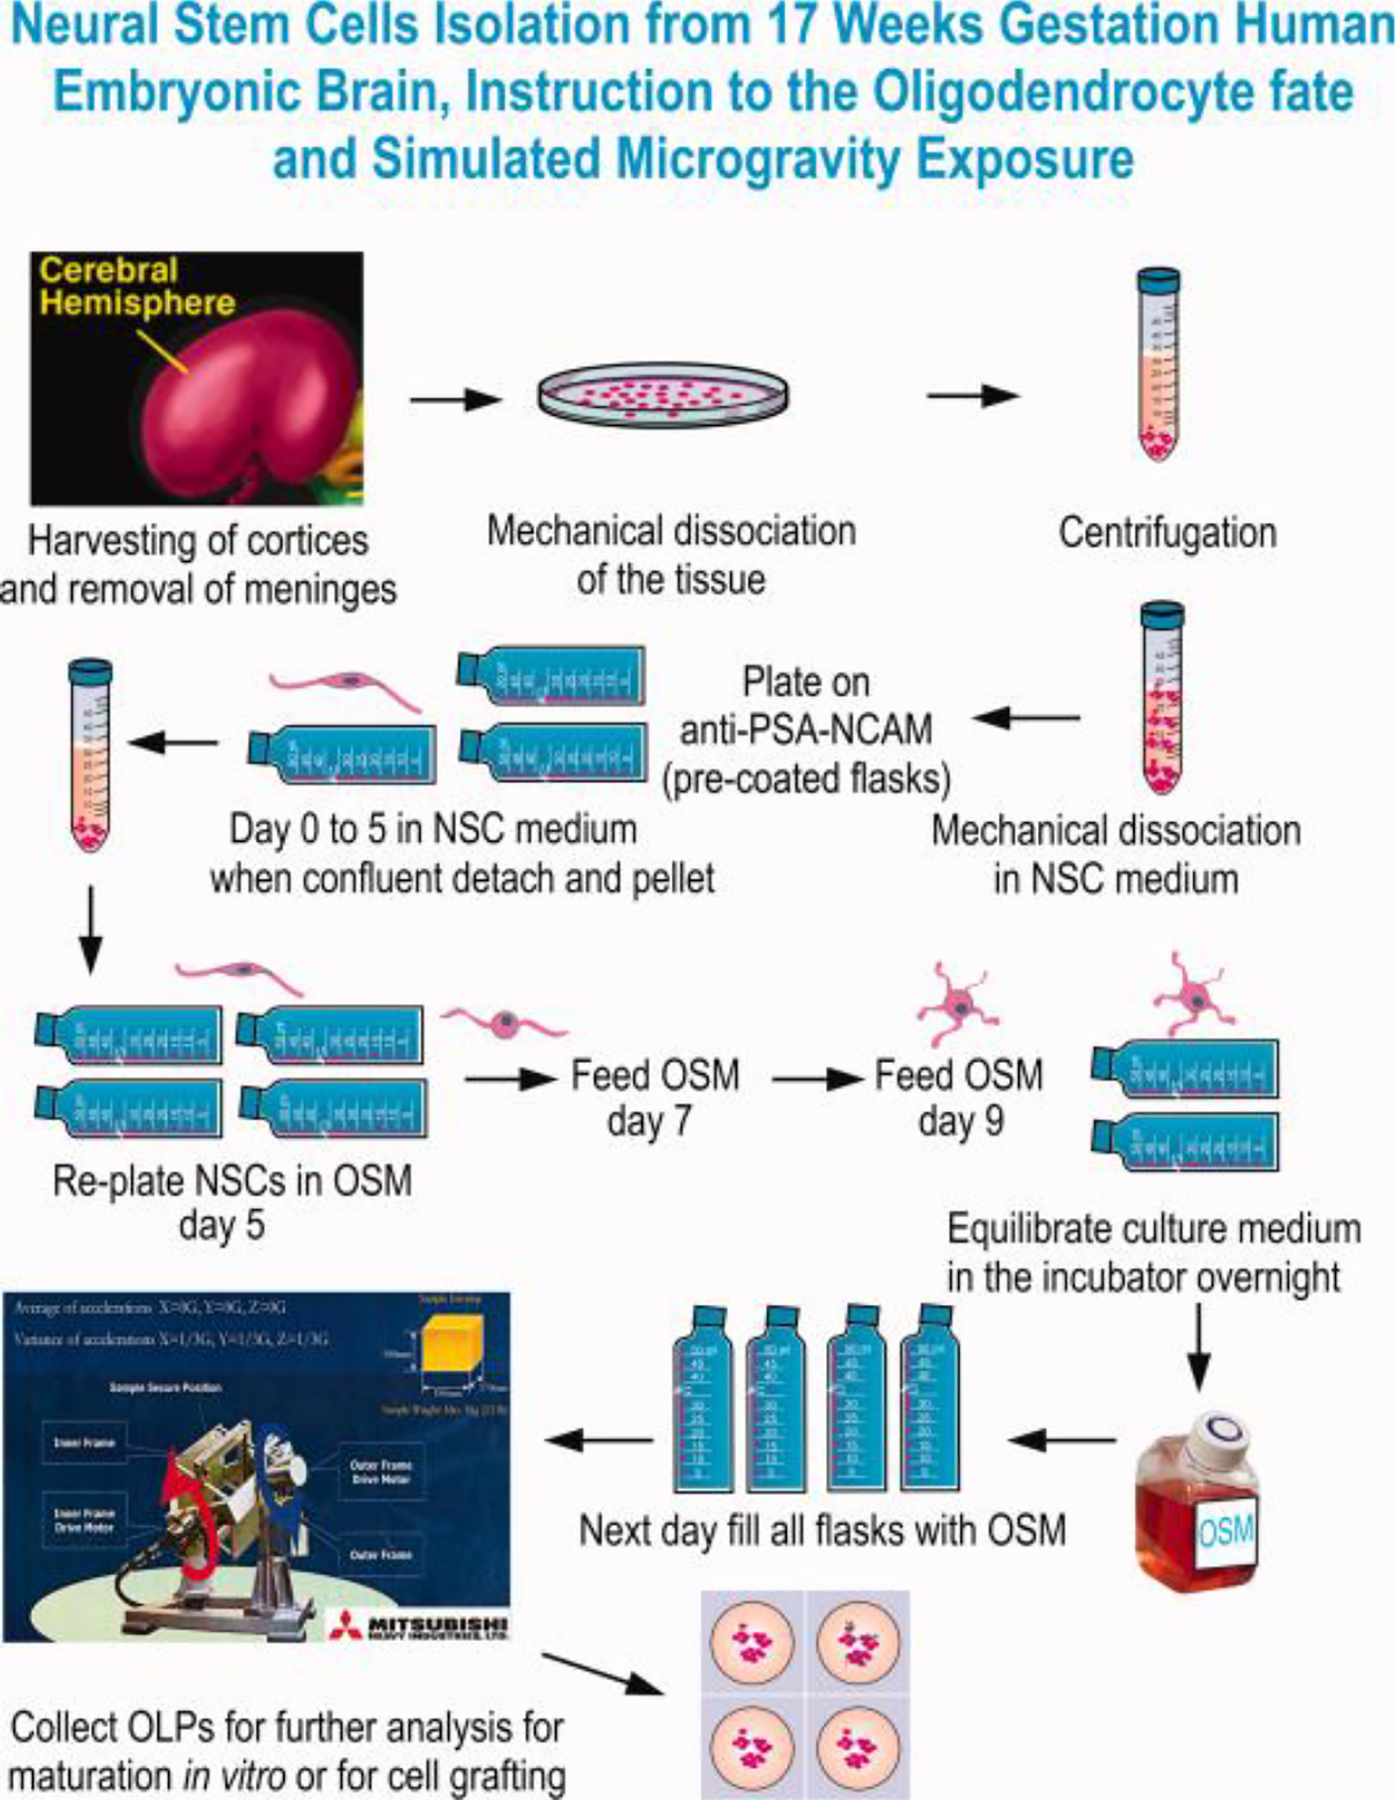
In sterile conditions and using the Biohazard safety cabinet, we started by dissecting the brain, harvested the cortices and remove the meninges. Following dissection and using STM the cell suspension was mechanically dissociated and pelleted. Cells were suspended in STMc medium (Espinosa et al., 2009; 2016). The cell suspension was sieved through a 70μm mesh and plated on anti-PSA-NCAM antibody–coated dishes. Cells were allowed to adhere for 5 min prior to removing them from the safety cabinet. NSCs were propagated directly on this matrix of PSA-NCAM antibody. To preserve self-renewal and stemness 50% of the medium was removed and replenished with the same volume of STMc every other day until confluent. When confluent, NSCs were harvested by shaking the flask, pelleted and seeded on PdL coated flasks with OSM. This medium instructs them towards the OL fate choice, while allowing them to proliferate. For both 1G and 0G cultures the incubator was set at 36.8°C and 4.5% CO2 as usual. For 1G and 0G cultures the full volume of culture medium was pre-equilibrated overnight in the CO2 incubator. To use the 3D-clinostat, the flasks or cell containers need to be full and without even a small bubble, in order to prevent demise of the cells. While this study was performed using 2D culture oligo spheres (3D cultures) would also work. After OSM has been equilibrated flasks were filled, the bubble removed and the cultures placed in the 3D-clinostat. The cells that would remain in 1G were placed in the bottom of the same incubator and using the same flasks, coating and containing the same volume of medium. Cultures were recovered after 72h for analysis.
After reaching confluency, cells were mechanically detached from flasks and re-plated in OSM either in 12.5 mm flasks or glass Nunc Lab-tek flasket’s. After 72 h, half of the cultures were placed in the 3D-Clinostat and half cultures were kept in the same incubator in 1G. We previously documented protocols for the production, isolation, and maintenance of the oligodendrocytes derived from rodent and human neural stem cells using our chemically defined media (Espinosa et al., 2002; Espinosa et al., 2009; Espinosa et al., 2016). OLs were maintained in OSM and fed by adding fresh OSM every other day. The OSM to be used for cells in 1G and 0G experiments is equilibrated in the incubator overnight in order to have the same concentration of CO2 in both sets of cultures. When semi-confluent, all flasks were filled with OSM, one set of cultures was set in 1G and the second set of sister culture flasks were filled over the top to prevent any bubble formation, which can result in cell death due to erosion from the flask surface. After elimination of the bubble, cultures were placed in the 3D-clinostat that produces the sim-μG environment as shown in Fig. 1.
Simulated microgravity was produced by the 3D-clinostat
The 3D-clinostat (Fig.1), a multidirectional G force generator, was produced by Mitsubishi Heavy Industries, Ltd. (Kobe, Japan). By controlled simultaneous rotation of 2 axes, the 3D clinostat cancels the cumulative gravity vector at the center and around the device, producing a microgravity environment. This is accomplished by rotation of a chamber at the center of the device to disperse the gravity vector uniformly within a spherical volume, at a constant angular velocity.
Cell Imaging and Analysis
Cells were monitored every other day and microscope images of live cells were taken every 1–5 days to document their progression. The following qualitative observations were documented: density of cell growth, cell diameter, cell morphology, presence/absence of processes, and the overall appearance of the cells. The Axio-vert and Axio-Cam MRm from Carl Zeiss and the AxioVision 40V program version: 4.8.2 SP3 were used to manually count the number of cells and measure the diameter of the cell bodies represented in the visual field of the images (AxioVision, RRID:SCR_002677). Data was then compiled and analyzed using Microsoft Excel and statistical analysis was performed using GraphPad (GraphPad, RRID:SCR_000306). We used unpaired t-test for the statistical analysis with the 0G, 1G, and control groups (n=5).
PCR analysis of OLP
Human neural stem cell hESC-derived OL HBF-2050 were analyzed for gene expression after having been grown in their original medium or placed in OSM. After 5 days in culture, the medium was removed and cells were rinsed with chilled DEPC-treated PBS and RNA was extracted using RNA Extraction mini kit purchased from QIAGEN RRID:SCR_008539). RNA from individual samples were reverse transcribed and PCR amplified using Retroscript kit from Ambion, a subsidiary of Thermo Fisher Scientific. Fifty ng cDNA of each sample in duplicate was amplified in BioRad iCycler using human gene specific primers (Table 2). The amplified DNA was electrophoresed on a 1% agarose gel. The gel was imaged and the DNA bands were cut out to extract DNA for each gene, and DNA was sequenced to validate the product specificity. In addition, the ethidium bromide stained DNA band intensity was determined by UVP Bioimaging Autochemi Gel Documenting System and presented in a bar graph as the level of gene expression relative to the house keeping gene, GAPDH. Human gene specific PCR primers were generated from the coding sequence obtained from NCBI. The regions of genes were selected without 3-D structure using mfold software and primers were designed using Primer3 software for 60-dgrees. The selected forward and reverse primer sequence were sent to Sigma for primer synthesis. The primers were validated before study.
Table 2.
Primer Sequences and Sizes Used to Obtain Exon Products
| Gene | Primers | Temp (Degrees) | Size (bp) |
|---|---|---|---|
| NESTIN | F-GAAGGGCAATCACAACAGGT R-ACCCTCTTTGCTCCAAACT |
60 | 278 |
| PAX6 | F- AACAGGAAGGAGGGGGAGA R-AAAACCATACCTGTATTCTTGCTTC |
60 | 240 |
| OLIG2 | F- TCCAATCTCAATATCTGGGTCA R-GCTTAGAGAAGGAAAGATGAGTCG |
60 | 264 |
| PDGFRa | F- GAAGCTGTCAACCTGCATGA R- GACCAAGTCCAGAATGGATGA |
60 | 291 |
| SOX2 | F- CATCACCCACAGCAAATGAC R- CTTCCTGCAAAGCTCCTACC |
60 | 253 |
| TF | F- ACTGGATGCAGGTTTGGTGT R- GAGAAGAAATTGGCCACTGC |
60 | 282 |
| GAPDH | F- GAGAGAAACCCGGGAGGCTA R- ATGTAGTTGAGGTCAATGAAGGGG |
60 | 230 |
Human gene-specific polymerase chain reaction primers were generated from the coding sequence obtained from the National Center for Biotechnology Information. The regions of genes were selected without 3D structure using mfold software, and primers were designed using Primer3 software for 60 degrees. The selected forward and reverse primer sequence were sent to Sigma for primer synthesis. The primers were validated before study.
Cellular Bioenergetics
Post-mitotic OL were seeded onto an XF24 Cell Culture Microplate (Seahorse Bioscience) at 5 × 10⁴ cells/well in glial defined medium (GDM) supplemented with transferrin and IGF-1 namely “BS1” in order to obtain post-mitotic OLs. Cells were kept 24h in standard culture conditions (37°C, 4.5% CO2). The following day, wells were filled with fresh OSM at 30°C. The plates to be kept in 1G were covered and placed in the incubator. The plates to be placed in sim-μG in the 3D-clinostat were covered with Milli-wrap (Millipore Corp. Bradford, MA. USA) and incubated 24h in the clinostat at 37°C, 4.5% CO2 overnight. The following day, some of the supernatant was removed from the well plates. We used an XF24 Analyzer (Seahorse Bioscience) to measure oxygen consumption rate (OCR) and extracellular acidification rate (ECAR) (Seahorse Wave, RRID:SCR_014526). OCR and ECAR reflect rates of mitochondrial respiration and glycolysis, respectively. Measurements were performed with the cells in unbuffered DMEM assay medium supplemented with 1 mM pyruvate, 2 mM glutamine and 25 mM glucose. Measures were recorded before (basal reading) and after the sequential injections of oligomycin, FCCP, and rotenone/myxothiazol. Maximal OCR was the response to FCCP, whereas maximal ECAR was the response to oligomycin. OCR was normalized to cellular protein concentration determined with the Protein Assay reagent (Bio-Rad) in all experiments.
Secretome Study
Metabolic profiles were obtained for each individual group using the Metabolon Platform (Metabolon). Briefly, each sample or “group” consisted of 5 biological replicate specimens. Three groups of samples were compared: Blank (n=5) which consisted of the culture medium alone incubated in the same incubator used for our cell cultures. OLPs (n=5) in 1G and OLPs incubated in sim-μG = 0G, (n=5). Post-harvest the conditioned medium was used to analyze molecules secreted by OLPs. This medium was subjected to methanol extraction then split into aliquots for analysis by ultrahigh performance liquid chromatography/mass spectrometry (UHPLC/MS) in the positive (two methods), negative or polar ion mode. Metabolites were identified by automated comparison of ion features to a reference library of chemical standards followed by visual inspection for quality control as previously described (DeHaven et al., 2016).
Statistical Analysis for the secretome study
To determine statistical significance, Welsh’s two-sample t-tests were performed on the 0G, 1G and control groups of n=5 in ArrayStudio (Omicsoft) or “R” to compare data between them; P < 0.05 was considered significant (Array Studio, RRID:SCR_010970). False discovery rate (Q-value) was calculated to take into account the multiple comparisons that normally occur in metabolomic-based studies, with Q<0.05 used as an indication of high confidence in a result. Principal Component Analysis (PCA) and Hierarchical Clustering Analysis (HCA) were performed in ArrayStudio. Random Forest analysis was performed as described (Evans et al., 2009; DeHaven et al., 2010). For box plots, whiskers reflect 5th and 95th percentiles (with the box displaying 25th to 75th quartiles); bisecting line represents the population median, while “+” represents population mean, (Weissgerber et al., 2015).
RESULTS
HuE-OLs were healthy in sim-μG and displayed a smaller cell diameter than cells maintained in 1G
Human OLs were grown in OSM for four days in 1G or sim-μG. Cells appeared as healthy OLs with cell processes when viewed under phase contrast. The only visible difference between conditions was the greater cell number in cultures exposed to sim-μG as shown (Fig. 2), as expected based on our previous study (Espinosa et al., 2013).
Fig. 2.
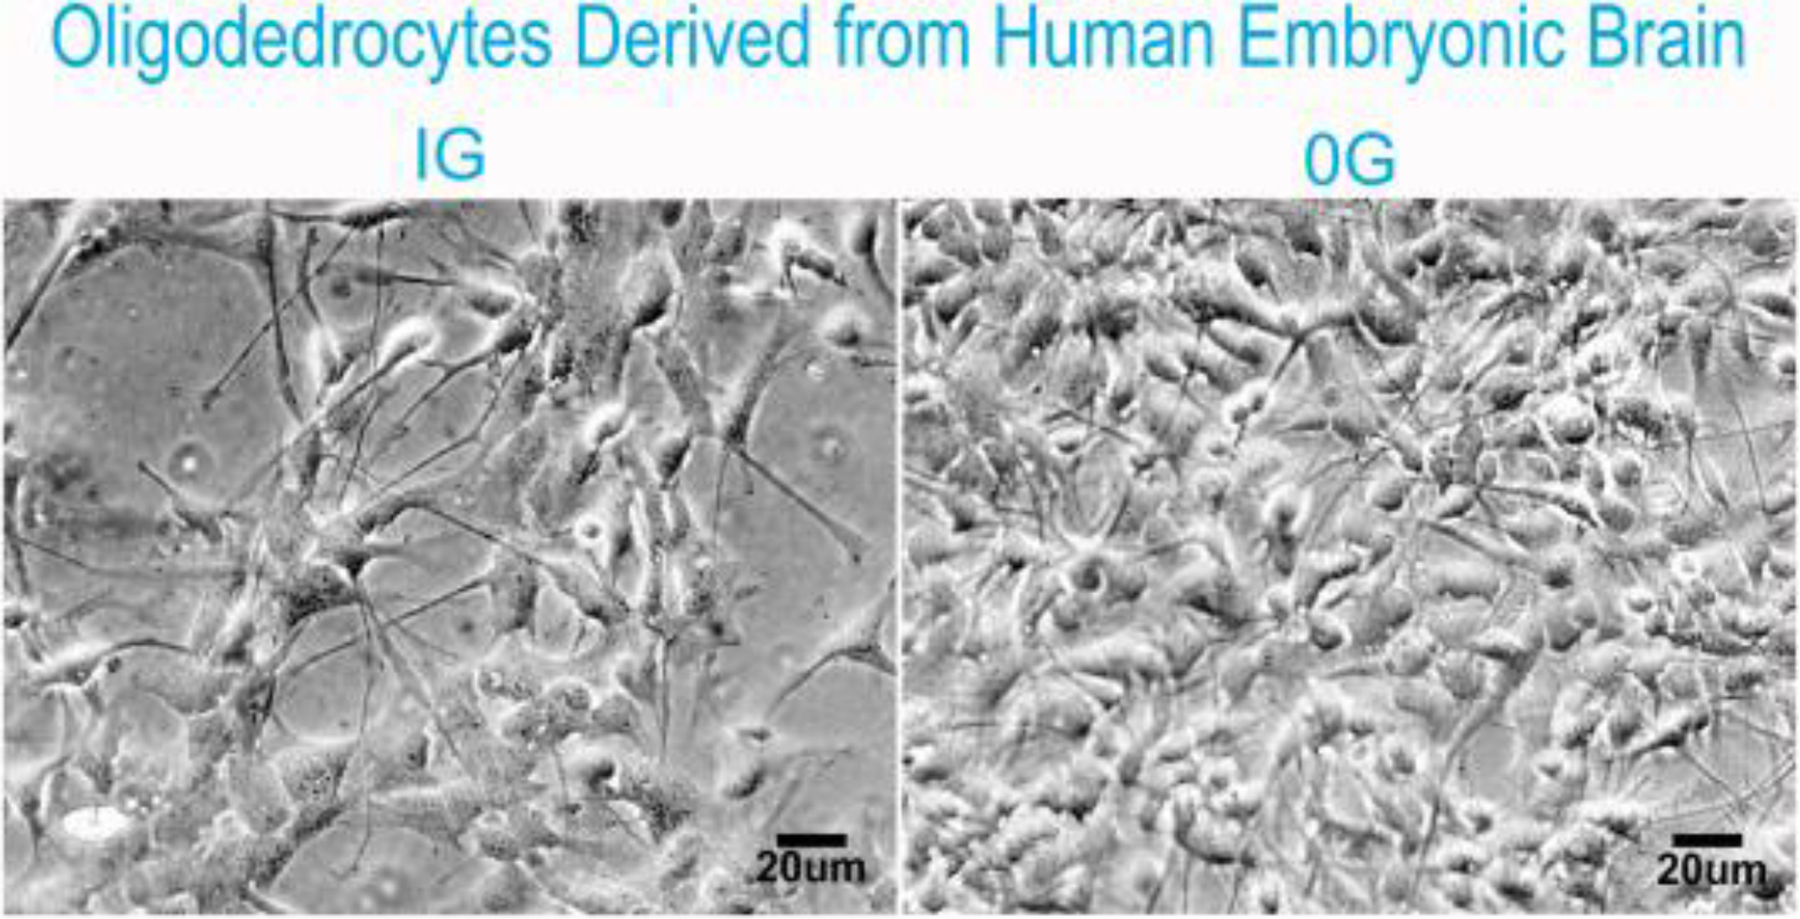
Phase contrast representative views of OLs derived from Hu Embryonic brain 17 week gestation at passage number 2 (P2). NSC were re-plated on poly-D-lysine coated flasks and maintained in STM medium to allow them to proliferate for six days in 1G. Then switched to OSM and kept in 1G (left panel) or in sim-μG (right panel) for 4 days. After 72h cultures exposed to sim-μG bared many more cells than those maintained in 1G as previously reported (Espinosa et al., 2013).
NSC were re-plated on poly-dlysine coated flasks and maintained in STM medium to allow them to proliferate for six days in 1G; then switched to OSM and kept in 1G or in sim-μG for 4 days. Cells were then fixed and examined. Measurements of cell diameter revealed a difference in the size of OLs cultured in 1G vs. those cultured in sim-μG. Twelve visual fields from three different flasks from each group were measured, from three separate experiments. Our data revealed a difference in the size of cells cultured under 1G conditions, compared to those cultured under 0G conditions. We found that cells under sim-μG were smaller in size, based on cell body diameter (Fig. 3). The average cell diameter of OLPs exposed to sim-μG was 12.37μm (n=789, SD = 3.67), while the mean diameter of cells maintained in 1G was 14.51μm (n=529, SD = 4.611). The unpaired t-test revealed a P value of less than 0.0001. We have observed similar changes in neural stem cells (grown in their respective medium) after their exposure to sim-μG (Espinosa et al., 2016).
Fig. 3. The cell diameter of OLs derived from Hu embryonic brain is reduced after exposure to sim-μG.
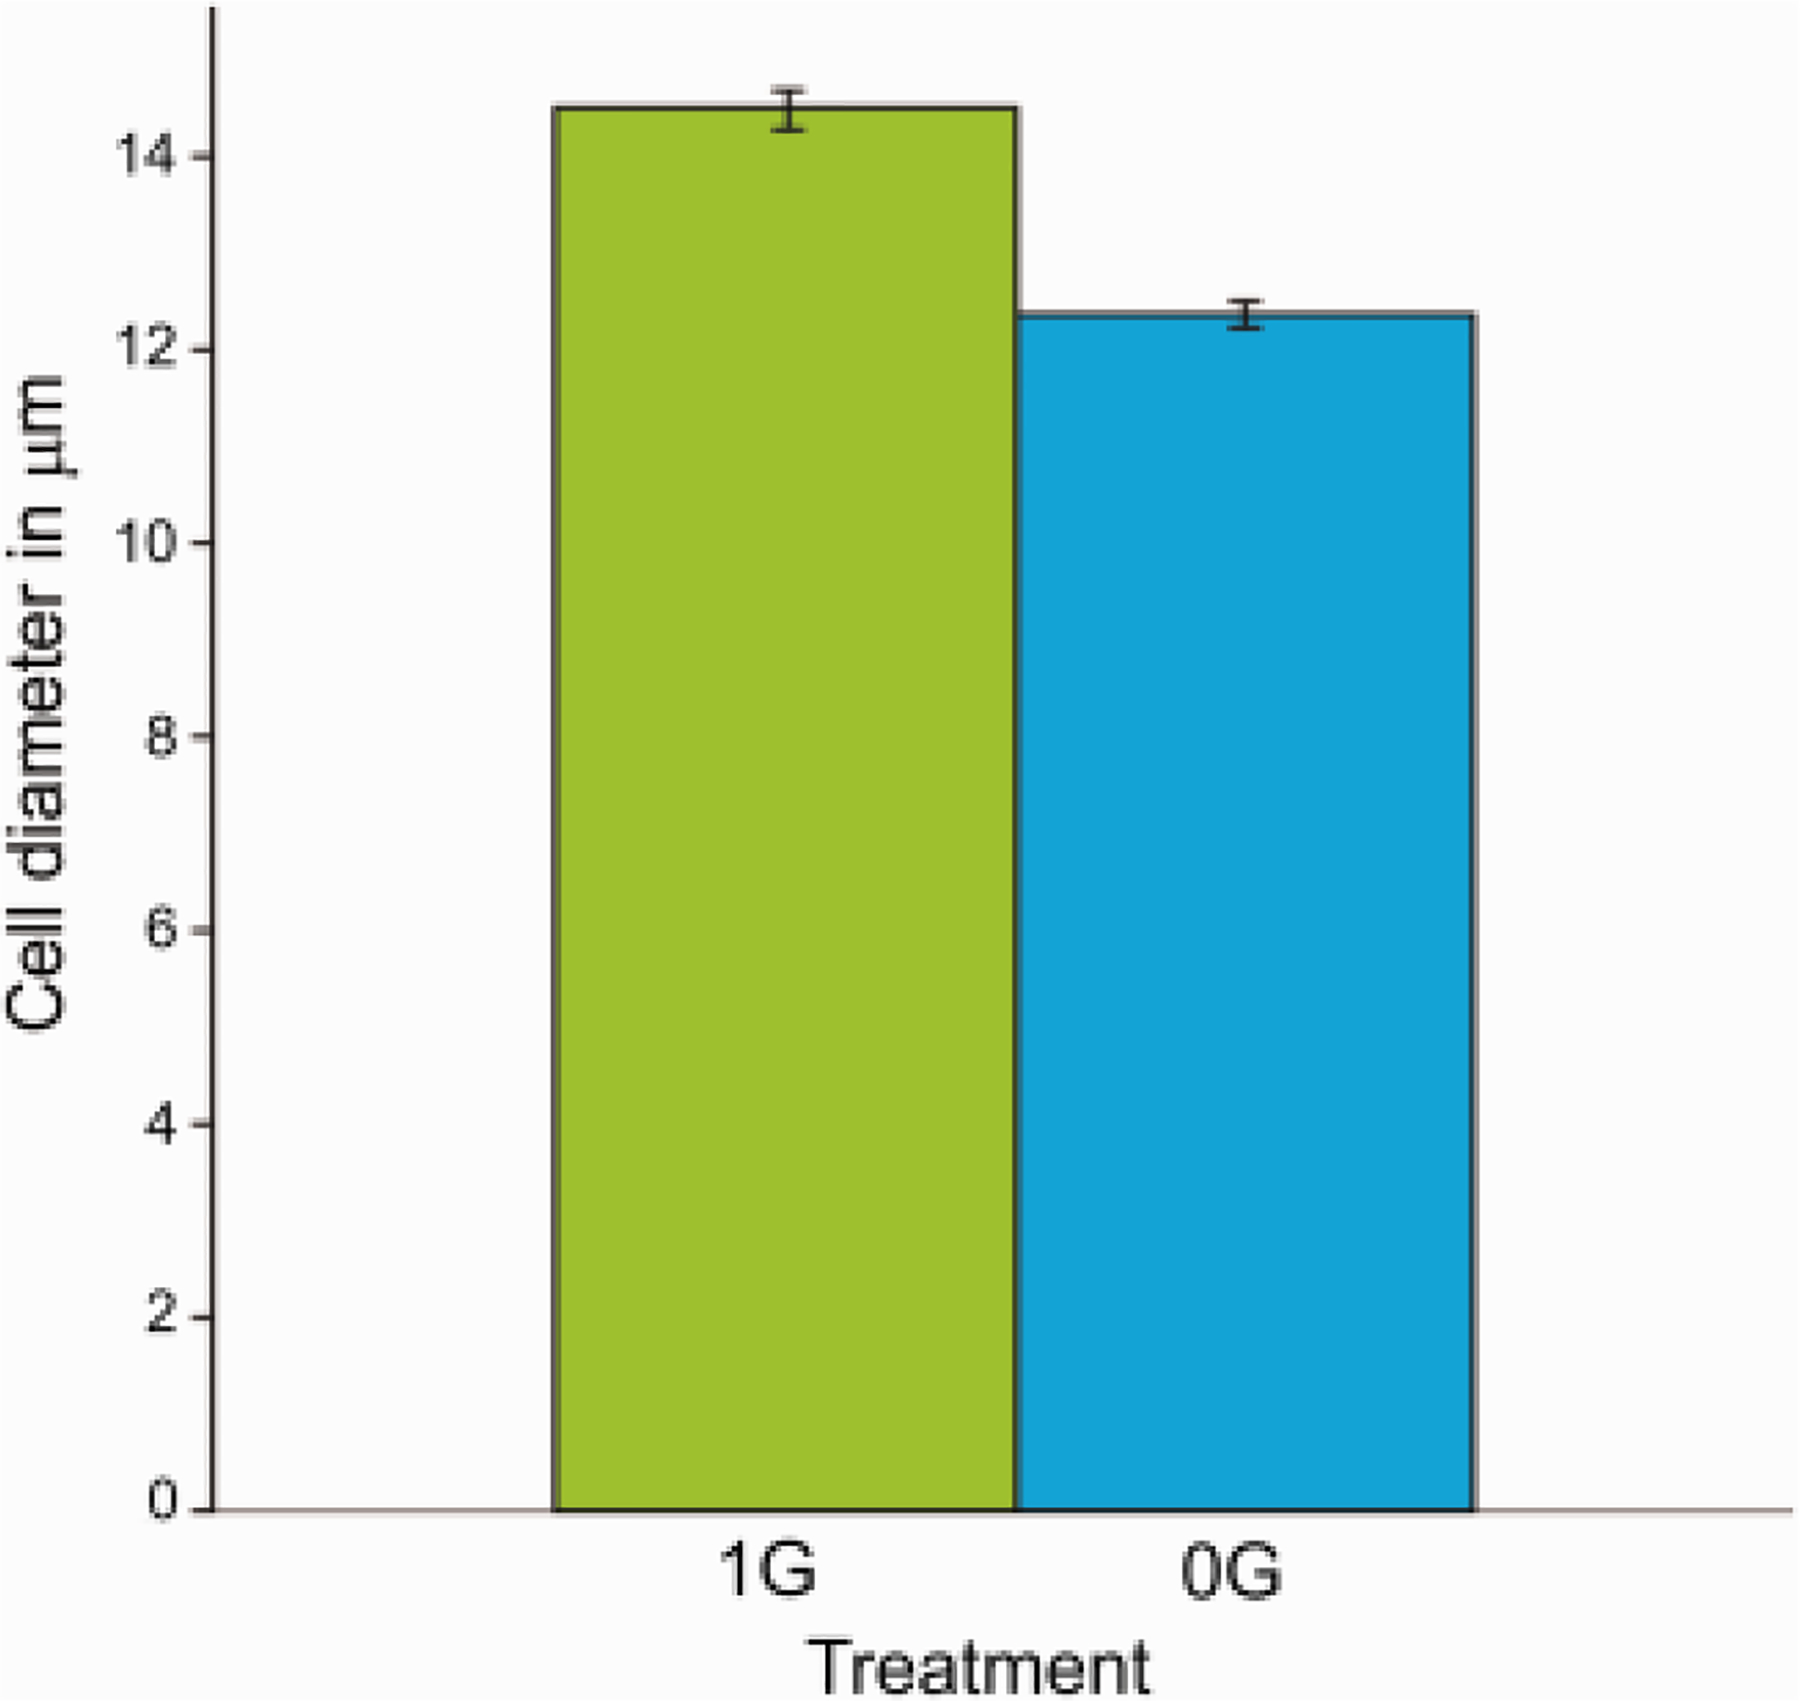
Cells cultured in OSM for 4 days revealed significantly smaller cell body diameter when cultured under sim-μG conditions as compared to cells cultured under 1G conditions. This phenomenon might be attributed to cytoskeleton and cell adhesion changes. Values are expressed as mean + SEM of two independent experiments. Data were analyzed using unpaired t-test **: p<0.01 ***: p<0.001 vs. respective control.
Qualitative assessment on the expression of relevant genes for neural progenitors and early OLPs
Human progenitors were either in their original plating medium for 1d or in our proprietary OSM culture medium and cultured in sim-μG (0G) or in 1G for 5 days. Then OLPs were harvested and processed to ascertain the expression of molecular biomarkers for genes proper to the OL lineage and some for NSCs. The main goal was to characterize how the markers would be expressed in terms of lineage specificity relevant to the difference in gravity. The biomarkers of interest included those belonging from early to mid-stage undifferentiated neuronal-glial cells that are known to localize within cortical-striatal regions such as nestin and Pax-6. The expression of markers for early OLPs that would indicate commitment such as Sox2, Olig2, PDGFRa and transferrin (Tf) were also examined. The primers used are shown in table 1. We found the presence of all the markers examined in all cultures at day 1 or day 5 suggesting that some cells remain uncommitted still 5 days after being in OSM. Nonetheless, there are numerous early OL markers also present. We found that absolutely all progenitor markers have a higher level of expression when cells have been in 0G and this increase is time dependent. In contrast, in cells maintained in 1G full time most of these markers tended to decrease (Fig. 4). Simulated microgravity did not alter the expression of the markers studied. Nonetheless, human OLP specification is a long process when compared to rodent OLP. Thus, some progenitors still expressed Pax-6, Sox-2 and nestin (stem cell markers) while co-expressing OLP specific markers Olig2, PDGFRα and transferrin (TF) regardless of whether they were in 1G or 0G (Fig. 4).
Table 1.
Antibody Used for Panning
| Antibody | Description of immunogen | Source, host species, catalog no., RRID | Dilution |
|---|---|---|---|
| PSA-NCAM | Initiates at 2–8 linked neuraminic acid (PSA). In vertebrates, PSA links to NCAM. | Developmental Studies Hybridoma Bank (DSHB), Mouse, Monoclonal, Cat# 5A5, AB_2314873 | 1:10 |
Fig. 4. Human OLPs cultures whether in 0G or 1G expressed the same developmental markers.
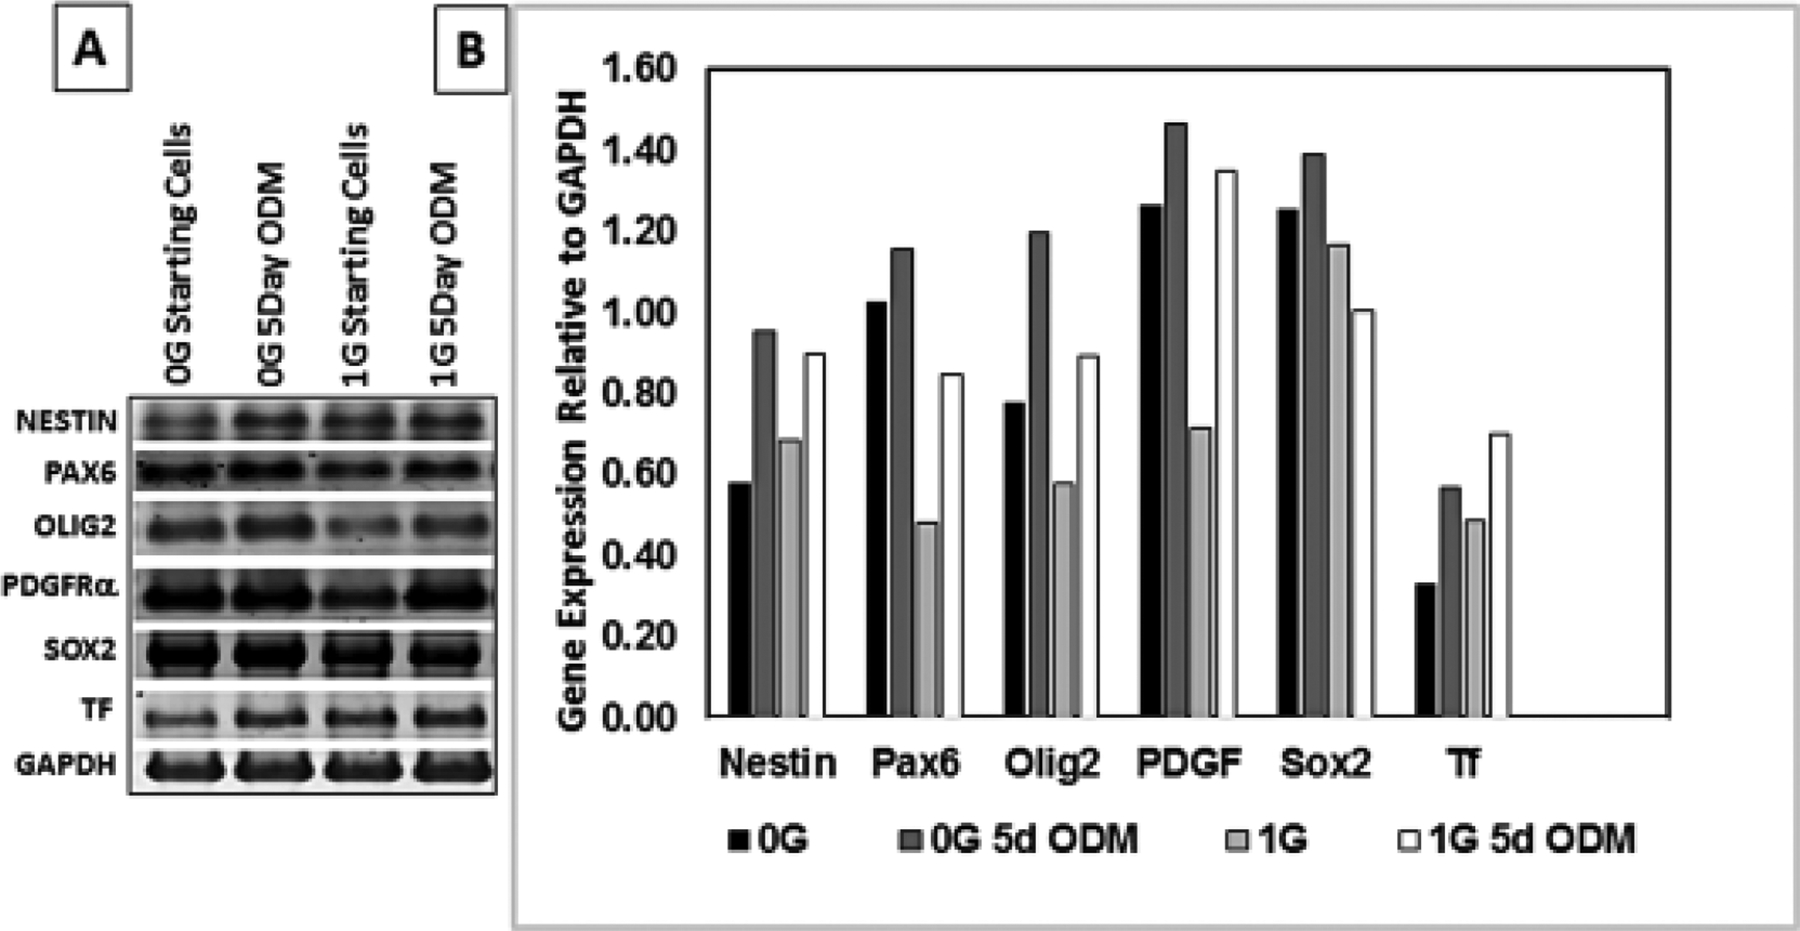
After 5 days in culture human neural stem cell hESC-derived OL, grown in their original medium or in OSM, were examined for a qualitative gene expression relevant to OL markers from a single dish a total of two samples. The medium was removed, cells were rinsed with chilled DEPC-treated PBS and RNA was extracted using QIAGEN RNA-mini kit. RNA from individual samples was reverse transcribed and PCR amplified in duplicates using human gene specific primers (Table 1). The amplified DNA was electrophoresed on a 1% agarose gel. The gel was imaged and the DNA was sequenced to establish the product specificity. In addition, the DNA ethidium bromide band intensity was determined by UVP gel doc system and presented in a bar graph as the level of gene expression relative to the house keeping gene, GAPDH. The result verifies expression of relevant genes in these cells based on DNA sequencing and their levels relative to the house-keeping gene within in the same sample. Bars represent results from duplicate samples from the same cultures.
Sim-μG elicits higher respiration rates in HuOLs
To ascertain the effects of sim-μG on energy metabolism, by comparing OLs under conditions of 1G and sim-μG. We quantified oxygen consumption rate and extracellular acidification rate as measures of mitochondrial respiration and glycolysis, respectively. We found that OLs maintained 24 hours in sim-μG presented higher basal and maximal mitochondrial respiration compared with OLs maintained in 1G (Fig. 5). Maximal, but not basal, glycolysis was also significantly higher in sim-μG compared to 1G. Since these cells were post-mitotic and the data normalized to protein, this increase appears to be due to a higher metabolic rate, rather than to cell proliferation.
Fig. 5. A higher bioenergetic state was elicited in OLs kept in sim-μG.
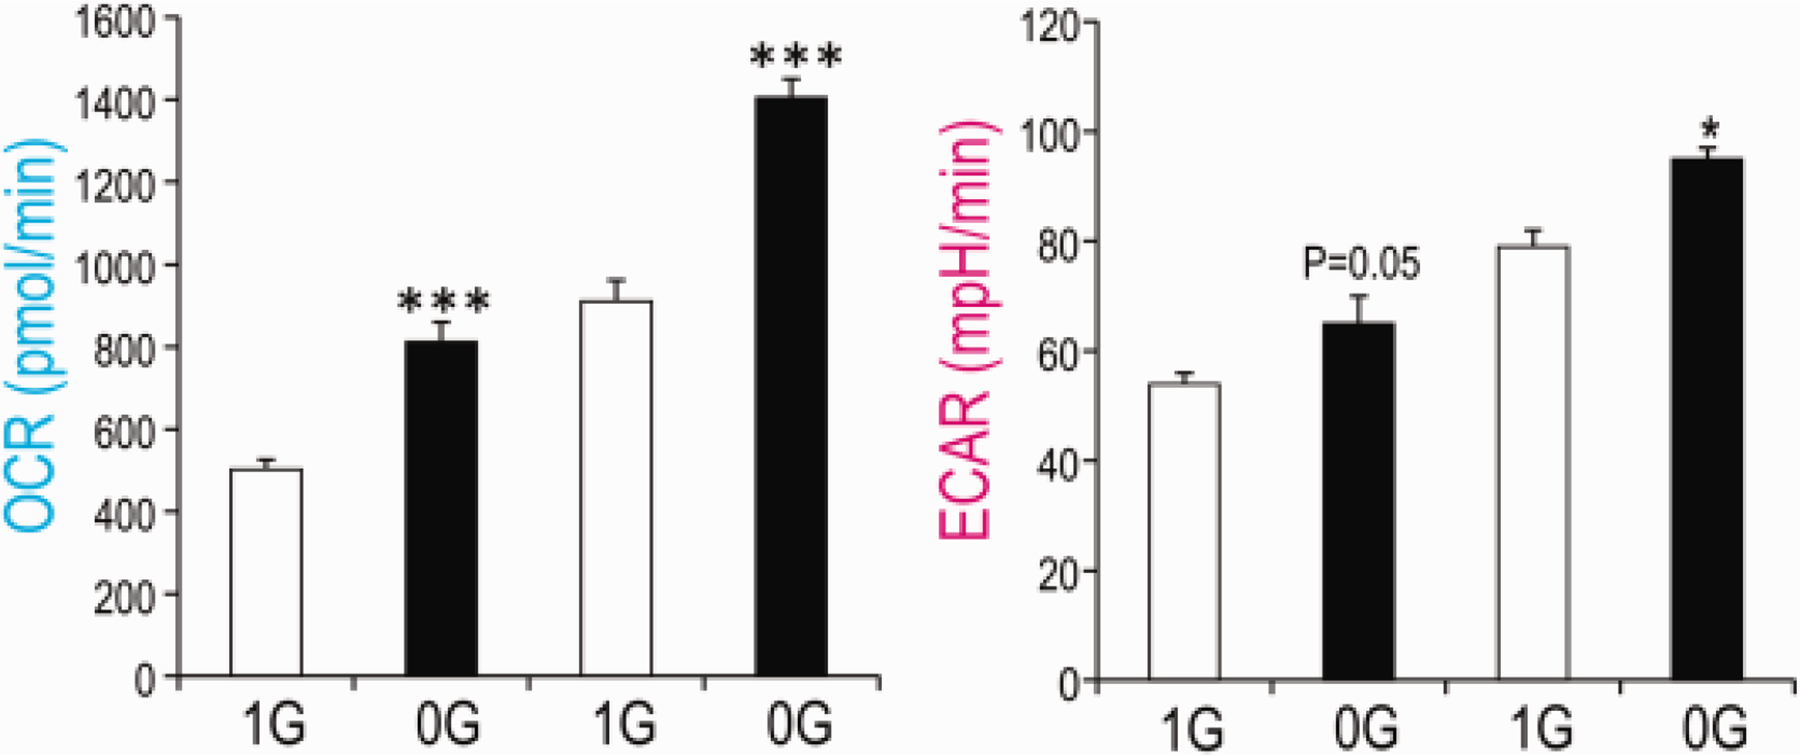
Human OLs were cultured in Seahorse Bioscience V7 plate for 48h. Then 1 plate was placed in the 3D-Clinostat and the second one was kept in the same incubator in 1G during 24 hours. Higher basal OCR and higher maximal OCR and ECAR in sim-μG indicate that the cells are in a higher bioenergetics state. the number of samples was 12 per experiment(n = 12), and the experiment was performed twice independently. Values are expressed as mean + SEM of two independent experiments. Student’s t test revealed that these differences were **: p<0.01 ***: p<0.001 vs respective control.
Effects of sim-μG on Metabolomic Profile
Mitochondrial function, TCA cycle and glycolysis
Our results show that in sim-μG OLs, there were substantially reduced pyruvate levels and increased lactate levels (2.5-fold) (Fig. 6), in agreement with demonstrated increases in glycolysis as described above. Additionally, there were increased levels of citrate (3.3-fold higher in sim-μG compared to 1G. Lipids can also be synthesized from citrate, so, some of the glucose input into the TCA cycle could be drawn into fatty acid production. In addition, malonate which is produced from hydrolysis of malonyl-CoA was also elevated in 0G vs. 1G OLs. Aconitate (4.4-fold), fumarate (3.7-fold) and malate (2.3-fold) were also increased. Succinate, however, was not significantly changed, which could reflect limiting alpha-ketoglutarate or pools in steady-state (potentially as a result of high demand for use to support oxidative metabolism). Together, these findings suggest a potential increase in TCA cycle flux in sim-μG (Fig. 6).
Fig. 6. OLs in sim-μG require more energy than in 1G.
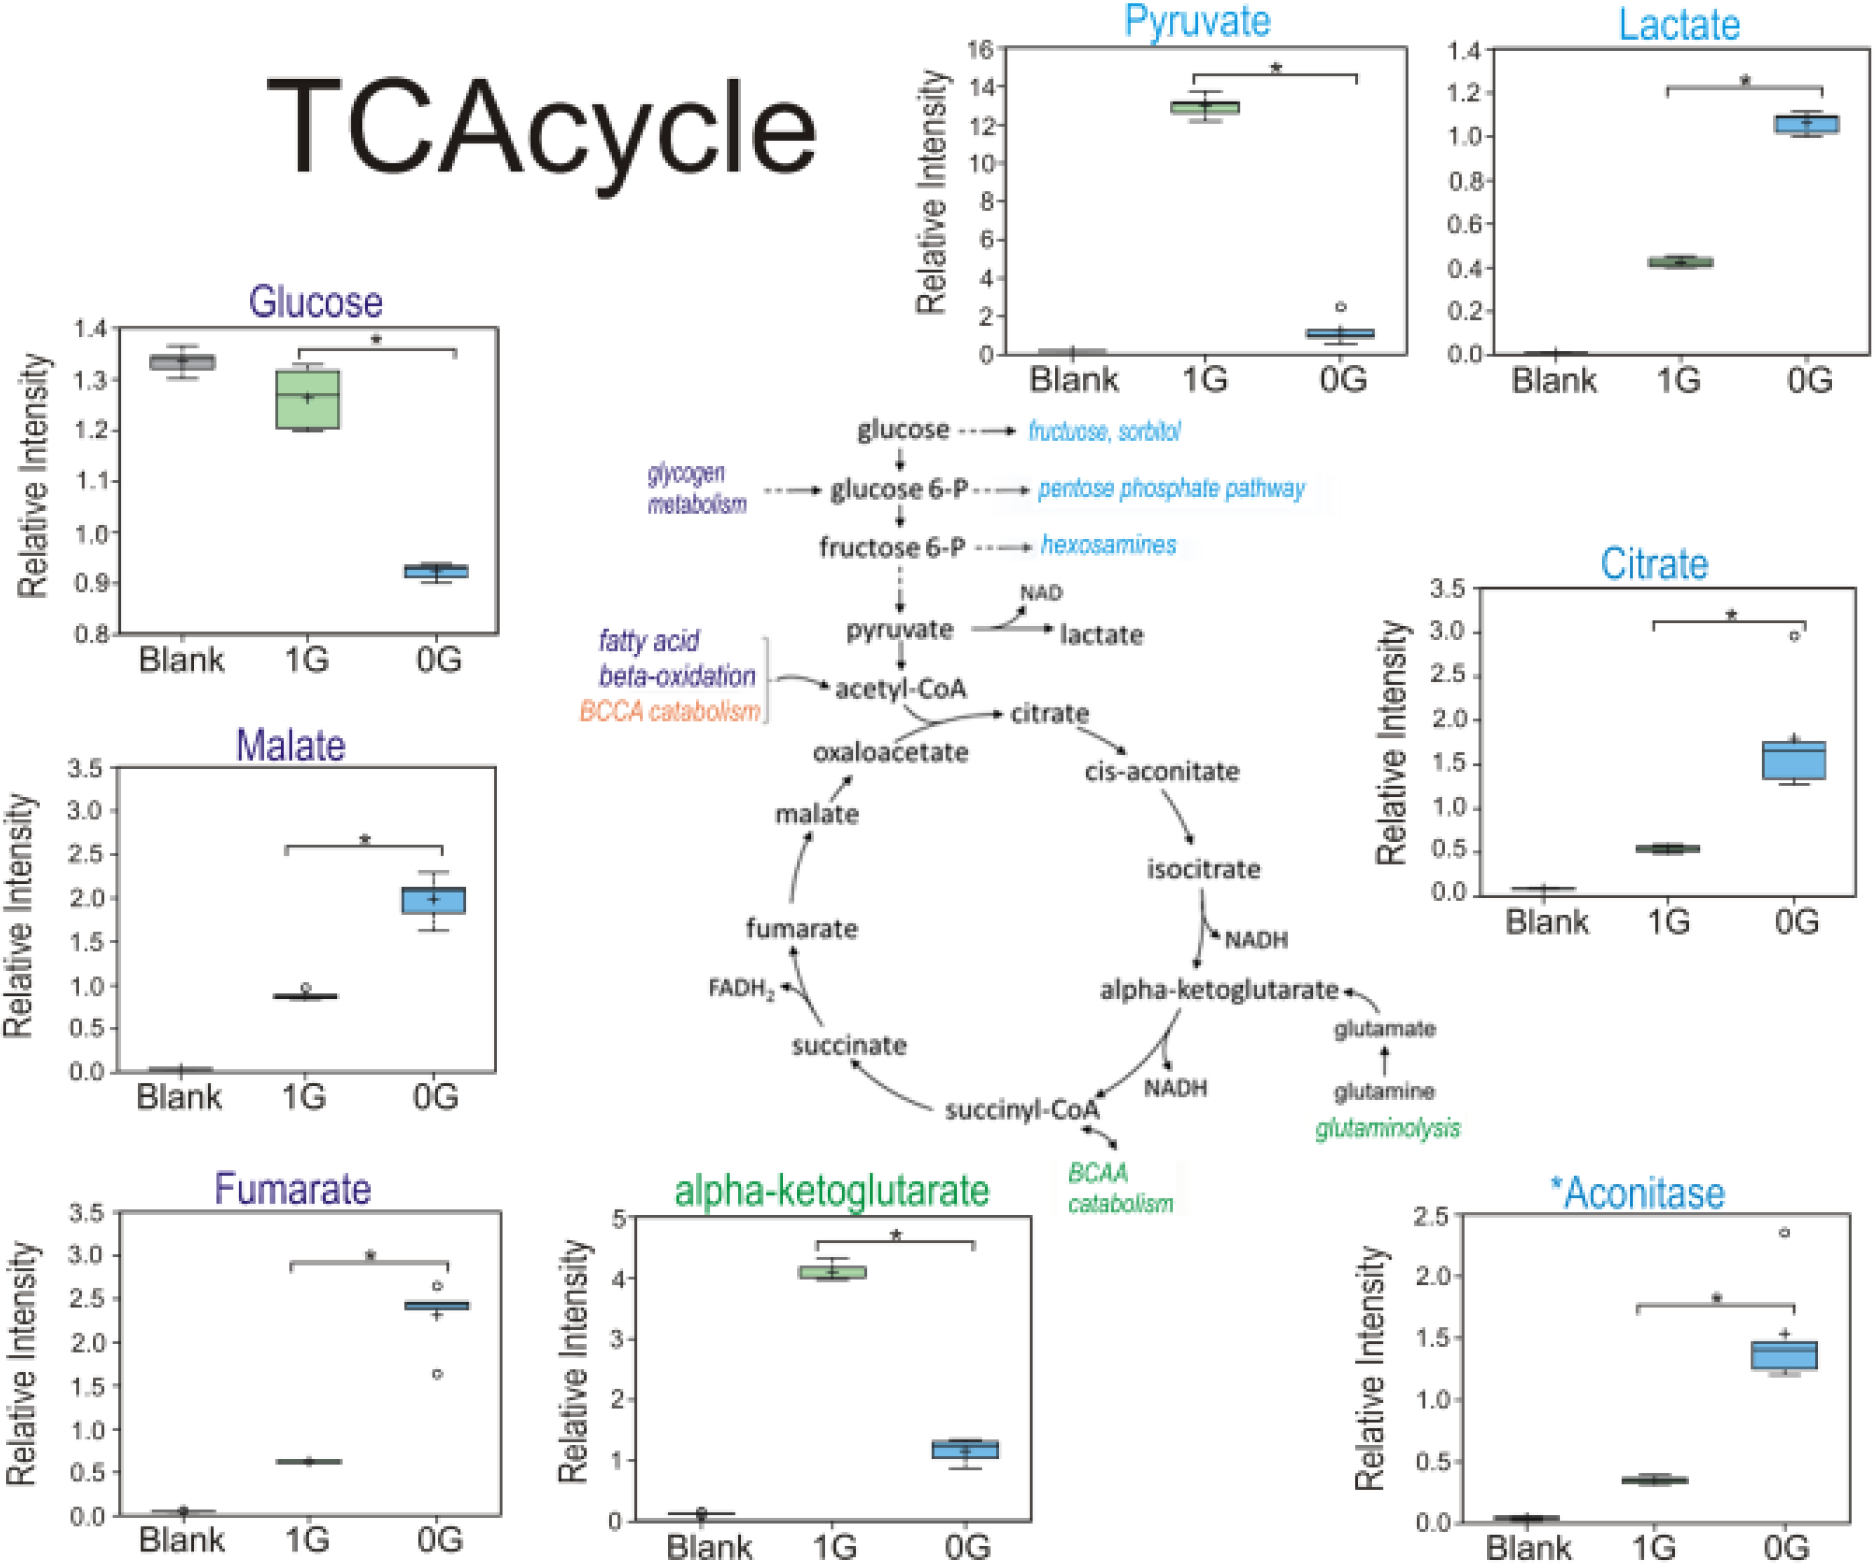
The main sources of energy for respiration and energy production glucose and pyruvate were decreased in 3 days when cells were in microgravity, while lactate levels increased considerably indicating that OLs switched to anaerobic glycolysis in order to meet the energy demand elicited by microgravity. Carbon flows into the TCA cycle from carbohydrates and lipids. Glutamine enters the cycle as alpha-ketoglutarate, and branched-chain amino acids entering as citrate and succinyl CoA. Decreased levels of alpha-ketoglutarate are most likely the result of glutamine reduction in the culture medium. As for the increase of fumarate and malate, it might reflect switching catabolic use of branched-chain amino acid metabolism (BCAAs) in order to support the energy demand, n = 5. Welch’s 2-factor t-test was used to identify significant changes in the metabolomic dataset, with a p<0.05 as a threshold for significance (and a trend value of 0.05<p<0.1). For box plots, whiskers reflect 5th and 95th percentiles (with the box displaying 25th to 75th quartiles); bisecting line represents the population median, while “+” represents population mean, for details see: (Weissgerber et al., 2015).
Lipid Synthesis is Enhanced by Simulated Microgravity
Because one of the roles of OLs is the biosynthesis of lipids to form myelin, we next examined the lipid content in the secretome of huOLs while in sim-μG compared to 1G. After three days, the conditioned medium of OLs maintained in sim-μG showed an increase in some fatty acid levels compared to 1G (Fig. 7).
Fig. 7. Lipid metabolism is important for membrane structure and as a critical source of mitochondrial oxidation.
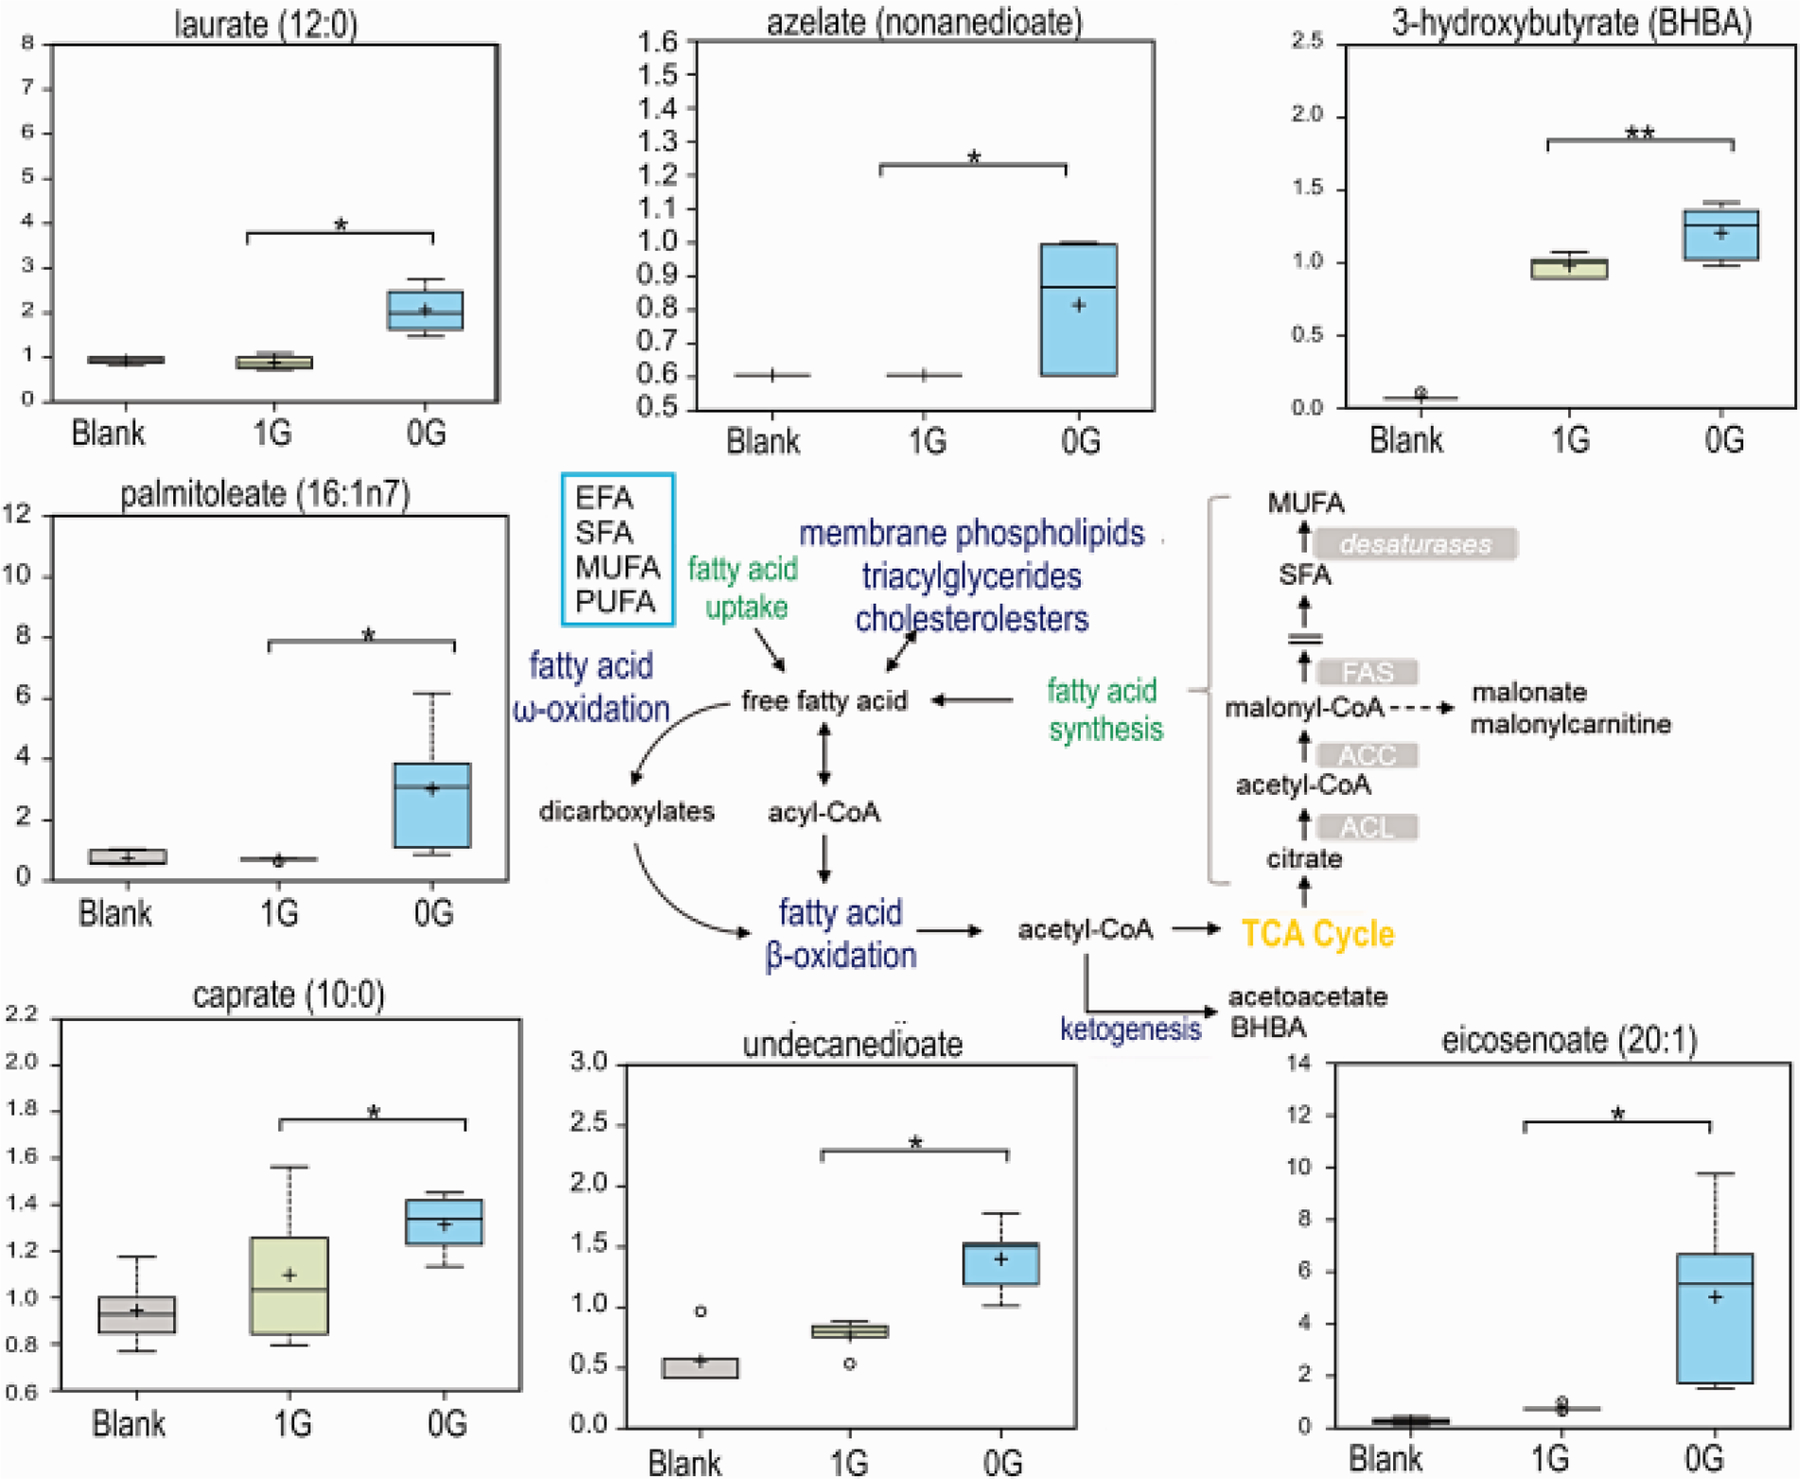
Caprate and laurate 9medium chain FAs) increased in microgravity exposed OLs with respect to OLs maintained in 1G. palmitoleate and eicosenoate longer chain FAs also tended to increase in 0G. The increased complex lipids and lysolipids may indicate the remodeling of phospholipids to produce more FAs. Alternatively, they may be forming the lipids that constitute myelin n = 5. Welch’s 2-factor t-test was used to identify significant changes in the metabolomic dataset, with a p<0.05 as a threshold for significance (and a trend value of 0.05<p<0.1). For box plots, whiskers reflect 5th and 95th percentiles (with the box displaying 25th to 75th quartiles); bisecting line represents the population median, while “+” represents population mean, for details see: (Weissgerber et al., 2015).
Myelin structural lipids are formed with the help of steroid-modifying enzymes and cholesterol-esterifying enzymes such as UDP-galactose:ceramidegalactosyl-transferase as well as enzymes of glycerophospholipid metabolism, including enzymes involved in the synthesis of phosphatidyl ethanolamine. Interestingly, we found that just after three days in microgravity, OLs secreted phosphatidyl ethanolamine. Complex lipids like 1,2-dipalmitoyl-GPC (5.67) lysolipids like 1-oleoyl-GPE (4.48) were also increased by microgravity, indicating in an indirect manner their presence in OLs. It is interesting to note that N-palmitoyl-sphingosine showed a drastic increase of (66.14). In 1G OLs, this biochemical was above the threshold of detection in 20% of samples. In contrast in OLs exposed to 0G it was detected in 100%, which could suggest biosynthetic shifts toward increased sphingolipid production. Similarly, stearoyl sphingomyelin and the phosphatidylserine-containing phospholipid 1-stearoyl-2-oleoyl-GPS were not detected in 1G OLs, but were present in 0G OLs (Fig. 8). Long chain FAs were also elevated as a class, which could be consistent with increased fatty acid production.
Fig. 8.
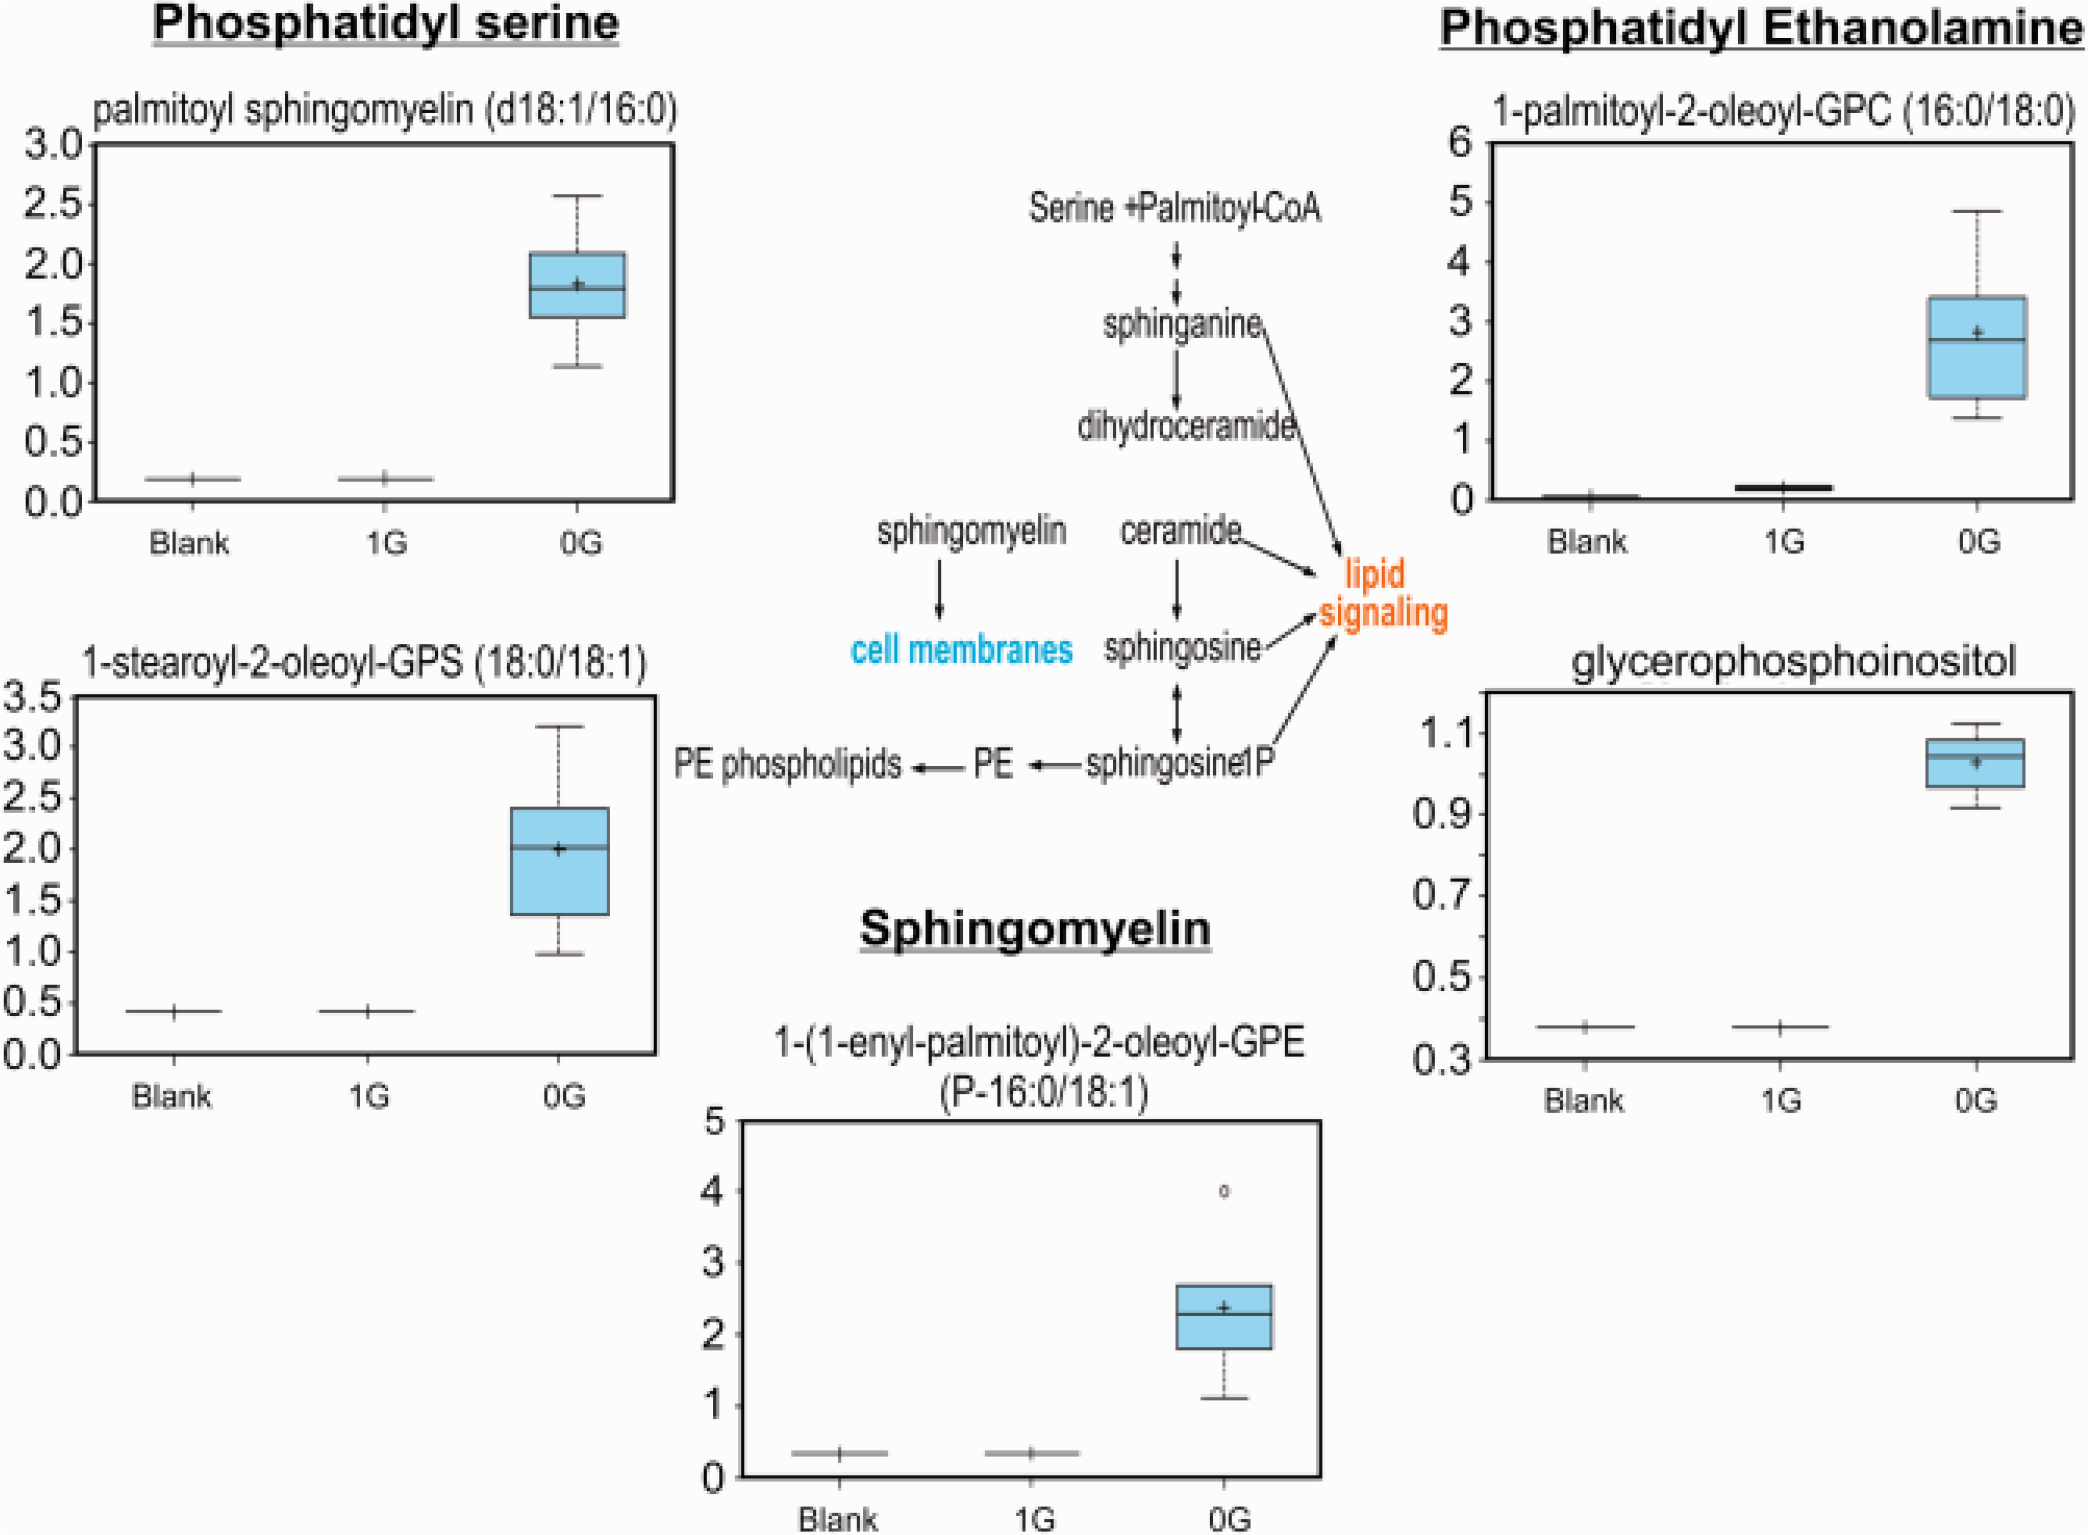
This basic overview of sphingolipid metabolism highlights the increase in palmitoyl and stearoyl sphingomyelins in the dataset, even if they are a lower-fold increase compared to N-palmitoyl-sphingosine, it complements the increases of lipids shown in Fig. 7 n = 5. Welch’s 2-factor t-test was used to identify significant changes in the metabolomic dataset, with a p<0.05 as a threshold for significance (and a trend value of 0.05<p<0.1). For box plots, whiskers reflect 5th and 95th percentiles (with the box displaying 25th to 75th quartiles); bisecting line represents the population median, while “+” represents population mean, for details see: (Weissgerber et al., 2015).
RFA (Random forest assessing)
Blank, 1G and 0G OLs was very effective, with a predictive accuracy of 100% (random chance would be expected to yield a predictive accuracy of 33%). The Biochemical Importance plot highlighted biochemicals related to neurotransmitter biosynthesis (aspartate, N-acetylaspartate), energetics (lactate, alpha-ketoglutarate, malate, pyruvate, citrate, and aconitate) as well as a number of amino acids (Gly, Ser, Pro, Leu, Asn) and their catabolites. N-acetylaspartate (and aspartate) is a precursor to the neuropeptide NAAG, as well as being important for transfer of 2-carbon units for myelin biosynthesis (Fig. 9).
Fig. 9. Random forest RFA.
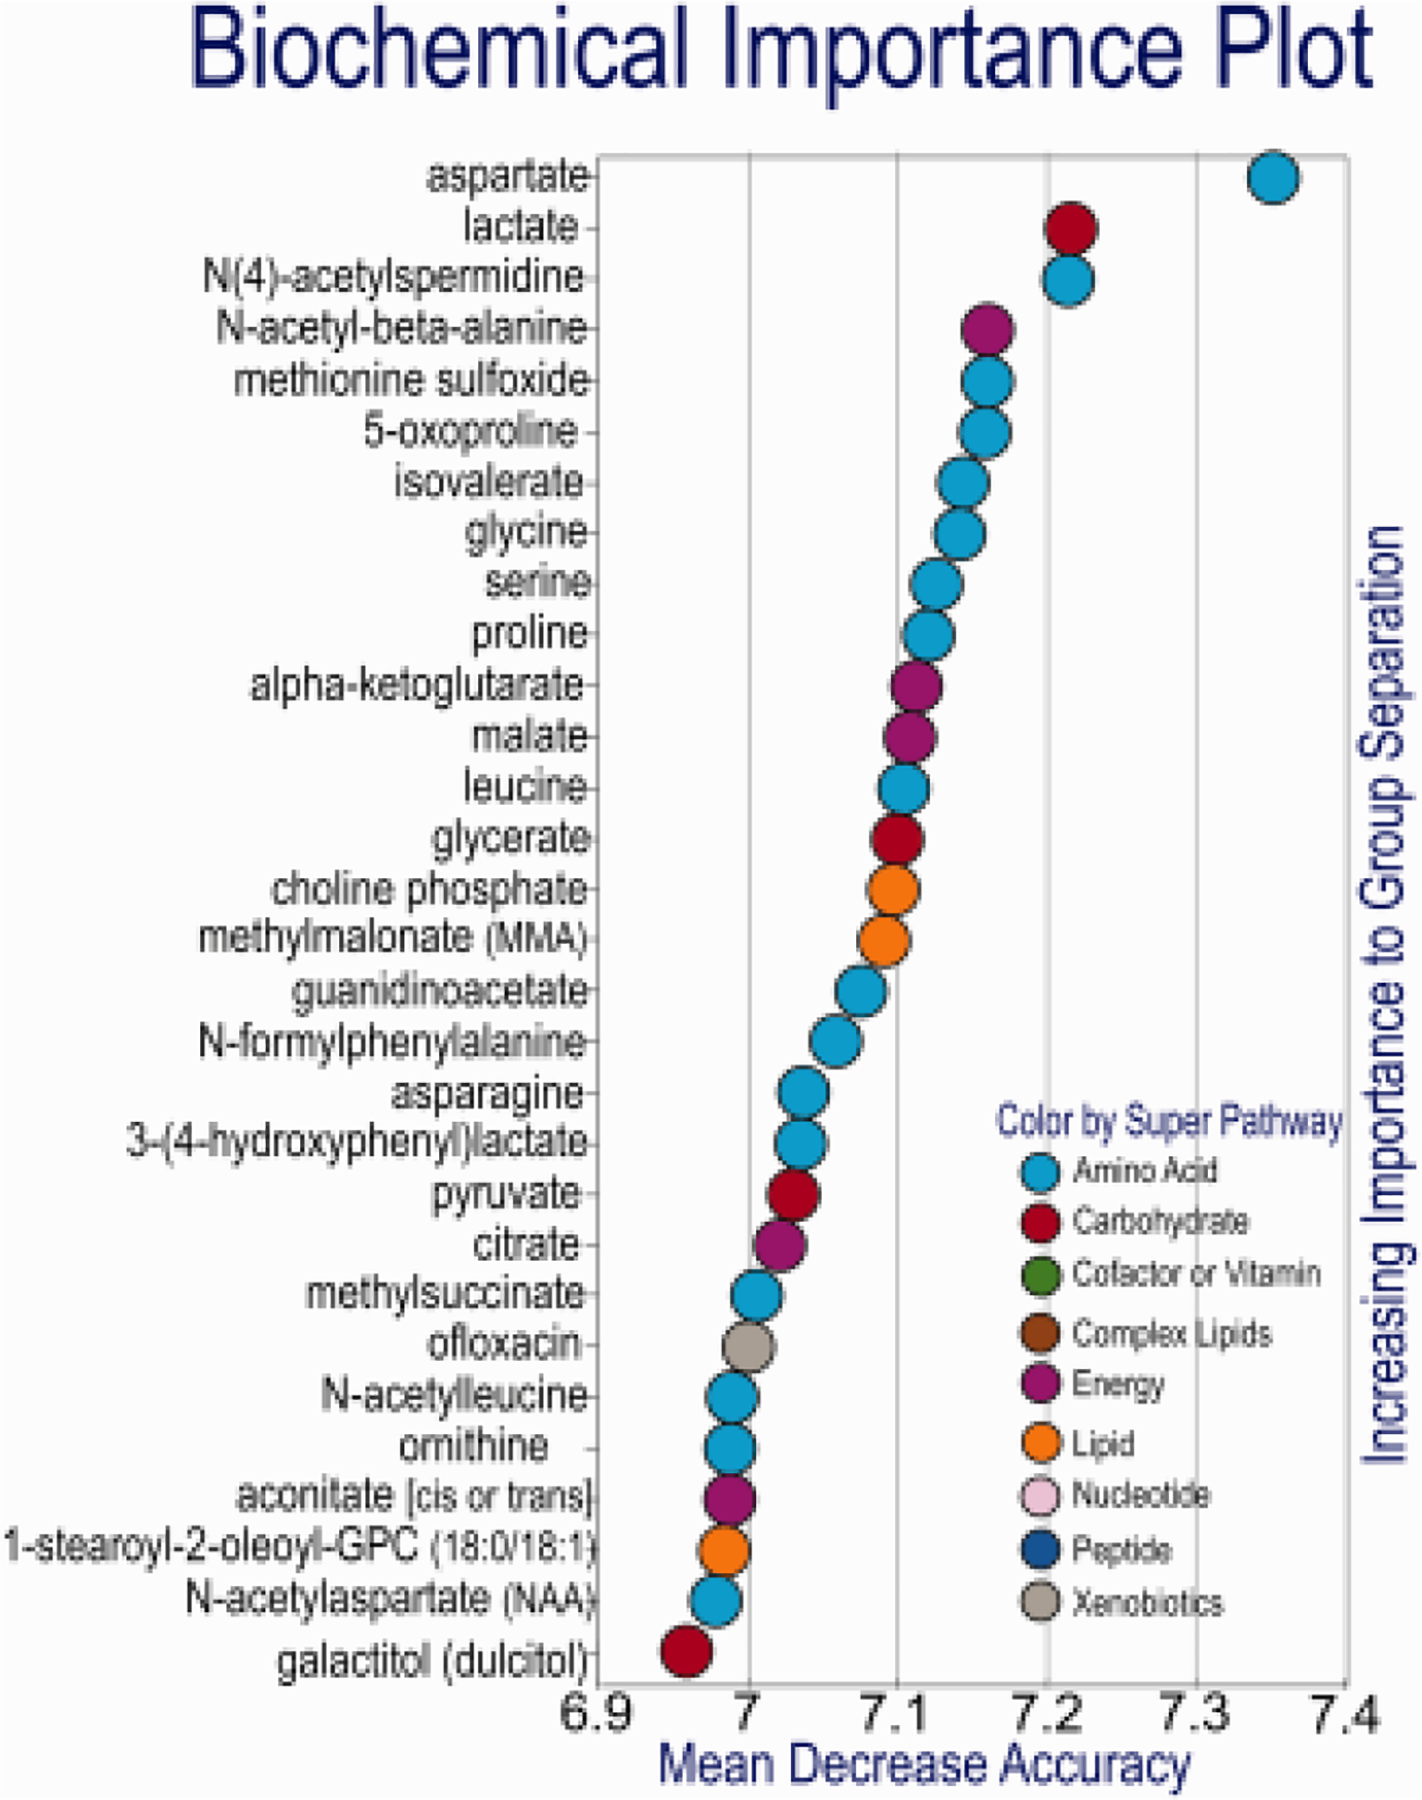
assessing Blank, 1G and 0G OLs was very effective, the Biochemical Importance plot highlighted biochemicals related to neurotransmitter biosynthesis (aspartate, N-acetylaspartate), energetics (lactate, alpha-ketoglutarate, malate, pyruvate, citrate, and aconitate) as well as a number of amino acids (Gly, Ser, Pro, Leu, Asn) and their catabolites. N-acetylaspartate (and aspartate) is a precursor to the neuropeptide NAAG, as well as being important for transfer of 2-carbon units for myelin biosynthesis. It may be of interest to assess myelination in co-culture (or in animals exposed to 0G). Random Forest classification using named metabolites in media of Blank compared to 1G and 0G OLPs gave a predictive accuracy of 100%. Random chance would be expected to yield a predictive accuracy of 33% n = 5. RFA was performed as previously described (Mitchell MW, Open Journal of Statistics, 2011).
HCA (Hierarchical Clustering Analysis)
To gain a better insight of biomarkers distinguishing the 0G from the 1G population, we used Random Forest Analysis, which uses a forest of decision trees to identify important biochemicals to predicting groups (Fig.10). Interestingly, in addition to several amino acids (and related metabolites), pyruvate and lactate were highlighted, as were the TCA cycle metabolites citrate, aconitate, and alpha-ketoglutarate, consistent with metabolic shifts discussed above. The regions of interest 1 and 2 are shown in Figures (11 and 12).
Figure 10. Hierarchical clustering analysis (HCA).
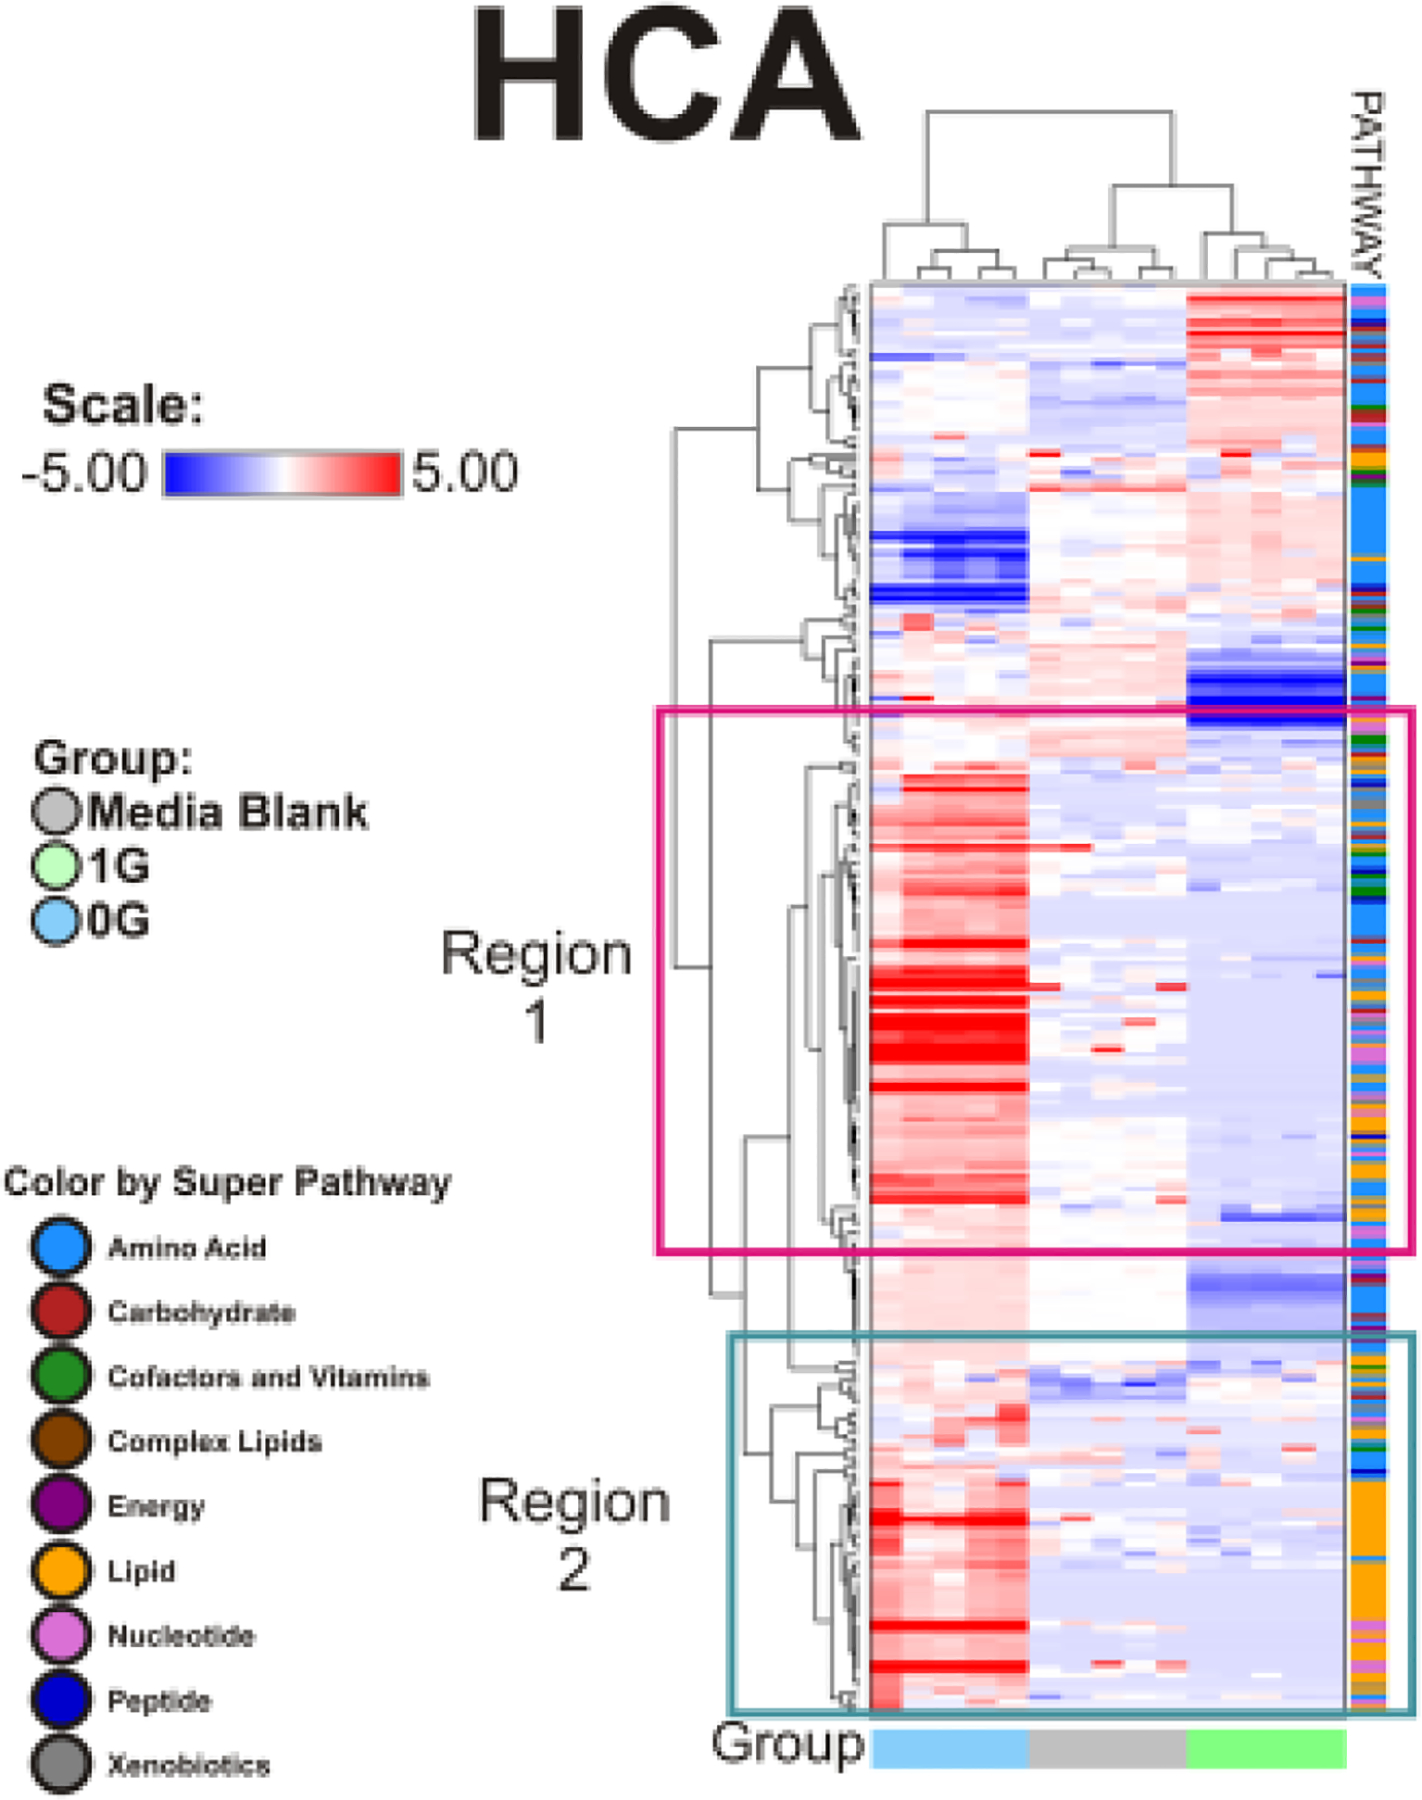
evaluates the variable clustering patterns of the 252 metabolites for production and consumption in OLPs exposed to 0G or 1G. The data is shown in a table format, where the rows represent individual metabolites and the columns represent the serum sample it is derived. The color in each cell reflects the concentration level of each metabolite to its corresponding sample, relative to its mean concentration level across the entire set of tissue samples. Respectively, the colors red, blue, and white within the table indicate an increase, decrease, or no significant change of metabolites. The pathways the metabolites belong to are indicated to the right of the HCA. The HCA compares the metabolite change between the 0G, 1G, and control groups. n = 5 samples per group. HCA data analysis were generated using ArrayStudio.
Fig. 11. Hierarchical clustering analysis: Region of Interest 1 (ROI-1).
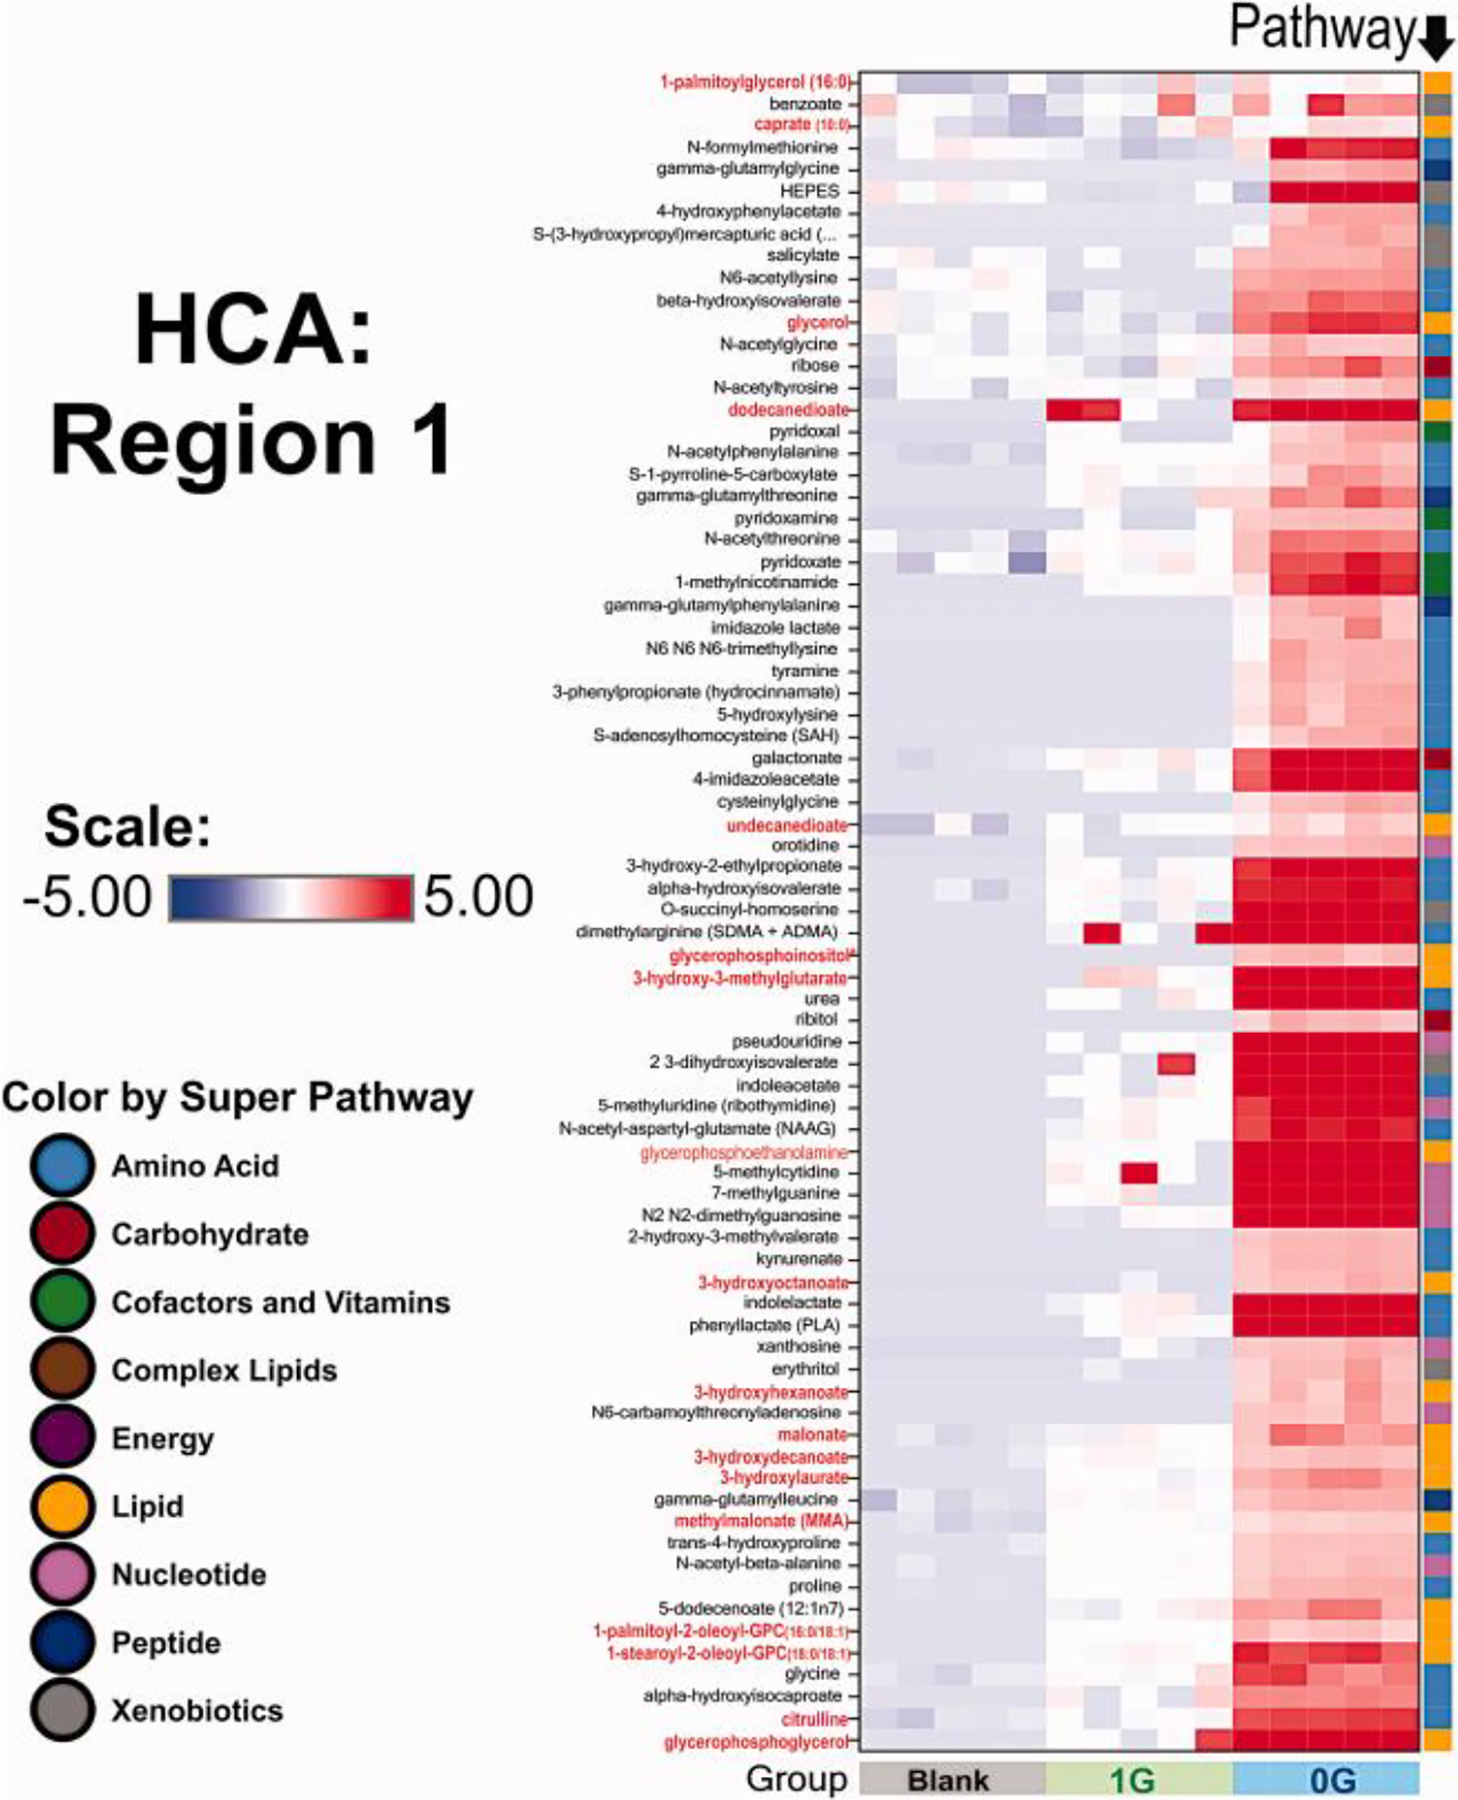
We selected two regions of interest. Region 1 reflects an increased production amino acids (the vast majority) and lipids as shown in the pathway right column. It is interesting to note that 1G OLs did not produce these metabolites during the time of the experiment. n = 5 samples per group. HCA data analysis were generated using ArrayStudio.
Fig. 12. ROI-2.
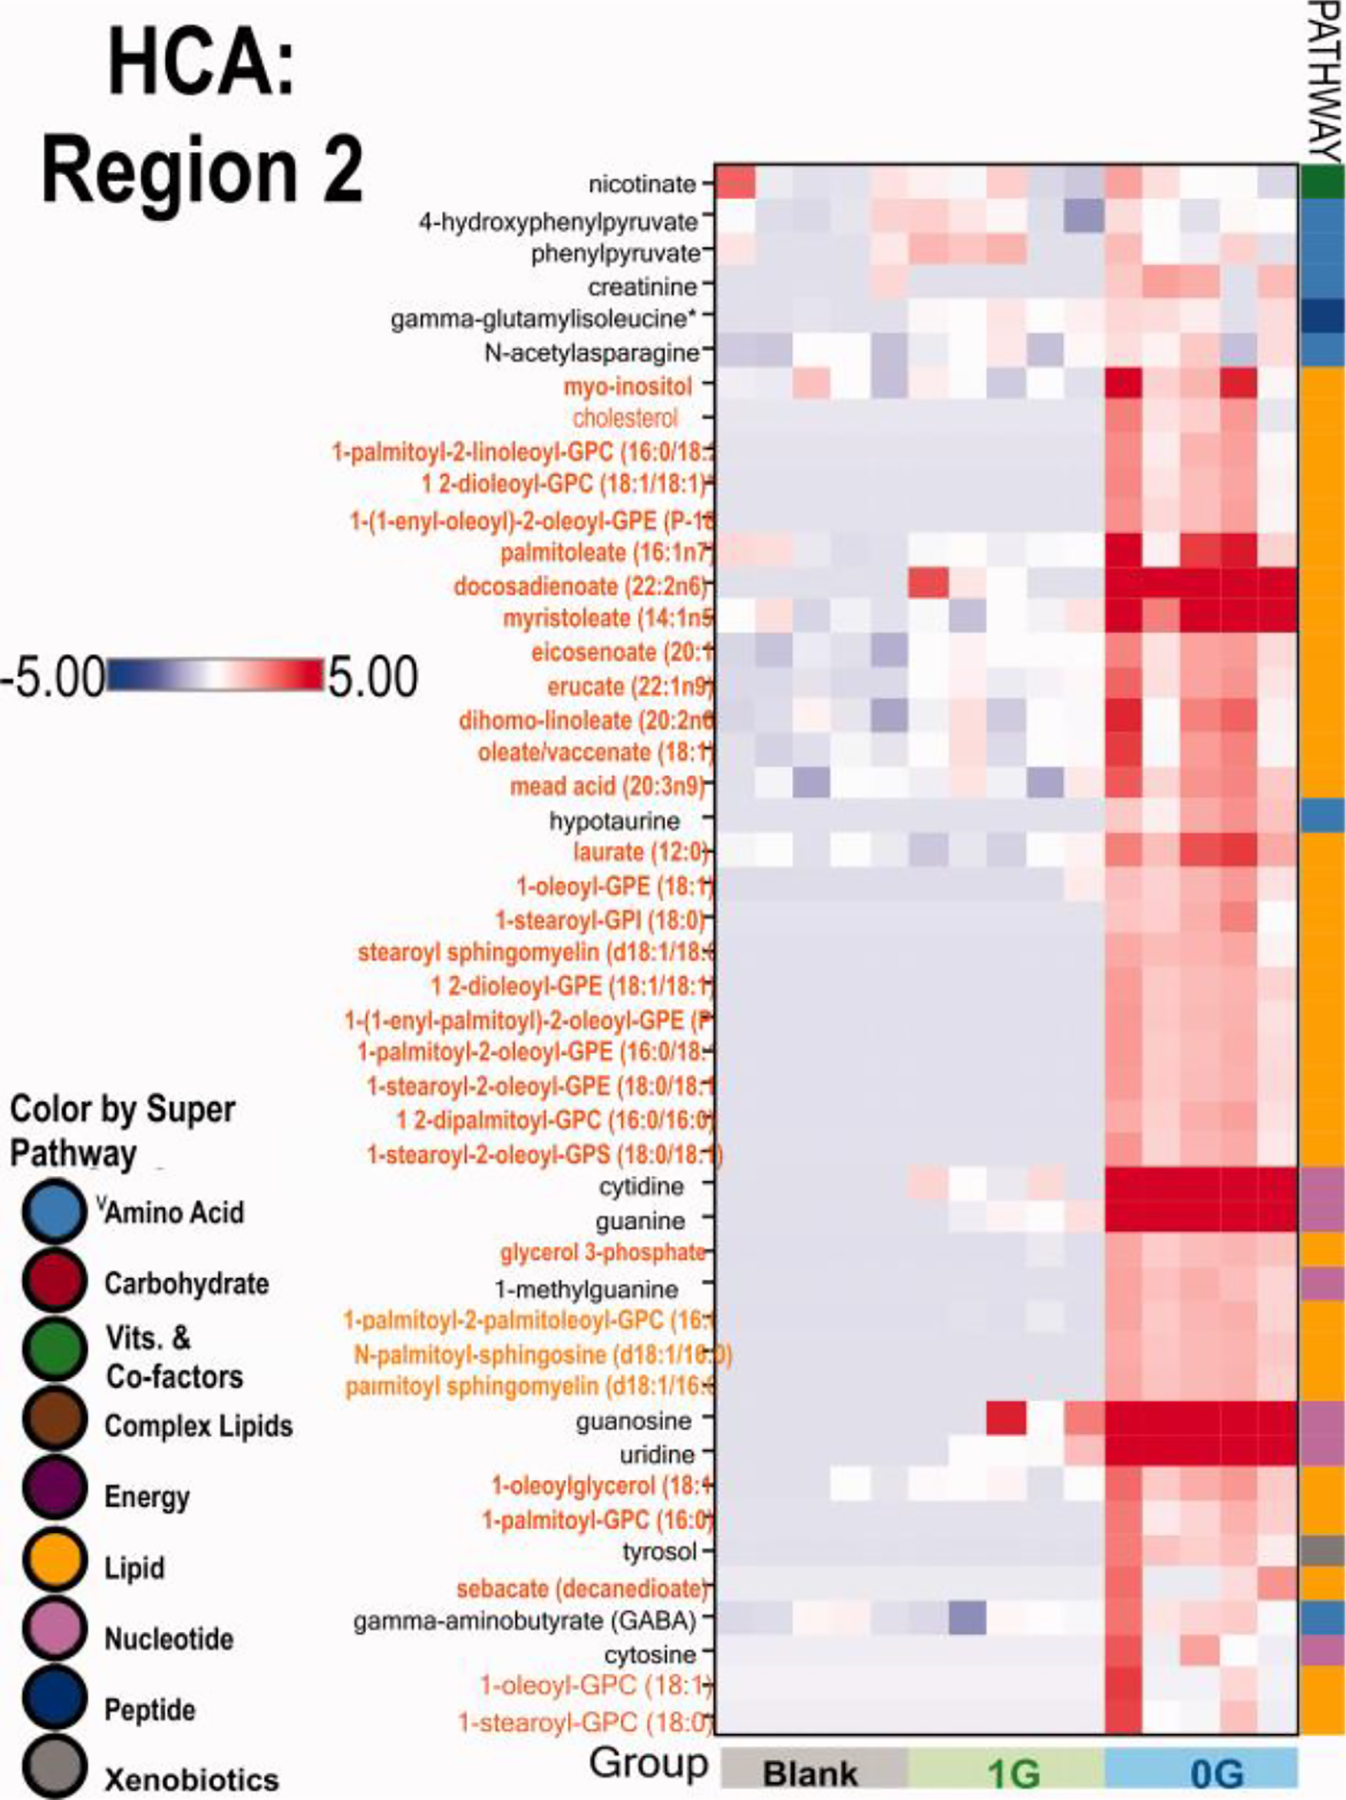
Given the best known function for OLs that is myelination, this region was very interesting because, besides some amino acids, the rest of the products made by OLs in three days exposure to sim-μG were lipids.. n = 5 samples per group. HCA data analysis were generated using ArrayStudio.
PCA (Principal Component Analysis)
To gain a better understanding of changes in OLs cellular metabolism associated with sim-uG, we assessed the metabolome. Data structure was assessed using principle components analysis (PCA): 1G and 0G samples showed good separation, suggesting distinct metabolomic trends associated with sim-μG (Fig. 13).
Fig. 13. Overview of data set.
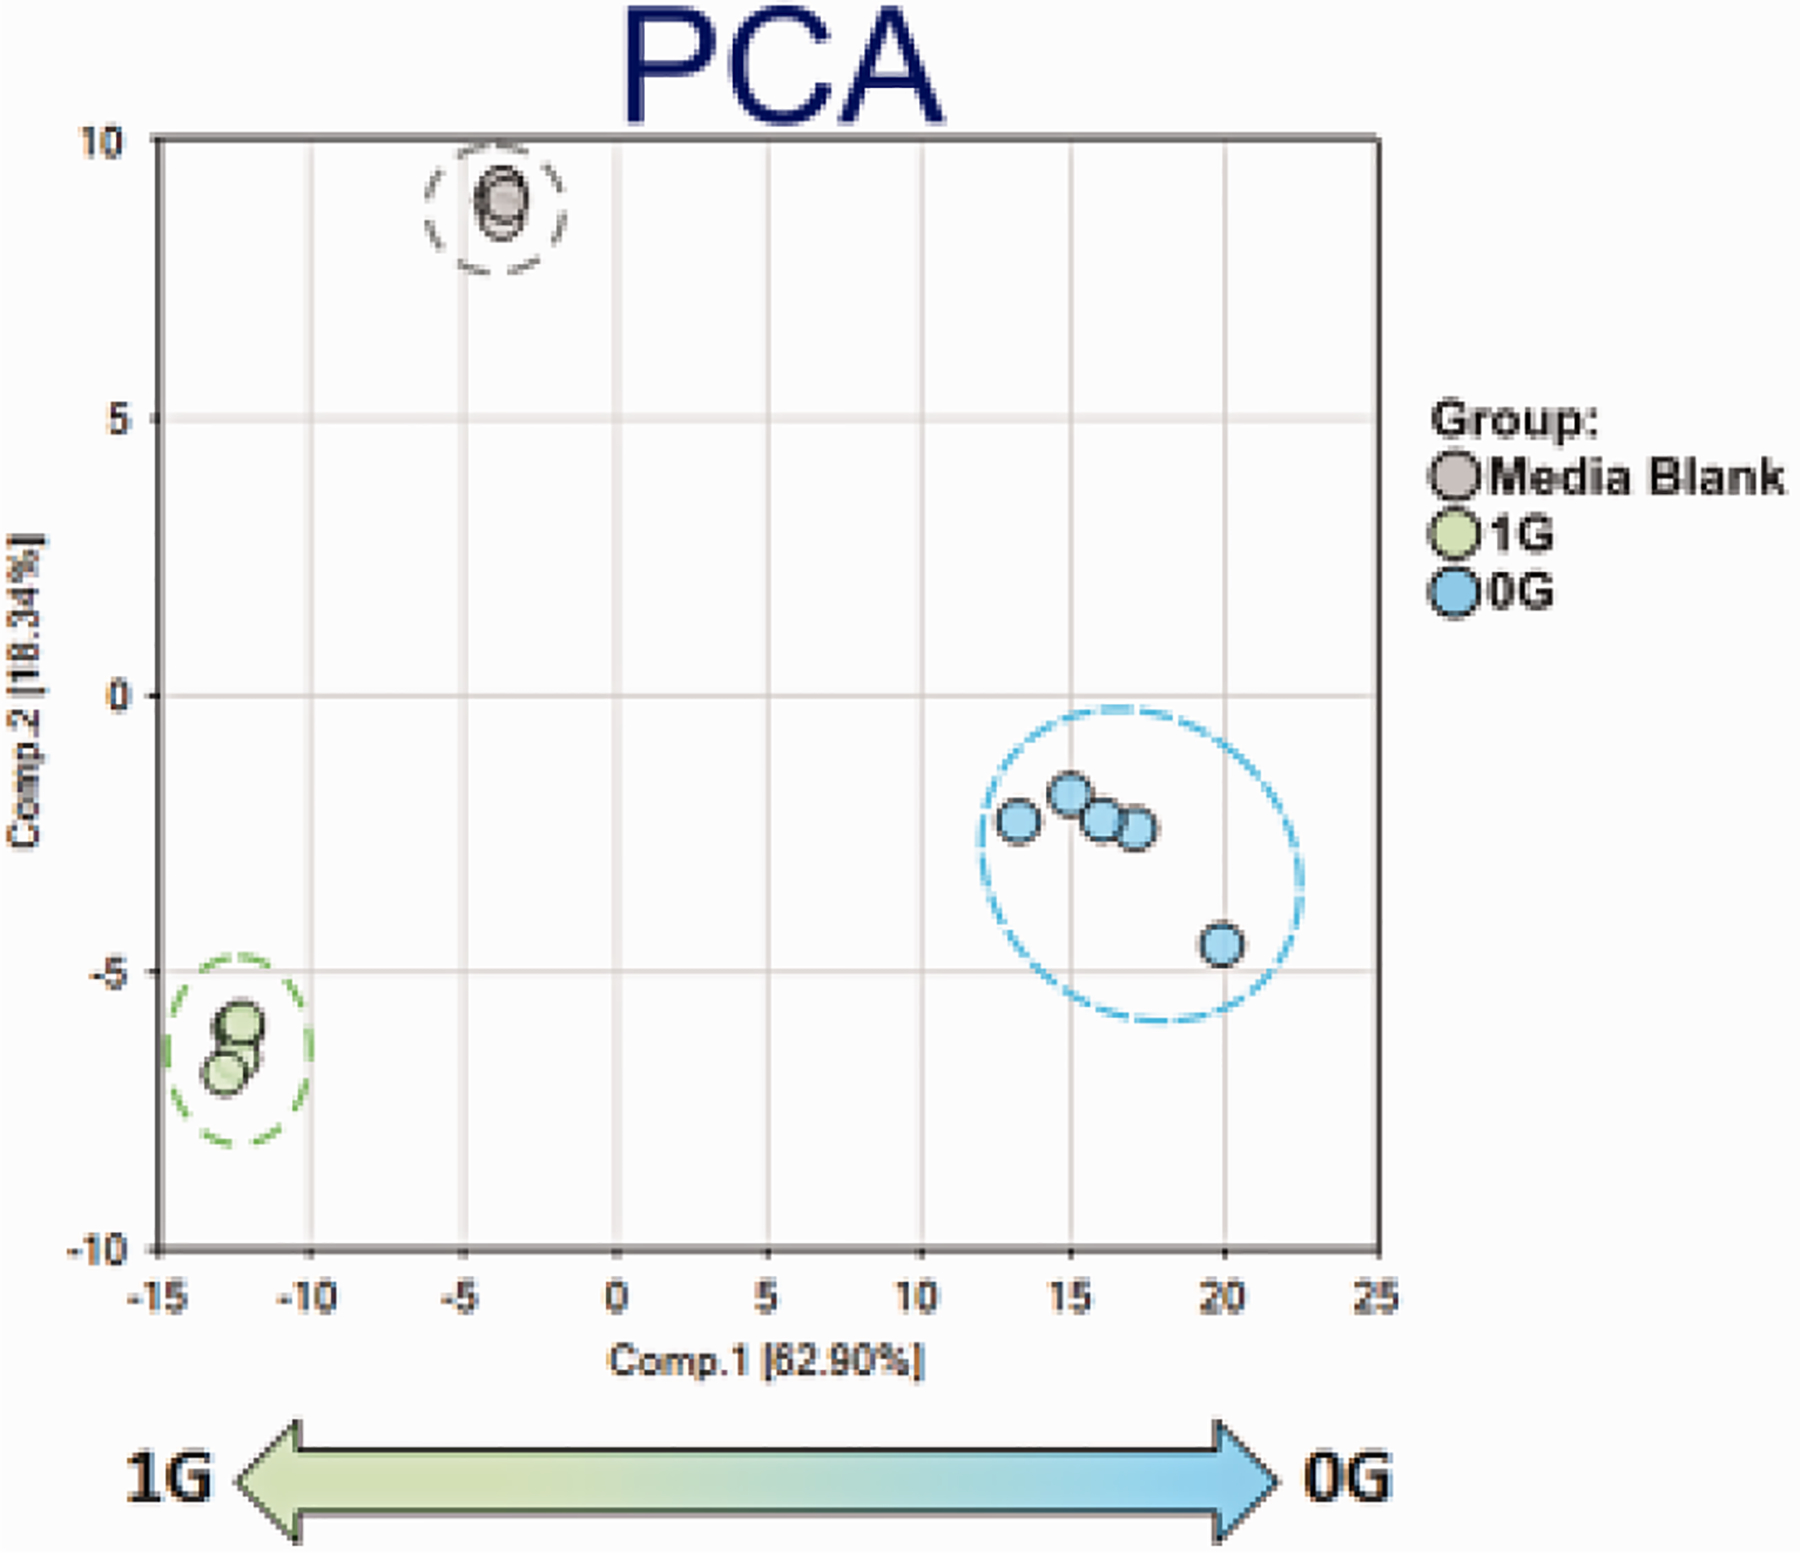
In the PCA, samples showed good separation by treatment, with Component 1 separating between samples by gravitational status (Component 2 separated between blank and conditioned media). 0G samples tended to show higher intra-group variation compared to other treatments, which could reflect regional differences in simulated gravity.. n = 5 samples per group. PCA data analysis were generated using ArrayStudio.
DISCUSSION
Microgravity has been shown to cause cell damage and impair the cell cycle in a variety of biological systems including transiently in neural stem cells (Silvano et al., 2015). We have started to unravel how biological processes in the CNS occur in weightlessness. We have previously showed that the cell cycle is shortened and more oligodendrocyte progenitors are produced in microgravity (Espinosa et al., 2013). Here we sought to determine the metabolic status of OLPs when exposed to sim-μG for 72h.
Energetics
Using metabolic profiling of oligodendroglial cells in sim-μG, we have uncovered significant changes in OLs energetics and lipid metabolism. We revealed the enhancement of two metabolic patterns, energetics and lipid metabolism. After 24h sim-μG, OLs exhibited higher respiratory activity as well as greater respiratory and glycolytic reserve capacity compared with OLs maintained in 1G, suggesting a high energy demand by these cells. From the study of secreted metabolites study (72h in sim-μG), the high levels of glucose and pyruvate utilization, as they entered the Krebs cycle, corroborated the high energy demand elicited by sim-μG in these cells. Altogether, these results indicate that cells maintained in microgravity exhibit enhanced energy production. Lipids can also be synthesized from citrate; so, some of the glucose input into the TCA could be drawn into fatty acid production. In addition, malonate which is produced from hydrolysis of malonyl-CoA was also elevated in 0G vs. 1G OLs. Alpha-ketoglutarate increases could reflect increased glutamine use to support energetics, which could be needed if some citrate was being siphoned into fatty acid biosynthesis.
Lipid metabolism
As mentioned before, fatty acids are a critical source of ATP/energy generation, as well as a support to macromolecule biosynthesis. In our study, increased FAs in OLPs under sim-μG vs. 1G could have increased energy production. Nonetheless, given that OLs are also the cells that synthesize myelin, changes on some of their lipids may also reflect the developmental status of OLs while exposed to microgravity.
Cholesterol is an essential structural lipid for all membranes. In the CNS, almost the entire pool of cholesterol is produced in situ from de novo synthesis (Dietschy and Turley, 2004). Most cell types use glucose, but OLs use ketone bodies as precursors for cholesterol synthesis (Koper et al.,1981). Moreover, enzymes that convert acetoacetate and β-hydroxybutyrate into acetoacetyl-CoA are highly enriched in OLs (Pleasure et al., 1979; Poduslo S., 1989). Because an enormous amount of lipids needs to be synthesized and transferred to the myelin membrane, cholesterol may use more than one route of delivery. A direct transfer of cholesterol from the ER to the plasma membrane exists and may serve as a short cut for the transfer of lipids from their site of synthesis to the cell surface of OLs. Once cholesterol is in the myelin sheath, its turnover slows down resulting in a half-live of months. Cholesterol provides stability to myelin by regulating its fluidity and permeability (rev. Schmitt et al., 2015). The increase in cholesterol found in the secretome of OLs after 3 days in sim-0G indicates that they were producing the lipids necessary for membranes and perhaps some in preparation for the myelinogenic process, just like they do in vivo.
Conjugation with carnitine is a prerequisite for long-chain FAs in order to be transferred across the mitochondrial membrane; we found that with exception of acetylcarnitine, all the other acylcarnitines were below the threshold of detection suggesting a high activity of FAs transport into mitochondria for oxidation and energy production. The increased ketone body 3-hydroxybutyrate (BHBA) and carnitine in the secretome could be due to changes in fatty acid oxidation, to support increased energetics. The main question is: why is there a huge energy demand in respect to cells maintained in 1G? “Would the reason be that OLs are progressing on preparation for the establishment of the premyelinating stage? (Fig. 14). Interestingly, OLs in 1G did not secrete most of these lipids.
Fig. 14.
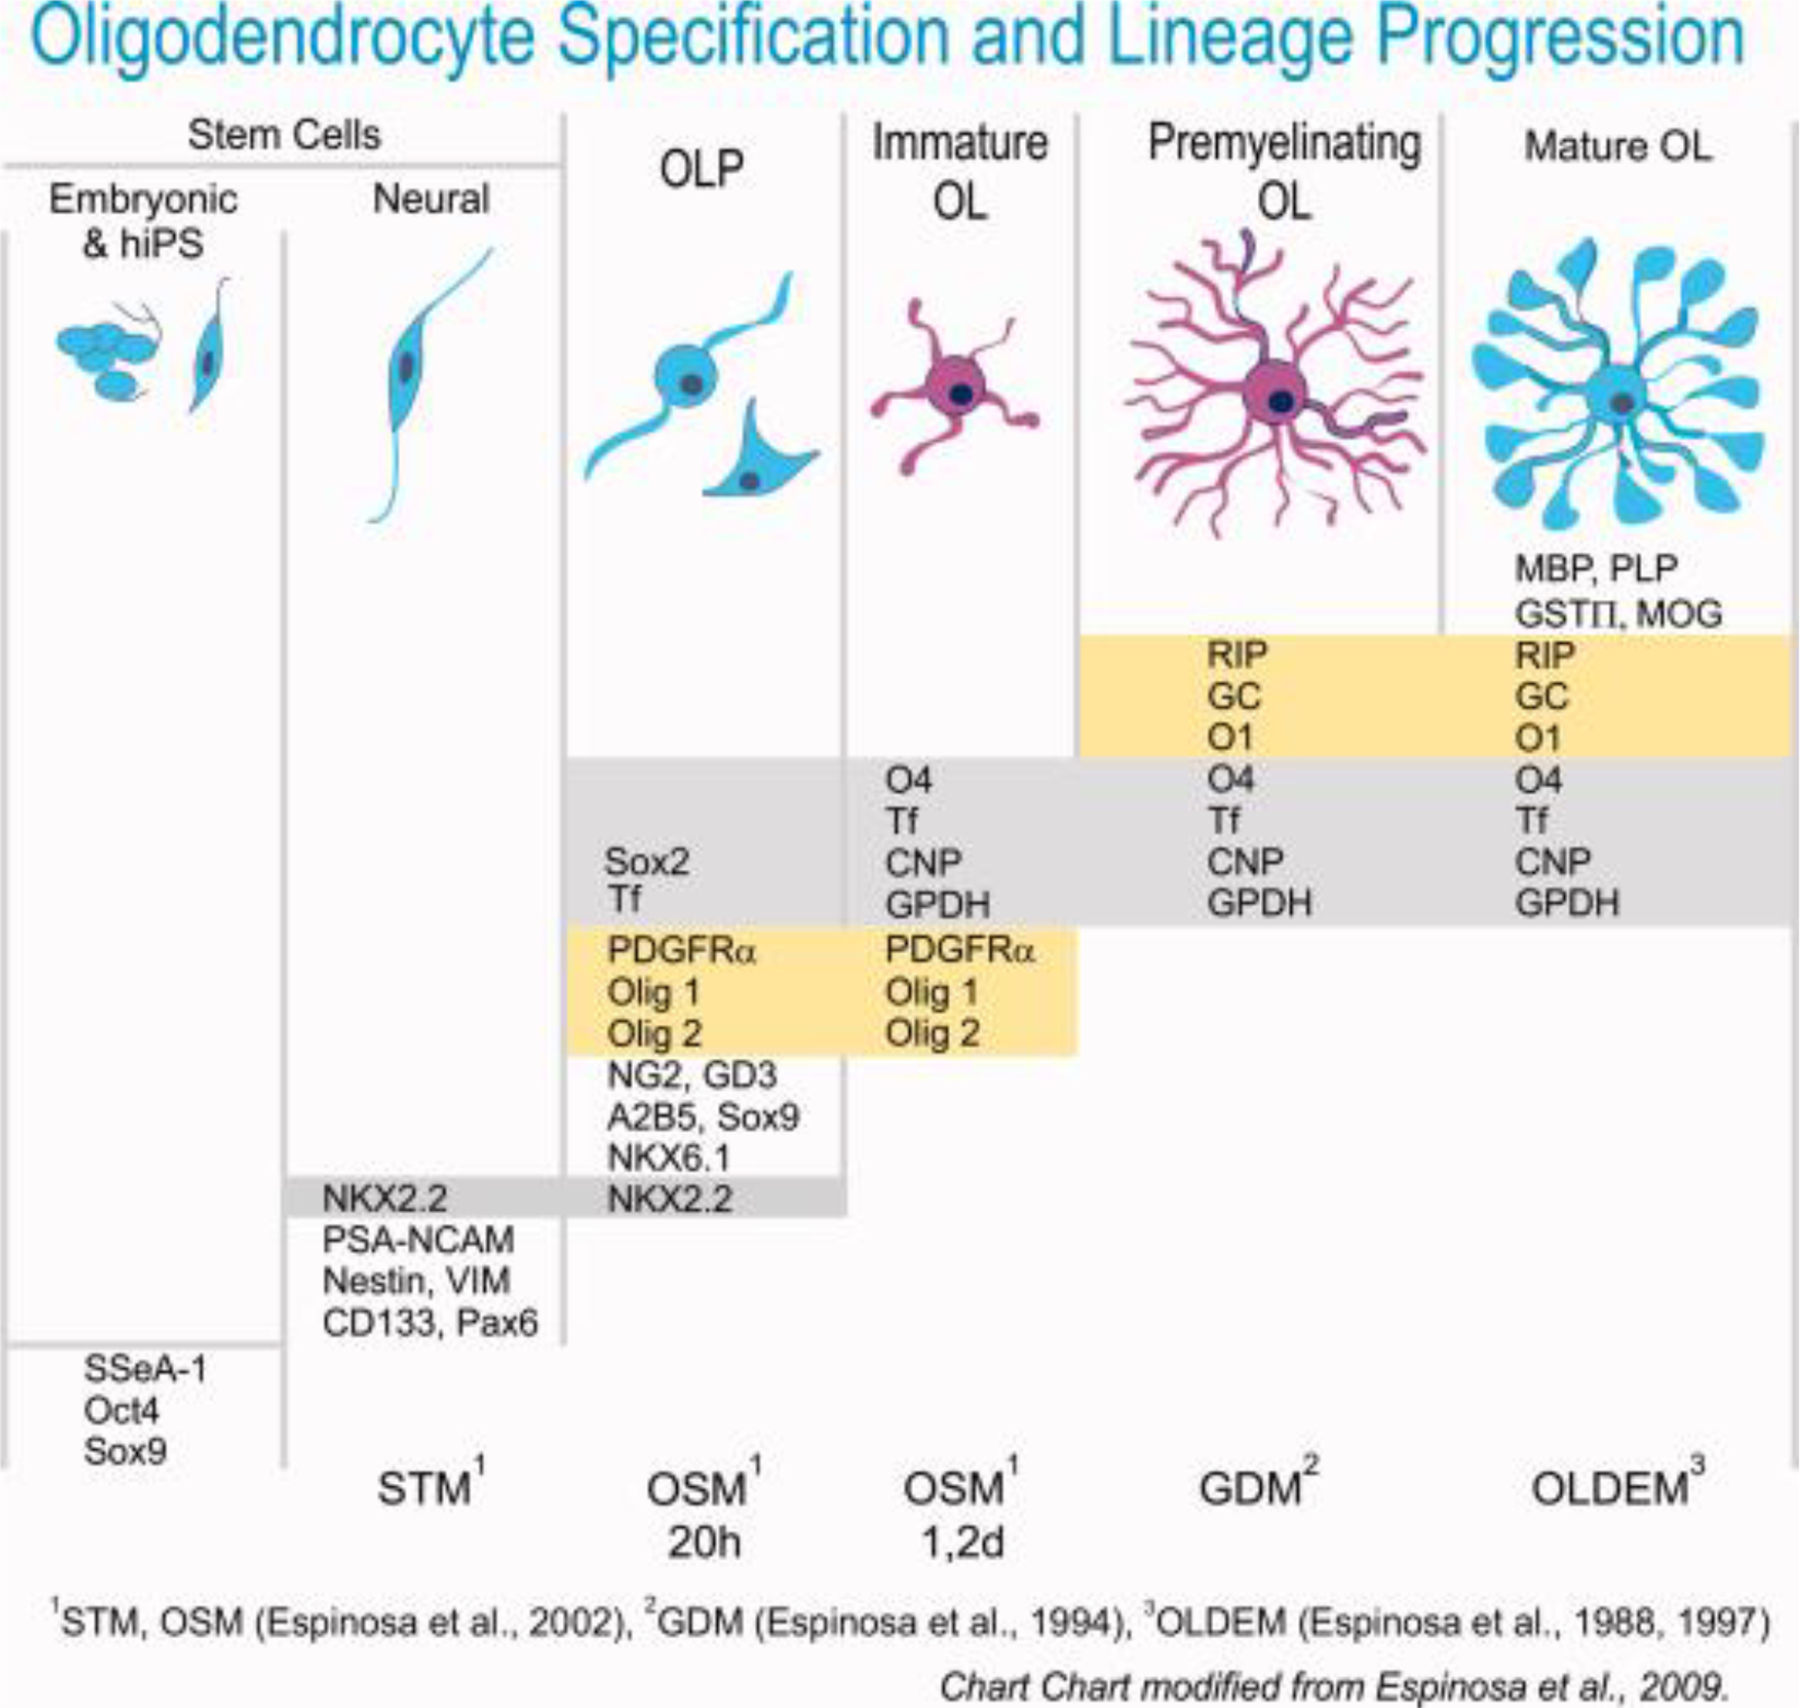
This diagram of OLs development indicates the stage where our cells (in pink) were when they were submitted to sim-μG. In 1G these cells take around one week to move forward to the next step on the lineage. Here we showed that 3 days in sim-μG cells started and increased the secretion of lipids that weren’t yet myelin lipids but just membrane lipids. We postulate that this increased lipid production was because OLs were moving forwards to next stage in the lineage characterized by the formation of numerous hairy-like cell processes while in microgravity. OLPs kept in 1G did not display this phenomenon.
Besides its role in general synthesis of cell and organelle membranes, cholesterol plays several key roles during myelinogenesis, it is a structural lipid but it is not inert. It has dynamic functions such as modulation of translation. It has been shown that during myelinogenesis, the rate of cholesterol synthesis depends on the speed of myelin synthesis. Knock out mouse models, such as Niemann–Pick disease type C protein (NPC1), have shown that cholesterol levels in OLs and neurons are important for proper myelination (Schmitt et al., 2015). Oligodendrocyte-specific squalene synthase mutant mice resulted in the absence of cholesterol, leading to a downregulation of mRNAs for major myelin proteins (Saher et al., 2005; 2010). Thus, cholesterol synthesis and presence appears to be coupled to the metabolism of other myelin components, perhaps determining the maturity of the cell. In addition, it is believed that cholesterol levels determine myelin assembly by regulating energy production and supporting protein translation via mTOR signaling. Recent experiments performed in Zebrafish have shown that high cholesterol levels are required for myelin growth and compaction (Mathews et al., 2014). Some direct interactions between certain myelin proteins containing cholesterol recognition amino-acid consensus (CRAC) motifs and cholesterol have been documented (Saher and Simons, 2010).
It has been reported that as myelin is being formed from 20 to 40 days in the rat brain, FAs and aldehyde patterns change. In a function of time palmitoleic acid, unsaturated C18 aldehydes, oleic acid and monosaturated FAs (C20) display higher values relative to such saturated moieties as palmitic acid, saturated C18 aldehyde, stearic acid and C22 saturated FAs. With age the percentage of long-chain FAs longer than C18 saturated or unsaturated increases in the normal rat brain (Schjeide et al., 1968). The present study for purpose of the secretome analysis was performed after three days in microgravity. A future time course study would allow us to respond if microgravity would elicit the same pattern observed during normal in vivo myelin formation as previously reported (Schjeide et al., 1968). Nonetheless, it is clear that microgravity positively impacted lipid synthesis by OLs by triggering their production faster than in 1G OLs as shown in 1G cultures. This phenomenon although in an indirect manner attests for the presence of the lipid-related enzymes that should have been present in OLs in order to form these lipids. Recently, live-imaging analysis of myelination in zebrafish has shown that OLs (at least in the zebrafish), make new myelin within a period of just five hours (Czopka et al., 2013). We do not know how long a human OL would take to make myelin in sim-0G but, what is clear is that the early abundant production of lipids including some myelin lipids, appears to be more efficient in simulated microgravity than in 1G.
We have previously reported that during and after exposure to sim-μG, OLPs proliferated more than control cells kept in 1G. We also showed that these cells expressed early markers, while a decreased number of cells expressed mature OL markers, such as MBP or CC1. Thus, maturation of these cells appeared to be delayed in a transient manner but, not impaired by exposure to 0G (Espinosa et al., 2013; Oregel et al., 2010). Our current data shows that these apparently immature OLs kept busy producing an enormous amount of lipids in a more efficient manner. Taken together our previous report on a delayed expression of mature myelin markers and the current data, it is clear that OLs addressed the synthesis of enzymes timely and efficiently to be able to produce certain lipidic components of myelin. This phenomenon might consequently delay the expression of mature protein markers such as MBP which is needed later, when the myelin sheath would be formed. It is conceivable that Human OLs secreted newly formed lipids into the culture medium as a survival mechanism and perhaps due to their smaller cell body size and, because of the absence of axons to progress towards a myelinating stage. Moreover, it is also possible that OLs in sim-μG require of more time to produce longer chain myelin-related lipids, after all, 1G OLs did not produce any of the sphingo-lipids in the same period of time. Additionally, in our hands for an optimal OL development, OLs in culture when in 1G, require of GDM (glial chemically defined medium; Espinosa et al., 2009 and 2016) to support the optimal development of immature OL and to reach the mature myelinating stage they require OLDEM (OL defined medium) the OL medium formulation designed to support the production of myelin enzymes and myelin membrane by cultured OLs (Yuan et al., 1992). We have previously shown that rat OLs maintained in sim-μG re-capitulate the developmental stages for OL (Oregel et al., 2010). More experiments are needed to elucidate this and many other questions that come to mind. Finally, the Seahorse experiments and metabolomics revealed significantly higher mitochondrial respiration and glycolysis in immature OLs indicating a switch of source of energy.
Conclusion
Benefits expected for an-kind living and working in microgravity.
We have started to uncover the effects of a short-term exposure to sim-μG on OLs. These are very significant changes in the two main pathways of OL metabolism: Energetics and lipid metabolism. These changes don’t seem to be deleterious to OLs; but rather they appear to be enhanced by microgravity. It appears that their functional potential is preserved and enhanced by microgravity. The increase in lipids suggests membrane synthesis that allows more cell processes necessary for the progression to the pre-myelinating stage. The present is the first study totally innovative to address the effects of microgravity on OL metabolomics. This is a nascent field of research. We have started to unravel the molecular and biochemical changes elicited by microgravity. Numerous studies remain to be performed in order to understand how this new knowledge is applicable to astronauts experiencing long-term space travel and intracranial hypertension which occurs in microgravity and continues to affect them when back to earth.
Benefits expected for humanity on earth.
Originally our long-term goal was, and still is, to be able to produce healthy, transplantable and functional human OLs in adequate numbers to be used for cell replacement therapies to treat myelin deficiencies on earth. This approach will be applicable to either in the premature neonate or patients with other leukodystrophies and neurodegenerative disorders like multiple sclerosis (MS) for which currently there are no cures. Our current data augur well for the use of sim-μG to produce OLs faster and in adequate numbers that exhibit the initial typical features of their myelinating potential while OLs that remained in 1G didn’t.
SIGNIFICANCE.
Myelin is essential for our daily activities. Abnormality in oligodendrocytes (OLs), the myelin forming cells, produces severe central nervous system pathologies during development and in neurodegenerative disorders. In most myelin disorders OL progenitors (OLPs) are present but fail to mature. OLPs exposure to simulated microgravity (0G) results in a large need for energy which appears to be required for extensive lipid secretion. While further studies are needed, enhanced production of membrane lipids suggests that OLPs may progress towards next developmental stages where more extensive cell processes are formed. Moreover, OLPs in 1G did not secrete most of these lipids. Could priming OLPs in 0G enhance membrane formation after grafting?
Acknowledgements
We thank the Cell Culture Core supported by: Grant #PP1498: Neural Cell Culture Core and NIH HD004612 Intellectual & Developmental Disabilities. We also thank partial support from NICHD of the NIH through the Functional Visualization Core. Grant #: U54HD087101-01. NASA # NNX15AB43G, and the University of California Los Angeles. National Center for Research Resources Grant S10RR026744 support through the Cellular and Bioenergetics Core.
The content is solely the responsibility of the authors and does not represent the official views of the funding agencies. We thank Mitsubishi Heavy Industry for the unique opportunity to use the 3D-clinostat in our Cell Culture Core. We also want to thank Dr. Jean de Vellis for the opportunity of working under his leadership, for the pleasure of enjoying his wise opinion and enticing discussions, for sharing his laboratory with us, for his continued support and for allowing us to develop our research projects to the extent of our imagination and legerdemain; Jean, please be assured of our deepest gratitude.
Footnotes
Conflict of Interest Statement:
The authors acknowledge no conflict of interest
REFERENCES
- Aggarwal S, Yurlova L, Simons M. 2011. Central nervous system myelin: structure, synthesis and assembly. Trends Cell Biol. 21: 585–593. [DOI] [PubMed] [Google Scholar]
- Baumann N, Pham-Dinh D. 2001. Biology of oligodendrocyte and myelin in the mammalian central nervous system. Physiol Rev 81:871–927. [DOI] [PubMed] [Google Scholar]
- Czopka T, Ffrench-Constant C, Lyons DA. 2013. Individual oligodendrocytes have only a few hours in which to generate new myelin sheaths in vivo. Dev Cell 25:599–609. [DOI] [PMC free article] [PubMed] [Google Scholar]
- Damm T, Richard S, Tanner S, Wyss F, Egli M, Franco-Obregón A. 2013. Calcium-dependent deceleration of the cell cycle in muscle cells by simulated microgravity. Faseb J 27:2045–2054. [DOI] [PubMed] [Google Scholar]
- DeHaven CD, Evans AM, Dai H, Lawton KA. 2010. Organization of GC/MS and LC/MS metabolomics data into chemical libraries. J Cheminformatics 2:9. [DOI] [PMC free article] [PubMed] [Google Scholar]
- Dietschy JM, Turley SD. 2004[HTML] Thematic review series: brain Lipids. Cholesterol metabolism in the central nervous system during early development and in the mature animal J Lipid Res 45: 1375–97. [DOI] [PubMed] [Google Scholar]
- Espinosa-Jeffery A, Oregel K, Taniguchi A, Green J, Chu B, de Vellis J. 2016. The implications of microgravity on cell morphology and proliferation of stem cell progenies towards astronaut health. To be presented at the 67th International Astronautical Congress, in Guadalajara, Mexico, 26–30 September 2016. [Google Scholar]
- Espinosa-Jeffrey A, Becker-Catania SG, Zhao PM, Cole R, Edmond J, de Vellis J. 2002. Selective specification of CNS stem cells into oligodendroglial or neuronal cell lineage: cell culture and transplant studies. J Neurosci Res 69:810–825. [DOI] [PubMed] [Google Scholar]
- Espinosa-Jeffrey A, Paez PM, Cheli VT, Spreuer V, Wanner I, de Vellis J. 2013. Impact of simulated microgravity on olgidendrocyte development: implications for central nervous system repair. PLoS One 8: e76963. [DOI] [PMC free article] [PubMed] [Google Scholar]
- Espinosa-Jeffrey A, Wakeman DR, Kim SU, Evan SY, de Vellis J. 2009. Culture system for rodent and human oligodendrocyte specification, lineage progression and maturation. Curr Protoc Stem Cell Biol Chapter 2: Unit 2D4. [DOI] [PubMed] [Google Scholar]
- Evans AM, DeHaven CD, Barrett T, Mitchell M, Milgram E. 2009. Integrated, nontargeted ultra high performance liquid chromatography/electrospray ionization tandem mass spectrometry platform for the identification and relative quantification of the small-molecule complement of biological system. Anal Chem 81:6656–67 [DOI] [PubMed] [Google Scholar]
- Graebe A, Schuck EL, Lensing P, Putcha L, Derendorf H. 2004. Physiological, pharmacokinetic, and pharmacodynamic changes in Space. J Clin Pharmacol 44: 837–853. [DOI] [PubMed] [Google Scholar]
- Koper JW, Lopes-Cardozo M, Van Golde LM. 1981. Preferential utilization of ketone bodies for the synthesis of myelin cholesterol in vivo Ketone body utilization for energy production and lipid synthesis in isolated rat brain capillaries Biochem Biophys Acta 666: 411–417. [DOI] [PubMed] [Google Scholar]
- Krebs HA, Weitzman PDJ. 1987. Krebs’ citric acid cycle: half a century and still turning. London: Biochemical Society; p. 25 ISBN 0-904498-22-0 [Google Scholar]
- Lowenstein JM. 1969. Methods in Enzymology, Volume 13: Citric Acid Cycle. Boston: Academic Press; ISBN 0-12-181870-5 [Google Scholar]
- Mathews ES, Mawdsley DJ, Walker M, Hines JH, Pozzoli M, Appel B. 2014. Mutation of 3-hydroxy-3-methylglutaryl CoA synthase I reveals requirements for isoprenoid and cholesterol synthesis in oligodendrocyte migration arrest, axon wrapping, and myelin gene expression. J Neurosci 34:3402–3412. [DOI] [PMC free article] [PubMed] [Google Scholar]
- Nabavi N, Khandani A, Camirand A, Harrison R. 2011. Effects of microgravity on osteoclast bone resorption and osteoblast cytoskeletal organization and adhesion. Bone 49:965–974. [DOI] [PubMed] [Google Scholar]
- Norton WT. 1981. Biochemistry of myelin. Adv Neurol 31: 93–121. [PubMed] [Google Scholar]
- O’Brien JS, Sampson EL. 1965. Lipid composition of the normal human brain: gray matter, white matter and myelin. J Lipid Res 6:537–44 [PubMed] [Google Scholar]
- Oregel KZ, Espinosa-Jeffrey A, et al. 2010. Neural embryonic stem cells cultured in a simulated microgravity environment show enhanced proliferation and survival. J Investigative Med 58: 153. [Google Scholar]
- Pleasure D, Lichtman C, Eastman S, Lieb M, Abramsky O, Silberberg D. 1979. Acetoacetate and D-(−)-beta-hydroxybutyrate as precursors for sterol synthesis by calf oligodendrocytes in suspension culture: extramitochondrial pathway for acetoacetate metabolism J Neurochem 32:1447–1450. [DOI] [PubMed] [Google Scholar]
- Plett P, Abonour R, Frankovitz S, Orschell C. 2004. Impact of modeled microgravity on migration differentiation, and cell cycle control of primitive human hematopoietic progenitor cells. Exp Hematol 8: 773–781. [DOI] [PubMed] [Google Scholar]
- Poduslo SE. 1989. Induction of ketone body enzymes in glial cells. Arch Biochem Biophys 272: 318–322. [DOI] [PubMed] [Google Scholar]
- Saher G, Simons M. 2010. Cholesterol and myelin biogenesis. Subcell Biochem 51:489–509. [DOI] [PubMed] [Google Scholar]
- Schjeide OA, Lin RI-S, de Vellis J. 1968. Molecular composition of myelin synthesized subsequent to irradiation. Radiation Res 33:107–128. [PubMed] [Google Scholar]
- Schmitt S, Castelvetri LC, Simons M. 2015. Metabolism and functions of lipids in myelin. Biochim Biophys Acta 1851:999–1005. [DOI] [PubMed] [Google Scholar]
- Silvano M, Miele E, Valerio M, Casadei L, Begalli F, et al. 2015. Consequences of Simulated Microgravity in Neural Stem Cells: Biological Effects and Metabolic Response. J Stem Cell Res Ther 5:289. [Google Scholar]
- Studer R, Gilbertson L, Georgescu H, Sowa G, Vo N, Kang JD. 2008. p38 MAPK inhibition modulates rabbit nucleus pulposus cell response to IL-1. J Orthop Res 26: 991–8. [DOI] [PubMed] [Google Scholar]
- Weissgerber TL, Milic NM, Winham SJ, Garovic VD. 2015. Beyond bar and line graphs: time for a new data presentation paradigm. PLos Biol 13(4):e1002128. [DOI] [PMC free article] [PubMed] [Google Scholar]
- Yuan J, McCartney DG, Monge M, Espinosa de los Monteros A, Zalc B, de Vellis J, Kanfer JN. 1992. Glycerophosphorylcholine phosphocholine phosphodiesterase activity in cultured oligodendrocytes, astrocytes and central nervous tissue of dysmyelinating rodent mutants. J Neurosci Res 31:68–74. [DOI] [PubMed] [Google Scholar]; Ketone body utilization for energy production and lipid synthesis in isolated rat brain capillaries


