

Abstract
Alzheimer’s disease is characterized by the accumulation of beta-amyloid in plaques, aggregation of hyperphosphorylated tau in neurofibrillary tangles and neuroinflammation, together resulting in neurodegeneration and cognitive decline1. The NLRP3 inflammasome assembles inside of microglia upon activation, leading to increased cleavage and activity of caspase-1 and downstream IL-1β release2. While the NLRP3 inflammasome was shown to be essential for the development and progression of beta-amyloid pathology in mice3, the precise impact on tau pathology remains elusive. Here we show that loss of NLRP3 inflammasome function reduced tau hyperphosphorylation and aggregation by regulating tau kinases and phosphatases. Tau activated the NLRP3 inflammasome and intracerebral injection of fibrillar beta-amyloid-containing brain homogenates induced tau pathology in an NLRP3-dependent manner. These data identify a key role of microglia and NLRP3 inflammasome activation in the pathogenesis of tauopathies and support the amyloid-cascade hypothesis in Alzheimer’s disease, demonstrating that neurofibrillary tangles develop downstream of beta-amyloid-induced microglial activation.
Neuroinflammatory processes are critical in the development and progression of Alzheimer’s disease (AD)1. Aβ activates the NLRP3 inflammasome consisting of NLRP3, ASC and caspase-1. Elevated active, cleaved caspase-1 levels were found in amyloid plaque-containing mice and AD patients4,5 and knockout of ASC or NLRP3 ameliorated amyloid plaque pathology in APP/PS1 transgenic mice3. As intracellular tau deposits are not the predominant pathological signature, AD is considered to be a secondary tauopathy6. Primary tauopathies, like fronto-temporal dementia (FTD), also present with neuroinflammation and cognitive deficits, which can be modelled in mice by overexpressing mutated human tau.
NLRP3 inflammasome activity in FTD
To identify the potential role of the NLRP3 inflammasome in human tauopathy patients, we analyzed cortex samples of FTD patients carrying a tau mutation. We found elevated cleavage of caspase-1 and increased ASC levels and mature IL-1β (p17) (Fig. 1a–d and Extended Data Fig. 1a–c), indicative of NLRP3 inflammasome activation. As a model, we used Tau22 mice, which express human tau FTD mutations and develop tau pathology over time7. We confirmed NLRP3 inflammasome activation by detection of increased levels of cleaved caspase-1 as well as ASC in cerebral samples of 11 months compared with 3 month old Tau22 mice (Fig. 1e, f). In addition, we detected significantly more extracellular ASC specks, which are released upon NLRP3 inflammasome activation, in Tau22 mice by immunohistochemistry (Fig 1g, h and Extended Data Fig. 1d) and increased levels of cleaved caspase-1 and IL-1β (p17) when compared with wildtype (WT) mice (Extended Data Fig. 1e–h).
Figure 1: NLRP3 inflammasome is activated in FTD patients and Tau22 mice.
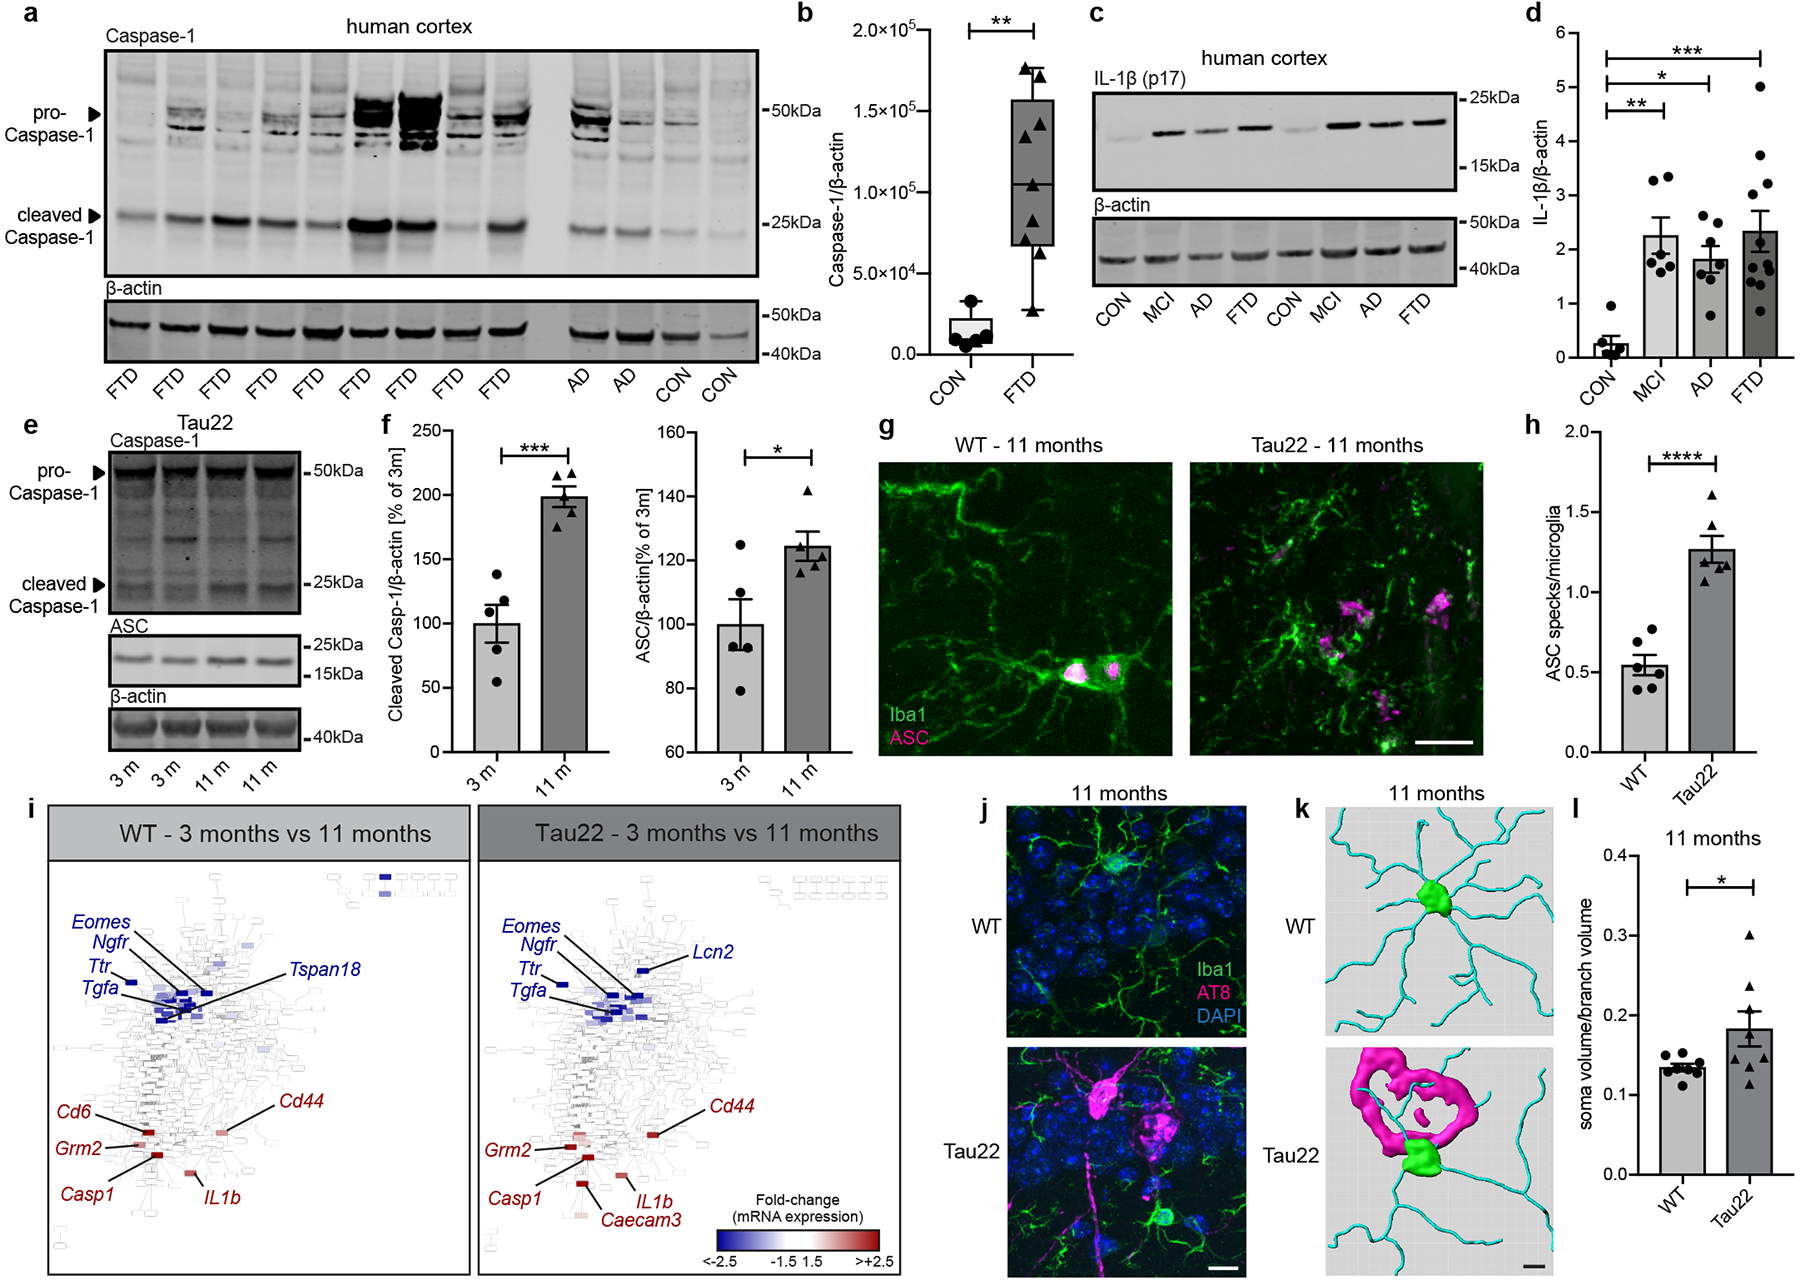
a, Immunoblot detection of Caspase-1 and β-actin in cortex of frontotemporal dementia patients (FTD), Alzheimer’s disease patients (AD) and controls (CON).
b, Quantification of CON and FTD data from a. Box plots show 25/75 percentile. n=5 for CON, n=9 for FTD, **P=0.0018.
c, Immunoblot analysis of IL-1β (p17) and β-actin in cortex of CON, mild cognitive impairment (MCI), AD and FTD patients.
d, Quantification of data from c. n=6 for CON and MCI, n=7 for AD, n=11 for FTD. **P=0.0049, *P=0.0269, ***P=0.0009.
e, Immunoblot detection of Caspase-1, ASC and β-actin in hippocampi of Tau22 mice (3 and 11 months).
f, Quantification of data from e. n=5, ***P=0.0004, *P=0.0281.
g, Immunohistochemical staining for microglia and ASC close to the CA1 region in WT and Tau22 mice. Scale bar, 10μm.
h, Quantification of ASC specks/microglia from staining in g. n=6, ****P<0.0001.
i, Gene network analysis of regulated genes at 3 vs. 11 months in WT and Tau22 mice identified by NanoString analysis.
j, Immunohistochemical staining for microglia and phosphorylated Tau (AT8) in WT and Tau22 mice. n=8. Scale bar, 10μm.
k, Reconstruction of microglia (green/blue) in WT and Tau22 mice close to an AT8-positive neuron (magenta). Scale bar, 20 μm.
l, Quantification of soma to branch volume of microglia located close to the CA1 region in WT or microglia in contact with AT8-positive cells in Tau22 mice. n=8, *P=0.0491.
For gel source data, see Supplementary Figure 1. Data are mean ± SEM and were analyzed by two-tailed unpaired t-test (b, f, h, l) or one-way ANOVA with Tukey’s test (d).
Gene expression analysis of neuroinflammation-associated genes of cerebral samples (Extended Data Fig. 2a) revealed age- but not genotype-related differences between WT and Tau22 mice (Extended Data Fig. 2b). We visualized the dynamics of gene expression patterns in a co-regulation network (Fig. 1i and Extended Data Fig. 2c). Casp1 and Il-1b were amongst the top up-regulated genes indicating that the NLRP3 inflammasome pathway is induced and possibly plays a central role during normal aging as reported previously8 as well as neuroinflammatory and degenerative processes. SOM clustering identified genes participating in tau pathogenicity. Genes were grouped according to similar expression levels at indicated time points in WT or Tau22 mice (Extended Data Fig. 2d) and defined as signature genes for each condition based on elevated expression levels (Supplementary Data Table 1). Gene set enrichment analysis (GSEA) of highly expressed genes in 3 month old WT animals were enriched in biological processes like ‘translation’ or ‘synthetic processes’ (gene signature i., Extended Data Fig. 2d). Microglia programming changed during aging (8 months) indicated by highly expressed genes associated with ‘trans-synaptic signaling’ and ‘regulation of communication’ (data not shown). However, regulation of these gene clusters was absent in Tau22 mice. The reduced number of genes in the signature iii prohibited a GSEA. Genes in clusters iv-vi in 3 month old Tau22 mice revealed an association to immune responses, indicating involvement of immunological processes at disease onset. At later stages of disease development, genes upregulated in Tau22 mice participated in functions like ‘response to stress’ (Extended Data Fig. 2e). A GSEA analysis of genes highly expressed in 8 month old Tau22 mice was not feasible due to low gene numbers (Supplementary Data Table 1). Previous studies described an active Type I interferon (IFN) signature in human AD9. Mice lacking IFNAR1 were resistant against Aß1–42-induced neurotoxicity10. Up to 73% of genes from cluster iv. and vi. are interferon-associated (Extended Data Fig. 2f). We visualized central highly interacting genes in a network, which we hypothesized might regulate or collaborate with other genes during disease development. The network for genes upregulated in Tau22 mice at 3 months showed two clusters of highly interactive genes (Extended Data Fig. 3a): one cluster associated with pro-inflammatory signaling cascades like Jun, Fas, and Toll-like receptors; and a second cluster consisting of chromatin remodelers, like Hdac2, indicating that microglia function at early stages of tau pathology involves remodeling of the epigenetic landscape. The network for genes higher expressed in Tau22 mice at 11 months was less dense (Extended Data Fig. 3b). Central genes were Irak1, MyD88 and Il1rap, which indicate the inflammatory phenotype of tau pathology. Next, we studied microglia and astrocyte morphology close to hyperphosphorylated tau-positive neurons (indicated by AT8 staining) in the CA1 region at different stages of tau pathology (3, 8 and 11 months of age). This analysis revealed microglial changes at 8 and 11 months when substantial tau pathology is present in these mice (Fig. 1j–l and Extended Data Fig. 4a), while astrocyte morphology did not change (Extended Data Fig. 4b).
NLRP3 loss protects from tau pathology
To assess whether the NLRP3 inflammasome is involved in the pathogenesis of tauopathies, we crossed Tau22 mice with mice deficient in Pycard (Tau22/Asc−/−) or Cias1 (Tau22/Nlrp3−/−). Notably, we detected lower levels of cleaved caspase-1 and IL-1β as well as reduced ASC speck formation and release in NLRP3 inflammasome deficient mice (Extended Data Fig. 5a–e), thereby confirming that ASC and NLRP3 mediate the inflammasome activation in Tau22 mice. Analysis of tau (AT8) revealed lower levels of tau hyperphosphorylation in the hippocampus, CA1 cell body region and granular cell layer of the dentate gyrus in aged Tau22/Asc−/− and Tau22/Nlrp3−/− mice (Fig. 2a, b and Extended Data Fig. 6a–d). Additionally, aggregated Tau levels, as assessed by Thioflavin staining, were reduced at 11 months (Fig. 2c, d) and less misfolded tau, as indicated by MC1 immunoblot analysis, was present in the soluble fractions of hippocampus of aged Tau22 mice deficient for NLRP3. Interestingly, human tau levels were decreased in Tau22/Asc−/− and Tau22/Nlrp3−/− mice at 8 months, but not 11 months of age (Extended Data Fig. 6e–h), probably indicating a plateau in tau expression at this age7. Furthermore, the loss of NLRP3 inflammasome components rescued the spatial memory deficits present in Tau22 mice7 (Fig. 2e, f). Our analysis of microglia numbers and area covered by astrocytes at 8 and 11 months of age showed no significant differences between genotypes (Extended Data Fig. 7a–d).
Figure 2: Loss of NLRP3 inflammasome function decreases tau pathology and improves cognition.
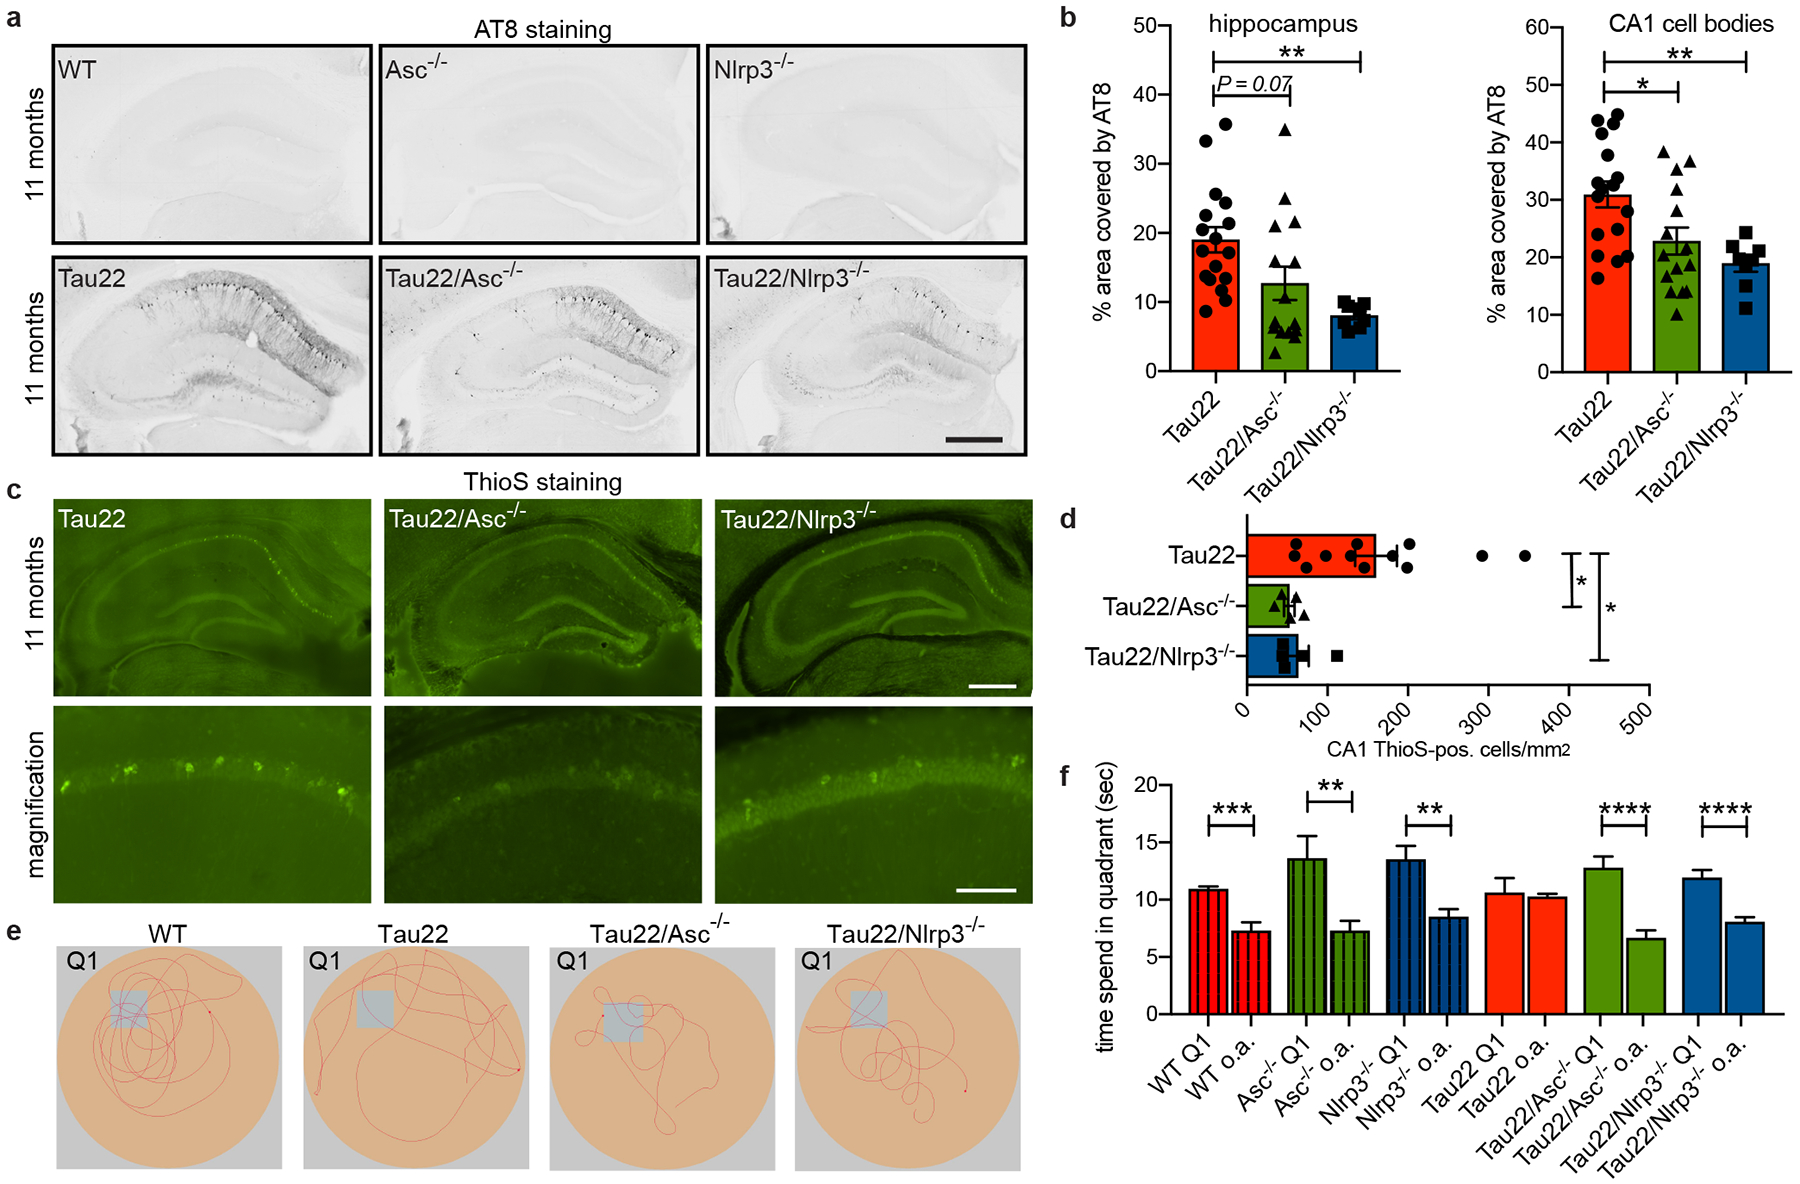
a, Immunohistochemical staining for phosphorylated tau (AT8) in mouse hippocampi. Scale bar, 500μm.
b, Quantification of AT8 in hippocampus and CA1 region shown in a. n=17 for Tau22, n=15 for Tau22/Asc−/−, n=8 for Tau22/Nlrp3−/−. Hippocampus: **P=0.0055, CA1: *P=0.0278, **P=0.0059.
c, Staining with thioflavine S (aggregated Tau) of mouse hippocampi. Scale bar, 500μm (top) and 100μm (bottom).
d, Quantification of thioflavine S-positive cells in CA1 region shown in c. n=12 for Tau22, n=5 for Tau22/Asc−/− and Tau22/Nlrp3−/−. Tau22 vs. Tau22/Asc−/−: *P=0.0240, Tau22 vs. Tau22/Nlrp3−/−: *P=0.0444.
e, Example of movement of mice in Morris water maze test (MWM).
f, Quantification of time spend in quadrant 1 (Q1) vs. all other quadrants (a.o.) in MWM. n=12 for WT, Nlrp3−/−, Tau22/Asc−/−, Tau22/Nlrp3−/−, n=14 for Asc−/−, n=16 for Tau22. ***P=0.0001, ****P<0.0001, Asc−/−: **P=0.0065, Nlrp3−/−: **P=0.0012. For gel source data, see Supplementary Figure 1. Data are mean ± SEM and were analyzed by one-way ANOVA with Tukey’s test (b, d) or two-tailed unpaired t-test (f).
NLRP3 regulates kinases and phosphatases
Several kinases and one major phosphatase (PP2A) regulate Tau phosphorylation11. We found decreased levels of the inactive phosphatase PP2A accompanied by lower levels of its negative regulator PME-112 in hippocampus samples of Tau22/Asc−/− and Tau22/Nlrp3−/− mice (Fig. 3a–c). Furthermore, GSK-3β kinase activity was reduced in Tau22/Nlrp3−/− mice while the kinase activities of CDK5 (measured by the ratio of its regulators p25 and p35) and p38 remained unchanged (Fig. 3d–f). In contrast, the amount of active CaMKII-α was diminished in both, Tau22/Asc−/− and Tau22/Nlrp3−/− mice (Fig. 3g), likely explaining the reduced levels of tau phosphorylation at Ser416 (a CaMKII-α target site) in the CA1 region of Tau22/Asc−/− and Tau22/Nlrp3−/− (Fig. 3h, i). To identify inflammatory genes which could be involved in the reduction of tau pathology, we compared the gene expression of cerebral samples from Tau22 and Tau22/Nlrp3−/− mice (Extended Data Fig. 8a). We identified 18 genes that were either significantly induced or suppressed in Tau22/Nlrp3−/− mice (Extended Data Fig. 8b–d). Among these, Ccl3 was reduced in 11 month old Tau22/Nlrp3−/− mice, which represents a microglia-produced pro-inflammatory component, and its reduction improves memory in Tau22 mice13. The immunoreceptor Cd300lf, which is expressed in astrocytes, oligodendrocytes and microglia, was downregulated in Tau22 and upregulated in Tau22/Nlrp3−/− mice at all ages. Interestingly, overexpression of Cd300lf was shown before to be neuroprotective in a model of acute brain injury14. In addition, Arc, a protein implicated in synaptic plasticity and memory formation15, was upregulated in aged Tau22/Nlrp3−/− mice, suggesting a close interaction between microglia and neurons. We found no evidence of gut inflammation in Tau22 and Tau22/Nlrp3−/− mice (Extended Data Fig. 9a–o).
Figure 3: Nlrp3- and Asc-KO inhibits CaMKII-α and promotes phosphatase activity.
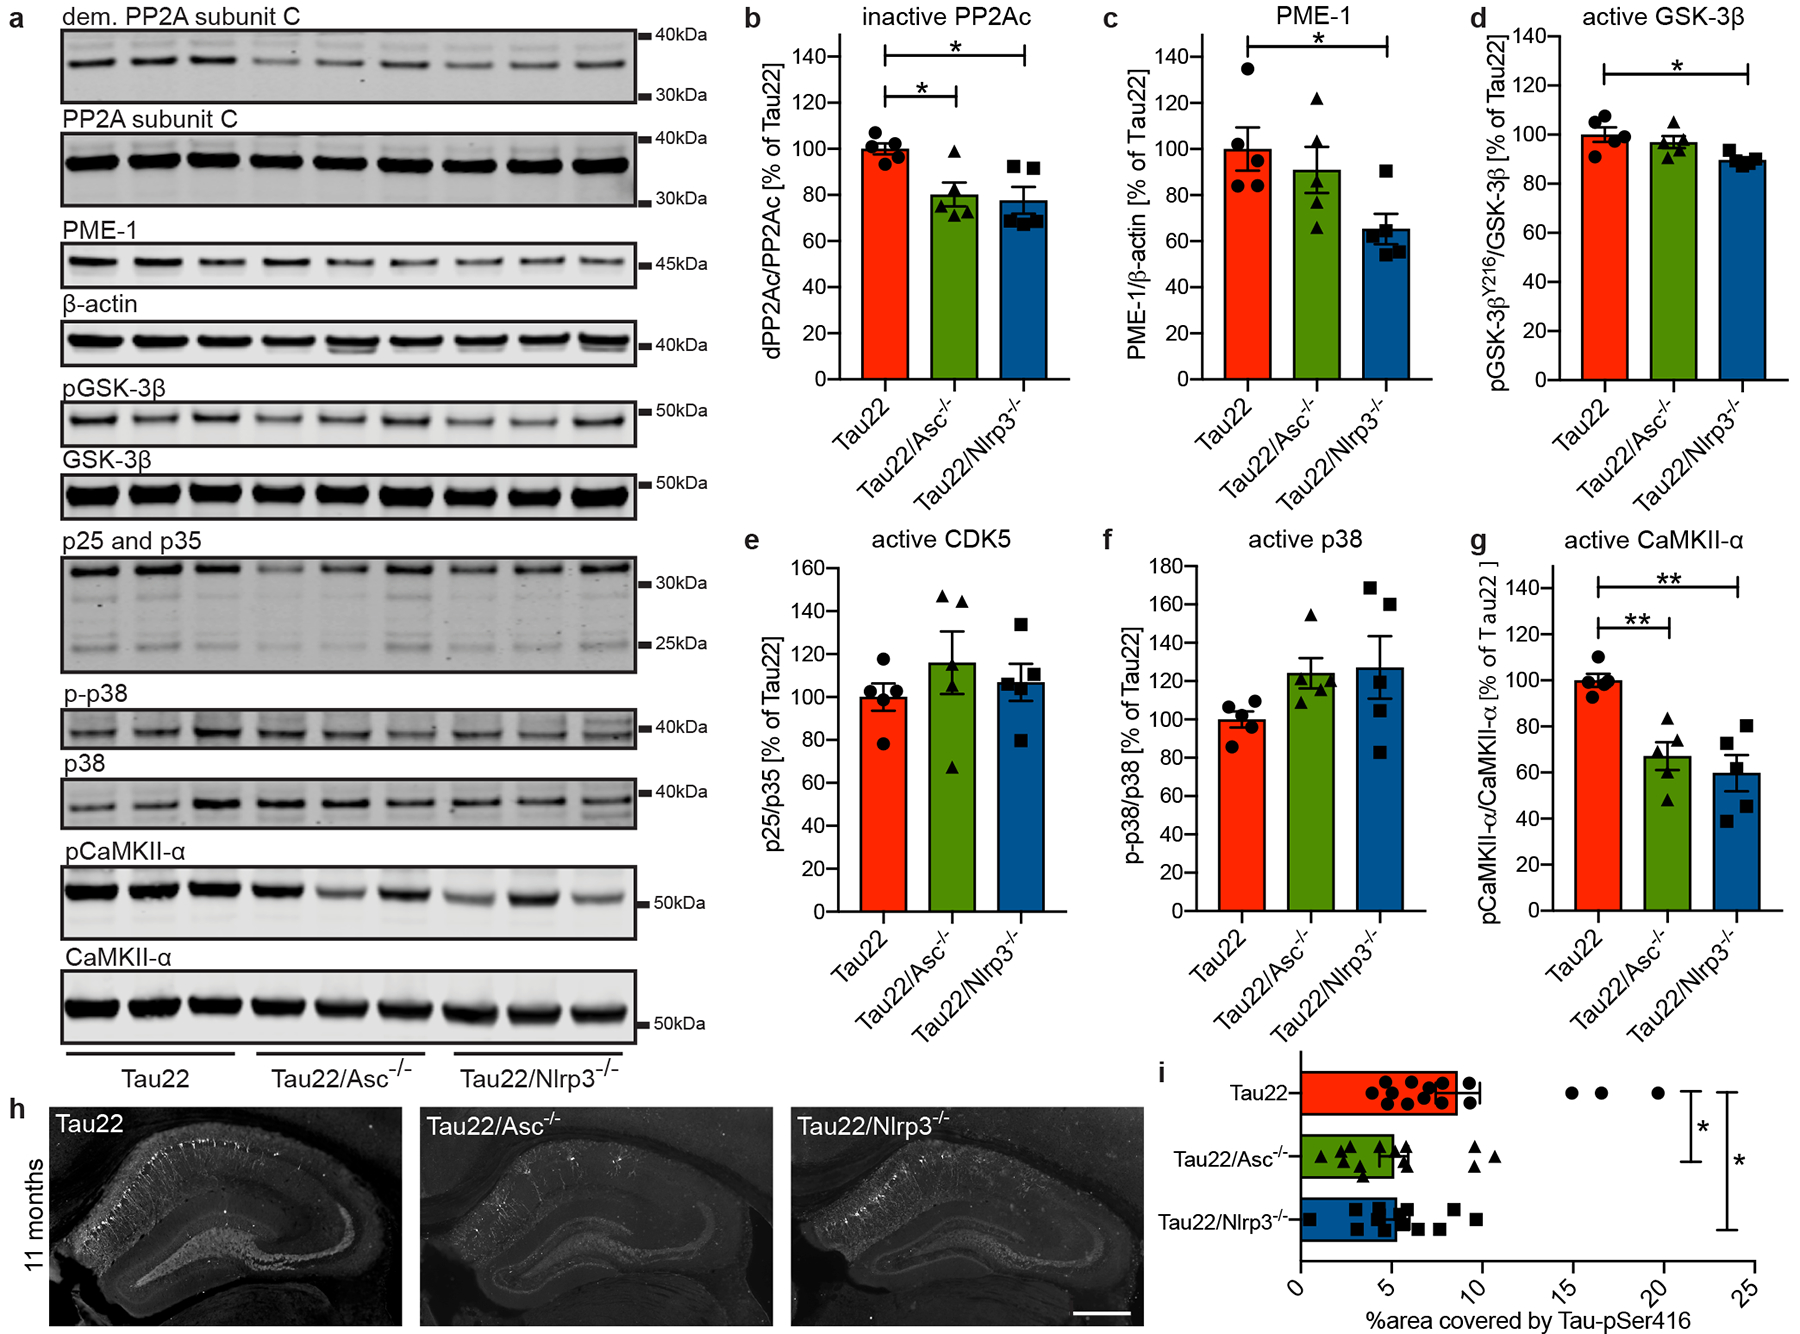
a, Immunoblot analysis of mouse hippocampi (11 months) stained for demethylated PP2A subunit C (dem. PP2A subunit C), total PP2A subunit C, PP2A methylesterase (PME-1), β-actin, GSK-3β phosphorylated at Tyr216 (pGSK-3β), total GSK-3beta, p25/p35, phosphorylated p38 (p-p38), total p38, Calmodulin dependent protein kinase II alpha phosphorylated at Thr286 (pCaMKII-α) and total CaMKII-α.
b - g, Quantification of the enzyme activities/abundance shown in a. n=5. PP2Ac: Tau22 vs. Tau22/Asc−/−: *P= 0.0286, Tau22 vs. Tau22/Nlrp3−/−: *P=0.0144, PME1: *P=0.0398, GSK-3β: *P=0.0205, CaMKII-α: Tau22 vs. Tau22/Asc−/−: **P=0.0055, CaMKII-α Tau22 vs. Tau22/Nlrp3−/−: **P=0.0012.
h, Immunohistochemical staining for Tau phosphorylated at Serin 416 (Tau-pSer416) in mouse hippocampi. Scale bar, 500μm.
i, Quantification of Tau-pSer416 in CA1 region shown in h. n=15 for Tau22, n=14 for Tau22/Asc−/−, n=13 for Tau22/Nlrp3−/−. Tau22 vs. Tau22/Asc−/−: *P=0.0314, Tau22 vs. Tau22/Nlrp3−/−: *P=0.0476.
For gel source data, see Supplementary Figure 1. Data are mean ± SEM and were analyzed by one-way ANOVA with Tukey’s test.
To study the regulation of tau kinases and phosphatases in more detail, we validated key in vivo findings by performing additional in vitro analysis. Conditioned medium was collected from primary microglia generated from WT, Asc−/− and Nlrp3−/− mice after LPS priming and ATP activation to induce the NLRP3 inflammasome and subsequently added to primary mouse hippocampal neuron cultures (Fig. 4a). Treatment with conditioned medium from WT, but not Asc−/− or Nlrp3−/− microglia, resulted in increased levels of mouse tau phosphorylated at Ser396/Ser404 (PHF-1) as well as augmented total mouse tau levels and higher levels of active CaMKII-α (Fig. 4b, c and Extended Data Fig. 10a). Inhibition of the neuronal IL-1 receptor or their downstream effectors IRAK4 and MEK1/2 in the IL-1β signaling pathway antagonized the effects on CaMKII-α (Fig. 4d, e), indicating that microglia-derived IL-1β worsens tau pathology similar to what was observed with other tau kinases16. Other amyloidogenic proteins like Aβ can activate the NLRP3 inflammasome4. Similarly, tau can also activate the NLRP3 inflammasome resulting in IL-1β release from microglia as evidenced by treatments with brain homogenates from Tau22 but not WT mice (Extended Data Fig. 10b). To determine the tau species involved, we used human wildtype tau and P301S-mutant tau in either their monomeric, oligomeric or fibrillar forms. Tau monomers and oligomers significantly increased IL-1β secretion in an ASC- and NLRP3-dependent manner. However, in contrast to a previous report17, tau fibrils showed only small, non-significant effects (Extended Data Fig. 10c, d). The effect mediated by tau monomers could also be blocked by using a pharmacological specific NLRP3 inhibitor, CRID3 (Extended Data Fig. 10e, f). Treatment with tau monomers and oligomers also resulted in the release of cleaved caspase-1 into the cell supernatants (Extended Data Fig. 10g–j).
Figure 4: Inflammasome function is necessary for Aβ-induced tau pathology.
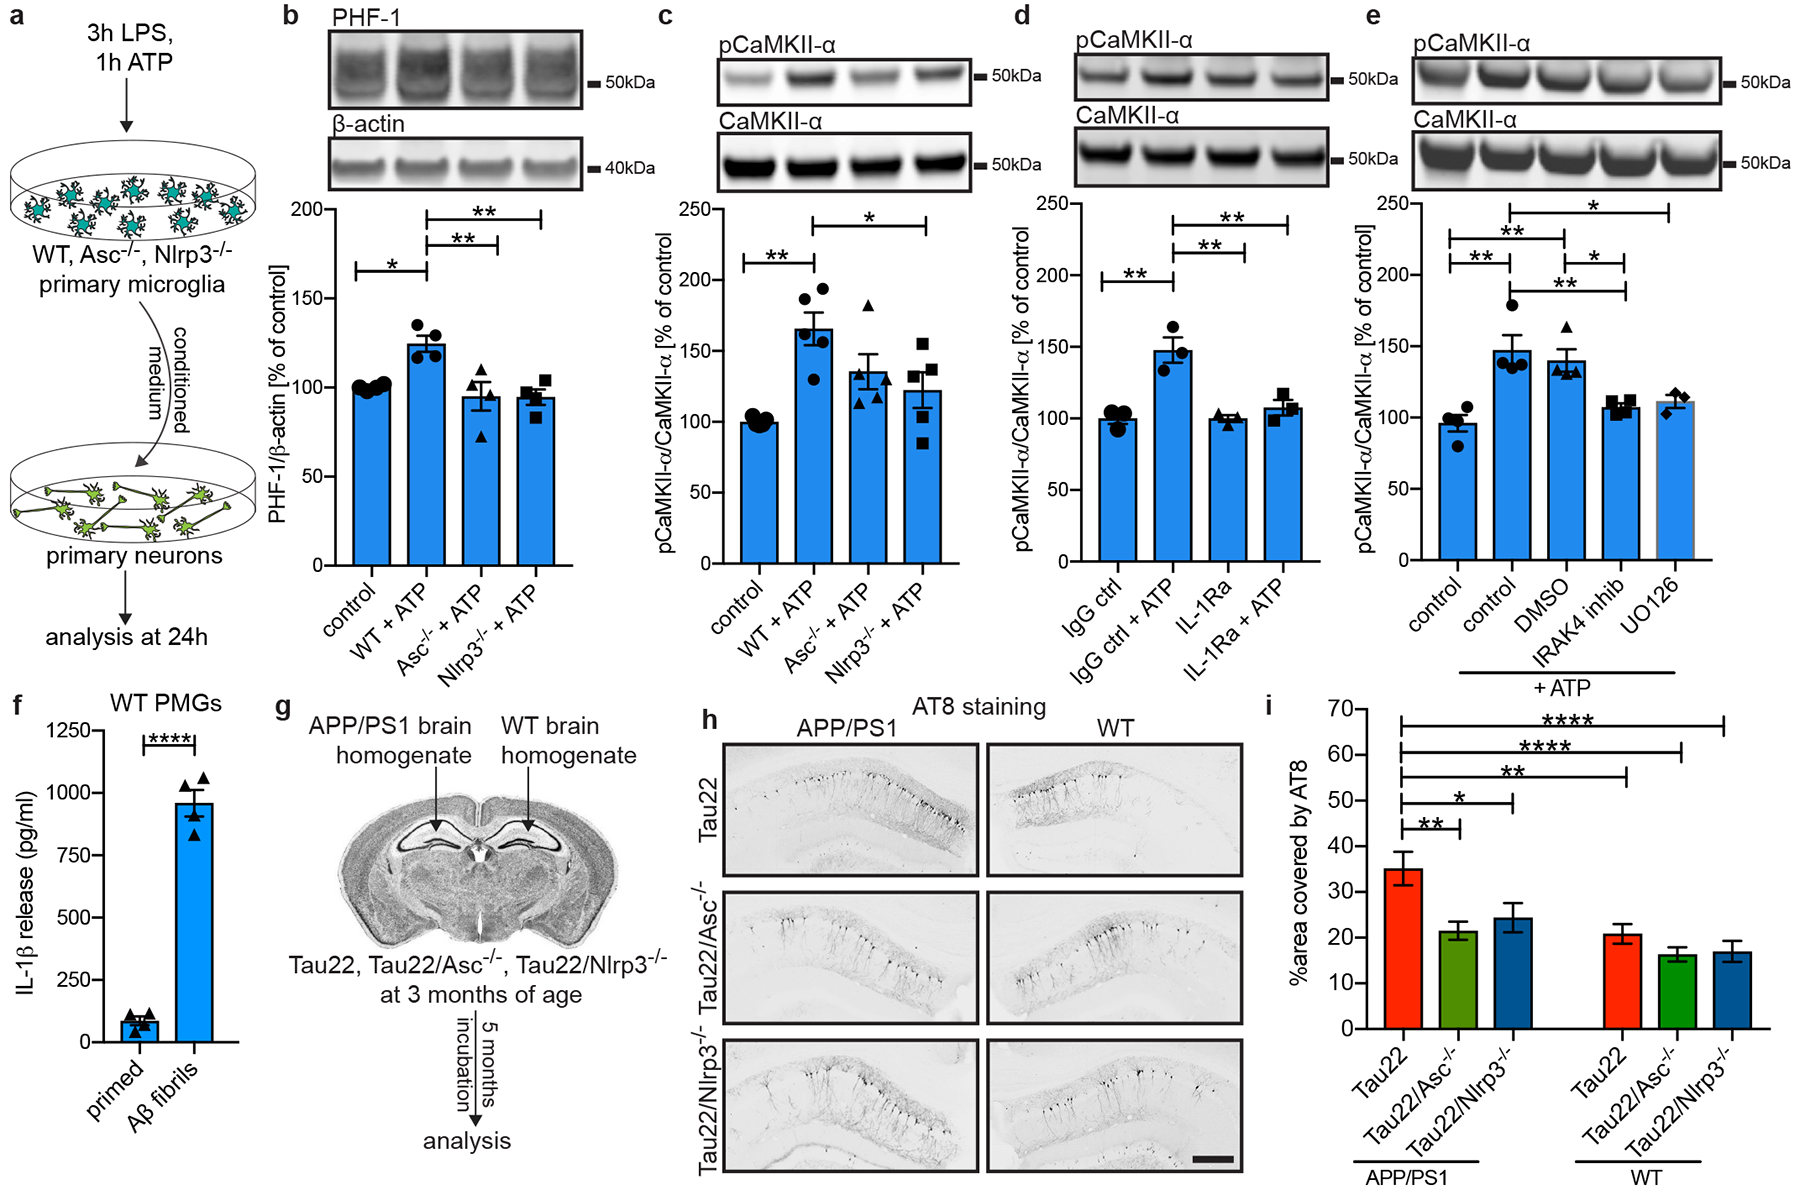
a, Schematic illustrating the experimental set-up used for experiments shown in b - e.
b - c, Immunoblot analysis and quantification of tau phosphorylated at Ser396/Ser404 (PHF-1) and pCaMKII-α in treated neurons (primary WT microglia (control), LPS+ATP-activated WT microglia (WT+ATP), LPS+ATP-activated Asc- or Nlrp3-knockout microglia (Asc−/−+ATP or Nlrp3−/−+ATP)). n=4 in b, with ctrl vs. WT+ATP: *P=0.0235, WT+ATP vs. Asc−/−+ATP: **P=0.0072, WT+ATP vs. Nlrp3−/−+ATP: **P=0.0064. n=5 in c with **P=0.0022, *P=0.0454.
d, Immunoblot analysis and quantification of pCaMKII-α in neurons treated with an IL-1 receptor antagonist (IL-1Ra) or the corresponding isotype control in addition to conditioned medium from WT microglia. n=3, IgG ctrl vs. IgG ctrl+ATP and vs. IL-1ra: **P=0.0015, IgG ctrl+ATP vs. IL-1ra+ATP: **P=0.0044.
e, Immunoblot analysis and quantification of pCaMKII-α in neurons after treatment with DMSO, IRAK4 inhibitor PF06650833 or MEK1/2 inhibitor UO126 in addition to conditioned medium from WT microglia. n=3 for UO126, n=4 for all other groups, ctrl vs. ctrl+ATP: **P=0.0011, ctrl vs. DMSO+ATP: **P=0.0040, ctrl+ATP vs. IRAK4 inhib+ATP: **P=0.0087, ctrl+ATP vs. UO126+ATP: *P=0.0309, DMSO+ATP vs. IRAK4 inhibitor: *P=0.0338.
f, IL-1β levels in conditioned medium of primary WT microglia treated with LPS and 10μM Aβ fibrils. n=4, ****P<0.0001.
g, Schematic for injection model.
h, Immunohistochemical staining for phosphorylated tau (AT8) of CA1 region of mice injected with either APP/PS1 or WT brain homogenates. Scale bar, 250μm.
i, Quantification of AT8 in CA1 region of injected mice shown in h. n=17 sections of n=6 mice for Tau22, n=30 sections of n=6 mice for Tau22/Asc−/−, n=25 sections of n=6 mice for Tau22/Nlrp3−/−. *P=0.0490, ****P<0.0001, Tau22+APP/PS1 vs. Tau22/Asc−/−+APP/PS1: **P=0.0034, Tau22+APP/PS1 vs. Tau22+WT: **P=0.0071. For gel source data, see Supplementary Figure 1. Data are mean ± SEM and were analyzed by one-way ANOVA with Tukey’s test (b-e, i) or two-tailed unpaired t-test (f).
NLRP3 mediates Aβ-induced tau pathology
Previously, a role for microglia in tau seeding and spreading was suggested17,18. In AD pathology, amyloid plaque formation precedes tau pathology. Of note, tau pathology can also be induced by intracerebral injection of Aβ fibrils or Aβ-containing brain homogenates into tau-transgenic mice by yet unknown mechanisms19,20. To investigate the impact of NLRP3 inflammasome activation on Aβ-induced tau seeding, we first demonstrated that Aβ fibrils activate the NLRP3 inflammasome as indicated by IL-1β release in culture (Fig. 4f). Next, we injected brain homogenates from APP/PS1 or WT mice into the hippocampus of inflammasome knockout mice (Fig. 4g). Injection of APP/PS1 brain homogenate efficiently induced tau hyperphosphorylation in the CA1 region in Tau22 but not Tau22/Asc−/− or Tau22/Nlrp3−/− mice (Fig. 4h, i), suggesting that NLRP3 activity represents an essential component in the Aβ-tau cascade.
In summary, this work places NLRP3 activation upstream of tau pathology in Tau22 mice. NLRP3 activation induces tau hyperphosphorylation and aggregation, at least partially via tau kinases in an IL-1β-dependent manner. Previously, tau oligomers and fibrils but not monomers have been described to promote tau pathology and neuronal degeneration in assays with direct application of tau species on neuronal cultures21,22. Here, we provide evidence that tau oligomers and monomers have direct effects on microglia by activating NLRP3. As non-fibrillar tau can actively be released by neurons23,24, it could thereby contribute to chronic microglial activation in tauopathies. This pathway could potentially be blocked by NLRP3 inhibitors or by inhibition of tau binding to microglia. Furthermore, NLRP3 activation mediates Aβ-induced tau pathology in Tau22 mice suggesting that AD patients may potentially benefit from NLRP3-directed treatment strategies.
Methods
Animal procedures and sample collection
All mice were on a C57BL/6 genetic background. THY-Tau22 transgenic mice (named Tau22) express a four-repeat isoform of human tau (1N4R) with a G272V and P301S mutation under control of the Thy1.2 promoter. These mice were generated and characterized previously7 and used in a heterozygous state in this study. Tau22 mice were crossed with either Pycard-knockout mice (named Asc−/−; Millennium Pharmaceuticals) or Cias1-knockout mice (named Nlrp3−/−; Millennium Pharmaceuticals)25. Non-tau-transgenic littermates were used as controls throughout the study. Mice were housed according to the standardized conditions in the University Hospital of Bonn animal facility. All mouse studies complied with relevant ethical regulations and were performed as approved by the local ethical committee (LANUV NRW 84–02.04.2017.A226). As no overt difference in tau pathology between aged male and female Tau22 is reported7, mixed genders were used throughout the study. Power analysis was used to predetermine the sample size. Mice were grouped according to genotype before random assignment to the experimental conduct. Researchers performing animal experiments were blinded to the genotype. At 3, 8 and 11 months of age or 5 months after stereotaxic surgery, mice were anaesthetized, blood was taken for serum analysis and the mice were transcardially perfused with 1x PBS. Brains were taken out and the hemispheres either separated or kept in one piece. Brain samples assigned for immunohistochemical staining were immersion fixed in 4% PFA/1x PBS for 24 hours at 4°C before sectioning on a Leica Vibratome (40μm thickness). Sections were kept in 1x PBS supplemented with sodium azide at 4°C. The other brain samples were dissected into cortex and hippocampus before freezing on dry ice and storage at −80°C. The cecum and the colon were dissected free, the colon length was assessed, and the cecum was weighed. The spleen, part of the medial intestine and the colon were snap frozen in liquid nitrogen for further analysis. Fecal samples were taken from the distal end of the colon and snap frozen in liquid nitrogen.
Antibodies and reagents
For tissue stainings, anti-biotinylated AT8 (Thermo Fisher Scientific, MN1020B, lot SB2334646, 1:500), anti-Iba1 (Wako, 019–19741, lot PTE0555, 1:400 and Abcam, ab5076, lot GR3245261–1, 1:1500), anti-GFAP (Invitrogen, 13–0300, lot SA247423, 1:100) and anti-pTau-S416 (Abcam, ab119391, lot GR93695–21, 1:1000) were used. For immunoblot analysis, the following antibodies were used: anti-Tau5 (Thermo Fisher Scientific, MA5–12808, lot sc2348223, 1:500), anti-MC1 (gift from P. Davies, New York, USA, 1:1000), anti-PHF-1 (gift from P. Davies, New York, USA, 1:1000), anti-Caspase-1 (Genentech, clone 4B4.2.1, gift from Genentech, San Francisco, CA, 1:1000; Adipogen, clone Bally-1, AG-20B-0048, lot 26101409, 1:1000; Adipogen, clone Casper-1, AG-20B-0042, lot A28881708, 1:50), anti-IL-1beta (Gene Tex, GTX74034, lot 42900, 1:1000), anti-ASC (Adipogen, clone Alz177, AG-25B-0006, lot A40221902, 1:1000), anti-β-actin (Cell Signaling, 4967, lot 11, 1:2000), anti-pCaMKIIα (Cell Signaling, clone D21E4, 12716T, 1:1000), anti-CaMKIIα (Cell Signaling, clone 6G9, 50049S, lot 1, 1:1000), anti-pGSK-3β (BD, clone 13A, 612313, lot 3768, 1:1000), anti-GSK-3β (Cell Signaling, clone 27C10, 9315S, lot 14, 1:1000), anti-p25/p35 (Cell Signaling, clone C64B10, 2680S, lot 5, 1:1000), anti-demPP2A (Merck Millipore, clone 4b7, 05–577, lot 3154938, 1:500), anti-PP2A subunit C (Cell Signaling, clone 52F8, 2259T, lot 2 1:1000) and anti-PME-1 (Merck Millipore, 07–095, lot 2805155, 1:1000). For analysis on the Jess system from ProteinSimple, anti-Caspase-1 (Adipogen, clone Casper-1, AG-20B-0042, lot A28881708, 1:50) was used. For treatment of primary neuronal cultures, IL-1β receptor antagonist (R&D Systems), IRAK4 inhibitor PF06650833 (Sigma) and MEK inhibitor UO126 (Cell Signaling) were used.
Behavioural phenotyping
The Morris water maze test was conducted as previously described in detail3. Data are represented as time spent in quadrant Q1, the quadrant the platform had been located. This time was compared wiht the average time spent in all other quadrants.
Biochemical extraction of mouse tissue
For detection of Caspase-1 in cortex sample of mice, RIPA fractions were used. Brain pieces were homogenized in homogenization buffer (1x PBS, 5mM NaF, 20mM pyrophosphate) before addition of equal volumes of 2x RIPA buffer (50mM Tris-HCl, 150mM NaCl, 2% NP40, 1% sodium dodecylsulfate, 0.2% SDS). Samples were incubated on ice and centrifuged for 20 minutes at 21,000 x g before supernatants were transferred to a new tube and stored at −20°C. Protein levels were determined by using a BCA assay (Thermo Fisher Scientific) according to the manufacturer’s instructions. For the analysis of tau and kinases/phosphatase levels in the mouse brain, hippocampi were homogenized in 10 volumes H buffer (10mM Tris-HCl, 1mM EGTA, 800mM NaCl, 10% sucrose, 0.1mM PMSF, 1mM sodium orthovanadate, 1x protease/phosphatase inhibitor (Cell Signaling)) by using a Precellys device (Bertin Instruments). The homogenate was centrifuged for 20 minutes at 21,000 x g and the supernatant collected. The pellet was extracted again in the same volume of H buffer, centrifuged and the supernatant combined with the previous one. The pellet was homogenized in RIPA buffer for the analysis of membrane-bound proteins. The combined supernatant was supplemented with 1% sarkosyl and incubated for 2 hours at 37°C. Samples were centrifuged for 1 hour at 300,000 x g and the supernatant, which contained sarkosyl-soluble tau, collected, aliquoted and stored at −80°C.
ELISA quantification of pro-inflammatory cytokines
The protein from the snap-frozen tissue was extracted in RIPA buffer as described above. A BCA (Thermo Fisher Scientific) was performed on the supernatants containing the extracted proteins from the peripheral organs and these were equalized to the lowest sample within each organ group, namely spleen (1.3 mg/ml), medial intestine (1.2 mg/ml) and colon (1mg/ml). The levels of IL-1β, TNFα and IL-6 were determined on these and the serum using an electrochemoluminescence ELISA (Meso Scale Discovery). As per the manufacturer’s instructions, samples were diluted 1:1 onto the plate using reagent diluent 41 supplied with the kit.
Human tissue samples
Post-mortem brain samples from patients with confirmed FTD as well as age-matched controls provided by the Biobank of Hospital Clínic, Barcelona - IDIBAPS were used according to their guidelines. All experiments with human samples complied with relevant ethical regulations. An informed consent was signed by all patients and they had agreed to the use of their brain material for medical research. Frozen brain pieces were either sectioned for staining or homogenized and lysed in RIPA buffer as described for the mouse tissue.
Immunoblot analysis
For standard immunoblot analysis, samples were supplemented with 1x NuPAGE sample buffer (Thermo Fisher Scientific), heated for 5 min at 95° and loaded on 4–12% NuPAGE Novex gels (Thermo Fisher Scientific). After transfer of proteins to nitrocellulose membranes, membranes were blocked with 3% BSA in TBS followed by incubation with primary antibodies in 3% BSA in TBS-Tween. Visualization of proteins was achieved by using fluorescently tagged secondary antibodies (LI-COR). Imaging was performed by using a LI-COR ODYSSEY CLx. Data were analyzed with ImageStudio software version 5.2.5 (LI-COR). All controls were run as loading controls on the same gel.
Immunohistochemical staining
40μm thick mouse brain sections were stained in a free-floating format. For each experiment, at least three serial sections per mouse were used. For DAB staining, sections were washed, incubated with 0.3% H2O2 before blocking in 3% milk in 1x TBS with 0.25% Triton-X100 (TBS-X). Sections were incubated with a biotinylated primary antibody in blocking buffer overnight at 4°C. After washing, the ABC kit (VectorLabs) was applied according to the manufacturer’s instructions. Three more wash steps followed before the sections were developed in DAB solution (VectorLabs) and then washed three more times. Sections were mounted on glass slides, dried overnight and dehydrated in an Ethanol series followed by Xylol. Cytoseal 60 (Thermo Fisher Scientific) was used to apply cover glasses. Imaging was done with a 10x objective on an AxioScan.Z1 slide scanner from Zeiss. Threshold-analysis was performed with ImageJ/FiJi software version 2.0.0.-rc-67/1.52c. For fluorescent stainings of mouse sections, sections were stained either free floating or after mounting on slides. Sections were washed and pre-treated with 1mg/ml pepsin in 0.2M HCl for 10 min at 37°C whenever AT8 staining was applied. Blocking was performed with 3% BSA in 1x PBS and 0.1% Triton-X100 (PBS-T). Sections were incubated with primary antibodies in blocking buffer overnight at 4°C. After washing, AlexaFluor-labeled secondary antibodies (Invitrogen) in blocking solution were applied, followed by additional washing steps. To quench autofluorescence, the sections were incubated for 20 min in 0.1% Sudan Black B (Sigma) in 70% Ethanol and washed extensively in 1x PBS. For Thioflavin S staining, the quenching was followed by a 5 min incubation in 0.025% Thioflavin S (Sigma) in 50% Ethanol, quick washes in 50% Ethanol and a longer wash step in water. Prolong Gold + DAPI (Invitrogen) was used as a mounting medium. For human frozen sections epitope-retrieval was achieved by heating the sections in 10mM citrate buffer, pH 6. Sections were blocked with 10% donkey serum in PBS-T, followed by incubation with primary antibodies in 1% donkey serum in PBS-T overnight at 4°C. After washing, AlexaFluor-labeled secondary antibodies (Invitrogen) in 1% donkey serum in PBS-T were added, followed by incubation with Hoechst and TrueBlack Lipofuscin Autofluorescence Quencher (Biotium). After extensive washing, sections were coverslipped with Immu-Mount (Thermo Fisher Scientific).
When full hippocampus pictures were necessary, images were taken with a Zeiss Axio Scan.Z1 with a 20x objective or with a Nikon eclipse Ti with a 20x objective. For high magnification images, a Zeiss LSM700 with a 40x or 60x oil objective was used. Image processing was achieved by using ImageJ Version 2.0.0.-rc-67/1.52c, Adobe Photoshop CS5 Version 12.0.1 and Imaris Version 9.
PCR on fecal samples
The DNA was extracted from the fecal samples obtained from the colon using the QIAamp PowerFecal DNA Kit (Qiagen) following the manufacturer’s instructions. The DNA was quantified spectrophotometrically and equalized to 10ng/μl. The PCR was performed with 4μl of DNA, 2.5μl of forward and reverse primers, 12.5μl of Kappa Sybr Fast mix (Thermo Fisher Scientific), 0.5μl Rox High and 4.5μl ultrapure water per sample. A standard curve was also prepared using known concentrations of E. coli. The PCR was carried out on a StepOne Plus real-time PCR system (Applied Biosystems) under the following conditions: 95°C for 3 min, and 60 cycles of 95°C for 3 sec, 64°C for 30 sec. The following probes were used to determine the V6 region of Bacterial 16S, forward primers: CNACGCGAAGAACCTTANC, ATACGCGARGAACCTTACC, CTAACCGANGAACCTYACC, CAACGCGMARAACCTTACC, and reverse primer: CGACRRCCATGCANCACCT (Metabion International AG). The analysis was performed using StepOne software version 2.1 (Applied Biosystems).
Primary neuronal cultures
Primary murine neuronal cultures were prepared from newborn pups (P0) from C57BL/6N mice. Brains were taken out, meninges removed and hippocampi dissected out. Hippocampi were washed in 1x HBSS (Thermo Fisher Scientific) and single cell suspensions generated by incubation with trypsin and DNase before careful trituration. 70,000 cells/well were plated on poly-D-lysine-coated 24-well plates in Neurobasal medium (Thermo Fisher Scientific) supplemented with B-27 (Thermo Fisher Scientific) and used for experiments at DIV12–14.
Primary microglia cultures
Primary murine microglia cell cultures were prepared as described previously3 from wildtype, Asc−/− and Nlrp3−/− pups. Briefly, mixed glia cultures were prepared from newborn mice (P0–P4). Cells were plated in DMEM (Thermo Fisher Scientific) with 10% FCS, 10% L929 conditioned medium and 100 U/ml penicillin/streptomycin (Thermo Fisher Scientific). 7–10 days after cultivation, microglia were harvested by shake off, counted and plated in DMEM supplemented with 1% N2. If conditioned medium was used to treat neurons, microglia medium was replaced with Neurobasal+B27 at least 12 hours before applying treatments. Microglia were shaken off up to 3 times.
Recombinant tau preparation
Human WT (2N4R) or P301S (1N4R) tau-expressing, inducible plasmids were transformed into BL21(DE3) E. coli (Agilent). Single colonies were grown to a suitable density and tau expression induced by addition of IPTG (Merck). Three hours later, bacteria were pelleted and resuspended in BRB-80 (80mM PIPES, 1mM magnesium sulphate, 1mM EGTA, pH 6.8) supplemented with 0.1% 2-Mercapthoethanol and 1mM PMSF. The resuspension was sonicated, followed by a centrifugation to remove the bacterial debris. The tau-containing supernatant was boiled for 10 minutes and centrifuged again. Supernatants were applied to a cation exchange chromatography column, which was washed afterwards with BRB-80 supplemented with 0.1% 2-Mercaptoethanol. Tau was eluted with increasing concentrations of sodium chloride dissolved in BRB-80 with 0.1% 2-Mercaptoethanol and each fraction of the elution tested for the presence of tau by a Coomassie gel stain. Tau-containing fractions were combined and the buffer replaced with 10mM ammonium bicarbonate by using Amicon® ultra centrifugal units (10,000 MWCO). Buffer replacement was performed several times to efficiently remove all remaining endotoxins. The last concentrated solution was collected from the columns, protein concentration assessed by a BCA assay (Thermo Fisher Scientific), aliquoted and dried in a speed vac before storage at −80°C. Tau proteins were resuspended in DPBS right before use and each preparation was tested for endotoxin levels with an endotoxin quantification kit (Pierce) following the manufacturer’s instructions.
Tau oligomers were prepared as described previously26.
Tau and Aβ fibril formation
Recombinant human tau was fibrillized as described previously27. Briefly, 8μM human tau was incubated with 10mM DTT, 10mM HEPES, 100mM NaCl and 8μM heparin (1:1 ratio to tau) for 72 hours at 37°C. The solution was centrifuged at 100,000 x g for 1 hour and the pellet resuspended in DPBS. To generate Aβ fibrils, HFIP-treated Aβ1–42 (Bachem) was dissolved in sterile PBS to a final concentration of 250μM and incubated on a shaker for 84 hours at 37°C.
All fibril preparations were aliquoted and frozen at −80°C for single use.
Treatment of microglia
For IL-1β analysis, 75,000 microglia/well in 96-well plate were used. For Caspase-1 detection or collection of conditioned medium for neuronal experiments, 2 million microglia/well were plated in a 6-well plate. Microglia were activated with 100ng/ml ultrapure LPS (Escherichia coli 0111:B4, Invivogen) for 3 hours. After washing with warm DPBS, recombinant tau monomers, oligomers or fibrils at a concentration of 2μM or 10μM Aβ fibrils were added for 6 hours to the cultures before collection of conditioned media. For CRID3 (SigmaAldrich) treatments, the inhibitor was mixed in with the tau treatments at a concentration of 100nM. Conditioned media were analyzed for IL-1β secretion by ELISA (R&D Systems) according to the manufacturer’s instructions or for Caspase-1 secretion by using a Jess system (ProteinSimple). Here, samples were run undiluted on a 12–230 kDa separation module according to the manufacturer’s instructions and detection was achieved by using a Caspase-1 antibody (Adipogen) at 1:50. Data were analyzed with Compass software version 4.0.0 (ProteinSimple).
Stereotaxic surgery
Intracerebral stereotaxic injections of brain material were performed as described previously3. Briefly, 3 month old mice were anesthetized with ketamine and xylazine before two small holes were drilled into the skull using a Dremel device attached to a stereotactic frame. Mice received a bilateral injection of 2μl brain homogenate from APP/PS1 or wildtype mice (AP −2.5 mm, L ±2 mm, DV −1.8 mm; injected with 0.5μl/min). After suturing, mice were monitored until full recovery from the anesthesia and housed under standardized conditions for 5 months before euthanization.
RNA expression analysis via NanoString analysis
To isolate RNA, QIAzol Lysis Reagent (Qiagen) was added to brain homogenates of mice at different ages. After the addition of chloroform, samples were shaken vigorously and centrifuged for 15 minutes at 12,000 x g. The aqueous phase was collected and the RNA isolated with an RNeasy Mini kit (Qiagen) according to the manufacturer’s instructions. 100 ng of total RNA was hybridized using the NanoString Mouse Neuroinflammation V1.0 panel for 24 hours following the manufacturer’s instructions. The hybridized RNA was then bound to a cartridge, analyzed on an nCounter® and the FOV count was set to 555.
Bioinformatic analysis of NanoString data
RCC files were imported into nSolver™ Analysis software 4.0 and processed by the Advanced Analysis 2.0.115 software package. geNORM identified the ideal housekeepers Mto1, Cnot10, Lars, Ccdc127, Fam104a, Tada2b and Tbp. Other housekeeping genes were discarded because of high variances in gene expression throughout all samples. The geometric mean of negative controls was subtracted from all counts. The geometric mean of positive controls and housekeepers were used to normalize the data. Transcripts with an expression value ≤ 20 were excluded from the analysis. Expression profiles of 671 transcripts in WT and Tau22 samples were used to generate a network based on co-expression consisting of 578 genes in Biolayout express 3D v3.3. Fold-changes in gene expression patterns were visualized in form of color-coded nodes in Cytoscape v3.6.1. SOM clustering and ANOVA analysis of expression profiles of 671 genes into a matrix consisting of 10×10 clusters was performed with the Partek Genomics Suite v6.6 and 7.18. Genes of clusters with elevated expression levels were grouped and defined as gene signatures for Tau22 mice at 3 and 11 months of age. Brain related interferon regulated genes in gene signatures were identified via the interferome data base v2.01. Gene ontology (GO) analysis for gene signatures were performed in STRING v11.0. Boxplots and gene rank plots were generated in Excel.
Statistics and Reproducibility
Each n represents an independent biological sample. All graphs show means ± SEM. Statistical analysis was performed with GraphPad Prism software version 7.0c applying either a two-tailed unpaired t-test or one-way or two-way ANOVA with Tukey’s post hoc test comparing all groups to each other. The GO enrichment analysis was performed according to Fisher’s exact test followed by a correction for multiple testing28.
Data availability
All data generated and/or analyzed during this study are either included in this article (and its supplementary information files) or are available from the corresponding author on reasonable request.
Extended Data
Extended Data Figure 1. The NLRP3 inflammasome is activated in Tau22 mice.
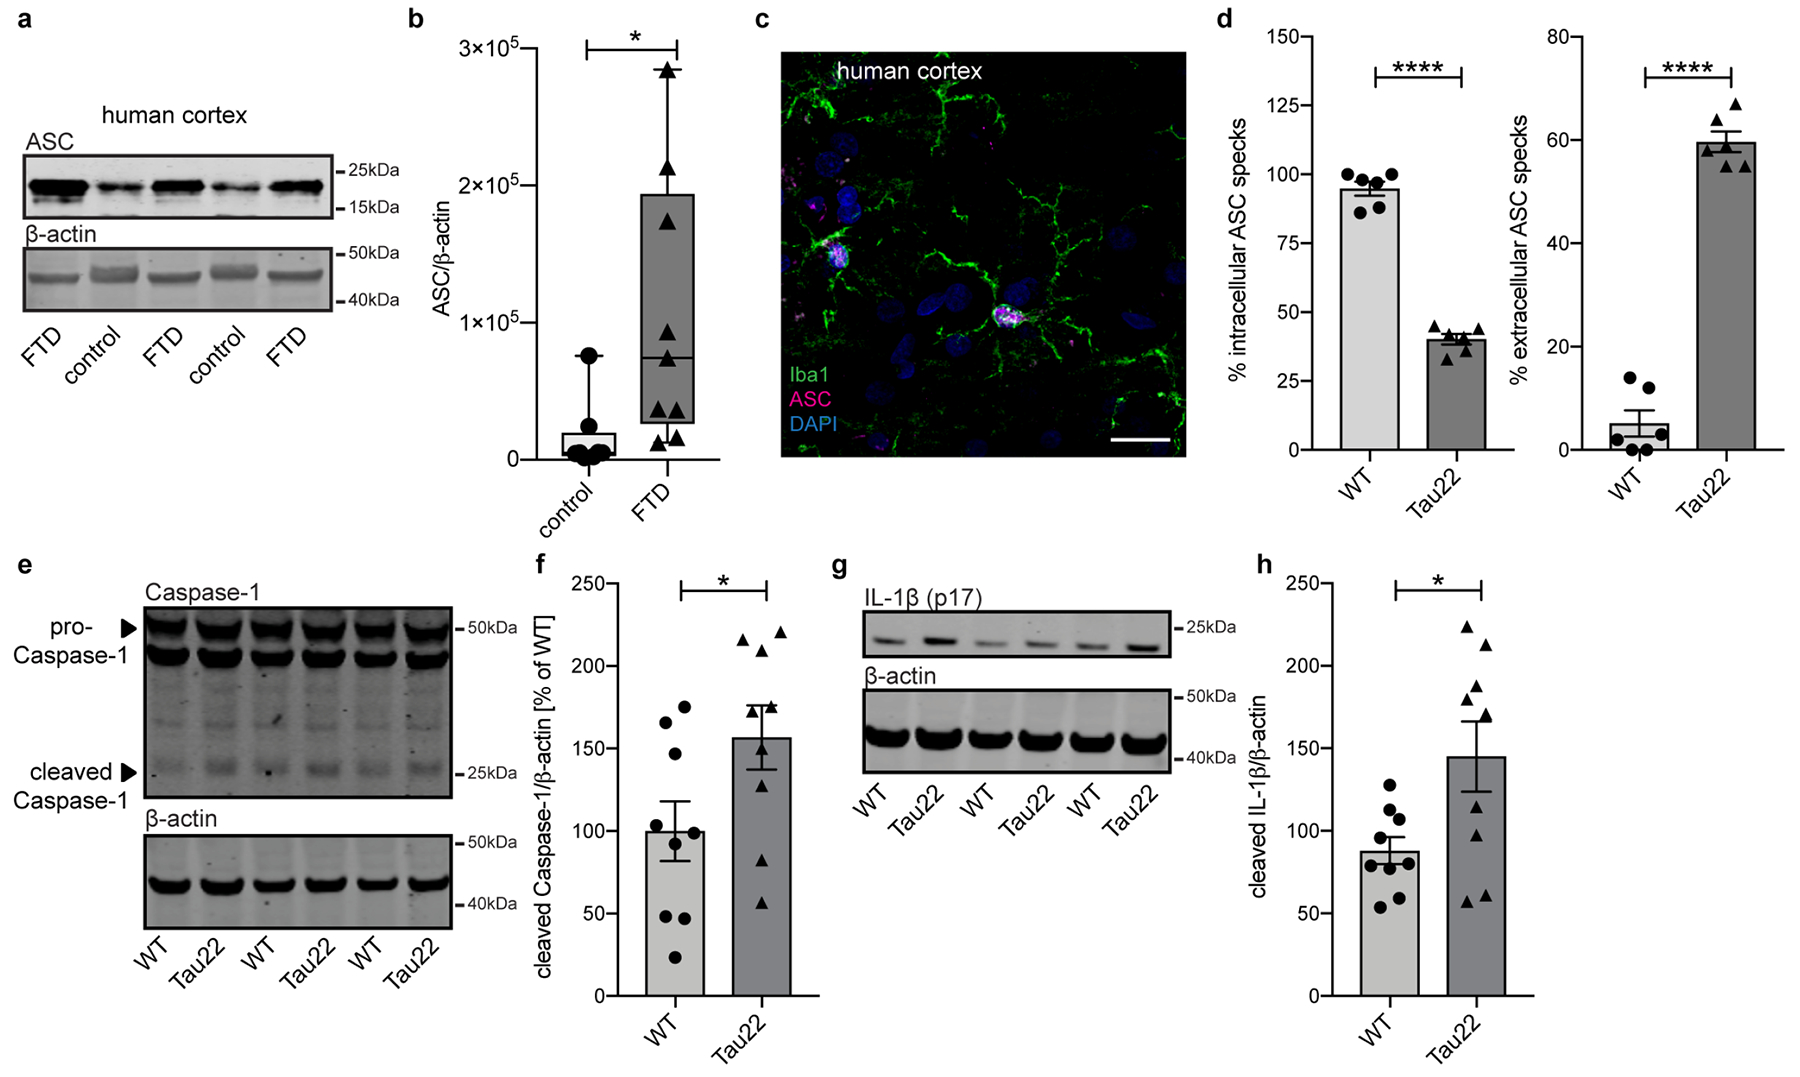
a, Immunoblot analysis of ASC and β-actin in human cortex of FTD and control patients.
b, Quantification of data from a. Box plots show 25/75 percentile. n=8 for controls, n=9 for FTD, *P=0.0239.
c, Immunohistochemical staining of human cortex of a FTD patient for microglia and ASC. n=3. Scale bar, 20μm.
d, Quantification of % of intracellular ASC and % of extracellular ASC specks from staining shown in Fig 1g. n=6 mice per group, ****P<0.0001.
e, Immunoblot analysis of hippocampus samples of 8 month old wildtype (WT) and Tau22 mice stained for Caspase-1 and β-actin.
f, Quantification of data from e. n=9 per group, *P=0.0489.
g, Immunoblot analysis of hippocampus samples of 8 month old WT and Tau22 mice stained for IL-1β (p17) and β-actin.
h, Quantification of data from g. n=9 per group, *P=0.0236.
For gel source data, see Supplementary Figure 1. All graphs are presented as mean ± SEM and were analyzed by two-tailed unpaired t-test.
Extended Data Figure 2: Gene signatures in WT and Tau22 mice identified by NanoString analysis.
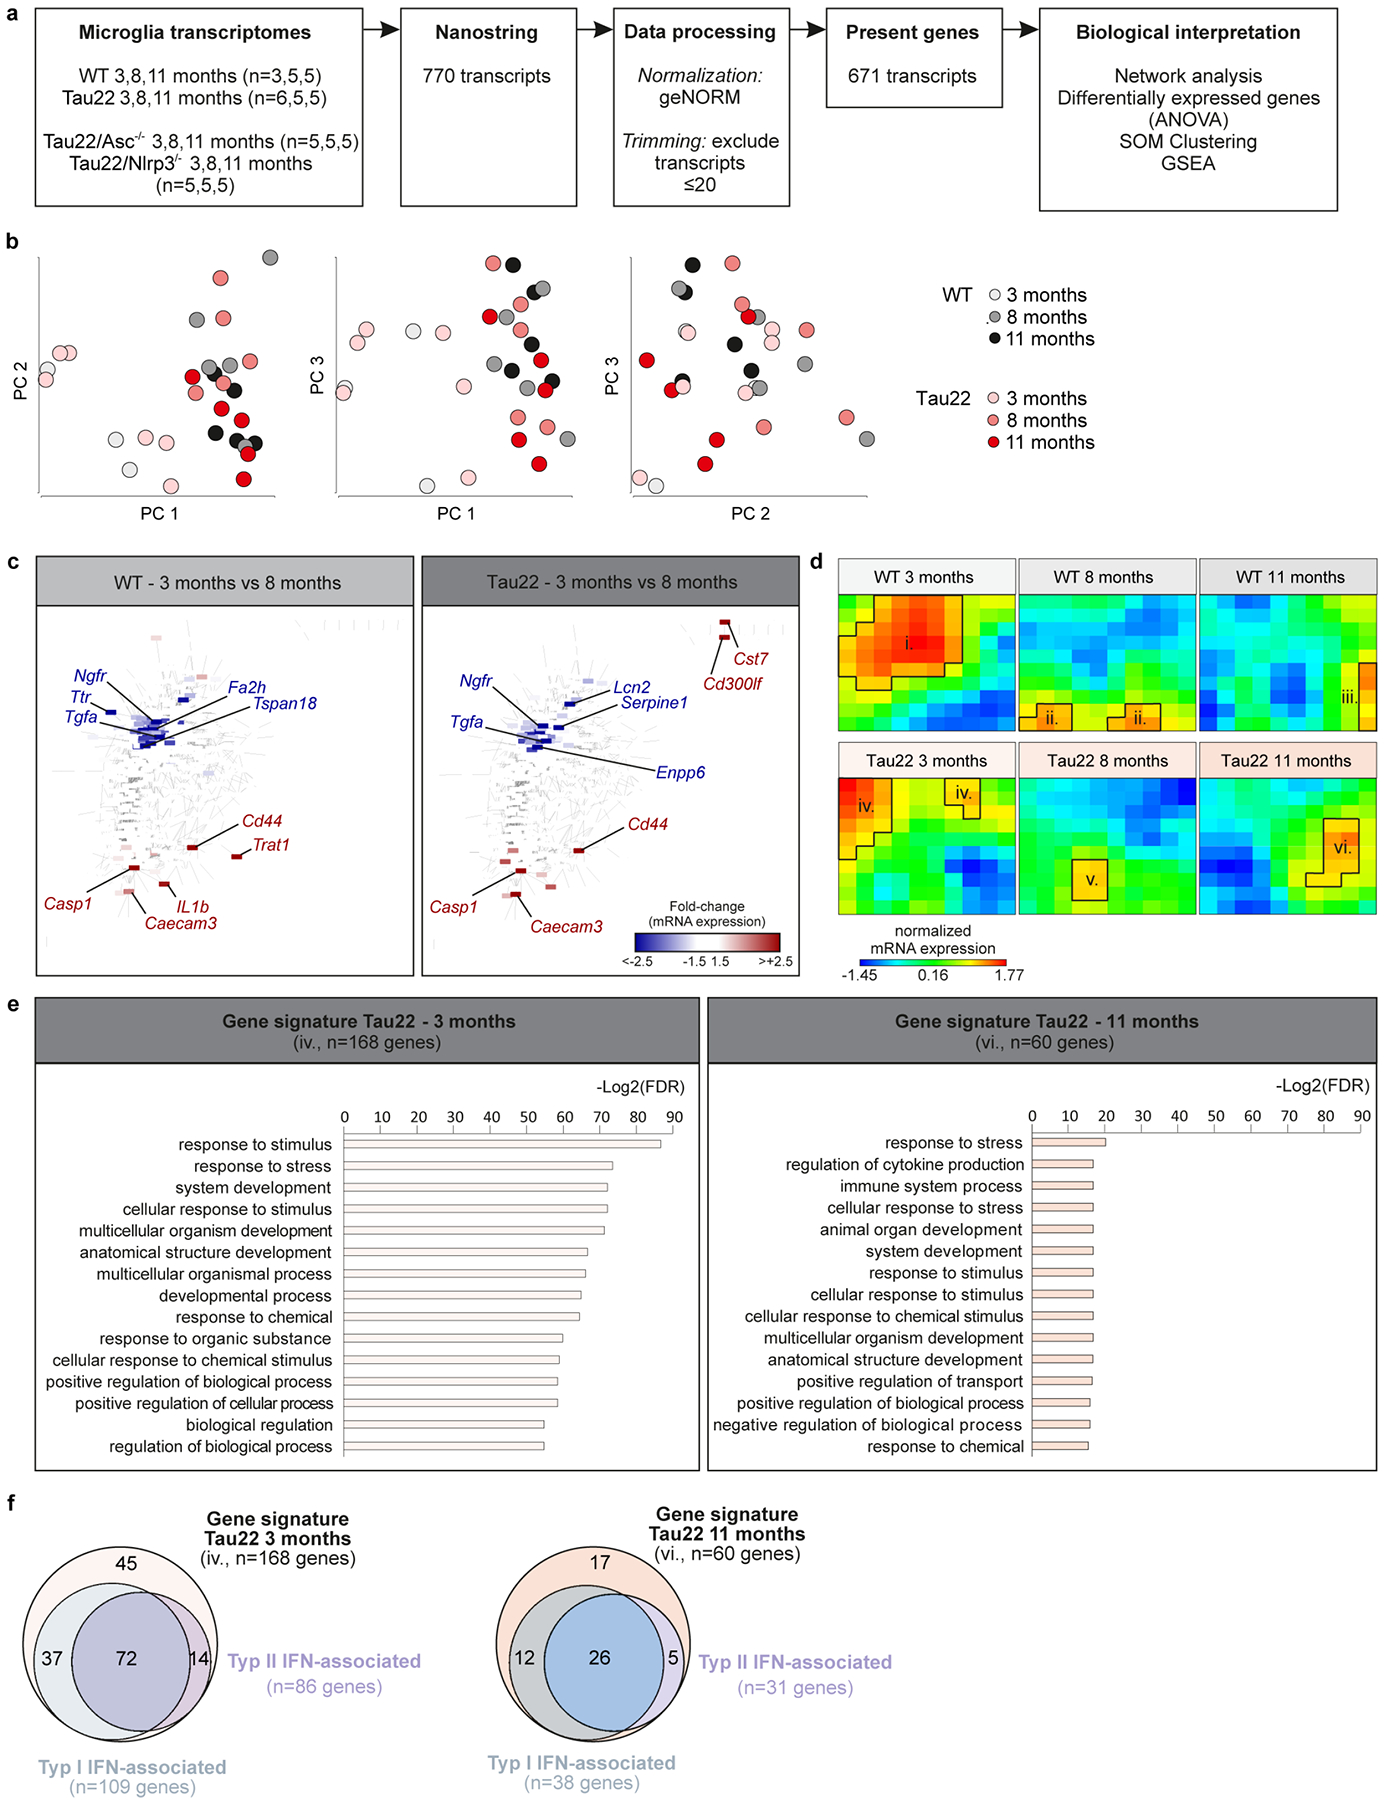
a, Workflow for NanoString analysis.
b, 2D PC analysis of WT and Tau22 mice at 3, 8 and 11 months of age.
c, Gene network analysis of regulated genes at 3 vs. 8 months in WT and Tau22 mice identified by NanoString analysis.
d, SOM clustering of WT and Tau22 mice at 3, 8 and 11 months of age with definition of cluster i. - vi.
e, Gene signatures in 3 month old Tau22 mice defined by cluster iv. and in 11 month old Tau22 mice defined by cluster vi. Fisher’s exact test followed by a correction for multiple testing.
f, Interferome Venn diagrams based on cluster iv. and vi. in Tau22 mice.
Extended Data Figure 3: STRING network analysis of Tau22 mice.
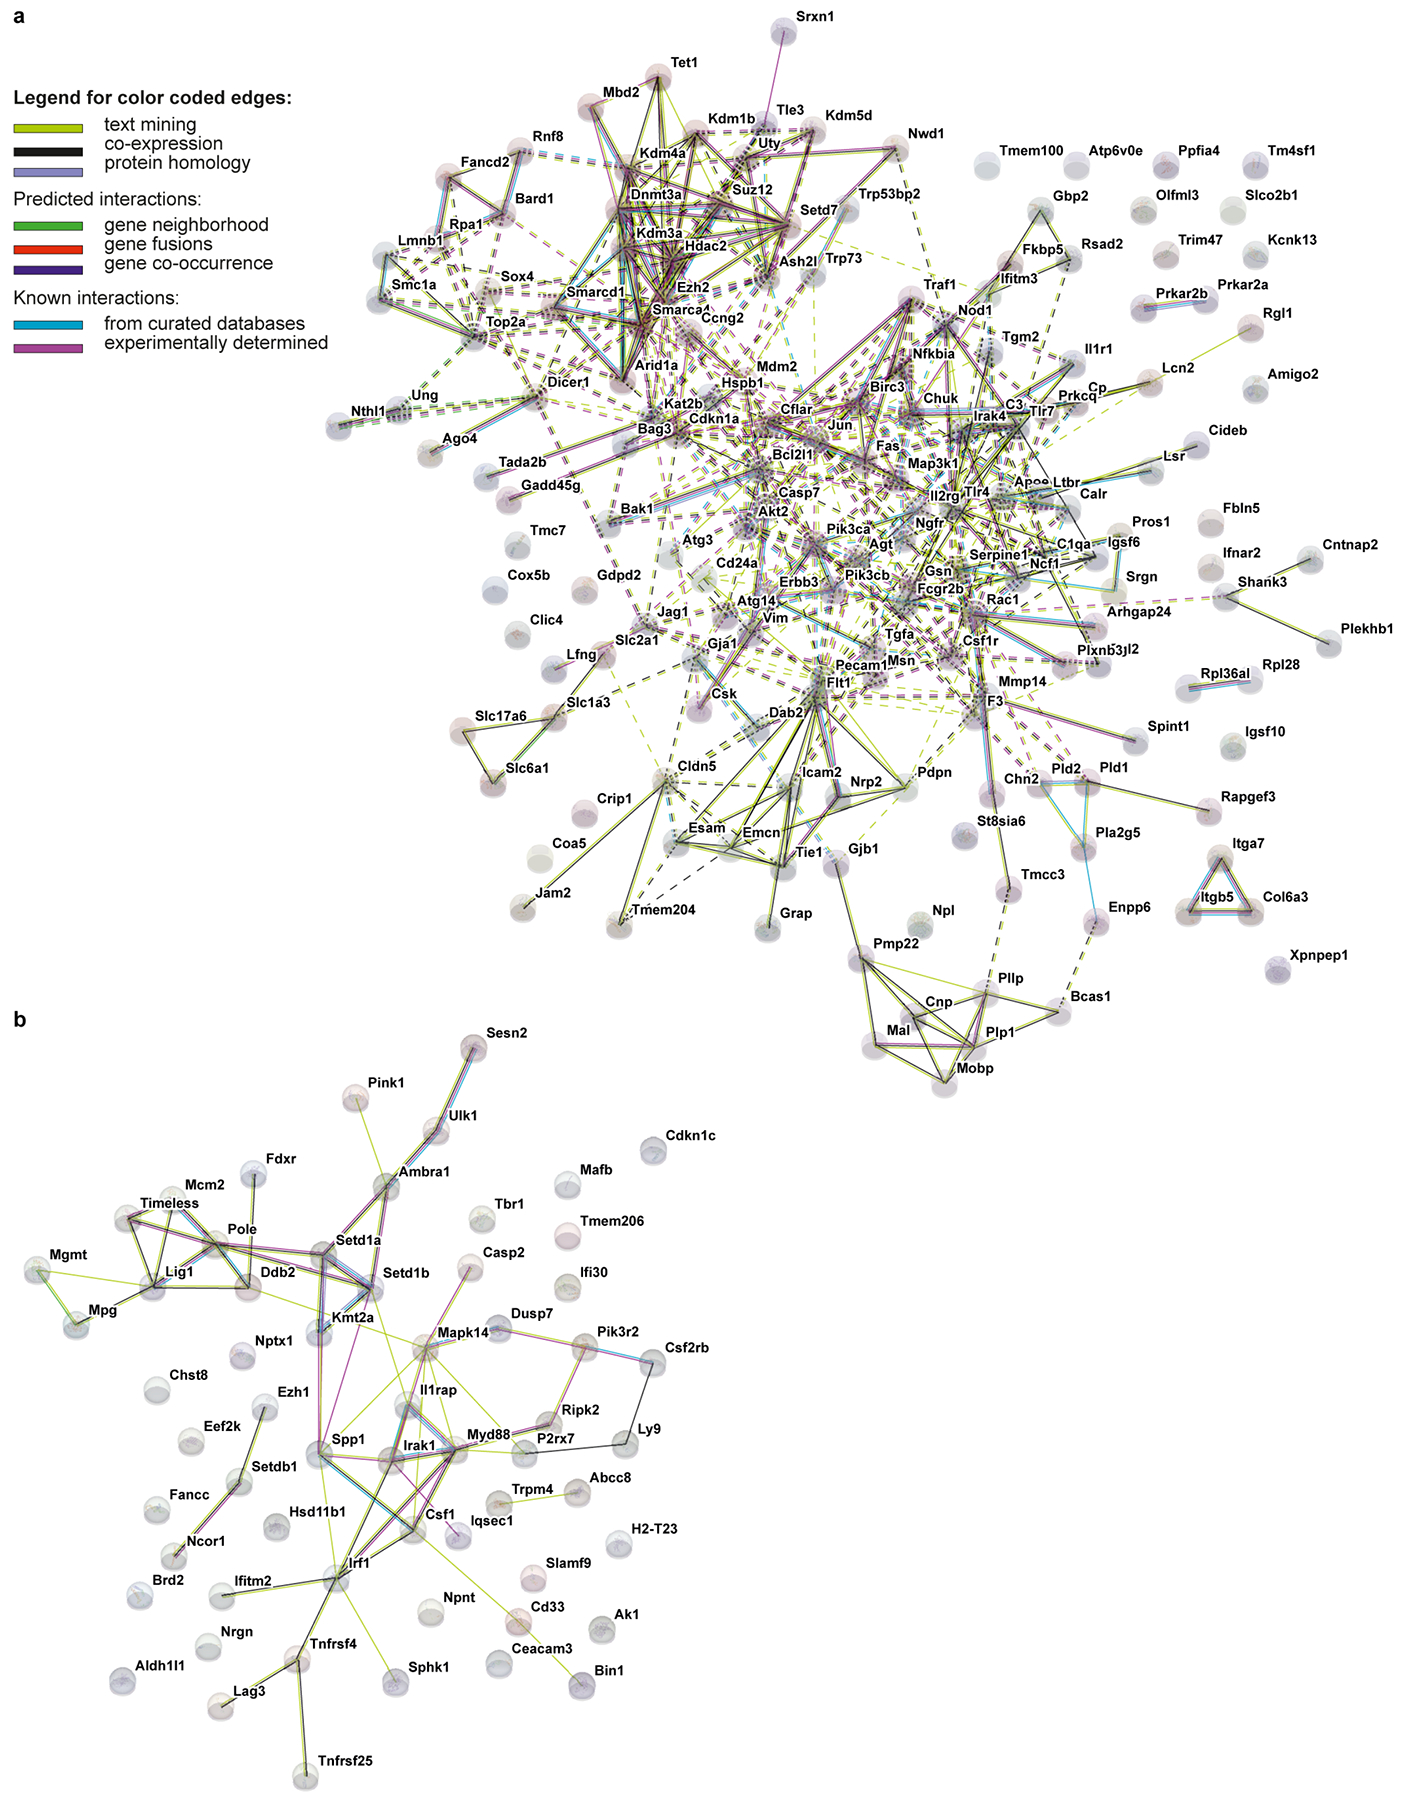
a-b, Networks visualizing the functional protein association for gene signatures in Tau22 mice at 3 (a) and 11 (b) months of age. Nodes in the network represent proteins. Edges represent protein-protein interactions, which depending on the color indicate known or predicted interactions.
Extended Data Figure 4: Astrocyte morphology does not change in Tau22 mice.
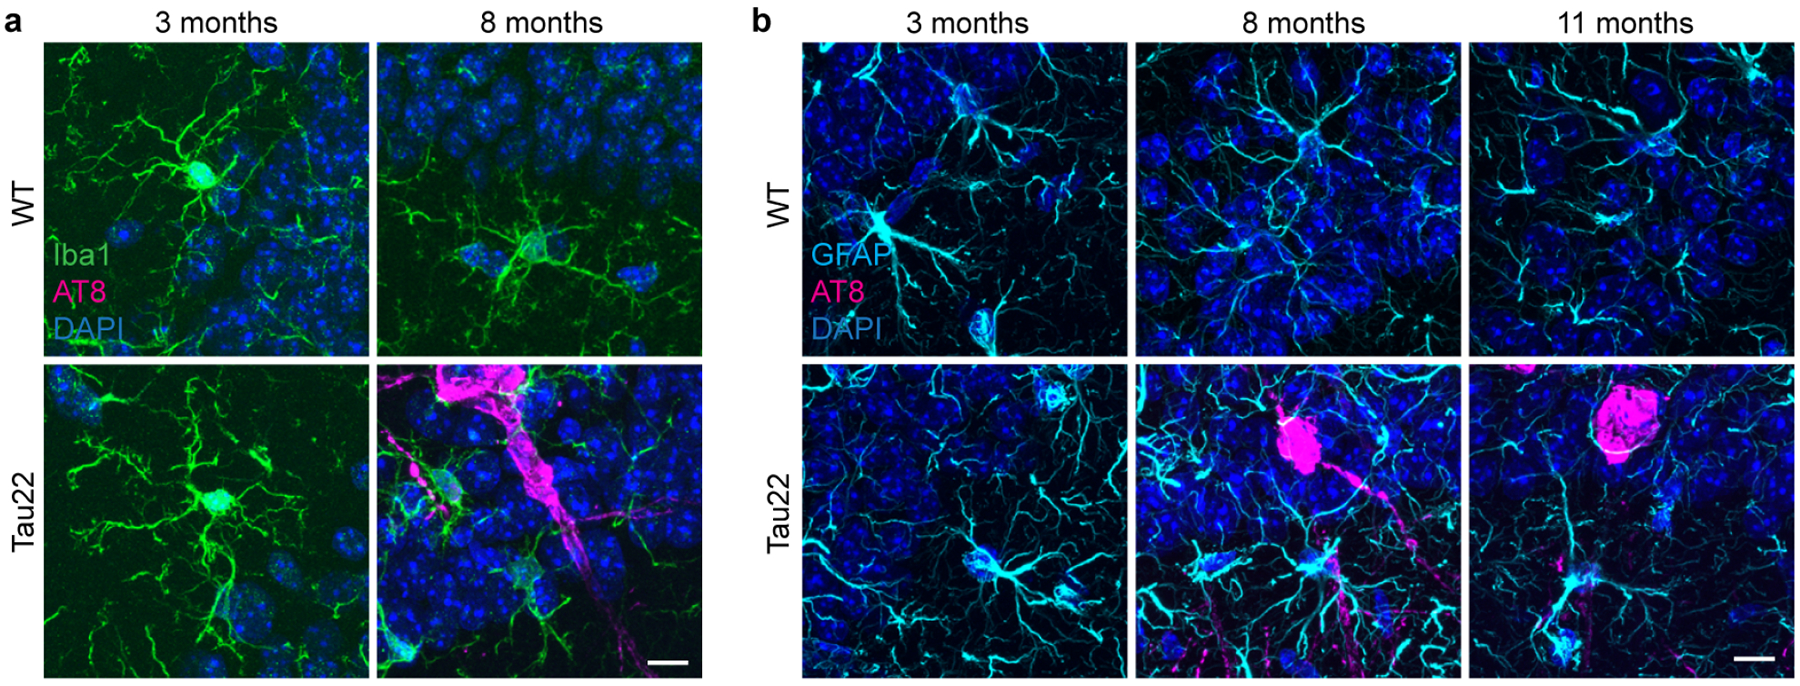
a, Immunohistochemical staining for microglia (Iba1) and phosphorylated Tau (AT8) in WT and Tau22 mice at 3 and 8 months of age. n=8. Scale bar, 10μm.
b, Immunohistochemical staining for astrocytes (GFAP) and phosphorylated Tau (AT8) in WT and Tau22 mice at 3, 8 and 11 months of age. n=8. Scale bar, 10μm.
Extended Data Figure 5: Knockout of Asc or Nlrp3 efficiently inhibits NLRP3 inflammasome function.
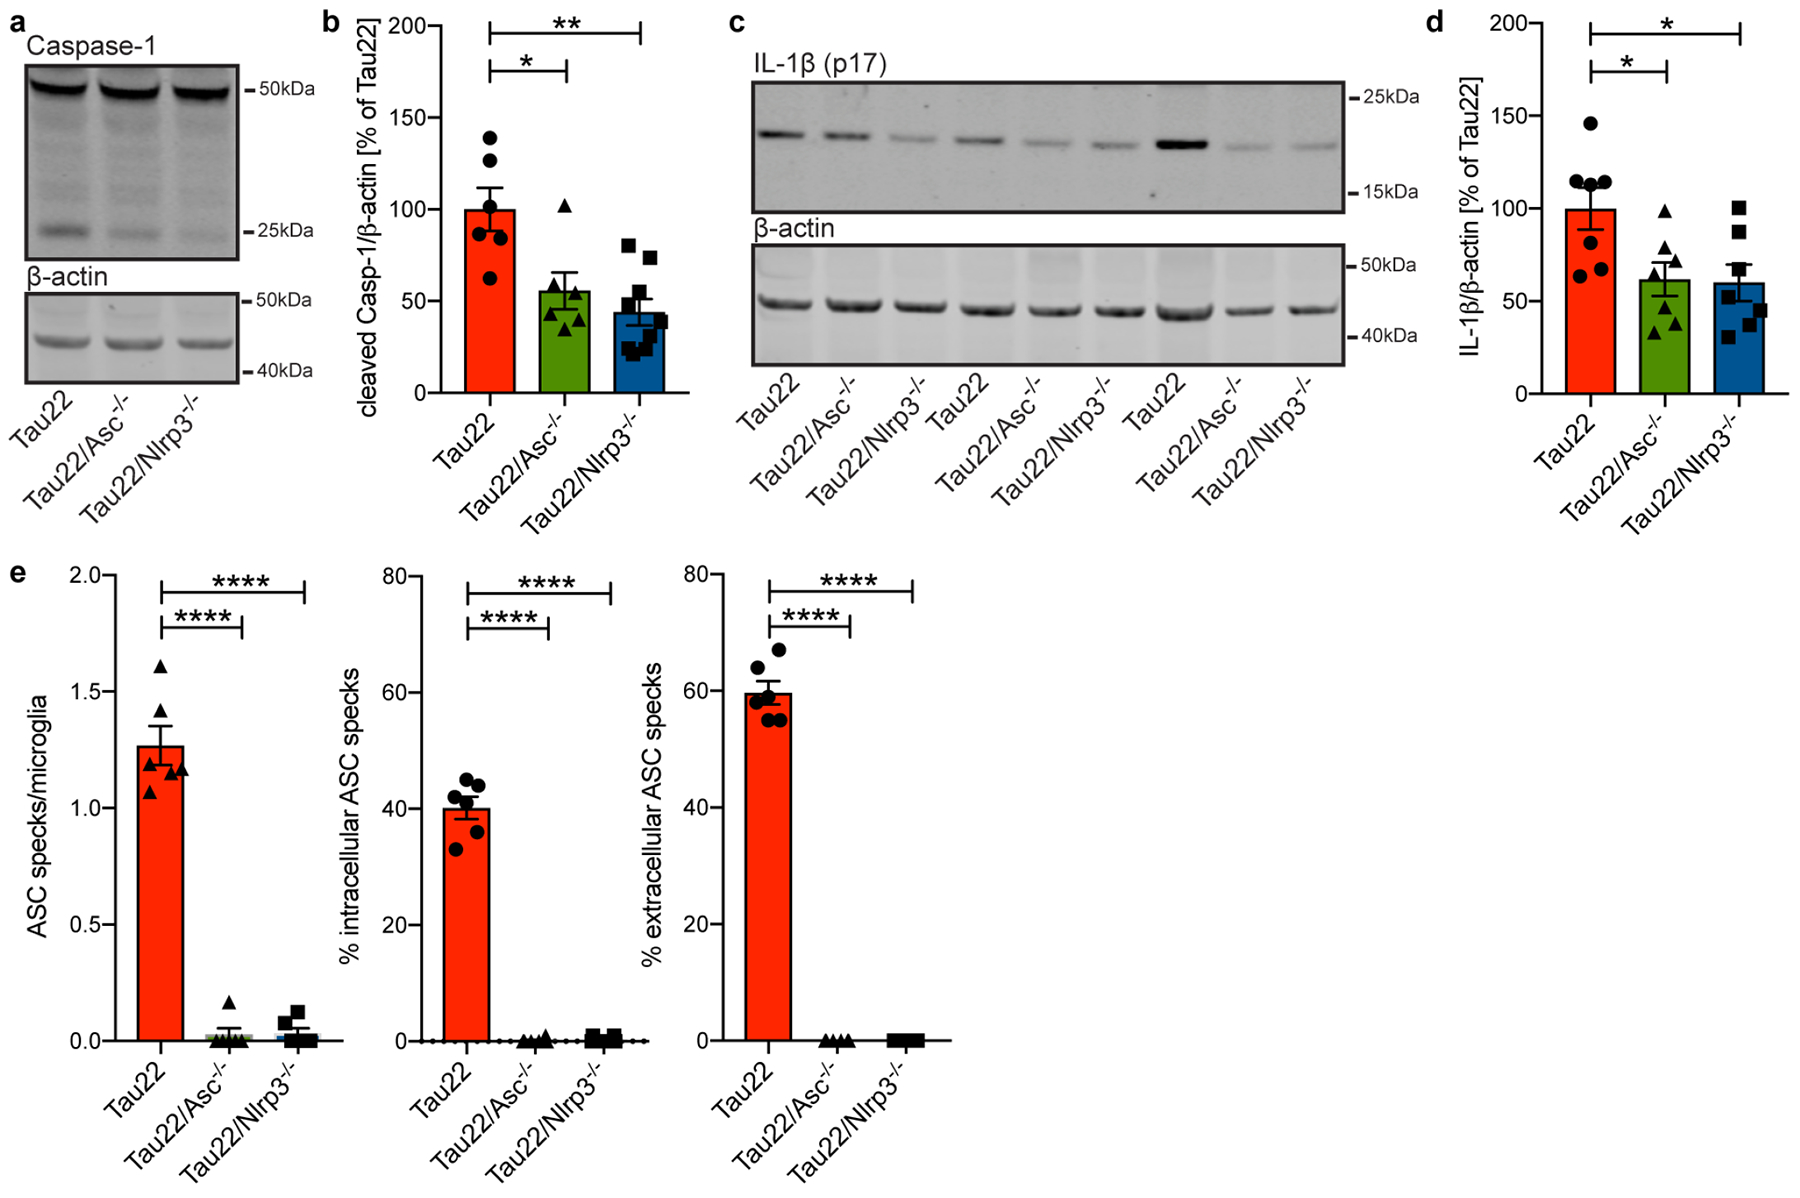
a, Immunoblot analysis of hippocampus samples from 11 month old mice stained for Caspase-1 and β-actin.
b, Quantification of data from a. n=6 for Tau22 and Tau22/Asc−/−, n=9 for Tau22/Nlrp3−/−, *P=0.0156, **P=0.0012.
c, Immunoblot analysis of hippocampus samples of 11 month old mice stained for IL-1β (p17) and β-actin.
d, Quantification of data from c. n=7 for all groups. Tau22 vs. Tau22/Asc−/−: *P=0.0399, Tau22 vs. Tau22/Nlrp3−/−: *P=0.0310.
e, Quantification of number of ASC specks/microglia, % of intracellular ASC specks and % of extracellular ASC specks in hippocampus sections of 11 month old mice. n=6 mice per group, ****P<0.0001 for all comparisons.
For gel source data, see Supplementary Figure 1. All graphs are presented as mean ± SEM and were analyzed by one-way ANOVA followed by Tukey’s test.
Extended Data Figure 6: Tau pathology is reduced in inflammasome-knockout mice.
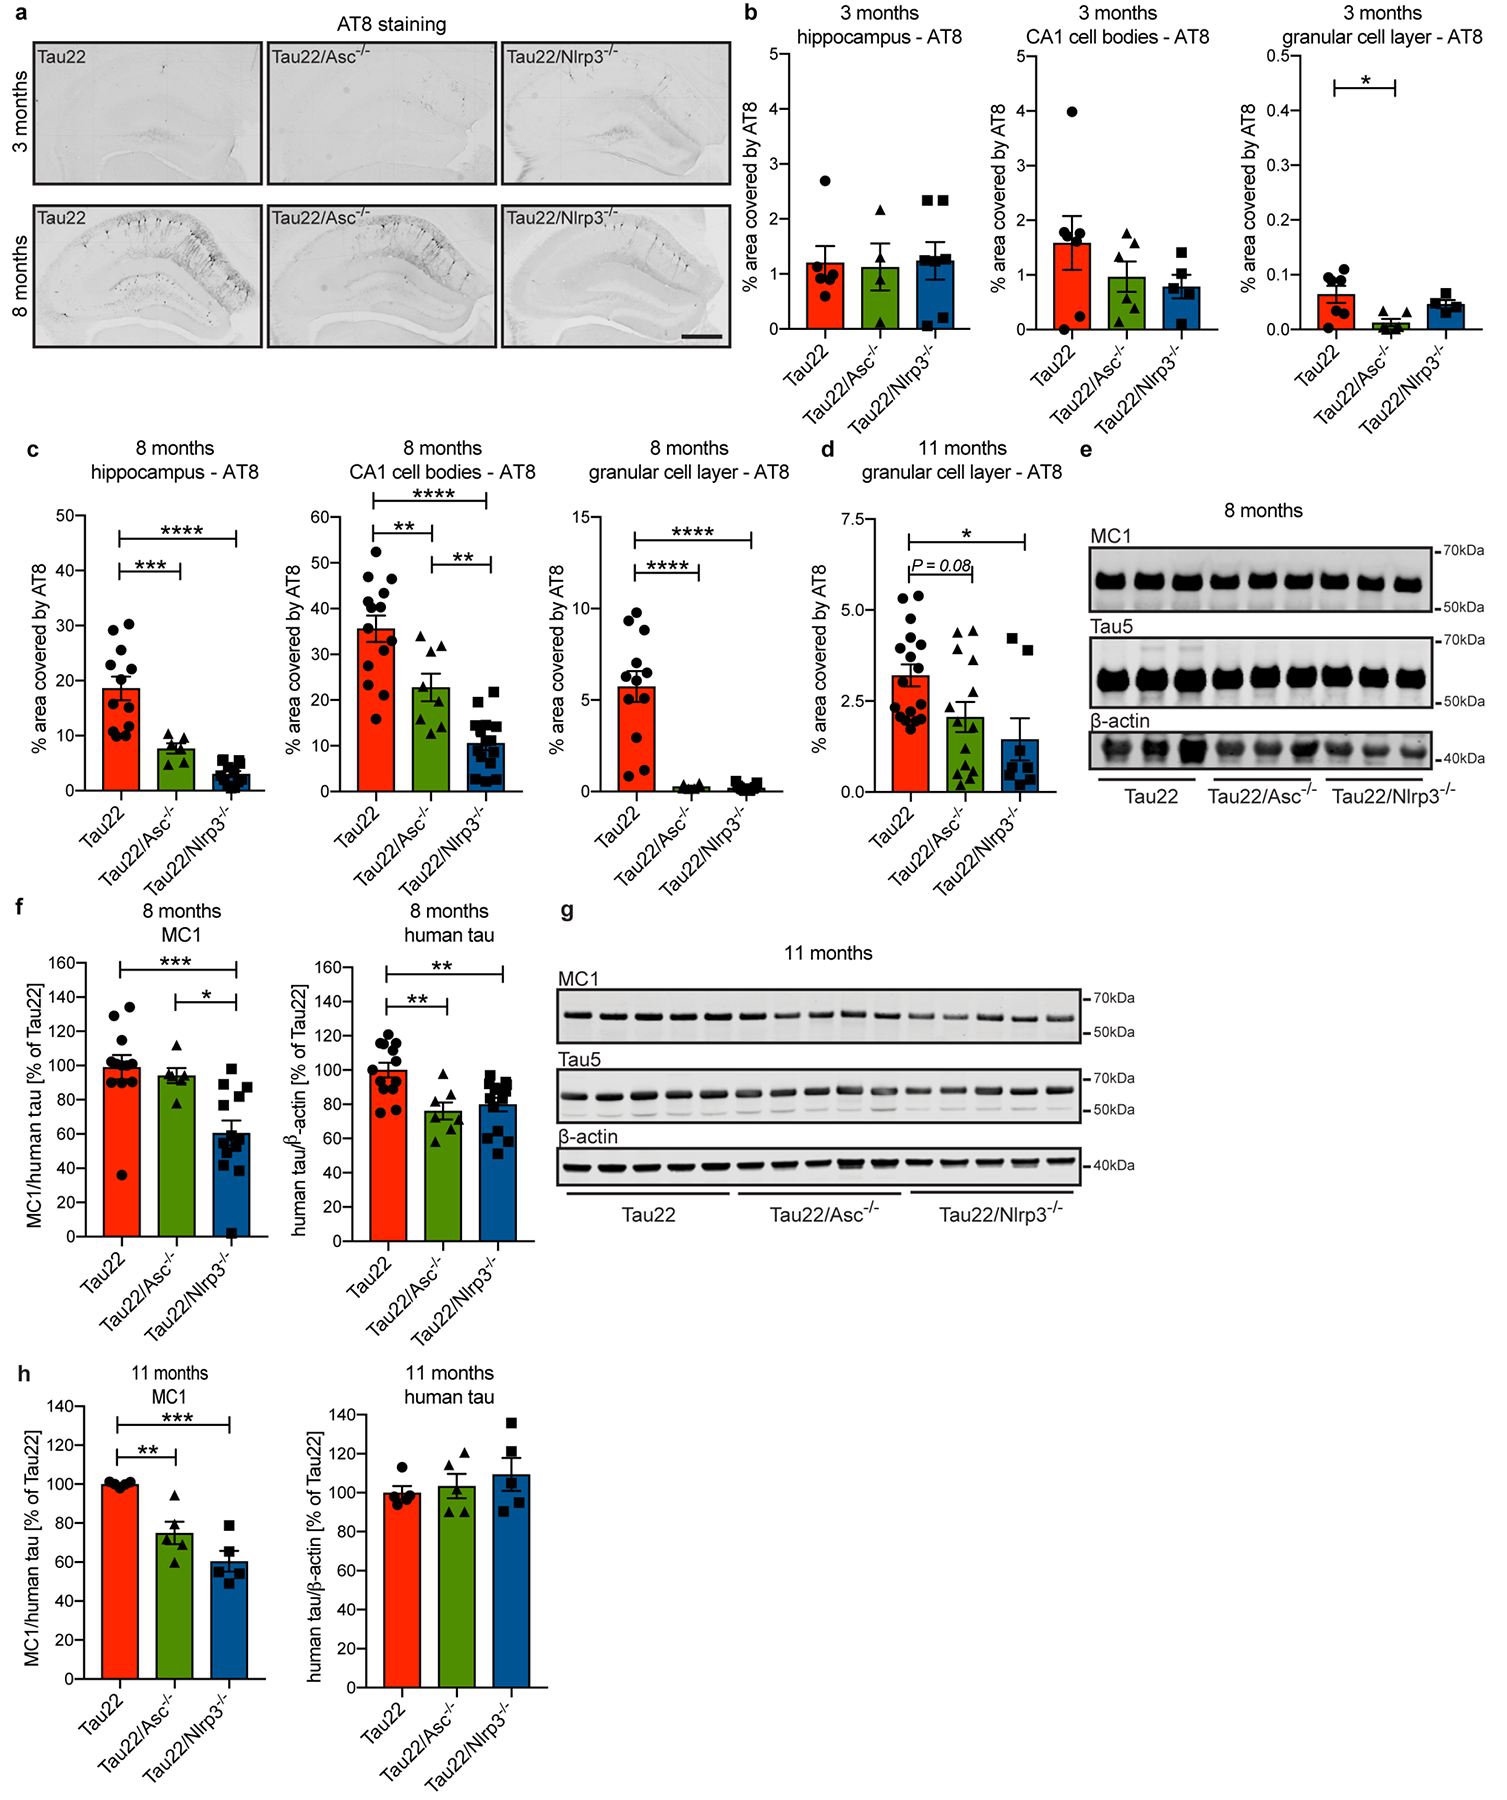
a, Immunohistochemical staining for phosphorylated tau (AT8) in mouse hippocampi. Scale bar, 500μm.
b, Quantification of AT8 in hippocampus, CA1 cell body layer and granular cell layer in the dentate gyrus of 3 month old mice shown in a (n=6 for hippocampus Tau22 and CA1 and dentate gyrus Tau22/Asc−/−, n=4 for hippocampus Tau22/Asc−/− and dentate gyrus Tau22/Nlrp3−/−, n=7 for hippocampus Tau22/Nlrp3−/− and CA1 and dentate gyrus Tau22, n=5 for CA1 Tau22/Nlrp3−/−. *P=0.0181.
c, Quantification of AT8 in hippocampus, CA1 cell body layer and granular cell layer in the dentate gyrus of 8 month old mice shown in a. Hippocampus: n=12 for Tau22, n=6 for Tau22/Asc−/−, n=13 for Tau22/Nlrp3−/−. ***P=0.0004 and ****P<0.0001. CA1: n=14 for Tau22, n=8 for Tau22/Asc−/−, n=15 for Tau22/Nlrp3−/−.Tau22 vs. Tau22/Asc−/−: **P=0.0052, Tau22 vs. Tau22/Nlrp3−/−: ****P<0.0001, Tau22/Asc−/−: vs. Tau22/Nlrp3−/−: **P=0.0075. Dentate gyrus: n=12 for Tau22, n=6 for Tau22/Asc−/−, n=13 for Tau22/Nlrp3−/−), ****P<0.0001.
d, Quantification of AT8 in granular cell layer in the dentate gyrus of 11 month old mice shown in Fig. 2a. n=17 for Tau22, n=14 for Tau22/Asc−/−, n=8 for Tau22/Nlrp3−/−, *P=0.0196.
e, Immunoblot analysis of sarkosyl-soluble fraction of hippocampi from 8 month old Tau22, Tau22/Asc−/− and Tau22/Nlrp3−/− mice stained for misfolded tau (MC1), total tau (Tau5) and β-actin.
f, Quantification of data from e. MC1: n=12 for Tau22, n=6 for Tau22/Asc−/−, n=13 for Tau22/Nlrp3−/− with Tau22 vs. Tau22/Nlrp3−/−: ***P=0.0009 and Tau22/Asc−/− vs. Tau22/Nlrp3−/−: *P=0.0190. Human tau: n=13 for Tau22, n=7 for Tau22/Asc−/−, n=14 for Tau22/Nlrp3−/−. Tau22 vs. Tau22/Asc−/−: **P=0.0047, Tau22 vs. Tau22/Asc−/−: **P=0.0037.
g, Immunoblot detection of misfolded tau (MC1), total tau (Tau5) and β-actin in sarkosyl-soluble fraction of mouse hippocampi at 11 months of age.
h, Quantification of data from g. n=5, **P=0.0056, ***P=0.0001.
For gel source data, see Supplementary Figure 1. All graphs are presented as mean ± SEM and were analyzed by one-way ANOVA followed by Tukey’s test.
Extended Data Figure 7: Microglia and astrocyte numbers are unaltered in Tau22/Asc−/− and Tau22/Nlrp3−/− mice.
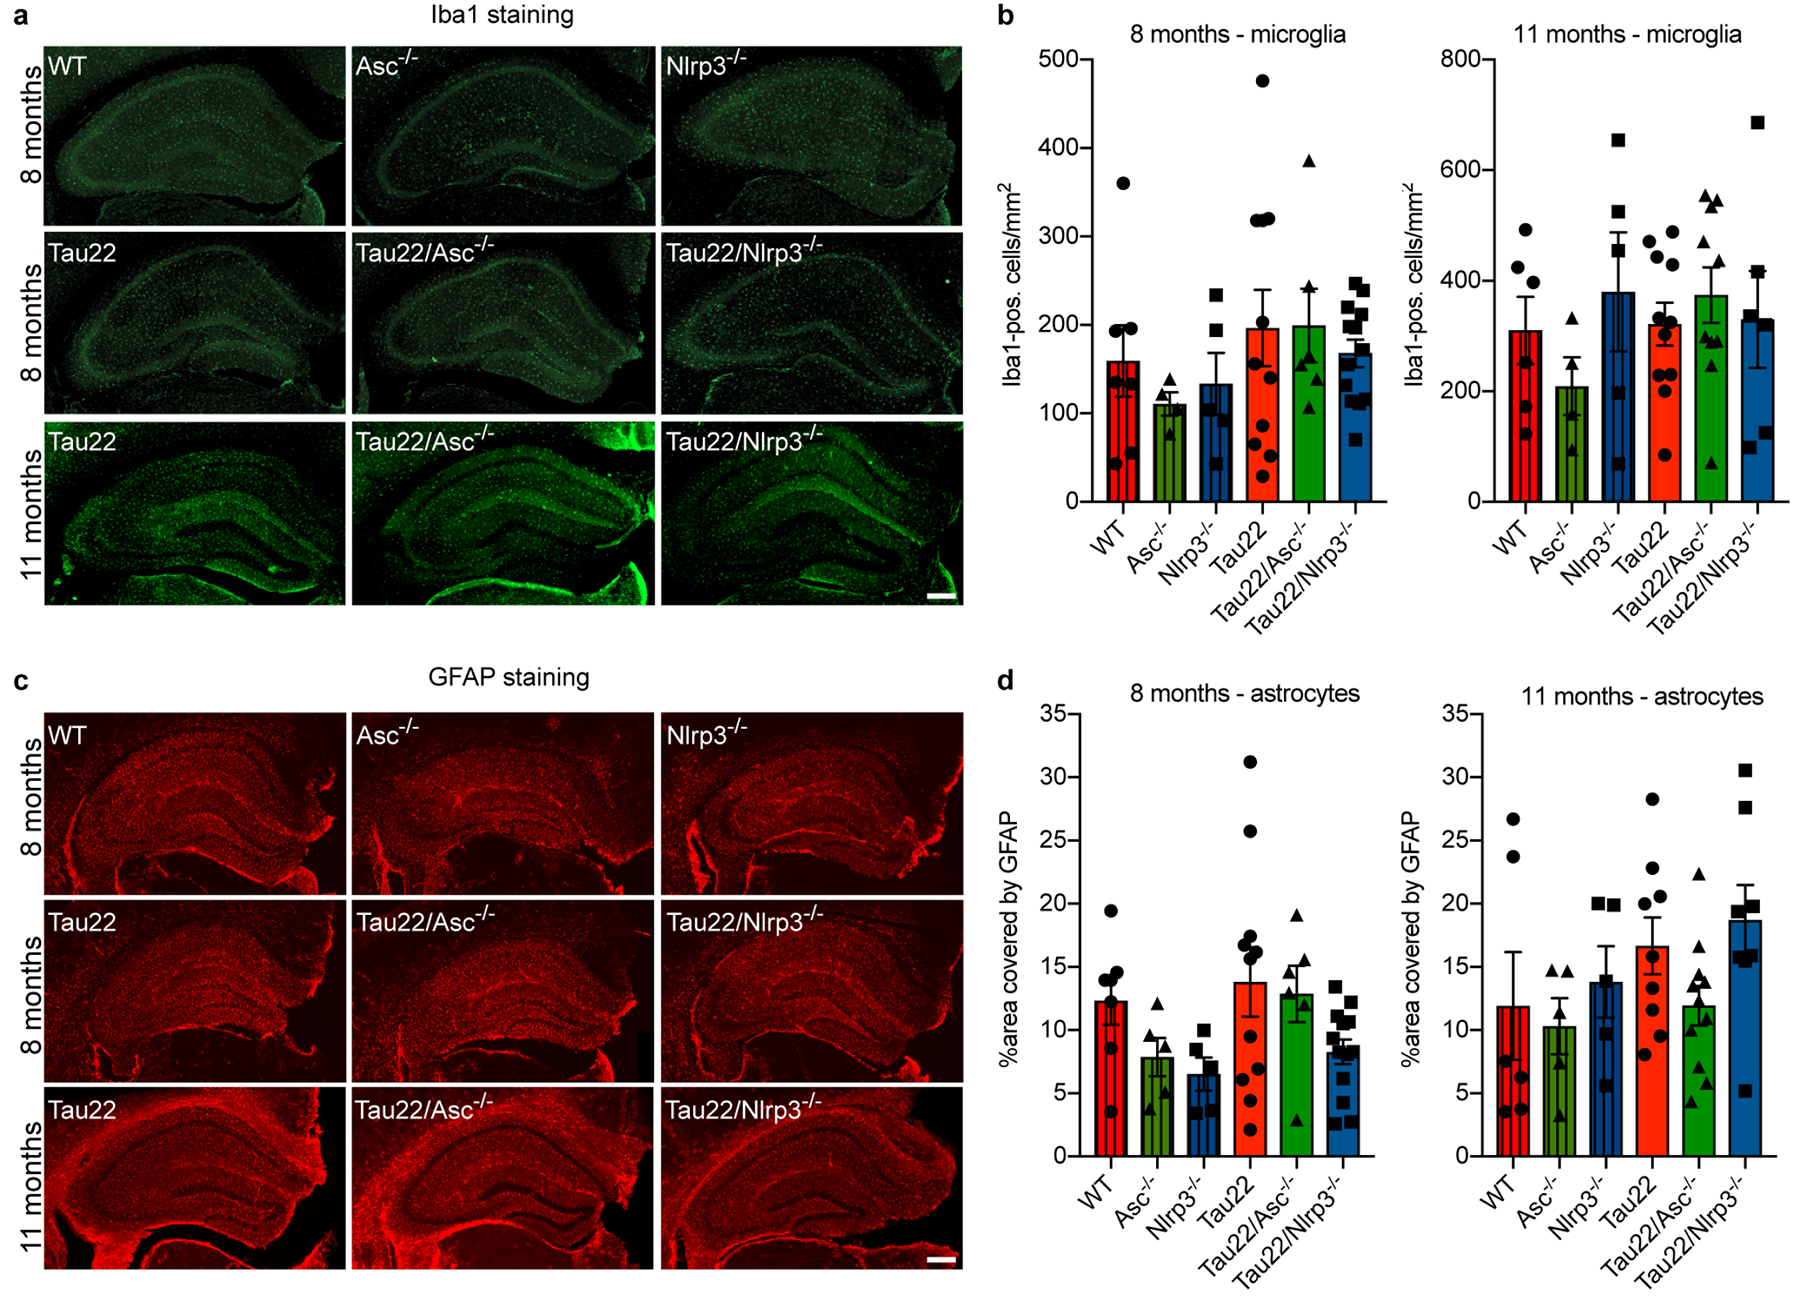
a, Immunohistochemical staining of hippocampus of mice with the indicated genotypes and at the indicated ages for microglia (Iba1). Scale bar, 250μm.
b, Quantification of Iba1-positive cells in the hippocampus as seen in a at 8 (left) and 11 months of age (right). n=7 for 8 months WT, n=6 for 11 months WT, n=4 for 8 and 11 months Asc−/−, n=5 for 8 and 11 months Nlrp3−/−, n=11 for 8 and 11 months Tau22, n=6 for 8 months Tau22/Asc−/−, n=10 for 11 months Tau22/Asc−/−, n=13 for 8 months Tau22/Nlrp3−/−, n=6 for 11 months Tau22/Nlrp3−/−.
c, Immunohistochemical staining of hippocampus of mice with the indicated genotypes and at the indicated ages for astrocytes (GFAP). Scale bar, 250μm.
d, Quantification of GFAP in the hippocampus as seen in c at 8 (left) and 11 months of age (right). n=7 for 8 months WT, n=6 for 11 months WT, n=5 for 8 and 11 months Asc−/− and Nlrp3−/−, n=11 for 8 months Tau22, n=9 for 11 months Tau22, n=6 for 8 months Tau22/Asc−/−, n=11 for 11 months Tau22/Asc−/−, n=13 for 8 months Tau22/Nlrp3−/−, n=8 for 11 months Tau22/Nlrp3−/−).
For gel source data, see Supplementary Figure 1. All graphs are presented as mean ± SEM and were analyzed by one-way ANOVA followed by Tukey’s test.
Extended Data Figure 8: Gene signatures in Tau22 and Tau22/Nlrp3−/− mice identified by NanoString analysis.
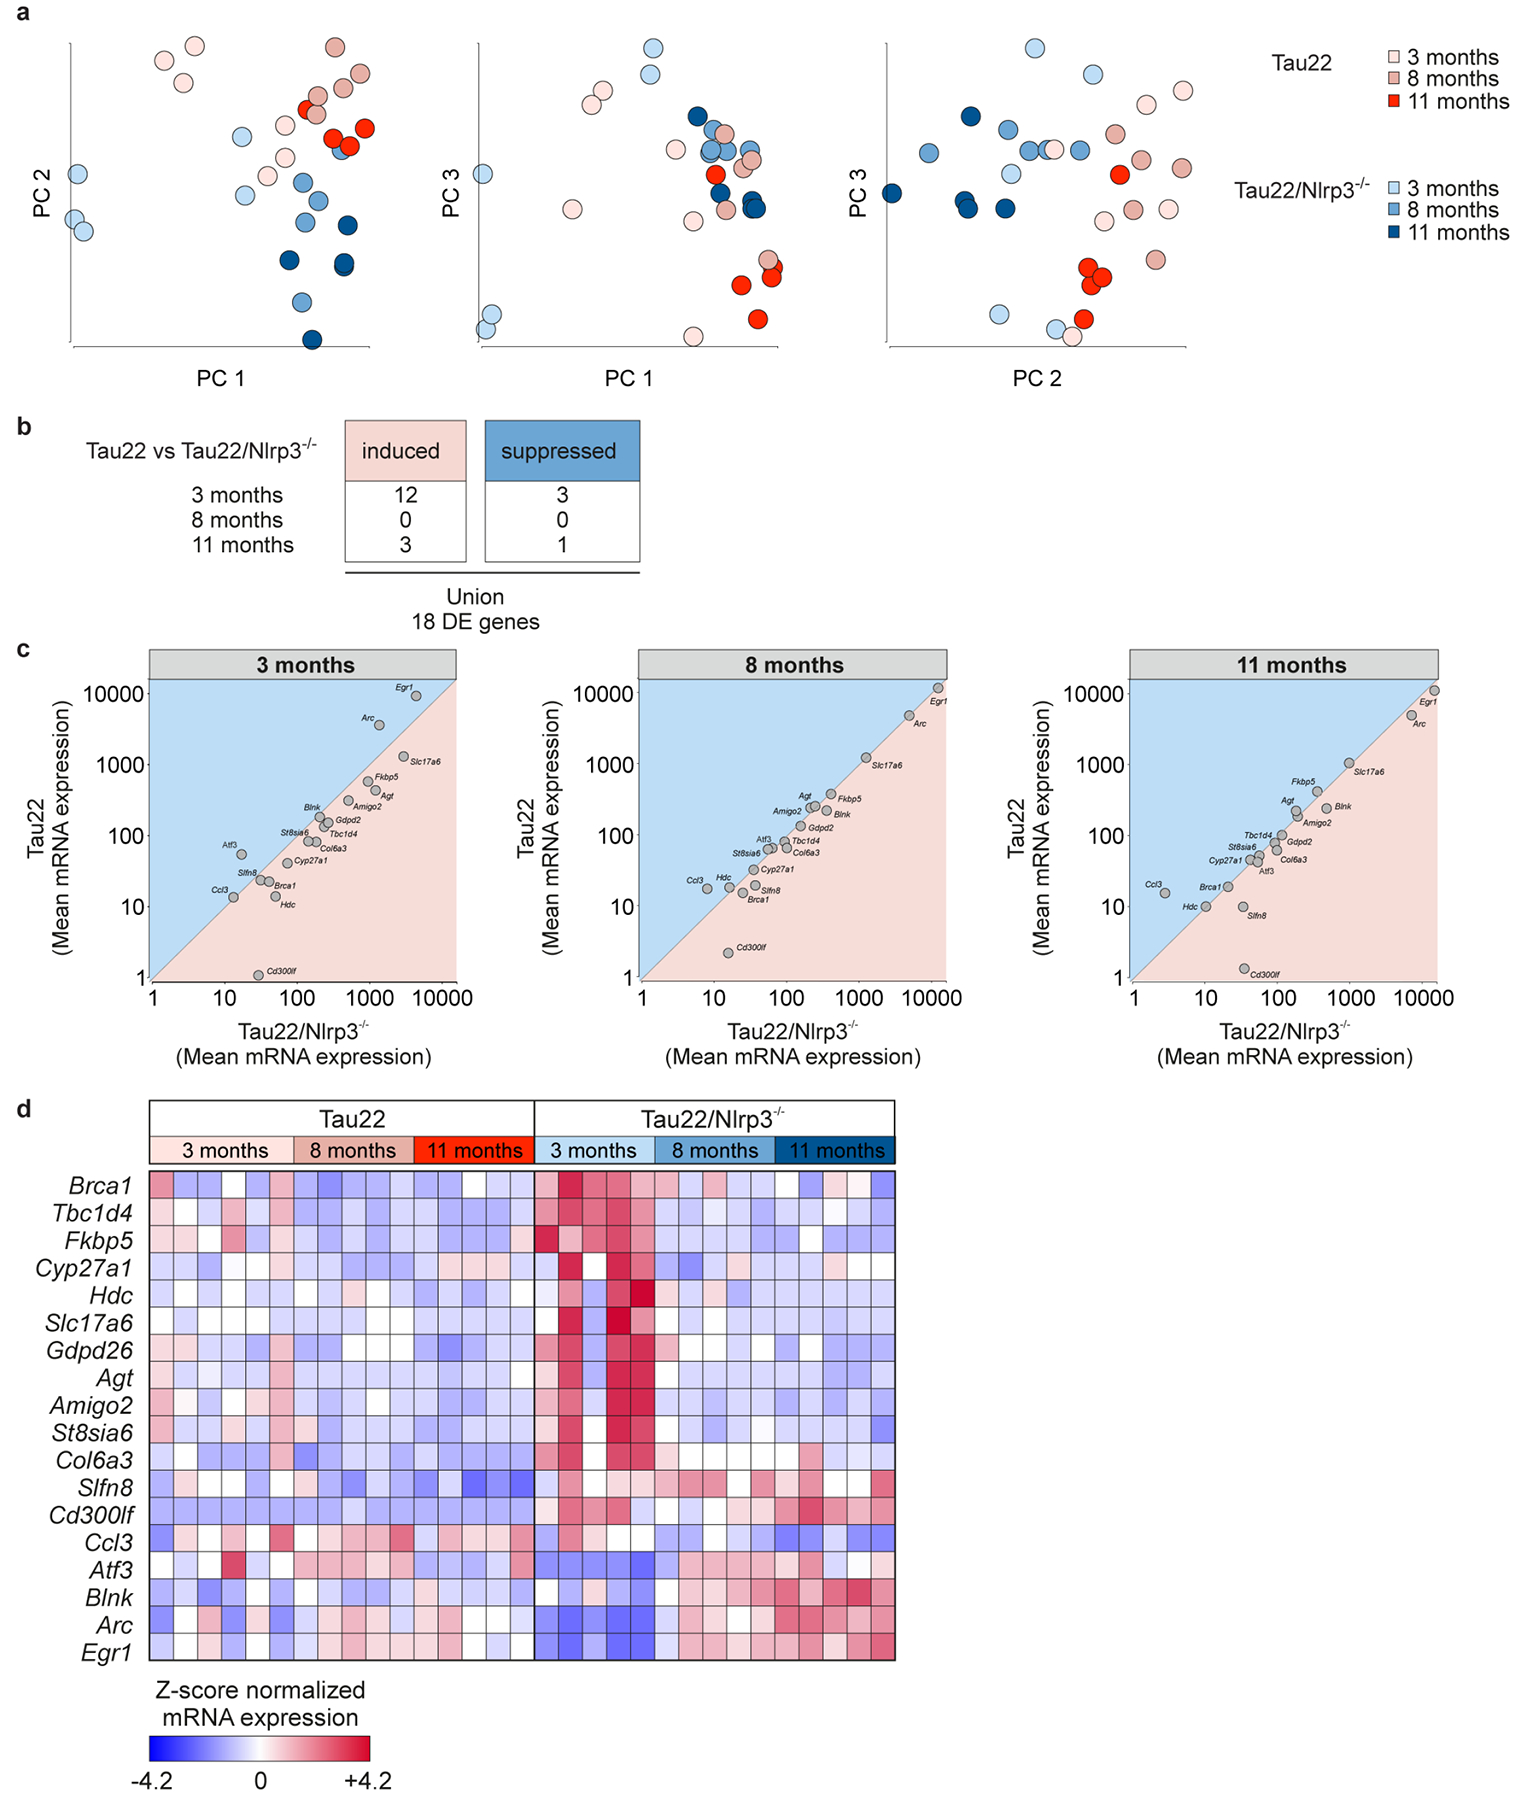
a, 2D PC analysis of Tau22 and Tau22/Nlrp3−/− mice at 3, 8 and 11 months of age. n= 5 independent samples for each group.
b, Number of induced or suppressed genes comparing Tau22 vs. Tau22/Nlrp3−/− at 3, 8 and 11 months.
c, Gene plots of Tau22 vs Tau22/Nlrp3−/− at 3, 8 and 11 months.
d, Heatmap comparing significantly changed genes in Tau22 vs. Tau22/Nlrp3−/− mice at various ages, identified by NanoString analysis.
Extended Data Figure 9: Nlrp3-knockout does not affect the microbiome of Tau22 mice.
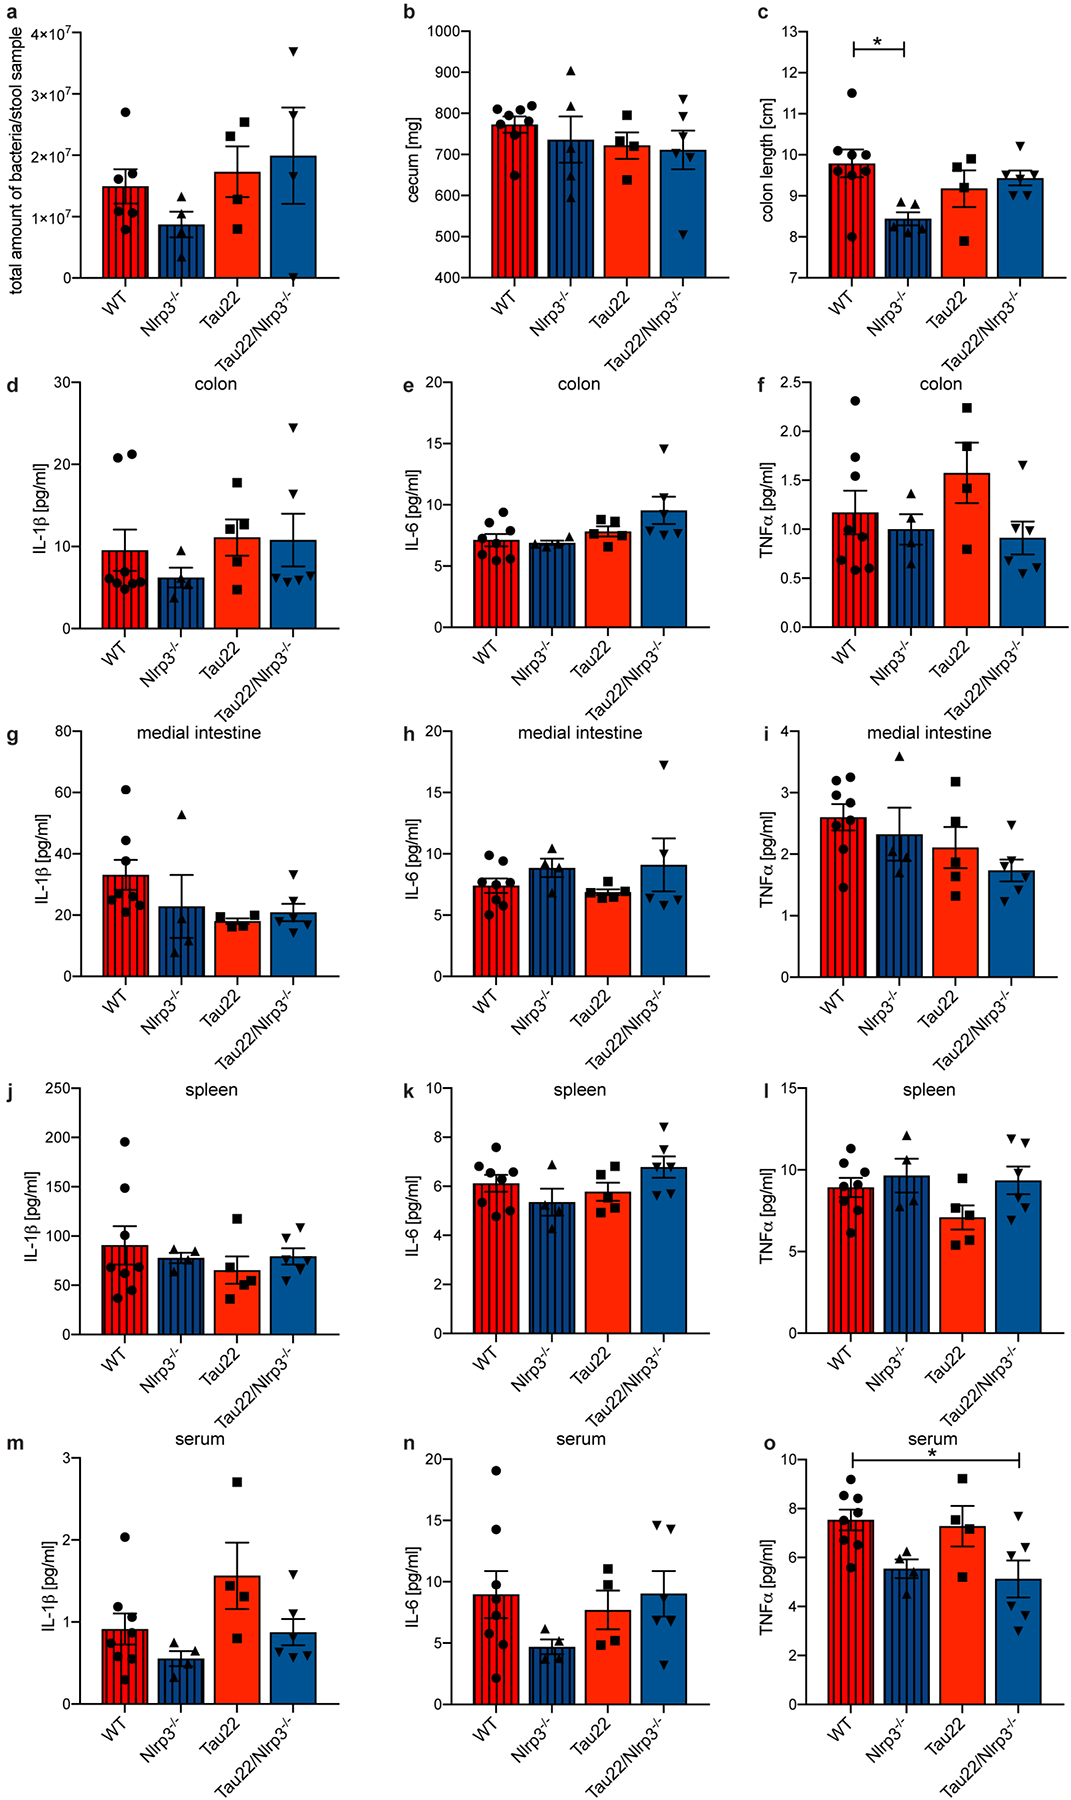
a, Amount of bacteria in stool samples obtained from the colon of 11 month old WT, Nlrp3−/−, Tau22 and Tau22/Nlrp3−/− mice. n=6 for WT, n=4 for Nlrp3−/−, Tau22, Tau22/Nlrp3−/−.
b, Cecum weight of 11 month old WT, Nlrp3−/−, Tau22 and Tau22/Nlrp3−/− mice. n=8 for WT, n=5 for Nlrp3−/−, n=4 for Tau22, n=6 for Tau22/Nlrp3−/−.
c, Colon length of 11 month old WT, Nlrp3−/−, Tau22 and Tau22/Nlrp3−/− mice. n=8 for WT, n=5 for Nlrp3−/−, n=4 for Tau22, n=6 for Tau22/Nlrp3−/−, *P=0.0350.
d-f, IL-1β, IL-6 and TNFα levels in colon samples of 11 month old WT, Nlrp3−/−, Tau22 and Tau22/Nlrp3−/− mice. n=8 for WT, n=4 for Nlrp3−/−, n=5 for IL-1β and IL-6 in Tau22, n=4 for TNFα in Tau22, n=6 for Tau22/Nlrp3−/−.
g-i, IL-1β, IL-6 and TNFα levels in medial intestine samples of 11 month old WT, Nlrp3−/−, Tau22 and Tau22/Nlrp3−/− mice. n=8 for WT, n=4 for Nlrp3−/−, n=4 for IL-1β in Tau22, n= 5 for IL-6 and TNFα in Tau22, n=6 for IL-1β and TNFα in Tau22/Nlrp3−/−, n=5 for IL-6 in Tau22/Nlrp3−/−.
j-l, IL-1β, IL-6 and TNFα levels in spleen samples of 11 month old WT, Nlrp3−/−, Tau22 and Tau22/Nlrp3−/− mice. n=8 for WT, n=4 for Nlrp3−/−, n=5 for Tau22, n=6 for Tau22/Nlrp3−/−.
m-o, IL-1β, IL-6 and TNFα levels in serum samples of 11 month old WT, Nlrp3−/−, Tau22 and Tau22/Nlrp3−/− mice. n=8 for WT, n=4 for Nlrp3−/− and Tau22, n=6 for Tau22/Nlrp3−/−, *P=0.0281.
All graphs are presented as mean ± SEM and were analyzed by one-way ANOVA followed by Tukey’s test.
Extended Data Figure 10: Tau can activate the NLRP3 inflammasome.
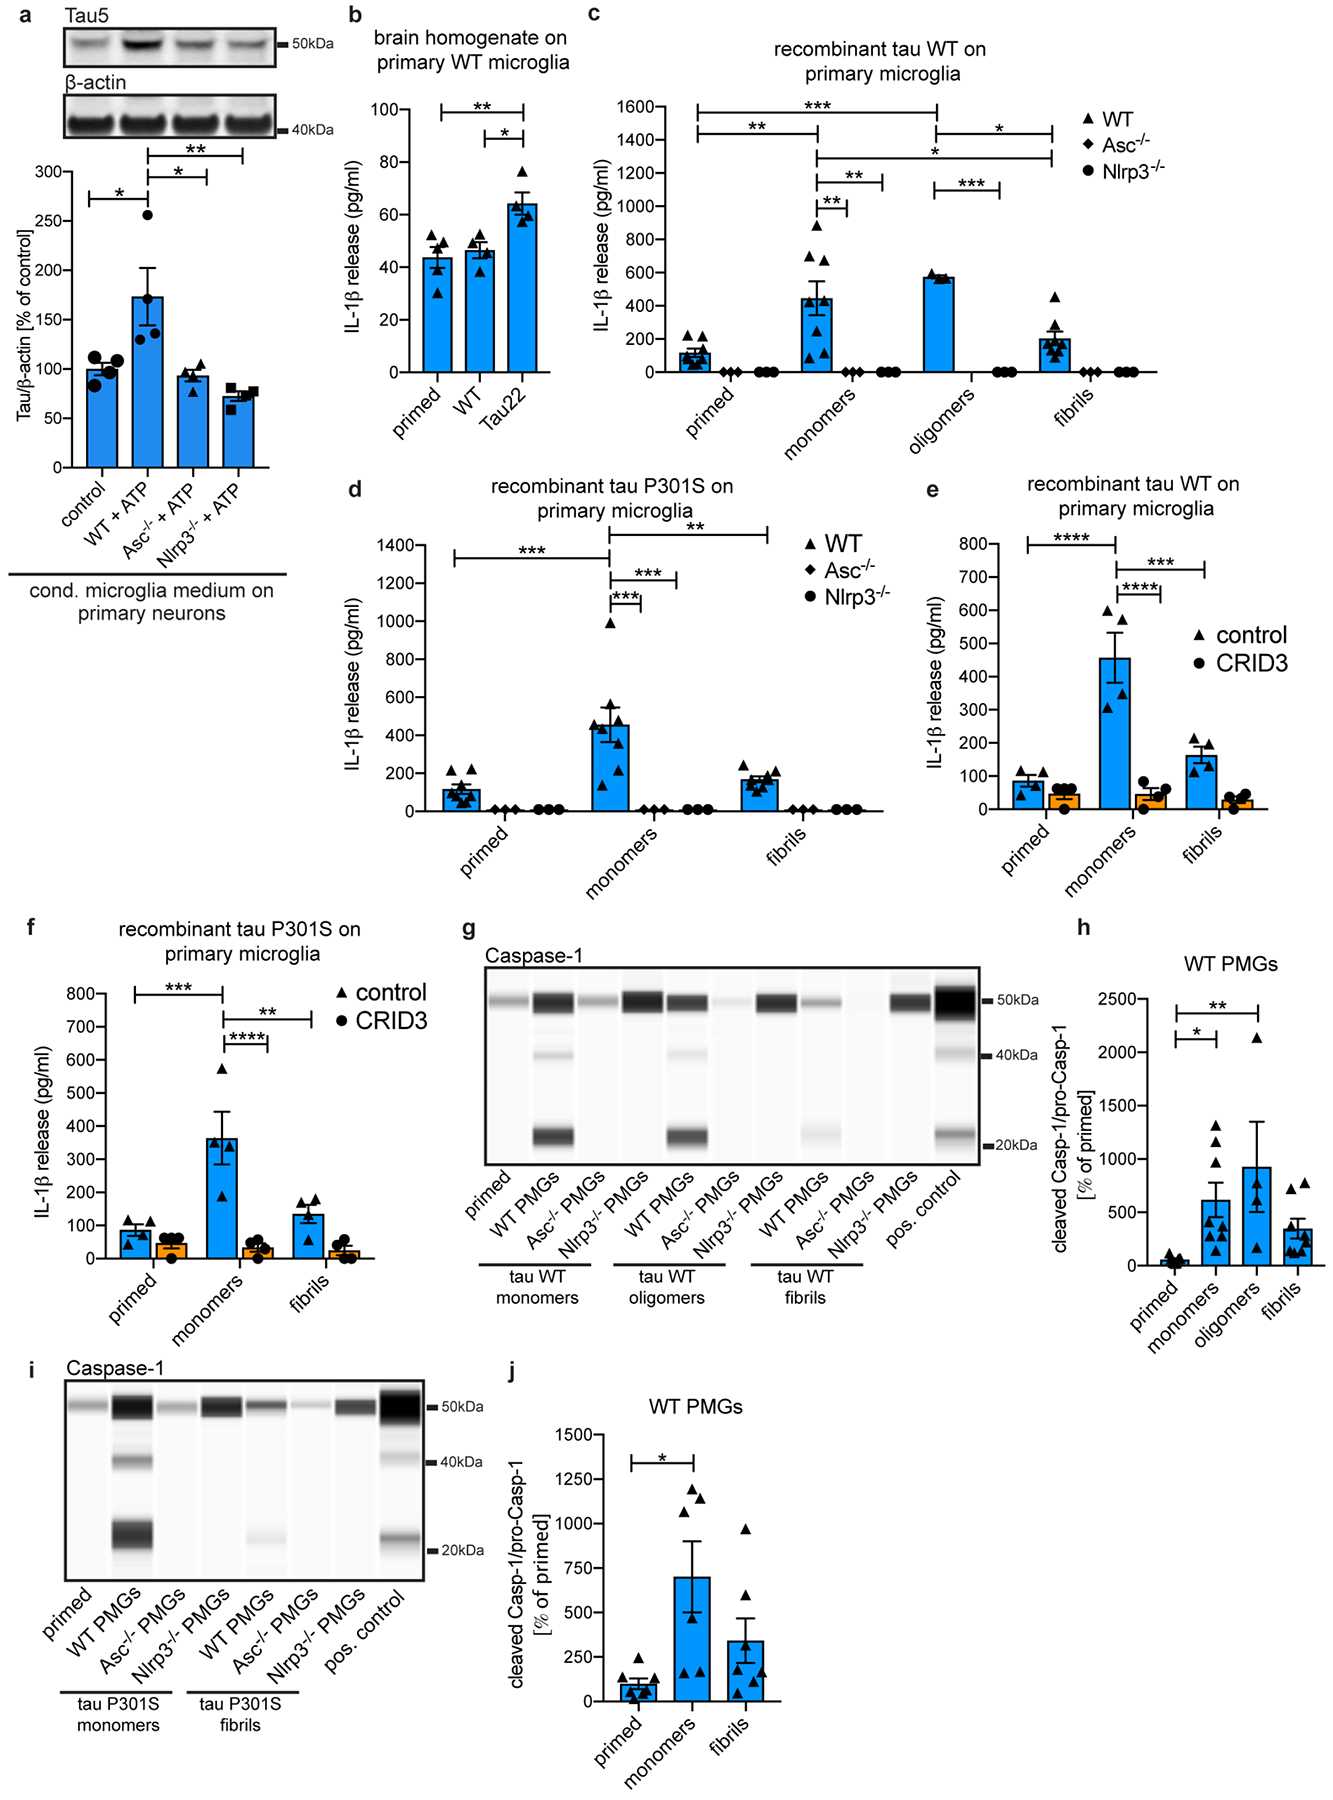
a, Immunoblot analysis and quantification of total tau in primary neurons after treatment with conditioned medium from primary WT microglia (control), LPS/ATP-activated WT, Asc- or Nlrp3-knockout microglia (WT+ATP, Asc−/−+ATP or Nlrp3−/−+ATP). n=4 for each group. Control vs. WT+ATP: *P=0.0252, WT+ATP vs. Asc−/−+ATP: *P=0.0148, WT+ATP vs. Nlrp3−/−+ATP: **P=0.0029.
b, IL-1β levels in conditioned medium of primary WT microglia primed with LPS and treated with hippocampus homogenate from either 11 month old WT or Tau22 mice. n=5 for primed, n=4 for WT and Tau22 homogenate treated microglia. Primed vs. Tau22: **P=0.0092, WT vs. Tau22: *P=0.0276.
c, IL-1β levels in conditioned medium of primary WT, Asc−/− and Nlrp3−/− microglia primed with LPS and treated with different forms of 2μM recombinant wildtype tau (tau WT). n=3 for Asc−/− and Nlrp3−/− microglia treatments and WT oligomer treatment, n=8 for all other WT treatments. WT primed vs. WT monomers: **P=0.0011, WT primed vs. WT oligomers: ***P=0.0007, WT monomers vs. Asc−/− and Nlrp3−/− monomers: **P=0.0011, WT monomers vs. WT fibrils: *P=0.0388, WT oligomers vs. Nlrp3−/− oligomers: ***P=0.0004, WT oligomers vs. WT fibrils: *P=0.0112.
d, IL-1β levels in conditioned medium of primary WT, Asc−/− and Nlrp3−/− microglia primed with LPS and treated with different forms of 2μM recombinant tau with a P301S (tau P301S) mutation. n=8 for WT microglia treatments, n=3 for Asc−/− and Nlrp3−/− microglia treatments, ***P=0.0002, **P=0.0018.
e, IL-1β levels in conditioned medium of primary WT microglia primed with LPS and treated with different forms of 2μM recombinant tau WT with and without the NLRP3 inhibitior CRID3. n=4 for all groups, ***P=0.0002, ****P<0.0001.
f, IL-1β levels in conditioned medium of primary WT microglia primed with LPS and treated with different forms of 2μM recombinant tau P301S with and without CRID3 treatment. n=4 for all groups, **P=0.0037, ***P=0.0005, ****P<0.0001.
g, Jess-based analysis of conditioned medium of LPS + tau WT-treated WT microglia stained for Caspase-1. LPS/ATP-treated WT microglia served as positive control.
h, Quantification of data from g. n=7 for primed, n=8 for tau monomers and fibrils, n=4 for tau oligomers. *P=0.0458, **P=0.0091.
i, Jess-based analysis of conditioned medium of primary WT, Asc−/− and Nlrp3−/− microglia primed with LPS and treated with the indicated forms of tau P301S. LPS/ATP-treated WT microglia served as positive control. Samples were stained for Caspase-1.
j, Quantification of data from i. n=7 for primed and fibrils, n=6 for monomers, *P=0.0128.
For gel source data, see Supplementary Figure 1. All graphs are presented as mean ± SEM and were analyzed by one-way (a, b, h, j) or two-way ANOVA (c-f) followed by Tukey’s test.
Supplementary Material
Acknowledgments
This work was supported by funding from the Deutsche Forschungsgemeinschaft (DFG) to CI (IS 299/3-1) and a NIH grant (R01 AG059752-02) to D.G. and M.T.H. This work was further supported by the ImmunoSensation Bonn Cluster of Excellence. We thank Ildikó Rácz for help with obtaining approval by the local ethical committee for the animal experiments. We thank Peter Davies for providing the MC1 and PHF-1 antibodies. We thank the DZNE light microscope facility (LMF) for providing microscopes and advice and the DZNE Image and Data Analysis Facility (IDAF) for providing analysis computers, software and advice.
Footnotes
Competing interests
M.T.H. serves as advisory board member at IFM Therapeutics and Alector. All other authors declare no competing interests.
Supplementary Information is available in the online version of the paper.
References
- 1.Ising C & Heneka MT Functional and structural damage of neurons by innate immune mechanisms during neurodegeneration. Cell Death Dis. 9, 120 (2018). [DOI] [PMC free article] [PubMed] [Google Scholar]
- 2.Heneka MT, McManus RM & Latz E Inflammasome signalling in brain function and neurodegenerative disease. Nat. Rev. Neurosci 19, 610–621 (2018). [DOI] [PubMed] [Google Scholar]
- 3.Venegas C et al. Microglia-derived ASC specks cross-seed amyloid-β in Alzheimer’s disease. Nature 552, 355–361 (2017). [DOI] [PubMed] [Google Scholar]
- 4.Halle A et al. The NALP3 inflammasome is involved in the innate immune response to amyloid-beta. Nat. Immunol 9, 857–865 (2008). [DOI] [PMC free article] [PubMed] [Google Scholar]
- 5.Heneka MT et al. NLRP3 is activated in Alzheimer’s disease and contributes to pathology in APP/PS1 mice. Nature 493, 674–678 (2013). [DOI] [PMC free article] [PubMed] [Google Scholar]
- 6.Lewis J & Dickson DW Propagation of tau pathology: hypotheses, discoveries, and yet unresolved questions from experimental and human brain studies. Acta Neuropathol. (Berl.) 131, 27–48 (2016). [DOI] [PubMed] [Google Scholar]
- 7.Schindowski K et al. Alzheimer’s disease-like tau neuropathology leads to memory deficits and loss of functional synapses in a novel mutated tau transgenic mouse without any motor deficits. Am. J. Pathol 169, 599–616 (2006). [DOI] [PMC free article] [PubMed] [Google Scholar]
- 8.Youm Y-H et al. Canonical Nlrp3 inflammasome links systemic low-grade inflammation to functional decline in aging. Cell Metab. 18, 519–532 (2013). [DOI] [PMC free article] [PubMed] [Google Scholar]
- 9.Taylor JM et al. Type-1 interferon signaling mediates neuro-inflammatory events in models of Alzheimer’s disease. Neurobiol. Aging 35, 1012–1023 (2014). [DOI] [PubMed] [Google Scholar]
- 10.Minter MR et al. Soluble amyloid triggers a myeloid differentiation factor 88 and interferon regulatory factor 7 dependent neuronal type-1 interferon response in vitro. J. Neuroinflammation 12, 71 (2015). [DOI] [PMC free article] [PubMed] [Google Scholar]
- 11.Iqbal K et al. Tau pathology in Alzheimer disease and other tauopathies. Biochim. Biophys. Acta 1739, 198–210 (2005). [DOI] [PubMed] [Google Scholar]
- 12.Ortega-Gutiérrez S, Leung D, Ficarro S, Peters EC & Cravatt BF Targeted disruption of the PME-1 gene causes loss of demethylated PP2A and perinatal lethality in mice. PloS One 3, e2486 (2008). [DOI] [PMC free article] [PubMed] [Google Scholar]
- 13.Laurent C et al. Hippocampal T cell infiltration promotes neuroinflammation and cognitive decline in a mouse model of tauopathy. Brain J. Neurol 140, 184–200 (2017). [DOI] [PMC free article] [PubMed] [Google Scholar]
- 14.Peluffo H et al. Overexpression of the immunoreceptor CD300f has a neuroprotective role in a model of acute brain injury. Brain Pathol. Zurich Switz 22, 318–328 (2012). [DOI] [PMC free article] [PubMed] [Google Scholar]
- 15.Epstein I & Finkbeiner S The Arc of cognition: Signaling cascades regulating Arc and implications for cognitive function and disease. Semin. Cell Dev. Biol 77, 63–72 (2018). [DOI] [PMC free article] [PubMed] [Google Scholar]
- 16.Bhaskar K et al. Regulation of tau pathology by the microglial fractalkine receptor. Neuron 68, 19–31 (2010). [DOI] [PMC free article] [PubMed] [Google Scholar]
- 17.Stancu I-C et al. Aggregated Tau activates NLRP3-ASC inflammasome exacerbating exogenously seeded and non-exogenously seeded Tau pathology in vivo. Acta Neuropathol. (Berl.) (2019). doi: 10.1007/s00401-018-01957-y [DOI] [PMC free article] [PubMed] [Google Scholar]
- 18.Asai H et al. Depletion of microglia and inhibition of exosome synthesis halt tau propagation. Nat. Neurosci 18, 1584–1593 (2015). [DOI] [PMC free article] [PubMed] [Google Scholar]
- 19.Götz J, Chen F, van Dorpe J & Nitsch RM Formation of neurofibrillary tangles in P301l tau transgenic mice induced by Abeta 42 fibrils. Science 293, 1491–1495 (2001). [DOI] [PubMed] [Google Scholar]
- 20.Bolmont T et al. Induction of tau pathology by intracerebral infusion of amyloid-beta -containing brain extract and by amyloid-beta deposition in APP x Tau transgenic mice. Am. J. Pathol 171, 2012–2020 (2007). [DOI] [PMC free article] [PubMed] [Google Scholar]
- 21.Shafiei SS, Guerrero-Muñoz MJ & Castillo-Carranza DL Tau Oligomers: Cytotoxicity, Propagation, and Mitochondrial Damage. Front. Aging Neurosci 9, 83 (2017). [DOI] [PMC free article] [PubMed] [Google Scholar]
- 22.Usenovic M et al. Internalized Tau Oligomers Cause Neurodegeneration by Inducing Accumulation of Pathogenic Tau in Human Neurons Derived from Induced Pluripotent Stem Cells. J. Neurosci. Off. J. Soc. Neurosci 35, 14234–14250 (2015). [DOI] [PMC free article] [PubMed] [Google Scholar]
- 23.Karch CM, Jeng AT & Goate AM Extracellular Tau levels are influenced by variability in Tau that is associated with tauopathies. J. Biol. Chem 287, 42751–42762 (2012). [DOI] [PMC free article] [PubMed] [Google Scholar]
- 24.Yamada K et al. Neuronal activity regulates extracellular tau in vivo. J. Exp. Med 211, 387–393 (2014). [DOI] [PMC free article] [PubMed] [Google Scholar]
- 25.Kanneganti T-D et al. Bacterial RNA and small antiviral compounds activate caspase-1 through cryopyrin/Nalp3. Nature 440, 233–236 (2006). [DOI] [PubMed] [Google Scholar]
- 26.Lasagna-Reeves CA, Castillo-Carranza DL, Guerrero-Muoz MJ, Jackson GR & Kayed R Preparation and characterization of neurotoxic tau oligomers. Biochemistry 49, 10039–10041 (2010). [DOI] [PubMed] [Google Scholar]
- 27.Ising C et al. AAV-mediated expression of anti-tau scFvs decreases tau accumulation in a mouse model of tauopathy. J. Exp. Med 214, 1227–1238 (2017). [DOI] [PMC free article] [PubMed] [Google Scholar]
- 28.Szklarczyk D et al. The STRING database in 2017: quality-controlled protein-protein association networks, made broadly accessible. Nucleic Acids Res. 45, D362–D368 (2017). [DOI] [PMC free article] [PubMed] [Google Scholar]
Associated Data
This section collects any data citations, data availability statements, or supplementary materials included in this article.
Supplementary Materials
Data Availability Statement
All data generated and/or analyzed during this study are either included in this article (and its supplementary information files) or are available from the corresponding author on reasonable request.