
Extended Data Figure 3: STRING network analysis of Tau22 mice.
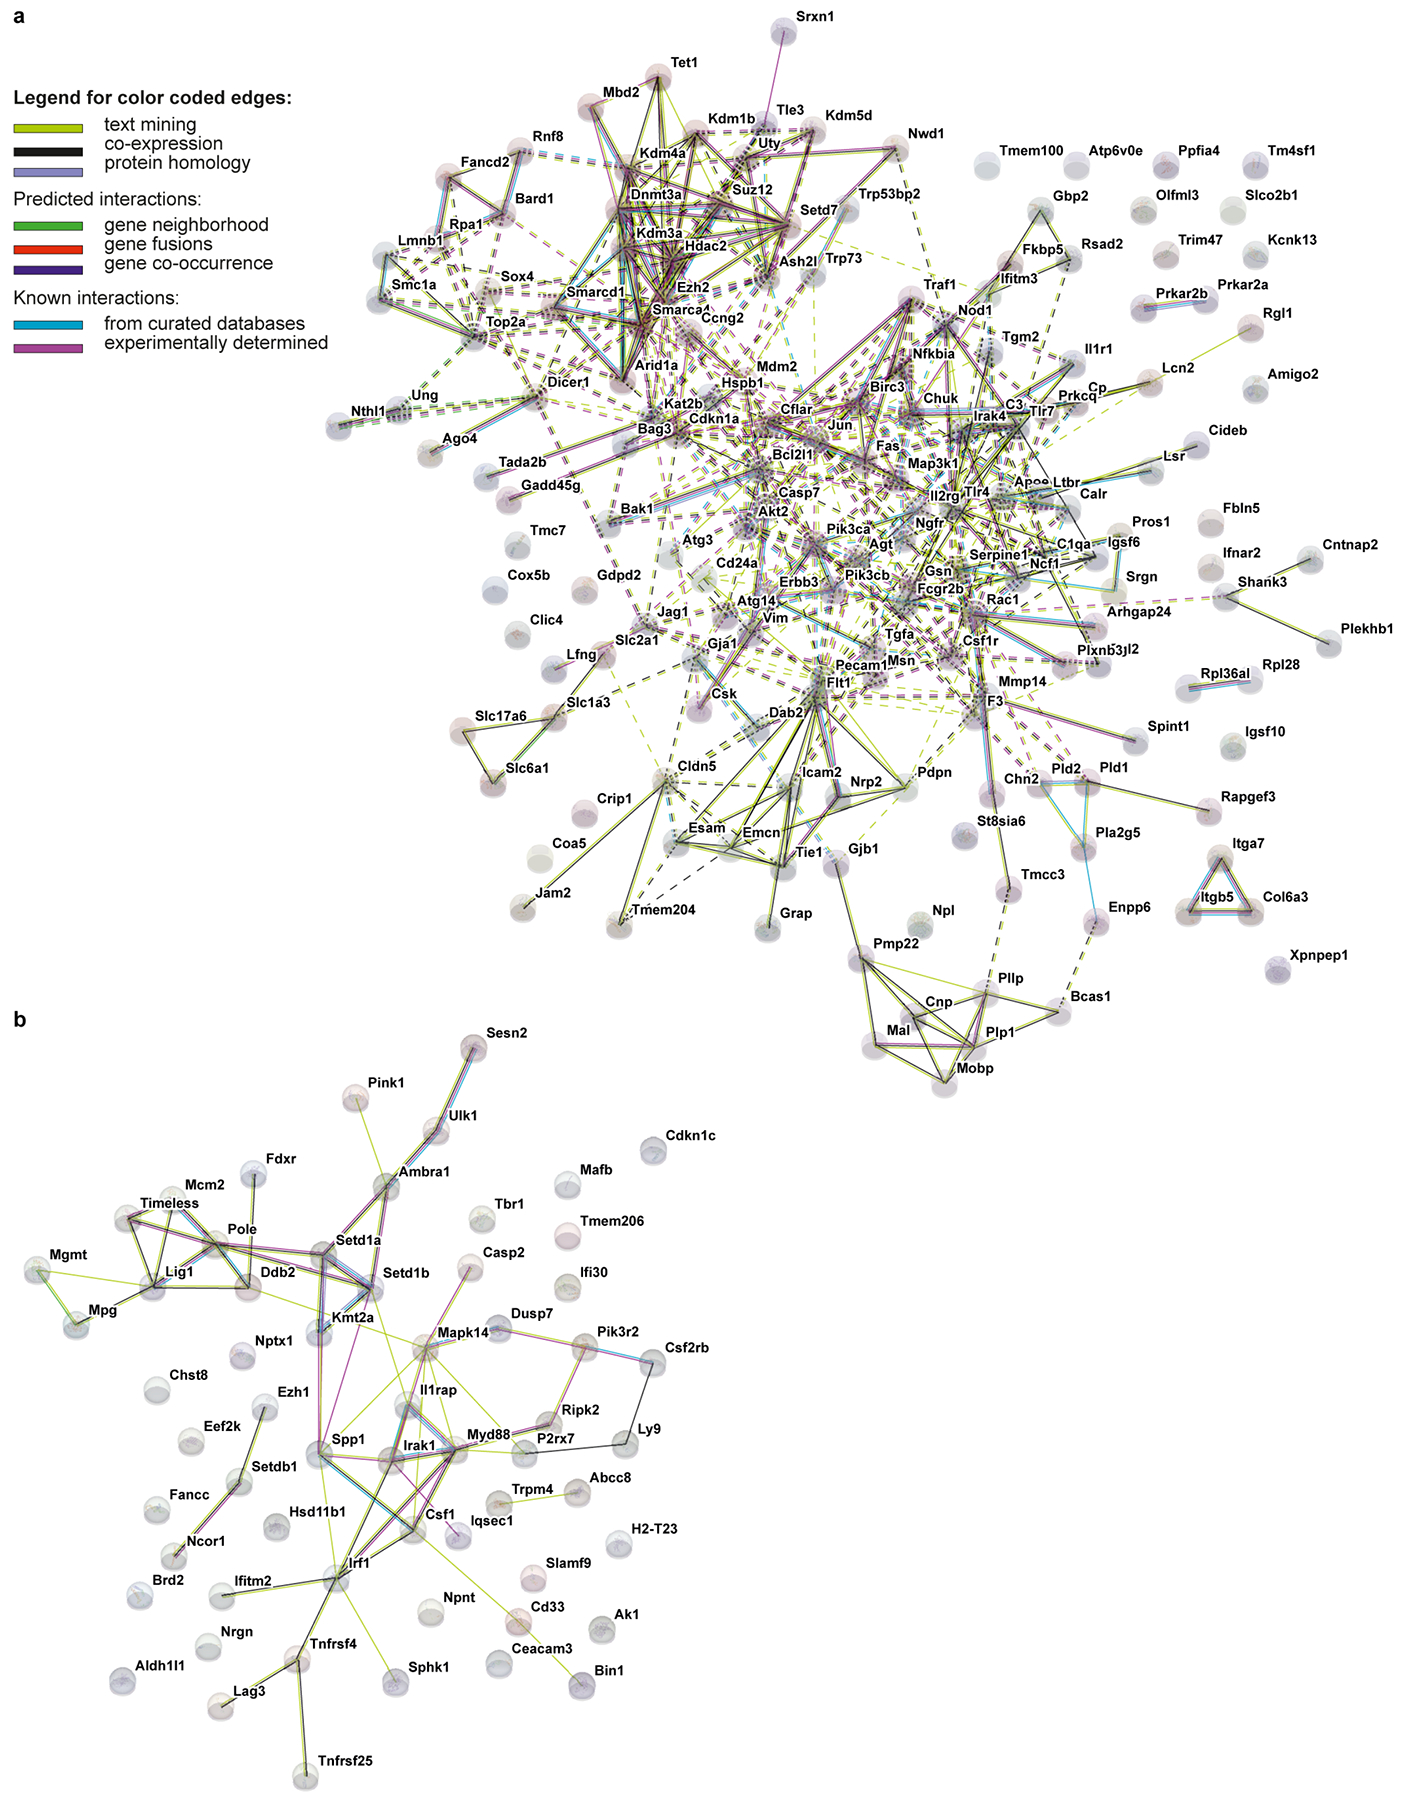
a-b, Networks visualizing the functional protein association for gene signatures in Tau22 mice at 3 (a) and 11 (b) months of age. Nodes in the network represent proteins. Edges represent protein-protein interactions, which depending on the color indicate known or predicted interactions.