. 2020 Jun 29;9:e54875. doi: 10.7554/eLife.54875

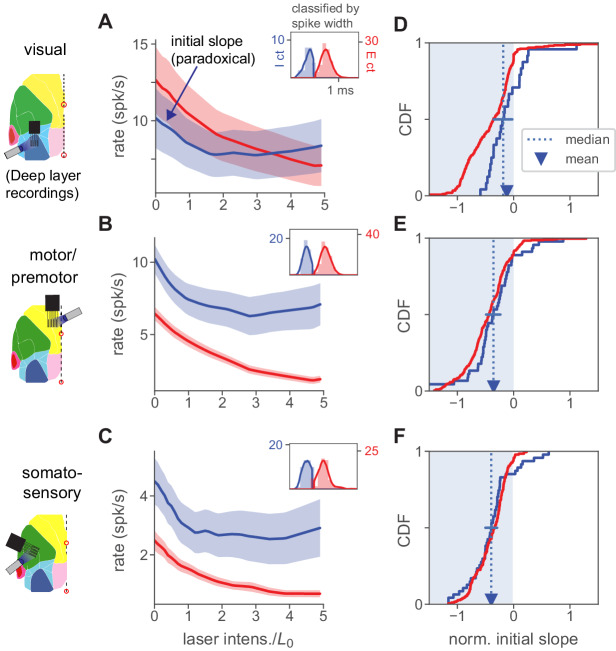
Figure 7. Paradoxical inhibitory suppression is also seen in deep-layer recordings.

(A) Population average responses of deep-layer (recorded ≥500 µm from cortical surface) units, classified as inhibitory (blue) or excitatory (red) by waveform width (inset; solid line is kernel density fit to underlying histogram, expressed in units of counts on they-axes, and spike width in ms on the x-axis, see Materials and methods). Shaded area shows ± 1 SEM about mean. L0 is defined for all units recorded in a single session based on responses to superficial-layer recordings. Initial slope of inhibitory average response is negative (paradoxical). (B,C) Same, for motor/premotor and somatosensory. (D–E) Initial slopes of all recorded units shown in A-C. Conventions as in Figure 2K. As in that panel, slopes here are normalized by baseline rate so that minimum slope is −1. Means and medians of individual inhibitory neurons’ slopes are all negative (t-test, V1 p<0.05, others p<0.01) except for V1 median (blue error bar shows 95% confidence interval around median via bootstrap: upper CI, V1 0.03, motor −0.22, somato −0.33). Also, the population firing rate decrease is significant for all three areas (p<0.001, except V1 p<0.05, Mann-Whitney U on summed population counts, baseline vs. rate at L0).

Figure 7.

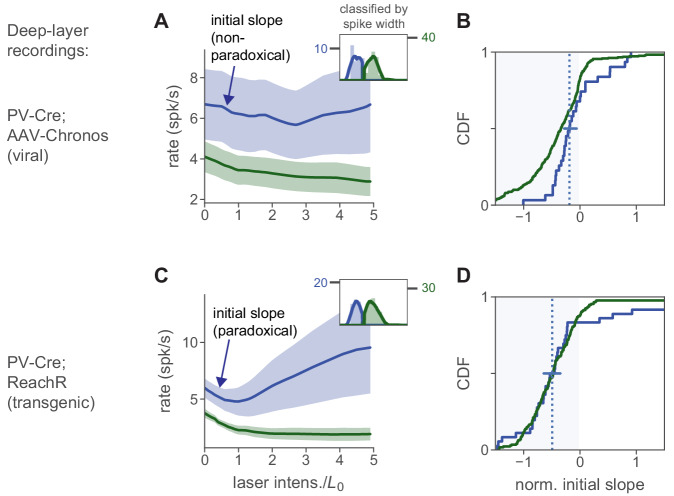
Figure 7—figure supplement 1. Effects of PV stim with viral vs. transgenic expression in deep-layer neurons is similar to effects in superficial layers.

Figure 7—figure supplement 1.

(A) Deep-layer (depth ≥500 µm) units from viral transfection experiments yield no mean paradoxical effect, as in superficial-layer recordings (Figure 7). (B) Initial slopes for all recorded units: both mean and median are negative (horizontal line, 95% CI for median via bootstrap). (C–D) Deep-layer units with transgenic expression do show a mean paradoxical effect. Conventions as in Figure 7; blue indicates inhibitory cells, and green indicates combined excitatory, non-PV, and PV non-transfected neurons. As in Figure 7, these neurons are classified by waveform width. In the transgenic line (C–D), paradoxical suppression is clear, but less strong in deep layers than in superficial layers (Figure 6), a pattern we also saw with stimulation of all inhibitory cells (Figure 2, Figure 5, Figure 7). Because PV-ReaChR was stimulated with red light, we expect more direct effects of stimulation in deeper layers than with blue-light VGAT-ChR2 stimulation (Figure 7), and indeed, here a greater number of inhibitory cells show paradoxical suppression (D) than in the VGAT-ChR2 deep layer recordings from V1 (Figure 7D). Note that because we stimulate PV neurons and not all inhibitory cells, the data in this figure is not diagnostic of ISN operation, but illustrates that PV stimulation can indeed produce paradoxical effects in inhibitory neurons in deep layers.