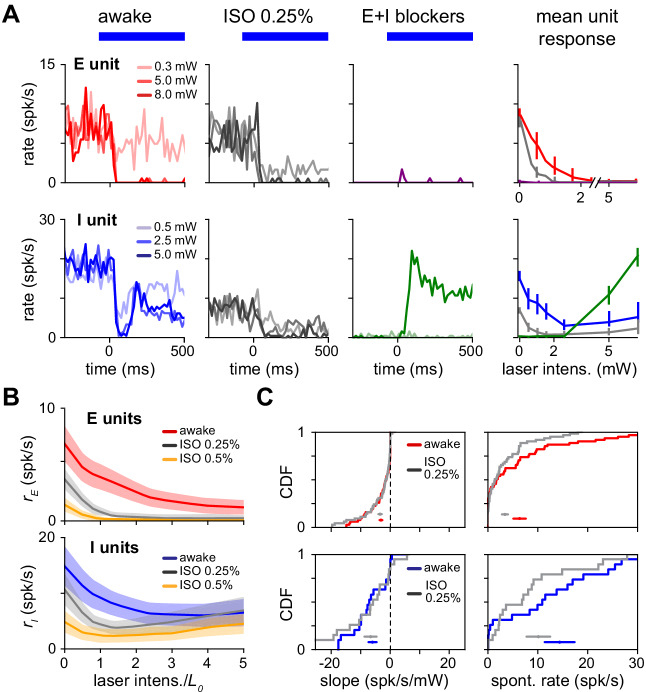
Figure 8. Paradoxical response is preserved with lower network activity due to anesthesia.
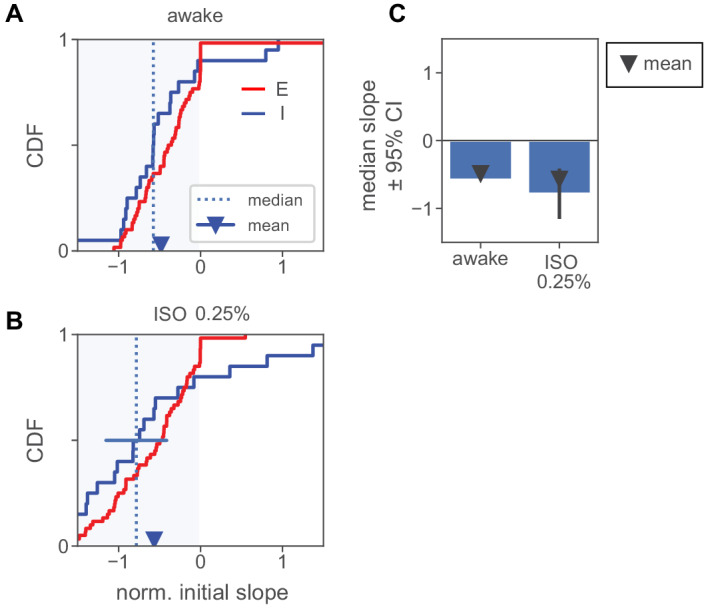
(A) Single excitatory (top) and inhibitory (bottom) unit response in the awake state (no anesthesia, no synaptic blockers), under anesthesia with no blockers (isoflurane, 0.25%) and with synaptic blockers (CNQX, APV, bicuculline; Materials and methods) plus anesthesia. (B) Population average response with (gray) and without (blue;red) anesthesia. Spontaneous firing rates are reduced for both the E (top) and I (bottom) populations below the awake firing rates, yet inhibitory paradoxical suppression is preserved with anesthesia (lower panel: gray line shows negative initial slope). In these experiments, inhibitory responses are weaker at high powers, but this does not affect paradoxical suppression. (C) Distribution of initial slope and spontaneous rate before and after anesthesia. Initial slope is largely preserved while excitatory and inhibitory spontaneous rates are suppressed. Colored horizontal bars within each panel show mean ± SEM for each distribution. Initial slopes are plotted here non-normalized (units spk/s/mW) to show the slopes are quantitatively similar across firing rate changes; normalized slopes are shown in Figure 8—figure supplement 1, and their means and medians remain negative across anesthesia state.
Figure 8—figure supplement 1. Normalized initial slopes for units recorded in anesthesia experiments.


