

Abstract
Myeloid cells comprise a major component of the tumor microenvironment (TME) that promotes tumor growth and immune evasion. By employing a small-molecule inhibitor of glutamine metabolism, not only were we able to inhibit tumor growth, but we markedly inhibited the generation and recruitment of myeloid-derived suppressor cells (MDSCs). Targeting tumor glutamine metabolism led to a decrease in CSF3 and hence recruitment of MDSCs as well as immunogenic cell death, leading to an increase in inflammatory tumor-associated macrophages (TAMs). Alternatively, inhibiting glutamine metabolism of the MDSCs themselves led to activation-induced cell death and conversion of MDSCs to inflammatory macrophages. Surprisingly, blocking glutamine metabolism also inhibited IDO expression of both the tumor and myeloid-derived cells, leading to a marked decrease in kynurenine levels. This in turn inhibited the development of metastasis and further enhanced antitumor immunity. Indeed, targeting glutamine metabolism rendered checkpoint blockade–resistant tumors susceptible to immunotherapy. Overall, our studies define an intimate interplay between the unique metabolism of tumors and the metabolism of suppressive immune cells.
Keywords: Immunology, Oncology
Keywords: Cancer immunotherapy, Innate immunity

Introduction
The prodigious growth of tumor cells demands specialized metabolic reprogramming. Tumor metabolism not only promotes growth but also creates a tumor microenvironment (TME) that inhibits immune effector function by depleting critical metabolites (such as tryptophan, glucose, and glutamine) and generating inhibitory metabolites (such as kynurenine). Alternatively, suppressive immune cells, which are metabolically distinct from effector cells, thrive in the TME (1–3). One of the most prominent immune cell types in the TME are suppressive macrophages.
Macrophages, which constitute a major component of tumors, are involved in cancer initiation, progression, angiogenesis, metastasis, and creating an immunosuppressive environment (4–7). Additionally, tumor-associated macrophages (TAMs) express metabolic enzymes like iNOS or arginase 1 (both enzymes that lead to arginine depletion) and IDO (an enzyme that leads to tryptophan depletion) that inhibits T cell activation and proliferation (8–11). TAMs also express PDL1 and PDL2, which interact with PD1 on T cells. These interactions trigger inhibitory immune checkpoint signals in the T cells (12).
In addition to TAMs, myeloid-derived suppressor cells (MDSCs) also play important roles in creating an immunosuppressive TME (13). In mice, MDSCs express Gr1 (Ly6C and Ly6G) and CD11b. These markers define 2 subsets of MDSCs, polymorphonuclear MDSCs (PMN-MDSCs, CD11b+Ly6CloLy6G+) and monocytic MDSCs (Mo-MDSCs, CD11b+Ly6ChiLy6G–). Although there are no distinct markers to distinguish between MDSCs and the tumor-associated neutrophils (TANs)/monocytes at different stages of maturity, they are both functionally immunosuppressive cells in the TME (14–16). Akin to TAMs, MDSCs also express enzymes that deplete key nutrients from T cells such as iNOS, arginase 1, PDL1/2, and SLC7A11 and secrete suppressive cytokines (17–19). Importantly, these cells do not highly express MHC and costimulatory molecules, which are essential for antigen presentation to, and activation of, cytotoxic T cells (20).
Glutamine metabolism as a whole is a crucial element of cancer cell metabolism. Glutamine is important for nucleotide synthesis, amino acid production, redox balance, glycosylation, extracellular matrix production, autophagy, and epigenetics (3, 21). In this report, we employed a small molecule — a prodrug of 6-diazo-5-oxo-L-norleucine (DON) (22) — to target glutamine metabolism. Our studies reveal that blocking glutamine metabolism markedly inhibits the generation and recruitment of MDSCs and promotes the generation of antitumor inflammatory TAMs. Mechanistically, we demonstrate a tumor-specific and myeloid cell–specific role for glutamine in promoting the immunosuppressive TME.
Results
Targeting glutamine metabolism inhibits tumor growth by altering suppressive myeloid cells in an immunotherapy-resistant model of triple-negative breast cancer.
The 4T1 triple-negative breast cancer model is resistant to checkpoint blockade and this lack of response is associated with a low frequency of mutations and an abundant presence of suppressive myeloid cells such as MDSCs, TAMs, and TANs (23). In agreement with previous reports, 4T1 tumors were resistant to treatment with anti-PD1, anti-CTLA4, or the combination of anti-PD1 and anti-CTLA4 (Figure 1, A and B).
Figure 1. Glutamine antagonism inhibits tumor growth and lung metastasis in an immune-dependent manner.

(A–F) 4T1 cells (1 × 10⁵) were implanted subcutaneously into the mammary fat pad of BALB/cJ female mice. On days 7, 10, 13, 17, and 24, mice were injected i.p. with 250 μg anti-PD1 and/or 100 μg anti-CTLA4 antibodies. 4T1 tumor–bearing mice were treated with vehicle (NT) or JHU083 (1 mg/kg) starting on day 7 after tumor inoculation. After 7 days of treatment, a lower dose (0.3 mg/kg) of JHU083 was used. (A) Tumor size was monitored (n = 5/group). (B) On day 17, tumor weight was measured. (C) The structure of the glutamine antagonist prodrug, JHU083. 6-Diazo-5-oxo-L-norleucine (DON) is depicted in black and its ethyl and 2-amino-4-methylpentanamido promoieties are depicted in blue and red, respectively. (D–F) Whole lungs were harvested, and spontaneous lung metastases were analyzed. (D and E) To quantify tumor nodules, on day 30, lungs were inflated with 15% India ink. (D) Representative picture of lungs. (E) Quantification of tumor nodules in lungs (n = 16–19/group, 3 experiments combined). (F) Representative histology sections stained with H&E. (G) 4T1 cells (1 × 10⁵) were implanted subcutaneously into the mammary fat pad in WT BALB/cJ, RAG1-KO, or NSG female mice. 4T1 tumor–bearing mice were treated with JHU083 (1 mg/kg) daily starting on day 7 after tumor inoculation. After 7 days of treatment, a lower dose (0.3 mg/kg) of JHU083 was used. Tumor burden and survival were assessed (n = 5/group). Data are representative of at least 3 independent experiments and are presented as the mean ± SD. NS, not significant. **P < 0.001; ****P < 0.001 by 2-way ANOVA with Tukey’s multiple-comparisons post hoc test (A), Kruskal-Wallis test with Dunn’s multiple-comparisons post hoc test (B), Mann-Whitney test (E), or log-rank (Mantel-Cox) test (G).
Glutamine is a critical anaplerotic substrate for anabolic growth that is necessary for the specialized Warburg metabolism that facilitates robust tumor growth (3, 21). Therefore, we employed a glutamine metabolism–inhibiting prodrug of DON, referred to as JHU083 (Figure 1C and ref. 22). 4T1 tumor–bearing mice were treated with JHU083 (1 mg/kg) for 7 days starting on day 7 after tumor inoculation followed by a lower dose (0.3 mg/kg) until the mice were sacrificed. We observed a marked decrease in the growth of the 4T1 tumors following treatment with the glutamine antagonist, JHU083, as compared with the vehicle-treated group (referred to as the NT group), anti-PD1–treated group, anti-CTLA4–treated group, or group treated with a combination of anti-PD1 and anti-CTLA4 (Figure 1, A and B). At this dosing regimen, treatment with the DON prodrug was well tolerated, as we did not observe any weight loss due to treatment with JHU083 (Supplemental Figure 1A; supplemental material available online with this article; https://doi.org/10.1172/JCI131859DS1).
In the 4T1 model, untreated mice begin to appear ill on day 30 due to metastasis to the lungs. Thus, we wondered whether treatment with the glutamine antagonist, in addition to inhibiting the growth of the primary tumor, might also be inhibiting metastasis. Strikingly, at this time point there was marked inhibition of lung metastasis in the treated mice (Figure 1, D–F). The ability of JHU083 to inhibit metastasis was also observed when we delivered tumor cells via tail vein injection (Supplemental Figure 1B).
To dissect the potential contribution of immune cells in inhibiting tumor growth and metastasis in the treated mice, we analyzed the efficacy of JHU083 in tumor-bearing, recombination-activating gene 1–KO (RAG1-KO) mice (lacking adaptive immunity with intact innate immunity) or nonobese diabetic severely combined immune-deficient IL-2 receptor γ-chain–null (NSG) mice (lacking adaptive immunity as well as defective innate immunity). JHU083 was able to inhibit tumor growth equally in the RAG1-KO mice and WT mice upon initial treatment (Figure 1G). However, with time, JHU083-treated RAG1-KO mice showed faster tumor growth compared with the treated WT mice. These data suggest that while the adaptive endogenous response to 4T1 is minimal (hence the lack of efficacy of checkpoint blockade), there is in fact some form of adaptive immunity in this model (Figure 1G). On the other hand, JHU083-treated NSG mice showed minimal therapeutic benefit when compared with JHU083-treated RAG1-KO and WT mice in the early and late phases of tumor growth (Figure 1G). While RAG1-KO mice eliminate the contribution of T and B cells, they still possess innate (macrophage- and NK cell–mediated) antitumor mechanisms as compared with NSG mice. To investigate the contribution of NK cells in this model, we depleted NK cells using an anti–asialo-GM1 depletion antibody in RAG1-KO mice. Although the depleting antibody rapidly decreased NK cells, we did not see any differences in tumor growth between JHU083-treated RAG1-KO mice and JHU083-treated RAG1-KO mice with NK cell depletion (Supplemental Figure 1C). Given the fact that NSG mice have defective macrophages and that macrophages are a major component of the TME compared with RAG1-KO mice, these data suggested to us that blocking glutamine metabolism might be inhibiting tumor growth (and metastasis) in part by regulating the myeloid immune response (Figure 1G and Supplemental Figure 1C).
Targeting glutamine metabolism inhibits the infiltration of MDSCs in both primary tumor and metastatic sites.
We wanted to test the hypothesis that targeting glutamine metabolism might not only directly arrest tumor growth but also mitigate the generation, recruitment, or reprogramming of suppressive myeloid cells. In light of the robust generation of MDSCs in the 4T1 model, we examined the effect of immune checkpoint blockade or glutamine antagonism on MDSCs. As expected, 4T1 tumor–bearing mice showed elevated MDSCs in the blood compared with tumor-free mice (Figure 2A). Treatment with immune checkpoint blockade had no impact on the recruitment of PMN-MDSCs and Mo-MDSCs in both the peripheral blood and the tumors (Figure 2, A and B).
Figure 2. Glutamine antagonism inhibits infiltration of MDSCs in both primary tumor and lung metastatic sites.

4T1 cells (1 × 10⁵) were implanted subcutaneously into the mammary fat pad of BALB/cJ female mice. On days 7, 10, 13, 17, and 24, mice were injected i.p. with 250 μg anti-PD1 and/or 100 μg anti-CTLA4 antibodies. 4T1 tumor–bearing mice were treated with JHU083 (1 mg/kg) starting on day 7 after tumor inoculation. After 7 days of treatment, a lower dose (0.3 mg/kg) of JHU083 was used (n = 5/group). (A) On day 17, percentages of PMN-MDSCs (CD11b+F4/80–Ly6CloLy6Ghi) and Mo-MDSCs (CD11b+F4/80–Ly6ChiLy6G–) of live cells from the blood were analyzed by flow cytometry (n = 5/group). (B) On day 14, tumors were harvested and tumor-infiltrating leukocytes (TIL) were analyzed by flow cytometry. The populations of PMN-MDSCs and Mo-MDSCs are shown. (C) Cell population numbers were counted and total cell numbers were divided by their respective tumor weights (mg). n = 5–10/group. (D) The number of TAMs (CD11b+F4/80+CD8–Ly6C–Ly6G–) per mg. (E) On day 14, lungs from subcutaneously injected 4T1 tumor–bearing mice were harvested. PMN-MDSCs and Mo-MDSCs among lung-infiltrating immune cells were counted. n = 3/group. Data are representative of at least 3 independent experiments and are presented as the mean ± SD. NS, not significant. *P < 0.05; **P < 0.01; ***P < 0.005; ****P < 0.001 by 1-way ANOVA with Tukey’s multiple-comparisons post hoc test (A, B, and E) or Mann-Whitney test (C and D).
On the other hand, the percentages of both PMN-MDSCs and Mo-MDSCs were markedly reduced among the tumor-infiltrating immune cells of JHU083-treated tumor-bearing mice compared with the control group in both the peripheral blood and the tumors (Figure 2, A and B). Concomitant with the reduction of the percentage of MDSCs within the tumors, we also observed a decrease in the absolute numbers of these cells in the treated versus the untreated mice (Figure 2C). Additionally, we tested the ability of glutamine antagonism to inhibit MDSCs in another immunotherapy-resistant tumor model, the Lewis lung carcinoma (3LL) model. Similarly to targeting glutamine metabolism in the 4T1 model, doing so in 3LL tumor–bearing mice led to improved control of tumor growth as well as a decrease in the percentage of MDSCs (Supplemental Figure 2, A and B). Overall, these findings demonstrate that targeting glutamine metabolism not only inhibits tumor growth but also leads to a decrease in MDSCs. However, importantly, the absolute number of TAMs per tumor weight did not change (Figure 2D). That is, treatment with JHU083 did not lead to a decrease in all myeloid cells within the TME, but rather led to the selective depletion of MDSCs.
MDSCs are believed to play a crucial role in facilitating metastasis (24, 25). Because we observed reduced metastasis in the lung with glutamine antagonism, we interrogated infiltration of MDSCs into the lungs from the JHU083-treated and untreated mice. Specifically, we interrogated the lungs on day 14, at a time point when there is no macroscopic evidence of metastasis in either the untreated or the treated mice. As in the primary tumors, we observed a marked decrease in the absolute numbers of MDSCs in the whole lung of JHU083-treated mice compared with untreated mice (Figure 2E). Therefore, the inhibition of glutamine metabolism blocks the generation and recruitment of MDSCs within the primary TMEs as well as at sites of metastasis, thus markedly inhibiting the development of metastatic foci.
Targeting glutamine metabolism inhibits MDSCs by increasing cell death and decreasing tumor CSF3 expression.
To understand the effects of glutamine metabolism on the decrease in MDSCs, we evaluated the direct effect of glutamine antagonism on MDSCs. When we treated MDSCs with DON (the active form of JHU083) in vitro, we observed an increase in apoptosis as defined by active caspase-3 (Figure 3A). Next, we evaluated the induction of MDSC apoptosis in vivo. To minimize the possibility that differences in tumor size itself affect MDSC numbers, we treated mice with JHU083 for a short duration after the tumors were fully established (17 days after tumor inoculation). Consistent with our in vitro finding, we also observed significantly increased active caspase-3 on both PMN-MDSCs and Mo-MDSCs within 33 hours after JHU083 treatment in the blood (Figure 3B). Thus, these data suggest that glutamine antagonism directly affects apoptosis of MDSCs in the blood. Surprisingly, however, within 7 hours of treatment we observed markedly decreased tumor-infiltrating MDSCs (Figure 3C). This finding led us to hypothesize that in addition to inducing apoptosis in MDSCs, blocking glutamine metabolism might affect the recruitment of MDSCs.
Figure 3. Glutamine antagonism reduces MDSCs by increasing cell death and inhibiting tumor CSF3 secretion.

(A) MDSCs from 4T1 tumor–bearing mice were treated with DON (1 μM) for 24 hours, and the active caspase-3 level was analyzed by immunoblot. Actin was used as loading control. (B–D) 4T1 tumor–bearing mice were treated with JHU083 (1 mg/kg) starting on day 14 after tumor inoculation. (B) After 7 hours of the first treatment and following every daily treatment, active caspase-3 on PMN-MDSCs and Mo-MDSCs from blood was analyzed by flow cytometry at the indicated time points (n = 5/group). (C) Cell numbers and percentages of MDSCs from tumor-infiltrating leukocytes (TIL) were counted and analyzed by flow cytometry (n = 5/group). (D) Serum (n = 16/group) and tumors (n = 4/group) were collected from 4T1 tumor–bearing mice and CSF3 was measured by ELISA (top). After 6 hours of treatment with or without DON (1 μM), Csf3 mRNA levels were measured in 4T1 cells (bottom left) (n = 3 technical replicates). Csf3 mRNA levels were measured from in vivo 4T1 tumor lysates by q-PCR (n = 5 mice) (bottom right). (E) Percentages of PMN-MDSCs and Mo-MDSCs from empty vector (EV) 4T1 or CSF3-overexpressing (OE) 4T1 tumor–bearing mice were analyzed by flow cytometry. (F) C/EBPβ levels were measured by immunoblotting of GFP+ sorted tumor cells from 4T1 tumor–bearing mice (left) and 4T1 tumor cells with or without DON (1 μM) treated for 24 hours (right). (G) PMN-MDSCs and Mo-MDSCs from EV 4T1 or C/EBPβ-OE 4T1 tumor–bearing mice were analyzed by flow cytometry. Data are representative of at least 2 (E–G) or 3 (A–D) independent experiments and are presented as the mean ± SD. NS, not significant. *P < 0.05; **P < 0.01; ***P < 0.005; ****P < 0.001 by 2-way ANOVA with post hoc multiple t tests (B, C, E, and G) or unpaired t test (D).
In this regard, several studies have demonstrated that increased secretion of growth factors such as CSF1 (M-CSF), CSF2 (GM-CSF), and CSF3 (G-CSF) promotes the recruitment of MDSCs to the TME (26). As such, we wanted to determine if targeting glutamine metabolism inhibited MDSCs in the TME in part by limiting the elaboration of these critical growth factors. Indeed, we observed markedly decreased CSF1, CSF2, and CSF3 levels in DON-treated 4T1 tumor culture supernatants (Supplemental Figure 3, A–C). To confirm this finding with an in vivo model, we measured CSF1, CSF2, and CSF3 in the serum of 4T1 tumor–bearing mice treated with or without JHU083. Compared with the vehicle-treated group, the glutamine antagonist–treated mice demonstrated reduced CSF3 in circulating serum and within tumor lysates (Figure 3D). However, CSF1 and CSF2 were undetectable in circulating serum (data not shown). To test the role of CSF3 in the recruitment of MDSCs in this model, we implanted CSF3-overexpressing (CSF3-OE) 4T1 tumors (Supplemental Figure 3C). Consistent with previous reports (27–29), mice implanted with CSF3-OE 4T1 tumors recruited more PMN-MDSCs compared with the empty vector (EV) 4T1 tumor–implanted mice (Figure 3E). This indicates that CSF3 is a critical factor for the recruitment of PMN-MDSCs in 4T1 tumors. Additionally, glutamine antagonism reduces MDSCs in both EV and CSF3-OE 4T1–implanted mice (Figure 3E). Furthermore, in vitro DON-treated 4T1 cells and in vivo whole-tumor lysate showed reduced Csf3 mRNA expression (Figure 3D). Such findings support the notion that one mechanism by which glutamine antagonism leads to a decrease in MDSCs within the TME is through inhibiting the transcriptional expression of CSF3 in tumor cells.
To dissect the mechanism of transcriptional regulation of CSF3 in tumor cells, we evaluated the expression of C/EBPβ (LAP), a well-described transcription factor that promotes CSF3 expression (27–29). Indeed, the expression of C/EBPβ was reduced in JHU083-treated 4T1 tumor lysates and in DON-treated in vitro 4T1 cells (Figure 3F). To confirm the role of C/EBPβ in the recruitment of PMN-MDSCs in this model, we implanted mice with C/EBPβ-OE 4T1 tumors (Supplemental Figure 3D). Similar to the CSF3-OE tumor–bearing mice, C/EBPβ-OE tumors recruited more PMN-MDSCs compared with EV tumor–bearing mice (Figure 3G). Also, glutamine antagonism inhibited MDSC recruitment in both EV and C/EBPβ-OE 4T1 tumor–bearing mice (Figure 3G). Thus, these data suggest that glutamine metabolism is important for the maintenance of C/EBPβ, which is crucial for CSF3 expression that promotes PMN-MDSC recruitment.
Overall, our data thus far demonstrate that targeting glutamine metabolism, in addition to inhibiting tumor growth, has a robust effect on inhibiting MDSCs in immunotherapy-resistant tumors. Mechanistically, this is through 2 distinct effects: (a) direct effects on MDSC-promoting caspase-3–dependent cell death, and (b) effects on the tumor with reduction of CSF3 by inhibiting C/EBPβ transcription factor activity.
Targeting glutamine metabolism promotes the reprogramming of TAMs.
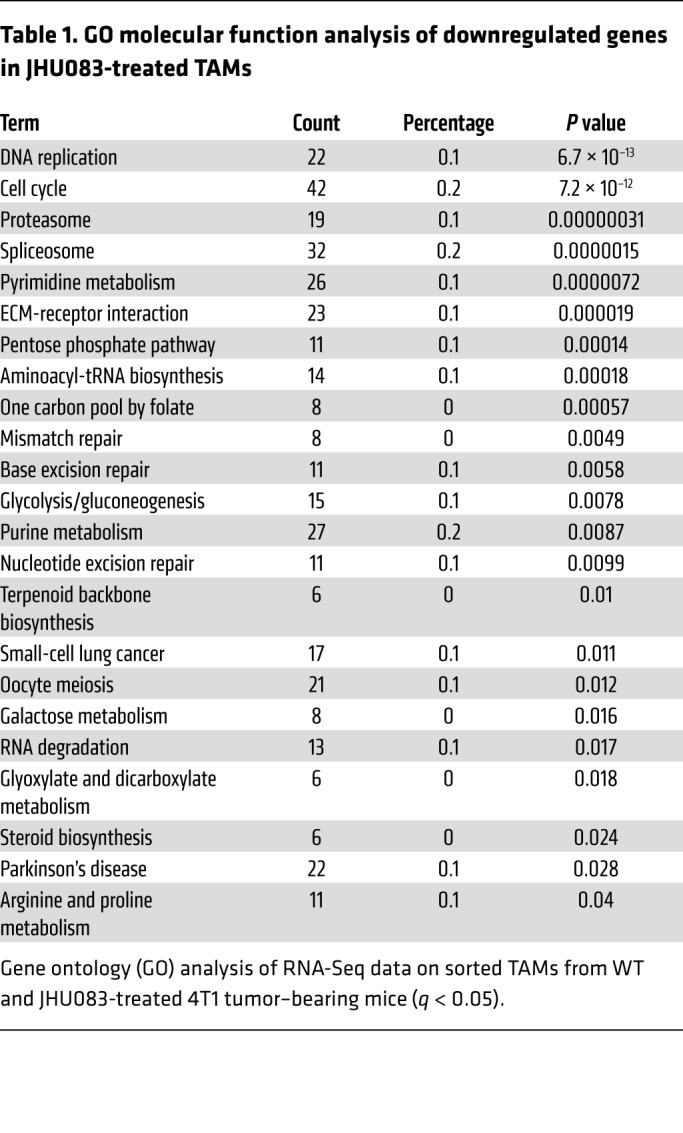
Although targeting glutamine metabolism inhibited the recruitment of Mo-MDSCs and PMN-MDSCs to the tumor, it did not completely inhibit myeloid cells. Recall, we did not observe significant differences in the amount of TAMs within the tumors from JHU083-treated and untreated mice (Figure 2D and Figure 4A). Thus, we were interested in understanding the effect of JHU083 on the phenotype and function of the TAMs. To this end, we performed RNA-Seq on sorted TAMs from vehicle- and JHU083-treated 4T1 tumor–bearing mice. More than 3000 mRNA transcripts were significantly differentially expressed (Figure 4B). As expected, we found significantly downregulated genes between TAMs from vehicle- and JHU083-treated mice within glutamine-related pathways, such as DNA replication, cell cycle, pyrimidine metabolism, pentose phosphate pathway, glycolysis, purine metabolism, and arginine and proline metabolism (Table 1).
Figure 4. Glutamine antagonism induces reprogramming of TAMs from a suppressive to a proinflammatory phenotype.

(A) Percentages of TAMs from vehicle- or JHU083-treated 4T1 tumor–bearing mice (on day 17). (B) Volcano plot showing significant changes in gene expression (red) from RNA-Seq analysis on NT and JHU083-treated TAMs (CD11b+F4/80+7AAD–Ly6C–Ly6G–CD8–) from 4T1 tumor–bearing mice (on day 14). q < 0.05. (C) Gene set enrichment analysis (GSEA) plot of phagocytic vesicle and pattern recognition receptor signaling activity–related genes in NT versus JHU083 on TAMs. Enrichment scores in the gene set are shown. (D) Normalized gene expression from RNA-Seq analysis of NT (black) and JHU083-treated (red) TAMs from 4T1 tumor–bearing mice (on day 17). All differences in gene expression are significant (q < 0.05). (E) Representative histograms and summary graphs of TLR4, MHCII, CD86, CD80, and iNOS expression on TAMs. (F) Tumor-infiltrating leukocytes were harvested on day 17 from 4T1 tumor–bearing mice treated with or without JHU083. Cells were incubated with GolgiPlug in the presence or absence of LPS for 9 hours ex vivo. Percentages of TNF+ cells were analyzed by flow cytometry (left). Geometric mean fluorescence intensity (gMFI) of TNF from TNF+ cells (right). (G) Correlation of the percentage TNF-secreting TAMs after stimulation with respect to tumor weight (left). 4T1 tumor–bearing mice were treated with JHU083 every day and i.p. injected with isotype antibody or 100 μg anti-TNF antibody (depleting) twice per week starting on day 7 after tumor inoculation (right). Data are from 1 experiment with 5 mice per group (A–D) or from 3 independent experiments with 5 to 10 mice per group (E–G) and are presented as the mean ± SD. NS, not significant. *P < 0.05; ****P < 0.001 by Mann-Whitney test (A), unpaired t test (E), 1-way ANOVA with Tukey’s multiple-comparisons post hoc test (F), Spearman’s correlation (G, left), or 2-way ANOVA with Sidak’s multiple-comparisons test (G, right).
Table 1. GO molecular function analysis of downregulated genes in JHU083-treated TAMs.
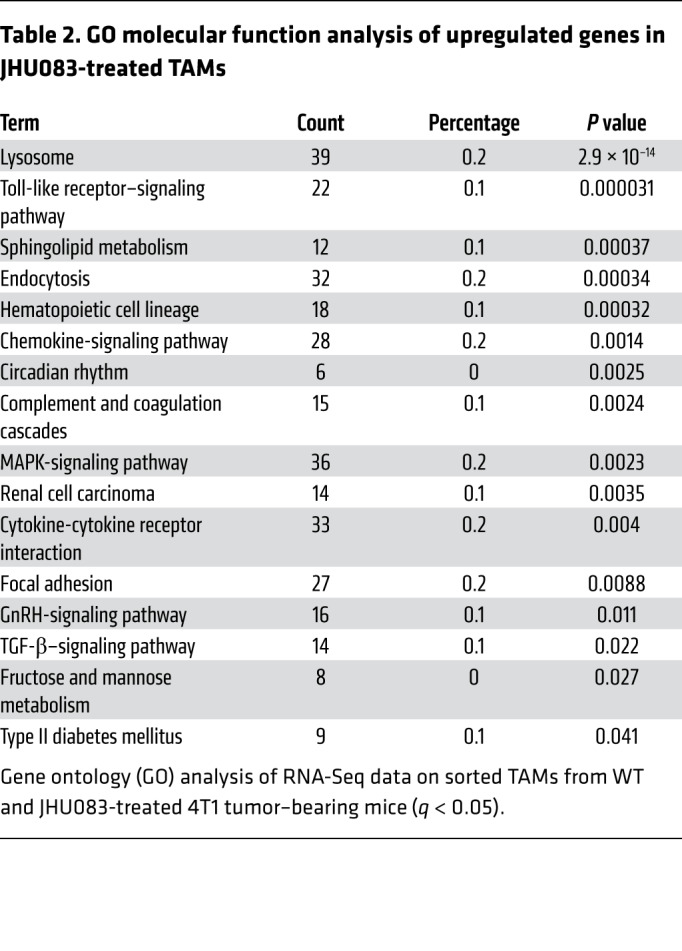
Notably, by evaluating the GO pathway analysis for biological processes, we found that lysosome- and Toll-like receptor (TLR) signaling–related genes were significantly upregulated with drug treatment between TAMs isolated from tumors of JHU083-treated and untreated mice (Table 2). Furthermore, using gene set enrichment analysis (GSEA), we found an upregulation of phagocytic vesicles and pattern recognition receptor signaling activity–related genes in TAMs from the treated mice (Figure 4C). Specifically, the expression of genes encoding TNF, TLR4, CD80, and CD86 molecules related to a proinflammatory phenotype were increased, while Il10 and Nos2 gene expression, which are known to inhibit antitumor T cell responses, were decreased (Figure 4D).
Table 2. GO molecular function analysis of upregulated genes in JHU083-treated TAMs.
To confirm our RNA-Seq data, we performed flow cytometry to phenotype the TAMs within the TME in 4T1 tumor–bearing mice. We observed increased surface TLR4, MHCII, CD80, and CD86 and reduced iNOS on TAMs from the JHU083-treated mice (Figure 4E). Overall, our findings demonstrate that targeting glutamine metabolism promotes a proinflammatory phenotype among TAMs.
Multiple recent studies have demonstrated that proinflammatory TAMs inhibit tumor growth (30, 31). Our RNA-Seq data of TAMs from JHU083-treated mice demonstrated an increase in the proinflammatory cytokine, Tnf. In agreement with our RNA-Seq data, we also observed increased TNF protein production in TAMs from JHU083-treated mice (Figure 4F). After in vitro LPS stimulation for 9 hours, further enhancement of TNF production was also observed in TAMs from JHU083-treated mice compared with TAMs from vehicle-treated mice (Figure 4F). Furthermore, there was a negative linear correlation between TNF production and tumor weight, thereby suggesting proinflammatory macrophages regulate tumor progression (Figure 4G). Additionally, depletion of TNF abrogated in part the JHU083-mediated antitumor effects (Figure 4G).
A previous report demonstrated that glutamine deprivation further induces M1 polarization mediated by increased NF-κB signaling (32). To confirm this finding, we treated bone marrow–derived macrophages (BMDMs) with varying doses of DON during LPS stimulation. After 24 hours, we observed increased TNF secretion in DON-treated BMDMs along with increased NF-κB nuclear localization (Supplemental Figure 4A). On the other hand, we observed decreased IL-10 secretion and phosphorylation of STAT3 (Supplemental Figure 4B). Thus, this finding suggests that glutamine inhibition enhances a proinflammatory macrophage phenotype that might be due to increased NF-κB and reduced STAT3 signaling.
Targeting glutamine metabolism promotes the conversion of MDSCs to proinflammatory TAMs.
Given the observation that glutamine antagonism promotes the reprogramming of TAMs (Figure 4, C–F), we hypothesized that the recruited MDSCs in the tumor might also be converted into proinflammatory macrophages. To this end, isolated MDSCs from the blood of CD45.1 4T1 tumor–bearing mice (21 days after 4T1 tumor inoculation) were adoptively transferred into CD45.2 4T1 tumor–bearing mice (7 days after 4T1 tumor inoculation). The MDSC-recipient CD45.2 4T1 tumor–bearing mice were treated with JHU083 for 7 days, and then tumors were harvested (Figure 5A). As seen in Figure 4F, we observed increased TNF secretion from endogenous TAMs (CD45.2+ cells) in JHU083-treated mice with LPS stimulation (Figure 5B). More strikingly, we found significantly increased TNF production from the adoptively transferred CD45.1+ cells in tumors from JHU083-treated CD45.2 4T1 tumor–bearing mice (Figure 5B). Additionally, we observed increased activation markers such as MHCII, CD80, and CD86 on the transferred CD45.1+ cells in the JHU083-treated mice (Figure 5C). These observations support a model whereby glutamine antagonism enhances proinflammatory TAM differentiation not only just in TAMs but also in converted TAMs from MDSCs, as shown by the adoptive transfer experiments.
Figure 5. Glutamine antagonism induces differentiation of MDSCs from a suppressive to a proinflammatory phenotype.

Isolated MDSCs in blood from CD45.1 4T1 tumor–bearing mice (21 days after 4T1 tumor inoculation) were adoptively transferred into CD45.2 4T1 tumor–bearing mice (7 days after 4T1 tumor inoculation). Then, MDSC-recipient CD45.2 4T1 tumor–bearing mice were treated with JHU083 until tumors were harvested on day 7. (A) Schematic of the experiment. (B) Cells were incubated with GolgiPlug in the presence or absence of LPS for 9 hours ex vivo. Percentages of TNF+CD45.2+ cells (endogenous, left) and TNF+CD45.1+ cells (adoptively transferred, right) were analyzed by flow cytometry. (C) Summary graphs of MHCII, CD86, and CD80 geometric mean fluorescence intensity (gMFI). Data are from 3 independent experiment with 5 to 10 mice per group (B and C) and are presented as the mean ± SD. *P < 0.05, **P < 0.01, ***P < 0.005, ****P < 0.001 by 1-way ANOVA with Tukey’s multiple-comparisons post hoc test (B) or unpaired t test (C).
The glutamine antagonist JHU083 enhances immunogenic tumor cell death and antigen presentation of TAMs.
Although we observed intrinsic enhancement of proinflammatory macrophage phenotypes with glutamine inhibition upon LPS stimulation, it was unclear how TAMs were activated in the TME with glutamine antagonist treatment without LPS stimulation (Figure 4, E and F, and Figure 5, B and C). Previous reports have shown that immunogenic tumor cell death (ICD) induces TLR signaling in TAMs through the release of danger-associated molecular patterns (DAMPs) (33). Increased endoplasmic reticulum stress and reactive oxygen species (ROS) production are important mediators in inducing ICD (34). Thus, we investigated the ability of JHU083 to promote a proinflammatory TME by inducing ICD. Indeed, treatment of 4T1 cells with DON led to an increase in ROS and active caspase-3 in vitro (Figure 6, A and B). In addition, targeting glutamine metabolism of 4T1 tumor cells both in vitro and in vivo led to an increase in surface exposure of calreticulin, an endoplasmic reticulum protein and a DAMP (Figure 6C). To explore this concept further, we cultured BMDMs in conditioned media from DON-treated tumor cell supernatants. Increased p-NF-κB (Ser536) (TLR downstream signaling) and LAMP2 (lysosome marker) were observed in BMDMs cultured in DON-treated tumor–conditioned media compared with vehicle-treated tumor–conditioned media (Figure 6D). This result suggests that tumor cell death induces macrophage activation mediated by downstream TLR signaling and lysosome function, which correlated with the RNA-Seq data (Table 2).
Figure 6. Glutamine antagonism increases immunogenic cell death and antigen presentation to T cells.

(A–C) 4T1 tumor cells were cultured with or without DON (0, 0.5, 1, 5, 10, or 50 μM) for 24 hours. (A) Cells were harvested and stained with CellROX (ROS measurement) and analyzed by flow cytometry. Representative histogram (left) and summary graph (right). (B) Cells were lysed and active caspase-3 was analyzed by immunoblot. (C) Cells were stained for calreticulin and analyzed by flow cytometry. Percentages of surface calreticulin+ in vitro 4T1 cells are shown (left). Summary graph of surface calreticulin gMFI on GFP+ gated in vivo tumor cells (right). (D) 3LL cells were cultured with or without DON (0.5 or 1 μM). After 1 hour of incubation, cells were washed and replaced with drug-free media. After 24 hours, supernatants were harvested and used as conditioned media (CM). BMDMs were cultured in the presence of these conditioned media for 24 hours. Phospho-NF-κB (Ser536) and LAMP2 were measured by immunoblot. (E–G) BMDMs (3 × 10⁵) and 5 × 10⁴ B16-OVA tumor cells were cocultured with or without DON (1 or 5 μM). After 24 hours of incubation, supernatants were discarded and 3 × 10⁵ eFluor 450–labeled naive CD8+ T cells from OTI mice were added. (E) Schematic of the experiment. (F) Representative flow plot (left) and percentages of divided cells (right) from CD8+ T cells were analyzed by flow cytometry. (G) BMDMs from WT, MyD88/TRIF double KO (DKO), or TFEB-KO mice and B16-OVA tumor cells were cocultured using the same method as in E, and a histogram of the dilution of eFluor 450–labeled CD8+ T cells is shown. Data are representative of at least 3 independent experiments and are presented as the mean ± SD. *P < 0.05; **P < 0.01; ****P < 0.001 by 1-way ANOVA with Tukey’s multiple-comparisons post hoc test (A; C, left; and F) or Mann-Whitney test (C, right).
Next, we tested whether the increased NF-κB signaling and lysosome function induced by ICD indeed increased antigen presentation to T cells. To test this idea, BMDMs were cocultured with B16 OVA melanoma tumor cells with various doses of DON for 24 hours. After removing and washing away the media, cell proliferation dye–labeled naive CD8+ T cells from OTI mice were cocultured with the BMDMs and tumor cells (Figure 6E). Next, the OVA-specific cytotoxic T cell populations were analyzed by flow cytometry. We observed that the cocultured cells with DON showed increased OVA-specific T cell proliferation when compared with the vehicle-treated group (Figure 6F). This finding also held true using an MC38 OVA tumor model (Supplemental Figure 5A). When we added DON to the macrophages before the coculture, we did not observe proliferating CD8+ T cells despite increased MHCII expression with glutamine inhibitor treatment (Supplemental Figure 5B). This finding demonstrates that macrophages require danger signals to trigger proper antigen presentation to T cells. On the other hand, when we added DON to the tumor cells before the coculture, we observed increased proliferating CD8+ T cells (Supplemental Figure 5B). However, it was less effective compared with the coculture of macrophages and tumor cells with DON treatment. Thus, we observed a synergistic effect between ICD and enhanced activation of macrophages by glutamine inhibition (Supplemental Figure 5B). Furthermore, when we cocultured T cells with BMDMs from mice deficient in MyD88/TRIF (downstream of TLR signaling) or TFEB (key regulator of lysosomal biogenesis), there was diminished T cell proliferation (Figure 6G). Thus, DON-induced tumor cell death enhances antigen presentation (as determined by T cell proliferation) in a MyD88/TRIF signaling– and lysosome-dependent fashion.
The glutamine antagonist JHU083 enhances cross-presentation by TAMs.
To dissect whether this enhanced cross-presentation to CD8+ T cells by BMDMs with JHU083 treatment is mediated by macrophages or by some differentiated inflammatory dendritic cells (DCs) from BMDMs, we performed the same in vitro experiment on Batf3-KO BMDMs that have cross-presenting–deficient DCs. Like WT BMDMs, Batf3-KO BMDMs equally showed enhanced cross-presentation with DON treatment (Figure 7A). These data suggest that macrophages can cross-present tumor antigens to CD8+ T cells when they are cocultured with glutamine antagonist–treated tumor cells.
Figure 7. Glutamine antagonism increases tumor antigen cross-presentation to T cells by macrophages.

(A) WT (3 × 10⁵) or Batf3-KO BMDMs (3 × 10⁵) and 5 × 10⁴ B16-OVA tumor cells were cocultured in the presence or absence of 1 μM DON. After 24 hours of incubation, supernatants were discarded and 3 × 10⁵ eFluor 450–labeled naive CD8+ T cells from OTI mice were added. Histogram of divided cells from CD8+ T cells analyzed by flow cytometry. (B and C) MC38 cells (5 × 10⁵) were implanted subcutaneously into the flank of WT C57BL/6J mice or Batf3-KO mice. MC38 tumor–bearing mice were treated with JHU083 (0.3 mg/kg) daily starting on day 14 after tumor inoculation. (B) On day 21, tumor weight was recorded (left), and percentage change in tumor volume was calculated (right). (C) On day 21, tumors were harvested and CD8+ T cells were analyzed by flow cytometry. Data are representative of 3 independent experiments and are presented as the mean ± SD. *P < 0.05; **P < 0.01; ***P < 0.005; ****P < 0.001 by 1-way ANOVA with Tukey’s multiple-comparisons post hoc test (B) or unpaired t test (C).
In an in vivo setting, as expected, MC38 tumors grew faster in Batf3-KO mice compared with WT mice (Figure 7B). Nevertheless, JHU083 treatment still led to a reduction in tumor size in Batf3-KO mice, indicating cross-presentation can still occur independently of fully functional cross-presenting DCs (Figure 7B). Additionally, in agreement with our recent report (35), the percentage of tumor-infiltrating CD8+ T cells from JHU083-treated WT mice was increased within the tumor, and these cells demonstrated enhanced activation and cytotoxic markers (CD44 and granzyme B) and the proliferation marker Ki67 (Figure 7C). Although there was a significant decrease in the CD8+ T cells in Batf3-KO mice, JHU083 treatment could still increase the percentage and enhance the phenotype of CD8+ T cells in the KO mice (Figure 7C). That is, even in the absence of cross-presenting DCs, JHU083 promoted the CD8+ T cell antitumor response.
The glutamine antagonist JHU083 enhances the efficacy of immune-checkpoint blockade in immunotherapy-resistant tumors.
Our studies demonstrate that targeting glutamine metabolism boosts immune responses by reprogramming tumor metabolism, enhancing a proinflammatory phenotype of TAMs, reducing MDSCs, and promoting ICD. Furthermore, we observed an increase in the tumor-infiltrating CD8+ T cells, and an enhanced ratio of CD8+ T cells to MDSCs from JHU083-treated 4T1 tumor–bearing mice compared with the control group (Figure 8A). More importantly, we also observed an increase in the CD8+ T cell/MDSC ratios and percentages of CD8+ T cells in the lungs of the treated versus untreated mice, suggesting enhanced antitumor immunity by glutamine metabolism inhibition in both primary tumor and metastatic sites (Figure 8A). Thus, we were interested in determining if blocking tumor glutamine metabolism could enhance the efficacy of the checkpoint blockade. First, we tested this hypothesis on a checkpoint blockade–sensitive tumor. We assessed the ability of JHU083 to inhibit the growth of EO771, which is similar to 4T1 triple-negative breast cancer and is moderately sensitive to immunotherapy in the form of anti-PD1 monotherapy (31). We observed marked inhibition of tumor growth and enhanced survival with JHU083 treatment alone (Supplemental Figure 6, A and B). Notably, the combination of JHU083 plus anti-PD1 or JHU083 plus anti-PD1 plus anti-CTLA4 resulted in greater inhibition of tumor growth and enhanced survival, suggesting an additive effect of combining metabolic therapy with checkpoint blockade (Supplemental Figure 6, A and B). Thus, in this sensitive tumor model of checkpoint blockade, glutamine antagonism serves to enhance the efficacy of immunotherapy.
Figure 8. Glutamine antagonism enhances the efficacy of immune-checkpoint blockade in immunotherapy-resistant tumors.

(A) Percentages of CD8+ T cells and ratio of CD8+ T cells to MDSCs from tumor and lung from subcutaneously injected 4T1 tumor–bearing mice were analyzed by flow cytometry (n = 5–10/group). TIL, tumor-infiltrating leukocytes. (B and C) 4T1 tumor–bearing mice were treated with vehicle or JHU083 alone, or vehicle or JHU083 in combination with 250 μg anti-PD1 and 100 μg of anti-CTLA4 antibodies (on days 7, 10, 13, 17, and 24). (B) Tumor sizes and (C) survival curves were recorded. (D) Proposed model. Data are representative of 3 independent experiments and are presented as the mean ± SD. *P < 0.05; **P < 0.01; ***P < 0.005 by Mann-Whitney t test (A) or log-rank (Mantel-Cox) test (C).
Next, we evaluated whether JHU083 can enhance the efficacy of checkpoint blockade in the 4T1 tumor model. Recall that 4T1 tumor cells are extremely resistant to immunotherapy in the form of checkpoint blockade (Figure 1, A and B). To this end, mice were injected with 4T1 tumors and treated on day 7 after injection with vehicle, JHU083 alone, anti-PD1 plus anti-CTLA4, or JHU083 plus anti-PD1 plus anti-CTLA4. The mice treated with anti-CTLA4 plus anti-PD1 had no therapeutic benefit compared with the vehicle-treated group as seen in Figure 1, A and B (Figure 8, B and C). The JHU083-treated group displayed delayed tumor growth and an increase in survival (Figure 8, B and C). When mice were treated with JHU083, anti-PD1, and anti-CTLA4, we observed further attenuation of tumor growth and an increase in overall survival compared with the JHU083 monotherapy group (Figure 8, B and C).
Taken together, these data demonstrate that glutamine inhibition induces ICD of tumor cells by increasing ROS, which leads to an increase in MyD88/TRIF-dependent signaling, lysosomal function, and antigen presentation in TAMs, and subsequently enhanced tumor-specific effector T cell response. Furthermore, by altering the TME, glutamine inhibition can enhance the efficacy of checkpoint blockade even in tumors that are resistant to immunotherapy (Figure 8D).
Targeting glutamine metabolism reshapes the metabolism of the tumor.
Our data demonstrate the direct effects of targeting glutamine metabolism on tumor and suppressive myeloid cells. However, inhibition of glutamine metabolism can also affect the TME itself that can alter the infiltration and function of immune cells. Thus, we hypothesized that blocking glutamine metabolism would not only inhibit tumor growth but also alter the metabolic milieu of the TME. To this end, we performed targeted metabolomics using liquid chromatography–tandem mass spectrometry (LC-MS) on equal-weighted 4T1 tumors from vehicle- and JHU083-treated mice to assess the effects of glutamine inhibition on cell metabolism. Metabolomics analysis with LC-MS revealed 2 distinct metabolic clusters, which correlated to the 2 experimental groups (Figure 9, A and B). As expected, glutamine inhibition caused reduced TCA cycle intermediates and less conversion of glutamine to glutamate, resulting in an increased glutamine/glutamate ratio, implying glutaminase (GLS) inhibition (Supplemental Figure 7A). In addition, we also observed significant changes in citrulline, N-carbamoyl-L-aspartate, thymine, S-adenosyl-L-methionine, homoserine, guanosine, nicotinamide ribotide, hydroxyproline, succinate, cystathionine, aspartate, uridine, acetyl-L-lysine, and dimethyl-L-arginine (Figure 9, B and C, and Supplemental Figure 7B). Using pathway enrichment analysis, we found significant differences between the metabolites in tumors from vehicle- and JHU083-treated mice, such as in glycine and serine metabolism, phosphatidylcholine biosynthesis, methionine metabolism, urea cycle, glutamate metabolism, ammonia recycling, amino sugar metabolism, and arginine and proline metabolism pathways (Supplemental Figure 7C).
Figure 9. Glutamine antagonism alters metabolism of primary tumor and metastatic sites in glutamine-dependent and -independent pathways.

4T1 cells (1 × 10⁵) were implanted subcutaneously into mammary fat pads of BALB/cJ female mice. 4T1 tumor–bearing mice were treated with JHU083 (1 mg/kg) starting on day 7 after tumor inoculation. After 7 days of treatment, a lower dose (0.3 mg/kg) of JHU083 was used. On day 17, tumors were harvested, and equal masses of tumor samples were analyzed by LC-MS. (A) Principal component (PC) analysis between NT (vehicle treated, green) and JHU083-treated (pink) groups. (B) Heatmap visualization of the metabolite changes between NT (green) and JHU083-treated (red) groups. (C) A volcano plot of metabolites is shown: log2 fold change versus –log10 (FDR-corrected P value), with pink representing significant metabolite changes. Data are from 1 experiment with 4 to 5 mice per group. Statistical significance was analyzed by t test (B and C).
Targeting glutamine metabolism alters the metabolism of the tumor and the site of metastasis in both glutamine-dependent and -independent pathways.
Because targeting glutamine metabolism reduced MDSC recruitment in the lungs before visible metastasis occurs (Figure 2E), we wanted to know whether the metabolic milieu of the TME at the lung metastatic site also plays a critical role in facilitating metastasis. To this end, we also performed metabolomics on the lungs from the JHU083-treated and untreated mice on day 17, before visible metastasis occurs, to understand the possible metabolic changes related to the development of metastasis. Similar to the primary tumors, LC-MS analysis of the lungs revealed 2 distinct metabolic clusters (Figure 10, A and B). That is, despite a lack of macroscopic metastasis in the lungs on day 17, we observed significant metabolic changes (Figure 10B and Supplemental Figure 8). These data suggest that blocking glutamine metabolism would not only alter the metabolic milieu of the TME but also change the metabolism of the metastatic site.
Figure 10. Glutamine antagonism alters metabolism of metastatic sites in glutamine-dependent and -independent pathways.

4T1 cells (1 × 10⁵) were implanted subcutaneously into mammary fat pads of BALB/cJ female mice. 4T1 tumor–bearing mice were treated with JHU083 (1 mg/kg) starting on day 7 after tumor inoculation. After 7 days of treatment, a lower dose (0.3 mg/kg) of JHU083 was used. On day 17, whole lungs from mice were harvested, and whole lung lysates were analyzed by LC-MS. (A) Principal component (PC) analysis between the vehicle-treated (NT) (green) and JHU083-treated (pink) lungs and (B) heatmap visualization of the metabolite changes between NT (green) and JHU083-treated (red) groups is shown. (C) Venn diagram displaying shared significantly changed (1.5-fold, P < 0.05) metabolites from tumor and lung. (D) Relative amounts of kynurenine from tumor (left) and lung (right) between NT and JHU083-treated groups. Data are from 1 experiment with 4 to 5 mice per group and are presented as the mean ± SD. **P < 0.01; ****P < 0.001 by t test (B) or Mann-Whitney test (D).
To distinguish the unique and shared metabolites within the primary tumor and metastatic sites, we analyzed significantly altered metabolites from the primary tumor and lungs. We found several shared metabolites such as thymine, hydroxyproline, citrulline, thiamine, citraconic acid, allantoin, and kynurenine (Figure 10C).
Interestingly, of the 200 molecules tested, kynurenine was found to be the most reduced metabolite in the treated mice in the primary tumor (Figure 9C and Figure 10D). This was quite surprising since glutamine is not known to be directly involved in kynurenine metabolism. Strikingly, in agreement with our primary tumor data, the kynurenine level was also markedly reduced in the lungs from the JHU083-treated mice (Figure 9B and Figure 10D). These data indicate that blocking glutamine metabolism can inhibit lung metastasis by altering the metabolism of both the primary tumor and the site of metastasis.
Targeting glutamine metabolism reduces IDO expression by regulating STAT1 and STAT3 signaling.
The enzyme IDO metabolizes tryptophan to kynurenine, which is a potent inhibitor of T cell proliferation and function, and its expression is actively regulated by signals within the TME (36). Thus, we hypothesized that glutamine antagonism regulates IDO expression but not its enzymatic activity. Indeed, IDO protein expression in 4T1 tumor lysates was decreased in the JHU083-treated mice compared with vehicle-treated mice (Figure 11A). Similarly, we observed markedly reduced IDO expression in JHU083-treated MC38 tumor lysates (Figure 11B). To determine the major source of IDO in the tumor, we performed immunoblotting on different cell populations in the TME. We observed that tumor cells are a major source of IDO and JHU083 treatment dramatically decreases tumor IDO expression (Figure 11C). Additionally, sorted MDSCs and TAMs express IDO that is also markedly reduced with JHU083 treatment (Figure 11D). Furthermore, the kynurenine/tryptophan ratio was markedly diminished in the tumors from the JHU083-treated mice (Figure 11E).
Figure 11. Glutamine antagonism reduces IDO expression by decreasing p-STAT1/3 signaling.

(A–D) 4T1 cells (1 × 10⁵) or 1 × 10⁵ GFP+ 4T1 cells were implanted subcutaneously into mammary fat pads of BALB/cJ mice. MC38 cells (5 × 10⁵) were implanted subcutaneously into the flank of C57BL/6J mice. Tumor-bearing mice were treated with JHU083. On day 21, IDO expression in tumor lysates from (A) 4T1 tumor– or (B) MC38 tumor–bearing mice was measured by immunoblot. On day 12, (C) GFP+ tumor cells, (D) TAMs, and MDSCs were sorted. Cells were lysed and IDO expression was measured by immunoblot. (E) The ratio of kynurenine to tryptophan in tumors. (F) 4T1 tumor cells were cultured in the presence or absence of DON (0.5 or 1 μM) and IFN-γ for 6 or 24 hours. p-STAT1 (Ser727) and IDO expression was measured by immunoblot (left). After 6 hours with 1 μM DON treatment, Ido mRNA levels were measured by q-PCR (right). (G) RAW264.7 cells were cultured in the presence or absence of DON (0.5 or 1 μM) and IFN-γ for 6 or 24 hours. p-STAT3 (Ser727) and IDO were measured by immunoblot (left). After 6 hours with 1 μM DON treatment, Ido mRNA levels were measured by q-PCR (right). (H) 4T1 tumor–bearing mice were treated with JHU083. On day 14, IDO expression within lung lysates from tumor-free and 4T1 tumor–bearing mice with or without JHU083 treatment was measured by immunoblotting. (I) Left: Heatmap visualization of P values from Pearson’s correlation analysis (non-log scale for calculation) using TCGA normal and breast-invasive carcinoma data between the glutamine-utilizing enzymes inhibited by DON and IDO expression. Right: Enzyme and IDO correlation data. Data are presented as the mean ± SD. *P < 0.05; **P < 0.01; ****P < 0.001 by Mann-Whitney t test (E) or 1-way ANOVA with Tukey’s multiple-comparisons post hoc test (F and G).
IDO is transcriptionally regulated by STAT1 and STAT3. To understand how IDO expression is regulated by glutamine metabolism, we measured the phosphorylation of STAT1 as an indicator of its transcriptional activity. With DON treatment, we observed reduced p-STAT1 in the tumor along with reduced IDO expression upon IFN-γ stimulation (Figure 11F). Accordingly, reduced mRNA expression of IDO was observed with glutamine inhibition (Figure 11F). Similarly, with DON treatment, we observed reduced p-STAT3 in the RAW264.7 macrophage cell line along with decreased IDO protein and mRNA expression upon IFN-γ stimulation (Figure 11G). Thus, targeting glutamine metabolism not only inhibits glutamine-dependent pathways, but also leads to a marked decrease in p-STAT1– and p-STAT3–dependent IDO expression resulting in a robust reversal of the kynurenine/tryptophan ratio.
Interestingly, the metabolite kynurenine has been implicated in promoting metastasis (37–39). Indeed, we observed higher IDO expression in the lungs from untreated mice with tumors before the appearance of metastases compared with the lungs of tumor-free mice. Similar to the primary tumor, JHU083 treatment decreased IDO expression in the lung (Figure 11H). Overall, these data suggest that the robust ability of targeting glutamine metabolism to inhibit metastasis may be attributed in part to altering the metabolic and immunologic metastatic microenvironment.
Finally, to explore the potential link between glutamine metabolism and IDO expression in patients with breast cancer, we analyzed The Cancer Genome Atlas (TCGA) using normal and breast-invasive carcinoma data. TCGA analysis revealed significant correlation between expression levels of IDO and glutamine using enzymes that are inhibited by DON, such as cytidine triphosphate synthase (CTS1), guanine monophosphate synthase (GMPS), GLS1, asparagine synthetase (ASNS), and carbamoyl-phosphate synthetase (CAD). These correlations are only found in breast carcinoma samples but not normal tissue controls, indicating the potential link between glutamine metabolism and IDO expression levels in breast cancer (Figure 11I).
Together, our findings elucidate fundamental insight into the role of glutamine metabolism in not only regulating tumor growth and the TME but also controlling the generation and recruitment of MDSCs and reprogramming of TAMs, as well as regulating IDO expression, which results in inhibition of cancer growth, metastasis, and immune evasion. Further, we demonstrate the ability of our small-molecule inhibitor of glutamine metabolism to render immunotherapy-resistant tumors susceptible to checkpoint blockade (Figure 12).
Figure 12. The proposed mechanisms of how glutamine antagonism enhances antitumor immunity.

Proposed models describing the effect of glutamine antagonism on the heterogeneous tumor microenvironment.
Discussion
It is becoming increasingly clear that specialized tumor metabolism does not merely support the growth and energetics of cancer cells, but also plays a critical role in creating an immunosuppressive TME. To this end, the metabolic program of suppressive myeloid cells is specialized in order to thrive within the TME. We demonstrated that targeting glutamine metabolism not only inhibits tumor growth but also alters the TME and subsequently tumor immune evasion. Therefore, targeting glutamine metabolism led to: (a) inhibition of tumor-derived CSF3, (b) inhibition of tumor IDO expression resulting in decreased kynurenine, (c) immunogenic cell death of tumor cells, (d) apoptosis of MDSCs, (e) conversion of MDSCs to inflammatory macrophages, and (f) enhanced activation of macrophages and antigen presentation. The net results of these effects were decreased tumor growth/metastasis and enhanced antitumor immunity. Importantly, our studies reveal the intimate relationship between the metabolism of tumor cells and the metabolism of suppressive immune cells and how targeting glutamine metabolism can enhance tumor infiltration by immune cells.
The critical role of glutamine in supporting the prodigious anabolic requirements of cancer cells has been appreciated for some time (3, 40, 41). The current efforts to target glutamine in tumors have primarily focused on the initial step of glutaminolysis through the development of selective GLS inhibitors (42–44). While such inhibitors demonstrate robust efficacy in vitro, it is becoming clear that GLS inhibition is far less effective in vivo (45–48). As such, we have developed a prodrug of the glutamine antagonist DON, which not only inhibits GLS, but also all other glutamine-requiring reactions important to tumor growth, including purine and pyrimidine biosynthesis, redox control, glycosylation, amino acid and collagen synthesis, autophagy, and epigenetic modification (3, 21). DON as an antitumor agent has been studied for 60 years. Although DON resulted in some encouraging responses in phase I and II clinical trials in the 1950s to the 1980s, the development of DON was limited by its GI toxicity (49, 50). Our compound, JHU083, limits toxicity by creating an inert prodrug that is preferentially (though not exclusively) converted to the active compound DON within the TME (22, 50). It is important to note that while we can evaluate the efficacy of our approach in mice, we cannot evaluate the toxicity and pharmacokinetics in small animals (rodents), because they metabolize the prodrugs differently than humans do (22). As such, our dosing schedule in mice is much more limited by the potential toxicities than it would be in humans. Nonetheless, even though JHU083 is rapidly converted to DON in mice, we have identified a robust therapeutic window to evaluate its effects on tumor growth and the TME. Furthermore, unlike the previous clinical trials employing DON, in the modern era, our studies provide a robust clinical rationale for developing combination regimens using our DON prodrug along with immunotherapy.
While the specialized metabolism of tumors promotes growth, it also profoundly influences the TME. Indeed, the hypoxic, acidic, nutrient-depleted TME in and of itself serves to inhibit antitumor immune responses. Such an environment favors the residency of suppressive myeloid cells such as MDSCs, TANs, and TAMs, all of which contribute to promoting tumor growth, angiogenesis, metastasis, and immune escape (51). Additionally, suppressive myeloid cells contribute to resistance against immune checkpoint blockade (52, 53). Our data demonstrate that targeting glutamine metabolism leads to a marked decrease in MDSCs in both the peripheral blood of tumor-bearing mice and within the tumor itself. Mechanistically, this is due in part to (a) increased caspase-3–dependent cell death, (b) decreased secretion of CSF3 from the tumors by reducing the expression of transcription factor C/EBPβ, and (c) promoted MDSC differentiation into proinflammatory TAMs. Interestingly, glutamine antagonism did not simply reduce the percentage and absolute numbers of TAMs within the tumor. Rather, it promoted the generation of proinflammatory TAMs. Analogous with our findings, a recent study demonstrated that glutamine depletion enhances M1 and reduces M2 macrophage phenotype and function (32).
A recent study demonstrated that the inhibition of aerobic glycolysis in tumors can reduce MDSC recruitment through the reduction of CSF3 secretion via enhanced C/EBPβ degradation (29). The authors showed that degradation of C/EBPβ is mediated by enhanced autophagy. Similarly, we recently demonstrated that glutamine antagonism inhibits aerobic glycolysis in tumors (35). Also, glutamine deprivation or inhibition enhances autophagy and reduces mTOR activity in tumors (54, 55). As such, our preliminary studies suggest that the ability of JHU083 to downmodulate C/EBPβ protein and thus the expression of CSF3 may be due in part to the ability of JHU083 to promote autophagy.
Inasmuch as glutamine plays a critical role in multiple anabolic metabolic pathways, we hypothesized that glutamine antagonism would drastically alter the metabolic TME. Indeed, in 4T1 tumors from the JHU083-treated mice, we observed decreased metabolites: citrulline, N-carbamoyl-L-aspartate, thymine, S-adenosyl-L-methionine, homoserine, guanosine, nicotinamide ribotide, hydroxyproline, and succinate. Surprisingly, of the 200 metabolites queried, kynurenine was the most differentially regulated. Kynurenine is the product of tryptophan metabolism by IDO and has potent immunosuppressive effects. IDO-KO mice robustly reject tumors and inhibitors of IDO are being developed clinically as immunotherapy (36, 56, 57). Unexpectedly, JHU083 inhibited conversion of tryptophan to kynurenine. However, its mechanism of action was not by directly inhibiting IDO but rather by inducing the downmodulation of IDO gene expression via reduced STAT1 and STAT3 transcriptional activity.
In addition to inhibiting growth of the primary tumor, glutamine antagonism proved to be potent in inhibiting the development of metastasis. This observation has important clinical relevance to many tumors (especially breast cancer) where metastatic spread of the primary tumor negates successful surgical removal. In the 4T1 model, a major site of metastasis is the lung. Interestingly, we observed both metabolic and immunologic differences in the lungs of untreated and treated mice even in the absence of macroscopic metastasis. MDSCs are thought to play an integral role in promoting metastasis (26, 58, 59). It has been shown that MDSCs increase angiogenesis, tumor invasion, and formation of a premetastatic niche by enhancing proangiogenetic factors (such as VEGF, PDGF, b-FGF, and angiopoietins), MMPs, and chemokines (such as CXCL1, CXCL2, MCP1, and CXCL5) (26). To this end, we observed an increase in the CD8+ T cell/MDSC ratio in the lungs of the treated mice even in the absence of observable tumor. Likewise, kynurenine levels were decreased in the lungs of JHU083-treated mice compared with untreated mice even before there was evidence of macroscopic metastasis. Previous studies have shown that kynurenine can promote metastasis by inducing epithelial-mesenchymal transition by activating the aryl hydrocarbon receptor (39).
Immunotherapy in the form of anti-PD1 and anti-CTLA4 has revolutionized our approach to treat certain cancers, but in spite of these successes it is clear that not all cancers respond to checkpoint blockade alone, and even among responsive cancers, not all patients respond (52, 60–62). Such observations point to multiple different mechanisms of tumor immune evasion. Our data suggest that by targeting glutamine metabolism we can enhance the efficacy of immunotherapy. To this end, in the anti-PD1–responsive EO771 model, the addition of JHU083 enhanced the overall response of checkpoint blockade. Furthermore, in the 4T1 model that was resistant to combined anti-PD1 and anti-CTLA4 treatment, we could overcome resistance in part by blocking glutamine metabolism. Overall, these observations support the view that tumor metabolism represents a means by which cancer cells can evade antitumor immune responses. Further, we provide the preclinical rationale for strategies targeting glutamine metabolism as a means of enhancing immunotherapy for cancer.
Methods
Further details are provided in the Supplemental Methods.
Animals.
C57BL/6J, CD45.1 BALB/cJ, OTI, RAG1-KO, Batf3-KO, and BALB/cJ (both male and female mice, 6–8 weeks of age) were purchased from Jackson Laboratory. Mice were randomly assigned to experimental groups, and ages and sexes were matched. NSG mice were obtained from the Johns Hopkins Animal resources facility. MyD88/TRIF double KO mice were provided by Franck Housseau (Johns Hopkins University, Baltimore, Maryland, USA) (63, 64). TFEB-KO mice were provided by Andrea Ballabio (Baylor College of Medicine, Houston, Texas, USA) (65).
GEO.
The RNA-Seq data have been deposited in the NCBI’s Gene Expression Omnibus database (GEO GSE119733).
Statistics.
Graphs were generated and statistical analyses were performed with Prism 7 (GraphPad). Comparison between 2 means was done by 2-tailed t test or nonparametric 2-tailed Mann-Whitney t test. Comparisons between 3 or more means were done by 1-way ANOVA with multiple-comparisons post hoc test. Survival test was done by log-rank (Mantel-Cox) test. The association between 2 ranked variables was done by Spearman’s rank correlation. A P value less than 0.05 was considered significant.
Study approval.
The Institutional Animal Care and Use Committee of Johns Hopkins University (Baltimore, Maryland, USA) approved all animal protocols.
Author contributions
MHO, IHS, RDL, IMS, WX, SLC, AJT, RLB, CHP, JME, MLA, JW, and YCL performed and analyzed experiments. LZ performed and analyzed LC-MS experiments. PM, RR, LT, and BSS designed and synthesized JHU083. MHO and JDP wrote the manuscript. MRH and JDP supervised the project.
Supplementary Material
Acknowledgments
We thank the members of the Horton and Powell labs for review of this manuscript, and we thank T.C. Wu for his gift of mice. This work was supported by NIH grants R01CA229451 to JDP and BSS, R01HL141490 to MRH, and grants R01AI077610, R01CA226765, P41EB028239, and Cancer Center Core grant P30CA006973 to JDP; Bloomberg~Kimmel Institute for Cancer Immunotherapy funds to JDP and BSS, as well as Under Armour Women’s Health and Breast Cancer Innovation grants to JDP.
Version 1. 04/23/2020
In-Press Preview
Version 2. 06/15/2020
Electronic publication
Version 3. 07/01/2020
Print issue publication
Funding Statement
R01CA229451 to J.D.P. and B.S.S.
S10 OD016374 to the JHU Microscopy Facility
R01HL141490 to M.R.H.
R01AI077610 to J.D.P.
R01CA226765 to J.D.P.
the Bloomberg<223C>Kimmel Institute for Cancer Immunotherapy to J.D.P. and B.S.S.
Under Armour Women’s Health & Breast Cancer Innovation Grants to J.D.P
Footnotes
Conflict of interest: JDP, BSS, RR, and PM are scientific founders of Dracen Pharmaceuticals and possess equity. Technology arising in part from the studies described herein were patented by Johns Hopkins University and subsequently licensed to Dracen Pharmaceuticals.
Copyright: © 2020, American Society for Clinical Investigation.
Reference information: J Clin Invest. 2020;130(7):3865–3884.https://doi.org/10.1172/JCI131859.
Contributor Information
Min-Hee Oh, Email: moh9@jhmi.edu.
Im-Hong Sun, Email: isun2@jhmi.edu.
Liang Zhao, Email: lzhao18@jhu.edu.
Robert D. Leone, Email: rleone2@jhmi.edu.
Im-Meng Sun, Email: isun4@jhmi.edu.
Wei Xu, Email: wxu29@jhmi.edu.
Samuel L. Collins, Email: scollin7@jhmi.edu.
Ada J. Tam, Email: atam4@jhmi.edu.
Richard L. Blosser, Email: lblos@yahoo.com.
Chirag H. Patel, Email: cpatel10@jhmi.edu.
Judson M. Englert, Email: englertj4@upmc.edu.
Matthew L. Arwood, Email: marwood1@jhmi.edu.
Jiayu Wen, Email: jwen1@jhmi.edu.
Yee Chan-Li, Email: ychanli1@jhmi.edu.
Lukáš Tenora, Email: lukas.tenora@uochb.cas.cz.
Pavel Majer, Email: pavelm18@yahoo.com.
Rana Rais, Email: rrais2@jhmi.edu.
Barbara S. Slusher, Email: bslusher@jhmi.edu.
Maureen R. Horton, Email: mhorton2@jhmi.edu.
Jonathan D. Powell, Email: poweljo@jhmi.edu.
References
- 1.DeBerardinis RJ, Chandel NS. Fundamentals of cancer metabolism. Sci Adv. 2016;2(5):e1600200. doi: 10.1126/sciadv.1600200. [DOI] [PMC free article] [PubMed] [Google Scholar]
- 2.Pavlova NN, Thompson CB. The emerging hallmarks of cancer metabolism. Cell Metab. 2016;23(1):27–47. doi: 10.1016/j.cmet.2015.12.006. [DOI] [PMC free article] [PubMed] [Google Scholar]
- 3.Altman BJ, Stine ZE, Dang CV. From Krebs to clinic: glutamine metabolism to cancer therapy. Nat Rev Cancer. 2016;16(10):619–634. doi: 10.1038/nrc.2016.71. [DOI] [PMC free article] [PubMed] [Google Scholar]
- 4.Sica A, Mantovani A. Macrophage plasticity and polarization: in vivo veritas. J Clin Invest. 2012;122(3):787–795. doi: 10.1172/JCI59643. [DOI] [PMC free article] [PubMed] [Google Scholar]
- 5.Noy R, Pollard JW. Tumor-associated macrophages: from mechanisms to therapy. Immunity. 2014;41(1):49–61. doi: 10.1016/j.immuni.2014.06.010. [DOI] [PMC free article] [PubMed] [Google Scholar]
- 6.Kondo Y, Arii S, Mori A, Furutani M, Chiba T, Imamura M. Enhancement of angiogenesis, tumor growth, and metastasis by transfection of vascular endothelial growth factor into LoVo human colon cancer cell line. Clin Cancer Res. 2000;6(2):622–630. [PubMed] [Google Scholar]
- 7.Mantovani A, Marchesi F, Malesci A, Laghi L, Allavena P. Tumour-associated macrophages as treatment targets in oncology. Nat Rev Clin Oncol. 2017;14(7):399–416. doi: 10.1038/nrclinonc.2016.217. [DOI] [PMC free article] [PubMed] [Google Scholar]
- 8.Munn DH, Mellor AL. Indoleamine 2,3 dioxygenase and metabolic control of immune responses. Trends Immunol. 2013;34(3):137–143. doi: 10.1016/j.it.2012.10.001. [DOI] [PMC free article] [PubMed] [Google Scholar]
- 9.Lee GK, Park HJ, Macleod M, Chandler P, Munn DH, Mellor AL. Tryptophan deprivation sensitizes activated T cells to apoptosis prior to cell division. Immunology. 2002;107(4):452–460. doi: 10.1046/j.1365-2567.2002.01526.x. [DOI] [PMC free article] [PubMed] [Google Scholar]
- 10.Mellor AL, Keskin DB, Johnson T, Chandler P, Munn DH. Cells expressing indoleamine 2,3-dioxygenase inhibit T cell responses. J Immunol. 2002;168(8):3771–3776. doi: 10.4049/jimmunol.168.8.3771. [DOI] [PubMed] [Google Scholar]
- 11.Rath M, Müller I, Kropf P, Closs EI, Munder M. Metabolism via arginase or nitric oxide synthase: two competing arginine pathways in macrophages. Front Immunol. 2014;5:532. doi: 10.3389/fimmu.2014.00532. [DOI] [PMC free article] [PubMed] [Google Scholar]
- 12.Prima V, Kaliberova LN, Kaliberov S, Curiel DT, Kusmartsev S. COX2/mPGES1/PGE2 pathway regulates PD-L1 expression in tumor-associated macrophages and myeloid-derived suppressor cells. Proc Natl Acad Sci U S A. 2017;114(5):1117–1122. doi: 10.1073/pnas.1612920114. [DOI] [PMC free article] [PubMed] [Google Scholar]
- 13.Tcyganov E, Mastio J, Chen E, Gabrilovich DI. Plasticity of myeloid-derived suppressor cells in cancer. Curr Opin Immunol. 2018;51:76–82. doi: 10.1016/j.coi.2018.03.009. [DOI] [PMC free article] [PubMed] [Google Scholar]
- 14.Bronte V, et al. Recommendations for myeloid-derived suppressor cell nomenclature and characterization standards. Nat Commun. 2016;7:12150. doi: 10.1038/ncomms12150. [DOI] [PMC free article] [PubMed] [Google Scholar]
- 15.Bronte V, et al. Identification of a CD11b(+)/Gr-1(+)/CD31(+) myeloid progenitor capable of activating or suppressing CD8(+) T cells. Blood. 2000;96(12):3838–3846. [PMC free article] [PubMed] [Google Scholar]
- 16.Li Q, Pan PY, Gu P, Xu D, Chen SH. Role of immature myeloid Gr-1+ cells in the development of antitumor immunity. Cancer Res. 2004;64(3):1130–1139. doi: 10.1158/0008-5472.CAN-03-1715. [DOI] [PubMed] [Google Scholar]
- 17.Serafini P, Mgebroff S, Noonan K, Borrello I. Myeloid-derived suppressor cells promote cross-tolerance in B-cell lymphoma by expanding regulatory T cells. Cancer Res. 2008;68(13):5439–5449. doi: 10.1158/0008-5472.CAN-07-6621. [DOI] [PMC free article] [PubMed] [Google Scholar]
- 18.Schmielau J, Finn OJ. Activated granulocytes and granulocyte-derived hydrogen peroxide are the underlying mechanism of suppression of T-cell function in advanced cancer patients. Cancer Res. 2001;61(12):4756–4760. [PubMed] [Google Scholar]
- 19.Srivastava MK, Sinha P, Clements VK, Rodriguez P, Ostrand-Rosenberg S. Myeloid-derived suppressor cells inhibit T-cell activation by depleting cystine and cysteine. Cancer Res. 2010;70(1):68–77. doi: 10.1158/0008-5472.CAN-09-2587. [DOI] [PMC free article] [PubMed] [Google Scholar]
- 20.Almand B, et al. Increased production of immature myeloid cells in cancer patients: a mechanism of immunosuppression in cancer. J Immunol. 2001;166(1):678–689. doi: 10.4049/jimmunol.166.1.678. [DOI] [PubMed] [Google Scholar]
- 21.Yang L, Venneti S, Nagrath D. Glutaminolysis: A hallmark of cancer metabolism. Annu Rev Biomed Eng. 2017;19:163–194. doi: 10.1146/annurev-bioeng-071516-044546. [DOI] [PubMed] [Google Scholar]
- 22.Rais R, et al. Discovery of 6-diazo-5-oxo-l-norleucine (DON) prodrugs with enhanced CSF delivery in monkeys: a potential treatment for glioblastoma. J Med Chem. 2016;59(18):8621–8633. doi: 10.1021/acs.jmedchem.6b01069. [DOI] [PubMed] [Google Scholar]
- 23.Kim K, et al. Eradication of metastatic mouse cancers resistant to immune checkpoint blockade by suppression of myeloid-derived cells. Proc Natl Acad Sci U S A. 2014;111(32):11774–11779. doi: 10.1073/pnas.1410626111. [DOI] [PMC free article] [PubMed] [Google Scholar]
- 24.Safarzadeh E, Orangi M, Mohammadi H, Babaie F, Baradaran B. Myeloid-derived suppressor cells: Important contributors to tumor progression and metastasis. J Cell Physiol. 2018;233(4):3024–3036. doi: 10.1002/jcp.26075. [DOI] [PubMed] [Google Scholar]
- 25.Wang Y, Ding Y, Guo N, Wang S. MDSCs: key criminals of tumor pre-metastatic niche formation. Front Immunol. 2019;10:172. doi: 10.3389/fimmu.2019.00172. [DOI] [PMC free article] [PubMed] [Google Scholar]
- 26.Condamine T, Ramachandran I, Youn JI, Gabrilovich DI. Regulation of tumor metastasis by myeloid-derived suppressor cells. Annu Rev Med. 2015;66:97–110. doi: 10.1146/annurev-med-051013-052304. [DOI] [PMC free article] [PubMed] [Google Scholar]
- 27.Akagi T, Saitoh T, O’Kelly J, Akira S, Gombart AF, Koeffler HP. Impaired response to GM-CSF and G-CSF, and enhanced apoptosis in C/EBPbeta-deficient hematopoietic cells. Blood. 2008;111(6):2999–3004. doi: 10.1182/blood-2007-04-087213. [DOI] [PMC free article] [PubMed] [Google Scholar]
- 28.Marigo I, et al. Tumor-induced tolerance and immune suppression depend on the C/EBPbeta transcription factor. Immunity. 2010;32(6):790–802. doi: 10.1016/j.immuni.2010.05.010. [DOI] [PubMed] [Google Scholar]
- 29.Li W, et al. Aerobic glycolysis controls myeloid-derived suppressor cells and tumor immunity via a specific CEBPB isoform in triple-negative breast cancer. Cell Metab. 2018;28(1):87–103.e6. doi: 10.1016/j.cmet.2018.04.022. [DOI] [PMC free article] [PubMed] [Google Scholar]
- 30.Perry CJ, et al. Myeloid-targeted immunotherapies act in synergy to induce inflammation and antitumor immunity. J Exp Med. 2018;215(3):877–893. doi: 10.1084/jem.20171435. [DOI] [PMC free article] [PubMed] [Google Scholar]
- 31.Hoves S, et al. Rapid activation of tumor-associated macrophages boosts preexisting tumor immunity. J Exp Med. 2018;215(3):859–876. doi: 10.1084/jem.20171440. [DOI] [PMC free article] [PubMed] [Google Scholar]
- 32.Liu PS, et al. α-Ketoglutarate orchestrates macrophage activation through metabolic and epigenetic reprogramming. Nat Immunol. 2017;18(9):985–994. doi: 10.1038/ni.3796. [DOI] [PubMed] [Google Scholar]
- 33.Green DR, Ferguson T, Zitvogel L, Kroemer G. Immunogenic and tolerogenic cell death. Nat Rev Immunol. 2009;9(5):353–363. doi: 10.1038/nri2545. [DOI] [PMC free article] [PubMed] [Google Scholar]
- 34.Krysko DV, Garg AD, Kaczmarek A, Krysko O, Agostinis P, Vandenabeele P. Immunogenic cell death and DAMPs in cancer therapy. Nat Rev Cancer. 2012;12(12):860–875. doi: 10.1038/nrc3380. [DOI] [PubMed] [Google Scholar]
- 35.Leone RD, et al. Glutamine blockade induces divergent metabolic programs to overcome tumor immune evasion. Science. 2019;366(6468):1013–1021. doi: 10.1126/science.aav2588. [DOI] [PMC free article] [PubMed] [Google Scholar]
- 36.Munn DH, Mellor AL. IDO in the tumor microenvironment: inflammation, counter-regulation, and tolerance. Trends Immunol. 2016;37(3):193–207. doi: 10.1016/j.it.2016.01.002. [DOI] [PMC free article] [PubMed] [Google Scholar]
- 37.Smith C, et al. IDO is a nodal pathogenic driver of lung cancer and metastasis development. Cancer Discov. 2012;2(8):722–735. doi: 10.1158/2159-8290.CD-12-0014. [DOI] [PMC free article] [PubMed] [Google Scholar]
- 38.D’Amato NC, et al. A TDO2-AhR signaling axis facilitates anoikis resistance and metastasis in triple-negative breast cancer. Cancer Res. 2015;75(21):4651–4664. doi: 10.1158/0008-5472.CAN-15-2011. [DOI] [PMC free article] [PubMed] [Google Scholar]
- 39.Xue P, Fu J, Zhou Y. The Aryl Hydrocarbon Receptor and Tumor Immunity. Front Immunol. 2018;9:286. doi: 10.3389/fimmu.2018.00286. [DOI] [PMC free article] [PubMed] [Google Scholar]
- 40.Tennant DA, Durán RV, Gottlieb E. Targeting metabolic transformation for cancer therapy. Nat Rev Cancer. 2010;10(4):267–277. doi: 10.1038/nrc2817. [DOI] [PubMed] [Google Scholar]
- 41.Galluzzi L, Kepp O, Vander Heiden MG, Kroemer G. Metabolic targets for cancer therapy. Nat Rev Drug Discov. 2013;12(11):829–846. doi: 10.1038/nrd4145. [DOI] [PubMed] [Google Scholar]
- 42.Xiang Y, et al. Targeted inhibition of tumor-specific glutaminase diminishes cell-autonomous tumorigenesis. J Clin Invest. 2015;125(6):2293–2306. doi: 10.1172/JCI75836. [DOI] [PMC free article] [PubMed] [Google Scholar]
- 43.Gross MI, et al. Antitumor activity of the glutaminase inhibitor CB-839 in triple-negative breast cancer. Mol Cancer Ther. 2014;13(4):890–901. doi: 10.1158/1535-7163.MCT-13-0870. [DOI] [PubMed] [Google Scholar]
- 44.Wang JB, et al. Targeting mitochondrial glutaminase activity inhibits oncogenic transformation. Cancer Cell. 2010;18(3):207–219. doi: 10.1016/j.ccr.2010.08.009. [DOI] [PMC free article] [PubMed] [Google Scholar]
- 45.Gao P, et al. c-Myc suppression of miR-23a/b enhances mitochondrial glutaminase expression and glutamine metabolism. Nature. 2009;458(7239):762–765. doi: 10.1038/nature07823. [DOI] [PMC free article] [PubMed] [Google Scholar]
- 46.Romero R, et al. Keap1 loss promotes Kras-driven lung cancer and results in dependence on glutaminolysis. Nat Med. 2017;23(11):1362–1368. doi: 10.1038/nm.4407. [DOI] [PMC free article] [PubMed] [Google Scholar]
- 47.Davidson SM, et al. Environment impacts the metabolic dependencies of Ras-driven non-small cell lung cancer. Cell Metab. 2016;23(3):517–528. doi: 10.1016/j.cmet.2016.01.007. [DOI] [PMC free article] [PubMed] [Google Scholar]
- 48.Biancur DE, et al. Compensatory metabolic networks in pancreatic cancers upon perturbation of glutamine metabolism. Nat Commun. 2017;8:15965. doi: 10.1038/ncomms15965. [DOI] [PMC free article] [PubMed] [Google Scholar]
- 49.Ahluwalia GS, Grem JL, Hao Z, Cooney DA. Metabolism and action of amino acid analog anti-cancer agents. Pharmacol Ther. 1990;46(2):243–271. doi: 10.1016/0163-7258(90)90094-I. [DOI] [PubMed] [Google Scholar]
- 50.Lemberg KM, Vornov JJ, Rais R, Slusher BS. We’re not “DON” yet: optimal dosing and prodrug delivery of 6-diazo-5-oxo-L-norleucine. Mol Cancer Ther. 2018;17(9):1824–1832. doi: 10.1158/1535-7163.MCT-17-1148. [DOI] [PMC free article] [PubMed] [Google Scholar]
- 51.Binnewies M, et al. Understanding the tumor immune microenvironment (TIME) for effective therapy. Nat Med. 2018;24(5):541–550. doi: 10.1038/s41591-018-0014-x. [DOI] [PMC free article] [PubMed] [Google Scholar]
- 52.Sharma P, Hu-Lieskovan S, Wargo JA, Ribas A. Primary, adaptive, and acquired resistance to cancer immunotherapy. Cell. 2017;168(4):707–723. doi: 10.1016/j.cell.2017.01.017. [DOI] [PMC free article] [PubMed] [Google Scholar]
- 53.Steinberg SM, et al. Myeloid cells that impair immunotherapy are restored in melanomas with acquired resistance to BRAF inhibitors. Cancer Res. 2017;77(7):1599–1610. doi: 10.1158/0008-5472.CAN-16-1755. [DOI] [PMC free article] [PubMed] [Google Scholar]
- 54.Tan HWS, Sim AYL, Long YC. Glutamine metabolism regulates autophagy-dependent mTORC1 reactivation during amino acid starvation. Nat Commun. 2017;8(1):338. doi: 10.1038/s41467-017-00369-y. [DOI] [PMC free article] [PubMed] [Google Scholar]
- 55.Durán RV, et al. Glutaminolysis activates Rag-mTORC1 signaling. Mol Cell. 2012;47(3):349–358. doi: 10.1016/j.molcel.2012.05.043. [DOI] [PubMed] [Google Scholar]
- 56.Holmgaard RB, Zamarin D, Munn DH, Wolchok JD, Allison JP. Indoleamine 2,3-dioxygenase is a critical resistance mechanism in antitumor T cell immunotherapy targeting CTLA-4. J Exp Med. 2013;210(7):1389–1402. doi: 10.1084/jem.20130066. [DOI] [PMC free article] [PubMed] [Google Scholar]
- 57.Uyttenhove C, et al. Evidence for a tumoral immune resistance mechanism based on tryptophan degradation by indoleamine 2,3-dioxygenase. Nat Med. 2003;9(10):1269–1274. doi: 10.1038/nm934. [DOI] [PubMed] [Google Scholar]
- 58.Huang A, Zhang B, Wang B, Zhang F, Fan KX, Guo YJ. Increased CD14(+)HLA-DR (-/low) myeloid-derived suppressor cells correlate with extrathoracic metastasis and poor response to chemotherapy in non-small cell lung cancer patients. Cancer Immunol Immunother. 2013;62(9):1439–1451. doi: 10.1007/s00262-013-1450-6. [DOI] [PMC free article] [PubMed] [Google Scholar]
- 59.Yu J, et al. Myeloid-derived suppressor cells suppress antitumor immune responses through IDO expression and correlate with lymph node metastasis in patients with breast cancer. J Immunol. 2013;190(7):3783–3797. doi: 10.4049/jimmunol.1201449. [DOI] [PubMed] [Google Scholar]
- 60.Del Paggio JC. Immunotherapy: Cancer immunotherapy and the value of cure. Nat Rev Clin Oncol. 2018;15(5):268–270. doi: 10.1038/nrclinonc.2018.27. [DOI] [PubMed] [Google Scholar]
- 61.Larkin J, et al. Combined nivolumab and ipilimumab or monotherapy in untreated melanoma. N Engl J Med. 2015;373(1):23–34. doi: 10.1056/NEJMoa1504030. [DOI] [PMC free article] [PubMed] [Google Scholar]
- 62.Tumeh PC, et al. PD-1 blockade induces responses by inhibiting adaptive immune resistance. Nature. 2014;515(7528):568–571. doi: 10.1038/nature13954. [DOI] [PMC free article] [PubMed] [Google Scholar]
- 63.Kawai T, Adachi O, Ogawa T, Takeda K, Akira S. Unresponsiveness of MyD88-deficient mice to endotoxin. Immunity. 1999;11(1):115–122. doi: 10.1016/S1074-7613(00)80086-2. [DOI] [PubMed] [Google Scholar]
- 64.Hoebe K, et al. Identification of Lps2 as a key transducer of MyD88-independent TIR signalling. Nature. 2003;424(6950):743–748. doi: 10.1038/nature01889. [DOI] [PubMed] [Google Scholar]
- 65.Settembre C, et al. A lysosome-to-nucleus signalling mechanism senses and regulates the lysosome via mTOR and TFEB. EMBO J. 2012;31(5):1095–1108. doi: 10.1038/emboj.2012.32. [DOI] [PMC free article] [PubMed] [Google Scholar]
Associated Data
This section collects any data citations, data availability statements, or supplementary materials included in this article.