Abstract
Breast cancer is the most prevalent and among the most deadly cancers in females. Patients with breast cancer have highly variable survival rates, indicating a need to identify prognostic biomarkers. By integrating multi-omics data (e.g., gene expression, DNA methylation, miRNA expression, and copy number variations (CNVs)), it is likely to improve the accuracy of patient survival predictions compared to prediction using single modality data. Therefore, we propose to develop a machine learning pipeline using decision-level integration of multi-omics tumor data from The Cancer Genome Atlas (TCGA) to predict the overall survival of breast cancer patients. With multi-omics data consisting of gene expression, methylation, miRNA expression, and CNVs, the top performing model predicted survival with an accuracy of 85% and area under the curve (AUC) of 87%. Furthermore, the model was able to identify which modalities best contributed to prediction performance, identifying methylation, miRNA, and gene expression as the best integrated classification combination. Our method not only recapitulated several breast cancer-specific prognostic biomarkers that were previously reported in the literature but also yielded several novel biomarkers. Further analysis of these biomarkers could lend insight into the molecular mechanisms that lead to poor survival.
Keywords: Breast Cancer, Overall Survival, Multi-Omics, Decision-Level Integration, Biomarker Identification
I. INTRODUCTION
Breast cancer is the most common type of cancer in females worldwide. In 2018, breast cancer constituted over 25% of about 8:5 million new cancer diagnoses in female patients [1]. This prevalence pattern is found in America as well, where women have over a 12% risk of being diagnosed with breast cancer in their lives, and breast cancer cases are expected to encompass about 30% of new cancer cases [2]. While the principal risk factor for breast cancer is age, it is known that selected gene mutations account for about 10% of all breast cancer cases [3]. Research into prognostic genomic biomarkers beyond mutational status is ongoing and may offer insights into disease mechanisms and new therapies. Breast cancer maintains the second highest mortality rate for cancers in females at about 13% [2]. Survival rates for breast cancer are typically measured by 5-year post-diagnosis survival. The 5-year survival rate is 90% when all stage classifications are considered [4]. With stage breakdown accounted for, the risk can be further stratified, as localized breast cancer survival rate is 99%, while this drops to 85% and 27% for regionally and distantly spread cancer, respectively.
Machine learning in bioinformatics, particularly pertaining to breast cancer, has yielded positive results. Various methods have been employed with great success in developing survival prediction models with large and heterogeneous cancer datasets. Sun et al., for example, created a successful 5-year survival prediction model for breast cancer patients using multiple kernel learning on various genomic features [5]. Zhao et al. created and compared various survival prediction models using different types of popular classification algorithms with a high dimensional dataset of breast cancer patients. Authors demonstrated that all models performed similarly and consistently [6].
Multi-omics data from breast cancer patients has been made publicly available from The Cancer Genome Atlas (TCGA), a joint project between the National Cancer Institute and the National Human Genome Research Institute. Using omics data including gene expression, methylation, miRNA expression, and CNVs generated from on a set of 1006 patient samples, we seek to integrate the multi-omics data at the decision level to improve prediction of overall survival for breast cancer patients and identify novel prognostic markers. The remainder of the paper is structured as follows: in section 2, we will review current research in breast cancer survival prediction and multi-omics data integration. In section 3, we describe the proposed methods to construct survival prediction models with single genomic data and multi-genomics data, respectively. In section 4, we present the results of multiple survival prediction models and the corresponding biological biomarkers identified by these models. We will conclude the current work and discuss the future steps in section 5 and section 6, respectively.
II. RELATED WORKS
There have been a number of studies that develop breast cancer survival prediction models using either genomics data, clinical data, or an integration of the two. Zhao et al. tested various classification algorithms to predict 5-year breast cancer survival by integrating gene expression data with other clinical and pathological factors. Authors found that all methods tested, including gradient boosting, random forest, artificial neural networks, and support vector machine, performed rather similarly with accuracy and AUC of .72 and .67, respectively. Importantly, this study demonstrates that classification methods may not matter as much as the quality of the data itself [6]. Goli et al. developed a breast cancer survival prediction model using clinical and pathological data using support vector regression and found similar positive results. This study establishes the use of support vectors as a promising route in survival prediction with imbalanced datasets sets, which we explore further in our work [7]. Similarly, Gevaert et al. integrated microarray gene expression data with clinical data using Bayesian Networks and achieved a maximum AUC of .845. Importantly, this study found that incorporating both data modalities improved predictions beyond either clinical or gene expression alone [8]. In this study, we hope to not only replicate previous success in creating prediction models using machine learning in breast cancer data but also expand upon these models by integrating large, heterogeneous datasets.
Compared to survival prediction with single-modality omics data, few studies have implemented classification models that integrate multiple types of omics data for survival prediction. Sun et al. created 5-year breast cancer survival prediction models using genomic data including gene expression, copy number alteration, methylation, and protein expression, coupled with pathological imaging data also from TCGA. The authors utilized multiple kernel learning to enact feature level integration of all data. Their multi-omics model, excluding imaging data, had an AUC of 0.802 ± 0.032. When incorporating the imaging data, the AUC went up slightly to 0828 ± 0.034 [5]. This study can serve as a baseline for our proposed multi-omics integration method, though we do not incorporate imaging data. We have not identified any prior work using decision-level integration of multi-omics data for survival prediction. Therefore, the proposed method can potentially demonstrate a novel route to utilize multi-omics data for the prediction of survival of breast cancer patients.
With the high dimensionality of omics data by nature, feature selection is essential for removing irrelevant features and identifying potential biomarkers. When integrating multiple different omics data, feature selection becomes even more important in fitting the predictive model efficiently. For example, Zhang et al. used minimum Redundancy Maximum Relevance (mRMR) as a feature selection algorithm in using liquid biopsies as a cancer subtype diagnostic tool. This method yielded highly informative features that more accurately predicted different cancer subtypes when compared to other established gene sets [9]. Based on the success in previous genomic data, mRMR will be applied for feature selection in our study. On the other hand, Jayanthi et al. used gene set enrichment analysis to infer mechanistic role played by several prognostic gene expression biomarkers in breast cancer. They found that higher graded tumors had enrichment for cancer-related pathways when compared to the less aggressive tumors [10]. To gain an understanding of the resulting biomarkers in our study, we incorporate a similar method for the clinical validation of the selected omics features.
III. METHODS
A. Dataset
The Cancer Genome Atlas (TCGA) is a large database containing genomic data for over 20; 000 paired cancer and normal samples from 33 cancer types [11]. Among this data are 1,060 patient breast cancer samples that were profiled for gene expression, miRNA expression, DNA methylation, and copy number variation (CNV). Patients were stratified into two groups (survived > 5 years or < 5 years) using metadata provided by TCGA. As seen in Table I, patients who are right censored (the last follow-up was prior to the 5-year cutoff, and the last known survival status was alive) were excluded from this study since it is unclear to which survival group they should be classified. Therefore, the data used in this study consists of 342 breast cancer patients, where 247 patients are long-survival group, and 95 patients are the short-survival group.
TABLE I.
Groupings of 1,060 TCGA Breast Cancer Patients
| Group | Survival Status | # of Patients |
|---|---|---|
| Long Survival | Vital status: “dead” Days to death ≥ 5 years OR Vital status: “alive” Days to last follow up ≥ 5 years |
247 |
| Short Survival | Vital status: “dead” Days to death < 5 years |
95 |
| Right Censored |
Vital status: “alive” Days to last follow up < 5 years |
718 |
B. Multi-Omics Data Exploration
To visualize the separation of long-survival and short-survival groups, we first apply the Kaplan-Meier plot to the 342 breast cancer patients (Fig 1), where we have observed clear separation based on our grouping methods (cutoff by 5 years).
Fig. 1.
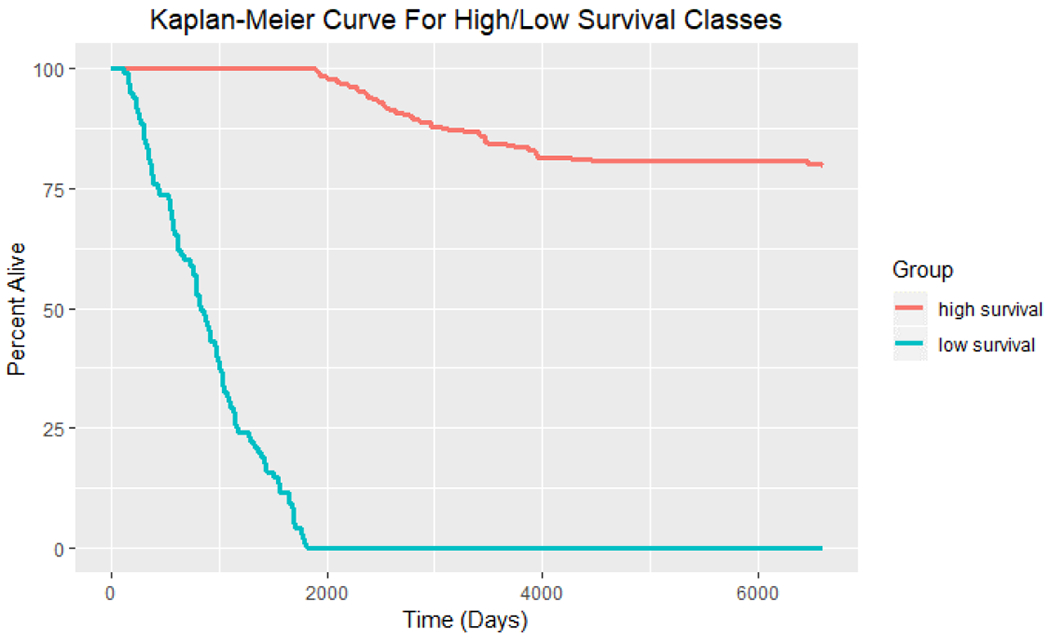
Kaplan-Meier curve for long-survival (247 patients) and short-survival (95 patients) groups of breast cancer patients.
We summarized the four omics data modalities (gene expression, miRNA expression, DNA methylation, and CNVs) obtained from TCGA dataset in Table II. Principal components analysis (PCA) has been applied to each of the four modalities for the entire dataset to determine whether the variance within most features naturally delineates the two survival classes. After min-max scaling, the first principal component (PC1) was plotted for each modality in a scatter plot matrix as seen in Fig 2.
TABLE II.
Overview of Four Omics Data Modalities
| Data Modality | Measures | Continuous/Discrete | Feature Name | # of Features | Notes |
|---|---|---|---|---|---|
| RNA Expression | Fragments per killobase of transcript per million mapped reads (FPKM) | Continuous [0, 1638541951] |
Ensembl Gene ID | 60,483 | The number of features includes different isoforms for each gene and some non-coding RNA transcripts |
| Copy Number Variation | Gain Loss Neutral |
Discrete Gain: 1 Loss: −1 Neutral: 0 |
Ensembl Gene ID | 19,729 | “Gain” is more copies of a gene than normal. “Loss” is less copies of a gene than normal |
| DNA Methylation | Beta Value | Continuous [0, 1] |
cg probe identifier | 20,019 | A beta value of 0 means that no methylation detected for that probe. Beta value of 1 means that the CpG was always methylated |
| MicroRNA Expression | Reads per million mapped reads (RPM) | Continuous [0, 589467] |
miRNA identifier | 1,881 |
Fig. 2.
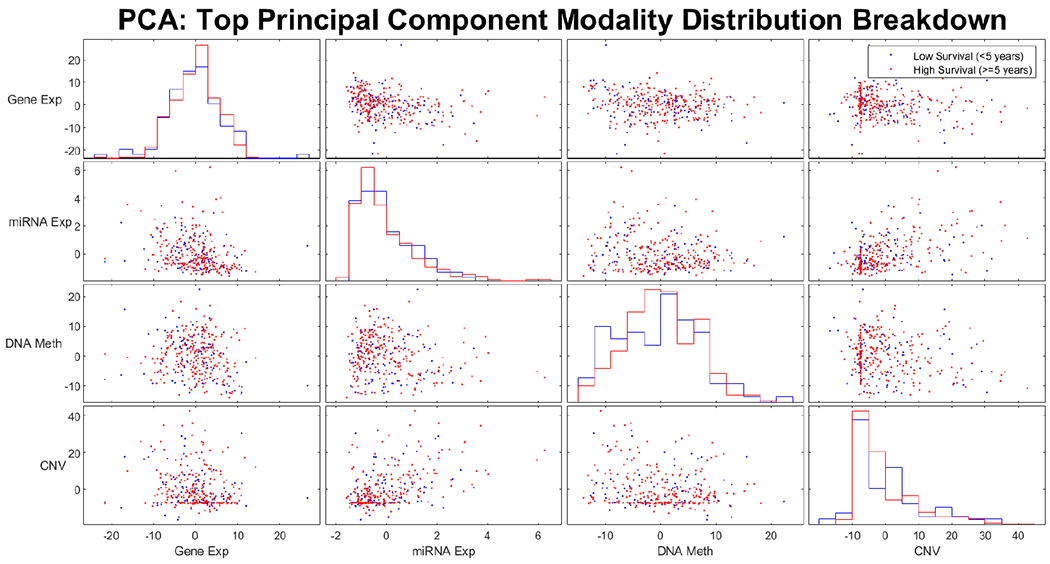
Pair-wise scatter plot of the first principal component (PC1) for four omics modalities. The data points are color coded for long-survival and short-survival groups.
As we can see from Fig 2, the two survival classes are not naturally separated by the most highly variable features. This indicates the need for feature selection to identify a subset of features that are correlated with patient survival. To identify which data modalities contain such features, the mutual information between each feature and the survival classes was plotted in Fig 3. This preliminary data exploration indicates that features of the CNV modality are far less informative of patient survival compared to those of the other three data modalities.
Fig. 3.
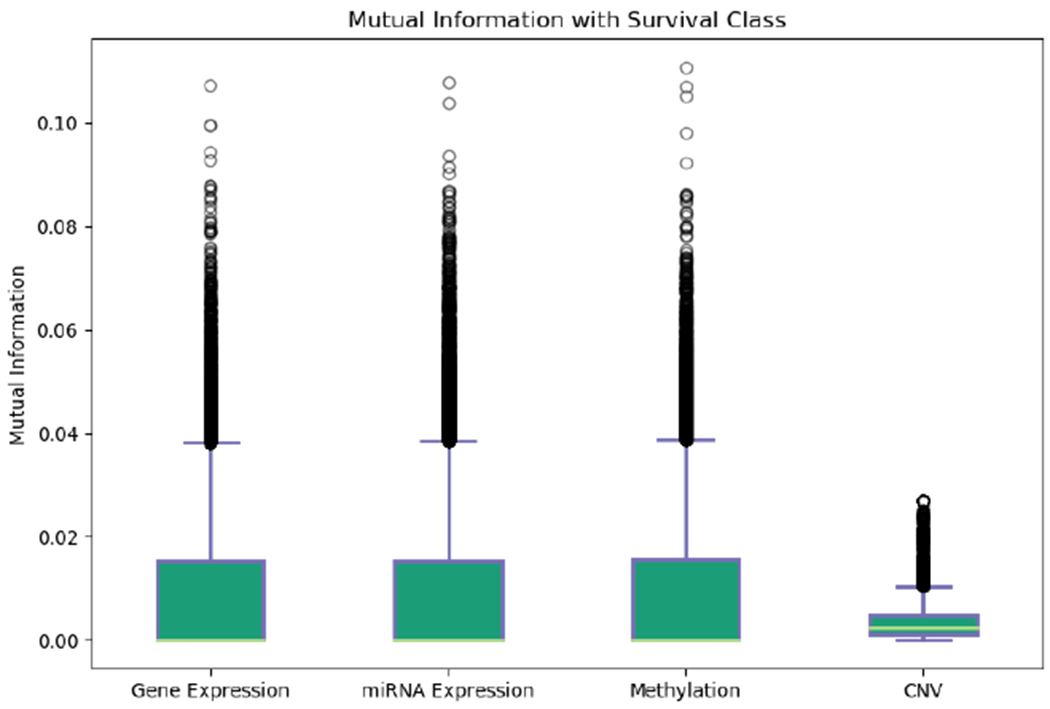
Mutual information between each feature and survival class of all samples. CNV features haves the lowest mutual information compared to the other three modalities.
C. Data Scaling and Quality Control
We first removed the right-censored samples from the 1,060 total patients. All data scaling and preprocessing were applied only to the remaining 342 patients. To get rid of the low-quality features, we remove features with all 0 values and features with missing data. To reduce the dimensionality and focus on the protein-coding genes, we further removed all transcripts from the gene expression dataset that did not code for proteins.
For data scaling, the gene expression and miRNA expression datasets were transformed using either the min-max scaler or a robust z-transformer. The min-max scaler coerces the range of values for each feature to be between 0-1 by dividing by the max value of each feature. The robust z-transformer first removes outliers from each feature and then subtracts the mean and divides by the standard deviation. This centers each feature around mean of 0 with unit variance. CNV did not need scaling since it is discrete. Methylation did not need scaling because the values already range between 0-1.
D. Feature Selection
Patient samples were stratified into a training set and a testing set consisting of 291 training samples and 51 testing samples, respectively. Feature selection was applied to the training set of each data modality in order to reduce the dimensionality of each feature matrix before training the classifiers. Multiple feature ranking methods were applied to each modality to determine which feature selection method yields the most meaningful features. The ranking method which performed best on cross-validation was selected for further analysis. Specifically, four feature selection method including Student’s t-test, mRMR, mutual information, and chi-squared test were evaluated. Mutual information was calculated by the following formula:
| (1) |
where PXY (x, y) represents the joint probability between a given feature and the target class. mRMR ranks features by iteratively selecting those that are most informative of the target class and least similar to all other selected features, which is represented mathematically as a quotient, called the mutual information quotient (MIQ) calculated as:
| (2) |
Where I (i, h) is the mutual information between a feature and the target class, I(i, h) is the mutual information between two features, and S is the number of features. Chi-squared test was applied in place of student’s t-test to perform feature selection on the CNV dataset. The Chi-squared test is designed to assess if a significant association exists between categorical variables, which applies to the discrete CNV data.
To apply the latter three methods to the continuous data modalities (gene expression, miRNA expression, and methylation), we first discretized the continuous omics data. Discretization was accomplished by dividing each patient’s expression of a given feature into “low”, “middle”, or “high” expression. “Low” expression was assigned if the value for a given sample fell below a threshold n standard deviations below the mean. “High” expression was assigned to samples above n standard deviations above the mean and “middle” expression was considered anything in between −n and n standard deviations. Different values for n ranging from 0.5 to 2 were tested. Furthermore, principal components analysis (PCA) was applied to the selected feature sets to visually assess the ability of the sets to discriminate between the two survival classes.
E. Decision-Level Data Integration
First, individual modality classifiers were trained using the selected features. Then these classifiers were used to predict survival for the 51 patient samples initially left aside. Receiver operating curves (ROC) and Kaplan-Meier curves were generated to evaluate the ability of these classifiers to accurately predict survival from both the high and low survival classes. In applying decision-level data integration, a new SVM classifier was trained on the same training data using the output predictions from the individual modality classifiers.
The proposed decision-level integration method is visualized in Fig 4. Specifically, this ensemble classifier was fed the prediction probabilities from the individual classifiers; these were computed using Platt scaling. In total, eleven separate ensemble classifiers were trained for all the different combinations of individual modality classifiers to identify which combination of data types performed best.
Fig. 4.
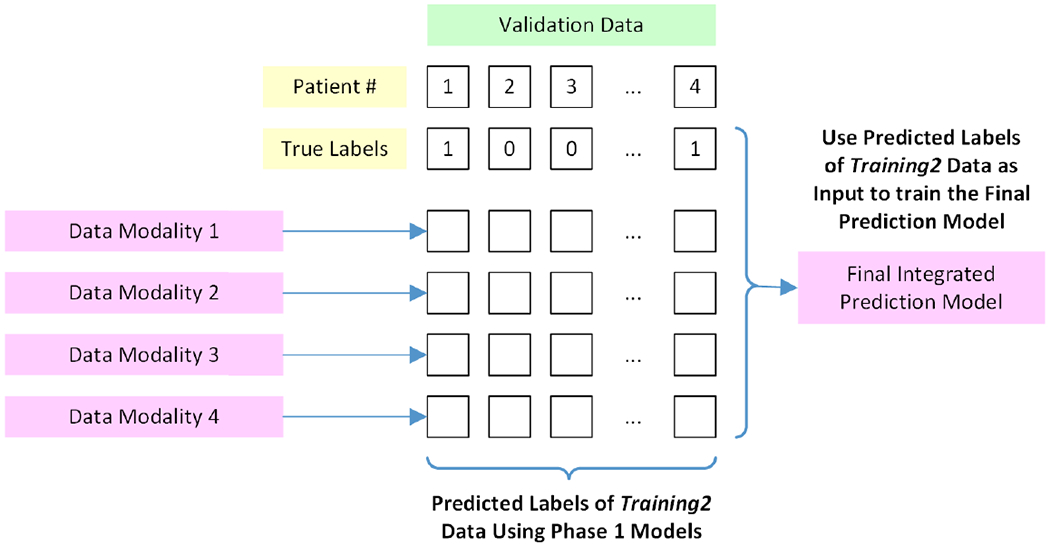
Generation of the final integrated prediction model using outputs from the individual modality prediction models.
F. Cross-Validation and Parameter Selection
For each modality, stratified 4-fold cross-validation was used on the training set of patients in combination with a grid search to identify the optimal SVM hyperparameters. Values tested for the regularization hyperparameter, C, ranged from .001 to 250. As a note, the penalty weighting for C was automatically selected to be inversely proportional to class frequencies in order to account for imbalanced class sizes in the dataset. Feature set sizes ranged between 2-100 at intervals of 2. Finally, the different kernel hyperparameters tested included linear, polynomial, radial basis function (RBF), and sigmoid. Heatmaps displaying the mean classification score for each parameter combination were constructed for visualization. For each modality, the hyperparameter set that maximized mean score across folds was advanced, and the classifier was retrained on all of the training data. During this process, we considered F1-score, Cohen’s Kappa, and accuracy as scoring metrics for evaluating classification performance on each fold, and the metric that yielded the best train/test accuracies were selected. Finally, this process was repeated ten times, shuffling the entire dataset on each iteration, to create validation plots. This allowed for robustness assessment of the cross-validation process, ensuring that it consistently yielded similar accuracies for both training and test sets. For the integrated classifier, four-fold cross-validation was used again to find optimal hyper-parameters. Here, the gamma hyperparameter was also included in the grid search, with values ranging from 0.01 to 2.
The workflow of the proposed translational pipeline consists of data preprocessing, cross-validation, feature selection for individual modalities, classification using individual modalities, decision-level integration using an ensemble classifier, and biomarker validation. The proposed translational pipeline is visualized in Fig 5.
Fig. 5.
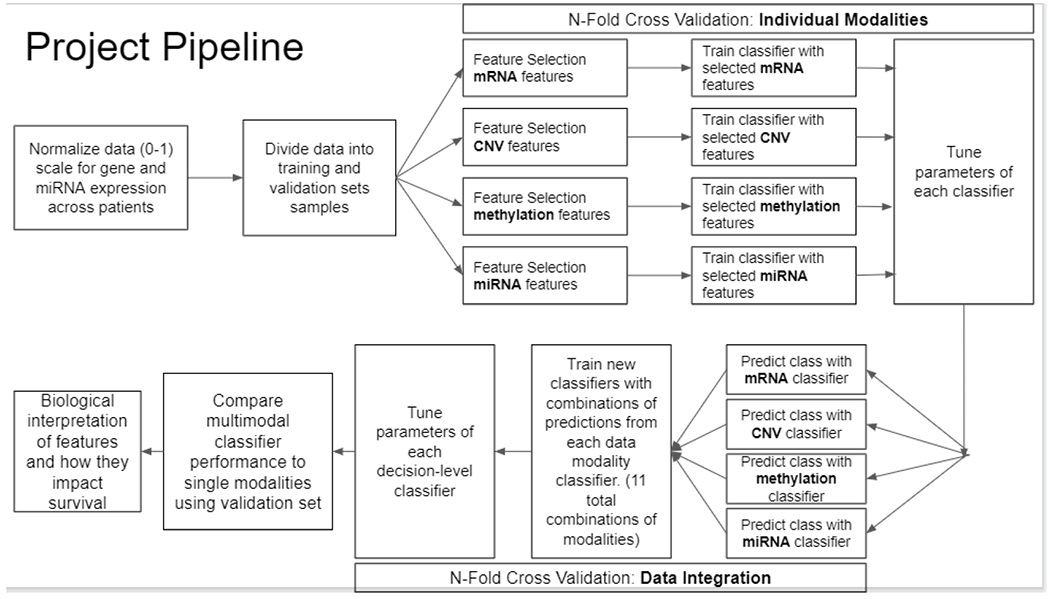
Pipeline for the decision-level integration of multi-omics data for prediction of overall survival of breast cancer patients. We first apply feature selection and predictive modeling in individual modalities, we then integrate the prediction probabilities for each modality at the decision level by training a second classifier.
G. Biomarker Analysis
After completing the model building component of this work, an in-depth literature survey was conducted on the identified gene expression features, methylation features, and miRNA features. Gene set enrichment analysis (GSEA) was further used to understand the biological function of the gene expression and methylation biomarkers at the pathway and disease level. For the methylation features, the corresponding genes associated with each CpG biomarker were used for this analysis. The program Enrichr was used for this purpose and was implemented in R. The gene sets tested for overrepresentation come from the following databases: WikiPathways 2019 Human, KEGG 2019 Human, BioCarta 2016, Reactome 2016, HumanCyc 2016, NCI-Nature 2016, GWAS Catalog 2019, GO Molecular Function 2018, GO Cellular Component 2018, and GO Biological Process 2018. This implementation of GSEA uses a hypergeometric test with a false discovery rate correction for multiple hypothesis testing.
H. Graphical User Interface (GUI)
We have also implemented a graphical user interface (GUI) for our translational decision-level integration pipeline so that that classification can be easily run on new patient samples. The primary output is the predicted probability that a new patient belongs to a given class. Users are given the option to retrain the classifiers with different feature selection methods or to use the ones which performed best. This GUI also allows the users to quickly conduct an internet search of the predictive features, using hyperlinks.
IV. RESULTS
A. Single-Modality Classification
The optimal hyperparameters identified from cross-validation and the performance of each classifier on the test set are presented in Table III. Heatmaps displaying the mean scores across folds for all combinations of parameters were developed (Appendix II).
TABLE III.
Overview of Four Omics Data Modalities
| Modality | Kernel | C | # Fea. | FS | Metrics | ACC | AUC |
|---|---|---|---|---|---|---|---|
| Gene Expression | Sigmoid | 7 | 28 | t-test | ACC | .75 | .74 |
| miRNA Expression | Linear | 1.5 | 20 | Mutual Info | Cohen’s Kappa | .73 | .71 |
| DNA Methylation | RBF | 15 | 54 | Mutual Info | ACC | .61 | .71 |
| CNV | Linear | 5 | 16 | Mutual Info | ACC | .28 | .45 |
As seen in Table III, gene expression produced the best classifier of the individual modalities, yielding the highest predictive accuracy and AUC. Table III further shows the optimal feature selection methods and CV scoring methods that worked best for each of the modalities. It should also be noted that all classifiers performed best after min-max scaling as opposed to the robust Z-transform. Finally, for discretizing the miRNA and methylation data, it was found that cutoffs of one standard deviation and two standard deviations, respectively, produced the best results. During cross-validations, it became evident that as the feature set size increases above 50, classifiers began to overfit. The observation of overfitting with a larger number of features was made clear by the diverging trajectories of the training and test set accuracies and AUCs (Appendix I). As a result, the feature set size hyperparameter was capped-off at the point where divergence begins to take place. This approach ensures that the model does not overfit. In test set accuracy versus training set accuracy plots, we do not see considerable performance drops in accuracy for the test set predictions compared to the training set, which validates that the model is not overfitting (Appendix I).
Lists and literature search results of the final selected features for gene expression, miRNA expression, and methylation can be seen in the tables in Appendix III. CNV features were not further investigated because they failed to classify survival better than random chance. The features highlighted in yellow have previously been denoted as biomarkers predictive of breast cancer survival.
Fig. 6 shows the distributions of the top 10 ranked features for each data modality, respectively. Clear visual distinctions between the distributions for the two classes can be observed for some of the features.
Fig. 6.
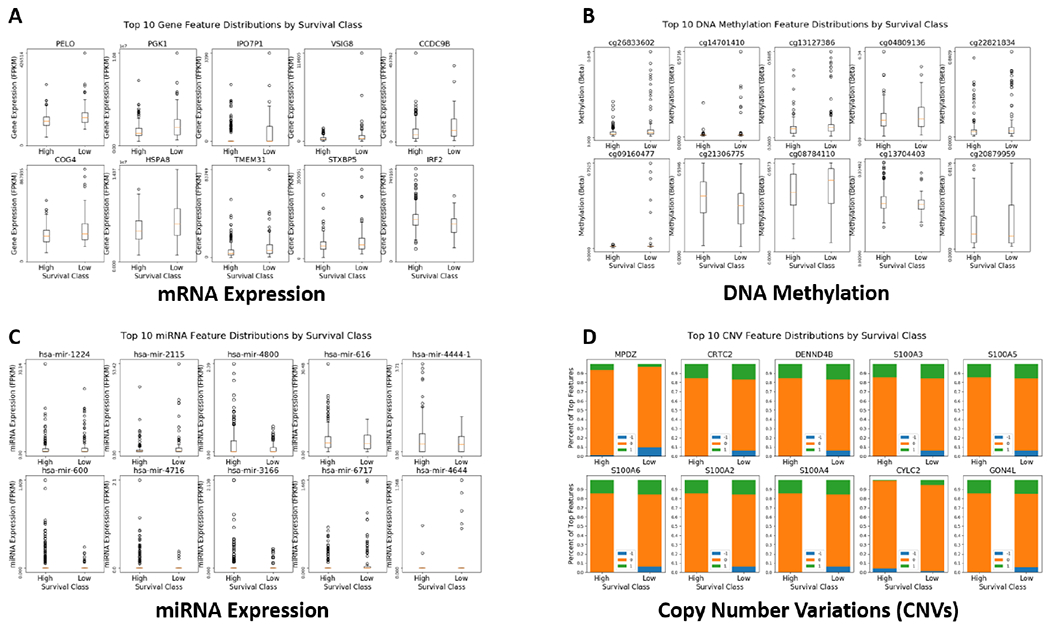
Distributions of the top 10 ranked features, grouped by long and short survival. A. mRNA expression; B. DNA Methylation; C. miRNA expression; D. Copy number variations (CNVs). Note the CNV features are categorical.
Results from the principal component analysis (PCA) performed on the gene expression modality give visual validation that the selected features are able to separate these two survival classes.
B. Multi-Modality Classification
With the four individual-modality classifiers, we have plotted the predicted class probabilities for all samples of the training data set. Histograms of these predicted probabilities and dot plots for combinations of different modality predictions are shown in Fig 7. For the gene expression, miRNA expression, and methylation modalities, a clear separation of classes is evident.
Fig. 7.
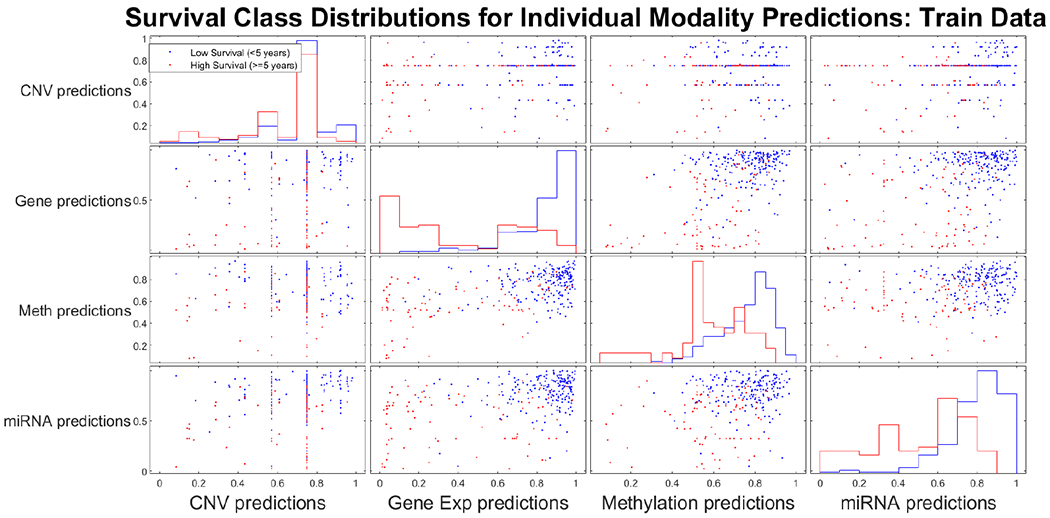
Pair-wise comparison of individual modality classifier prediction distributions.
Using prediction probability results from the individual classifiers as input into training decision-level integrated classifiers, we have observed that the integration of gene expression, miRNA expression, and DNA methylation performed best. The results of all possible combinations are presented in Table IV, and the best three-modality integrated classifier achieved an accuracy of 0.85 and an AUC of 0.87.
TABLE IV.
Integrated classification combination results
| Modalities | Single Data Modality | Two Data Modalities | Three Data Modalities | ALL | |||||||||||
|---|---|---|---|---|---|---|---|---|---|---|---|---|---|---|---|
| mRNA Exp. | ✓ | ✓ | ✓ | ✓ | ✓ | ✓ | ✓ | ✓ | |||||||
| DNA Meth. | ✓ | ✓ | ✓ | ✓ | ✓ | ✓ | ✓ | ||||||||
| CNV | ✓ | ✓ | ✓ | ✓ | ✓ | ✓ | ✓ | ✓ | |||||||
| miRNA Exp. | ✓ | ✓ | ✓ | ✓ | ✓ | ✓ | ✓ | ✓ | |||||||
| ACC | .75 | .62 | .29 | .73 | .81 | .60 | .83 | .79 | .81 | .75 | .71 | .85 | .79 | .81 | .85 |
| AUC | .74 | .71 | .45 | .71 | .80 | .75 | .83 | .71 | .80 | .66 | .78 | .87 | .79 | .79 | .84 |
The optimal hyperparameters for the best performing classifier were C = 0.25, gamma = 1 and a polynomial kernel. Fig 8 shows that the best performing integrated classifier achieves similar accuracies for both training and testing sets.
Fig. 8.
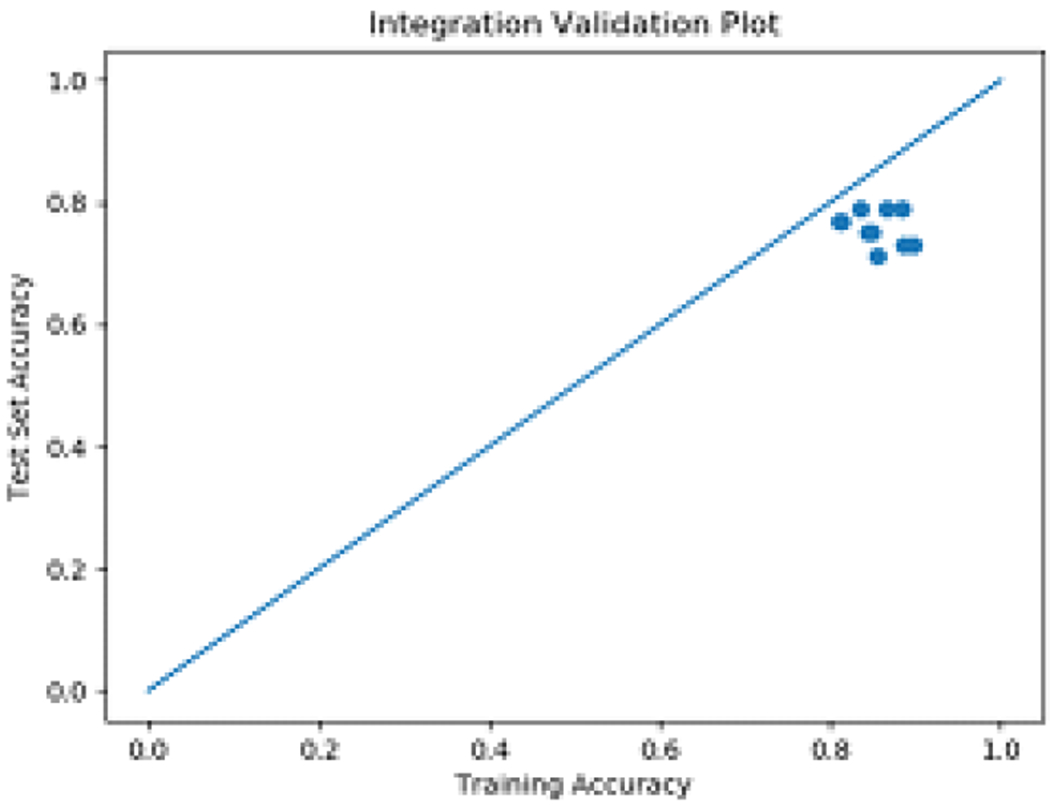
External validation vs. cross-validation performance for the best performing classifier.
We have also plotted Kaplan-Meier survival curves on testing data for each of the individual modalities included in the integrated classifier, as well as the integrated classifier itself (Fig 9). The integrated classifier predicted only 25% of the low survival class in the test group to meet 5-year survival criteria, while none of the individual modality classifiers below 40% of mortality at five years. Finally, ROC curves are presented in Fig 10, which demonstrate that the predictive power of the integrated classifier is considerably higher than that of the three individual classifiers used to create it.
Fig. 9.
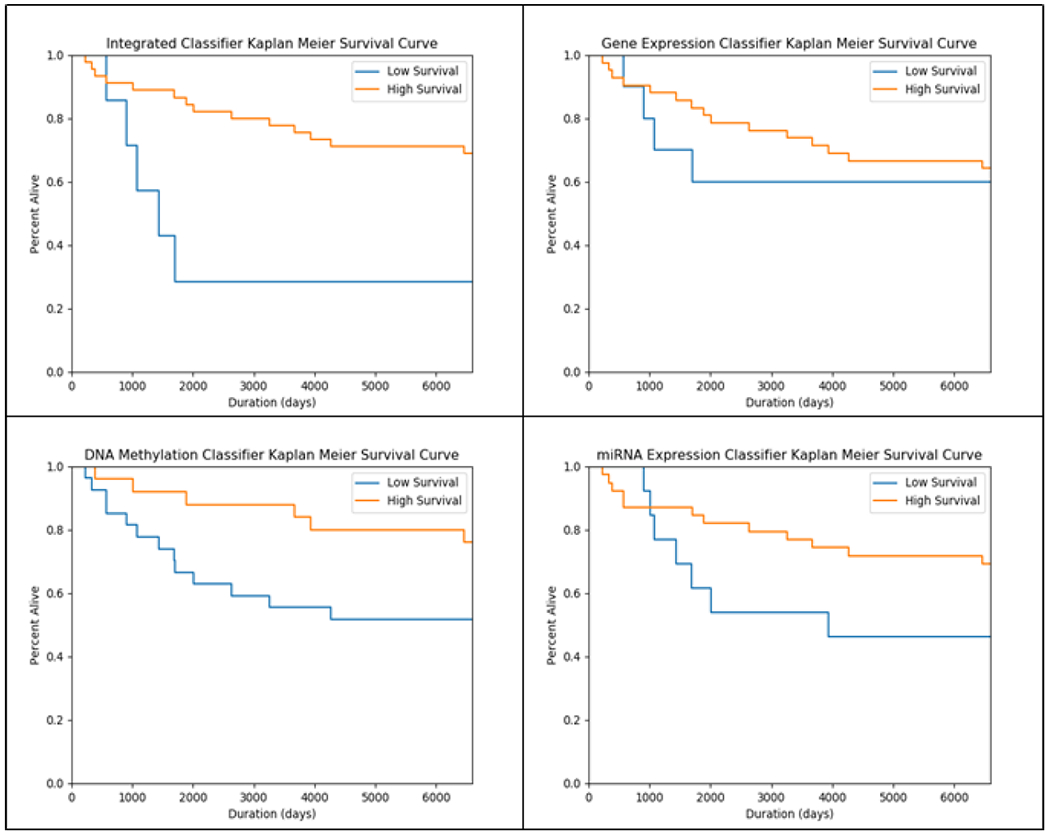
Kaplan Meier Curves for test data classifications (left to right from top-left: Integrated, gene expression, DNA methylation, miRNA expression)
Fig. 10.
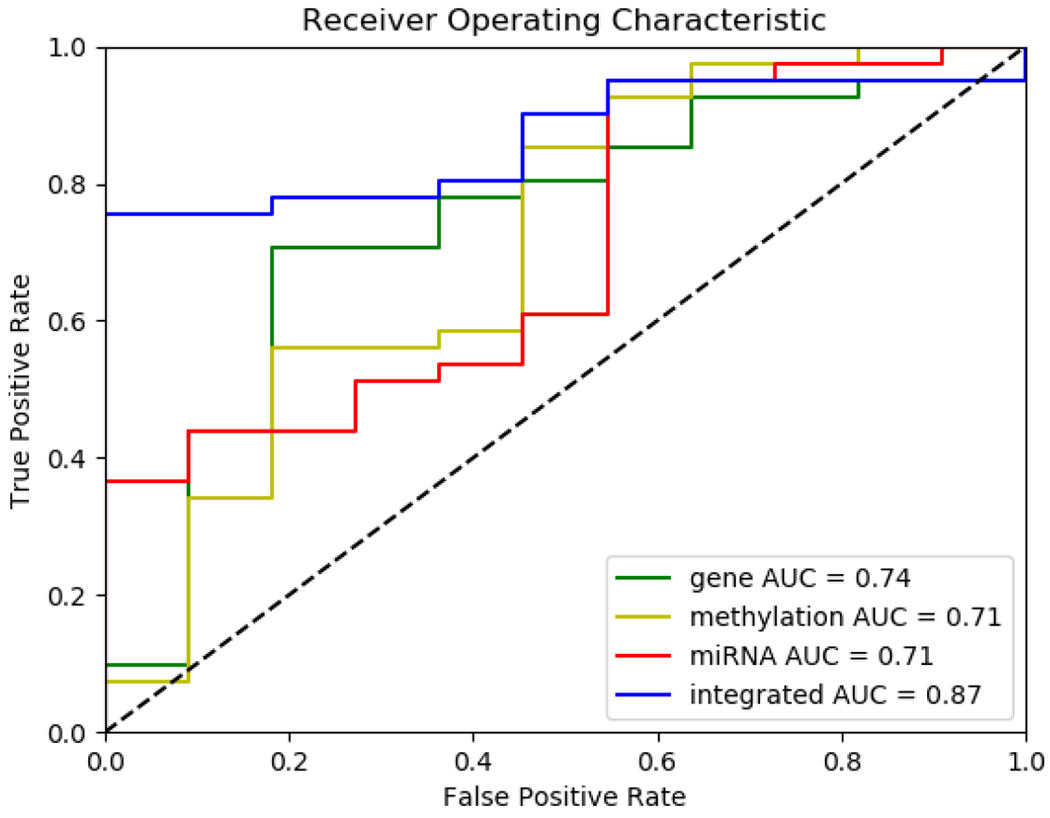
ROC Curves for classifiers (left to right from top-left: Integrated, gene expression, DNA methylation, miRNA expression). The AUC of the integrated model of three modalities outperforms each individual modality.
The best performing three-modality integration classifier was rerun with the linear kernel so that feature weights could be assessed for relative feature importance. Weights of −1.25491653, −1.00702866, and −1.4855812 were seen for methylation, miRNA, and gene expression respectively, which indicates that all three modalities contribute nearly equally to its predictive ability, with gene expression being slightly more important.
Analysis of the weights from the integrated classifier consisting of all four modalities yields weights of −1.93756891, −1.96328007, −2.02687788, and −0.35547507 for methylation, miRNA expression, gene expression, and CNV, respectively. The low weighting assigned to CNV indicates that CNV is not an important modality for predicting survival when combined with other modalities. A similar trend was observed for all other modality combinations with CNV.
C. Biomarkers Validation and GSEA
A table displaying all ranked features selected as biomarkers can be found in Appendix III. Several of the biomarkers identified by our feature selection had been previously reported in the literature as prognostic of breast cancer survival, and these are highlighted in yellow in the table. In the case of the methylation probes, these were first mapped to the corresponding genes that they are in the regulatory region of and then the genes themselves were searched. Many of these biomarker genes were originally identified in a study by Uhlen et al. Their work conducted transcriptomics analysis on 17 types of cancer in nearly 8,000 patients to identify prognostic biomarkers, and these have since been made easily accessible through the Human Protein Atlas [12].
Finally, GSEA revealed several molecular pathways that these biomarkers may be acting through to impact survival (Appendix IV). Specifically, the enrichment analysis shows that sterol binding, cholesterol binding, EGFR signaling, and glycolysis as some of the pathways with the highest significance for enrichment. Notably, differential expression of the PGK enzyme between long and short survival classes resulted in enrichment of the glycolysis pathway as shown in Fig 11. The PGK enzyme converts ADP to ATP as well as 1,3-BPGA to 3-PGA, which is a critical step in cellular energy production. Since pyruvate is the primary molecule later converted to ATP in the mitochondria, this enzyme also acts as a gateway that can control the citric acid cycle.
Fig. 11.
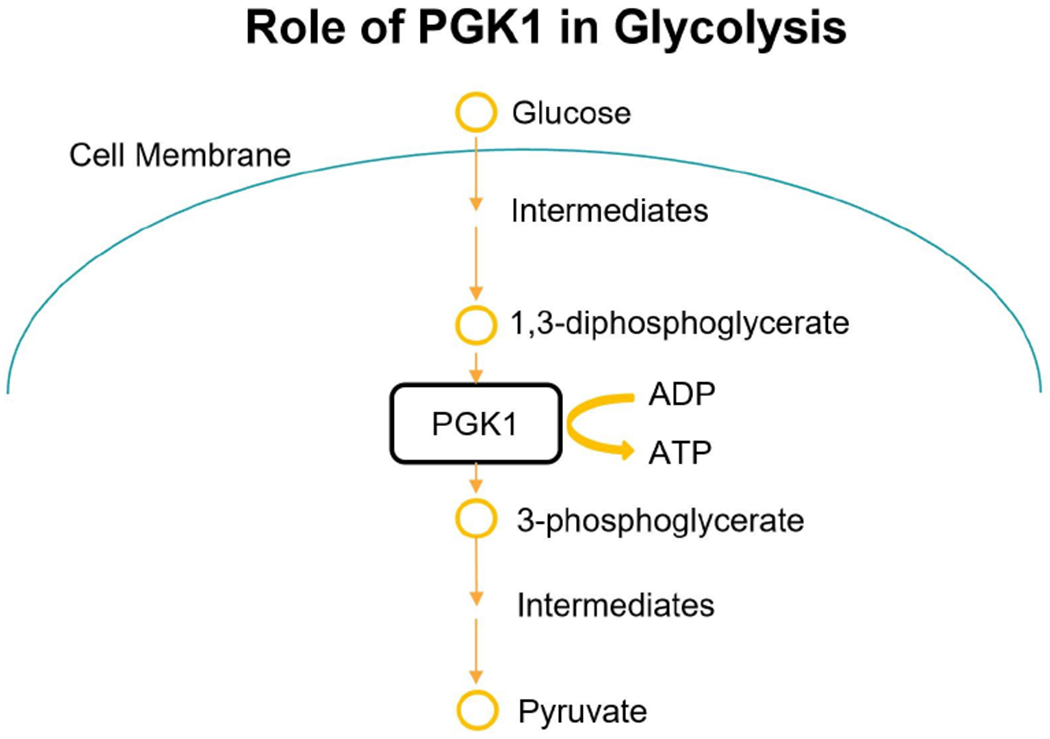
Role of PGK1 in Glycolysis pathway.
D. Demo of the Pipeline with GUI
Fig 12 displays a screen capture of the functional graphical user interface through which the pipeline is accessible. A video demonstration of the GUI can be found at https://drive.google.com/open?id=1SQ86nFxNthXssTPq5AGbDoMeEaXJfIZp.
Fig. 12.
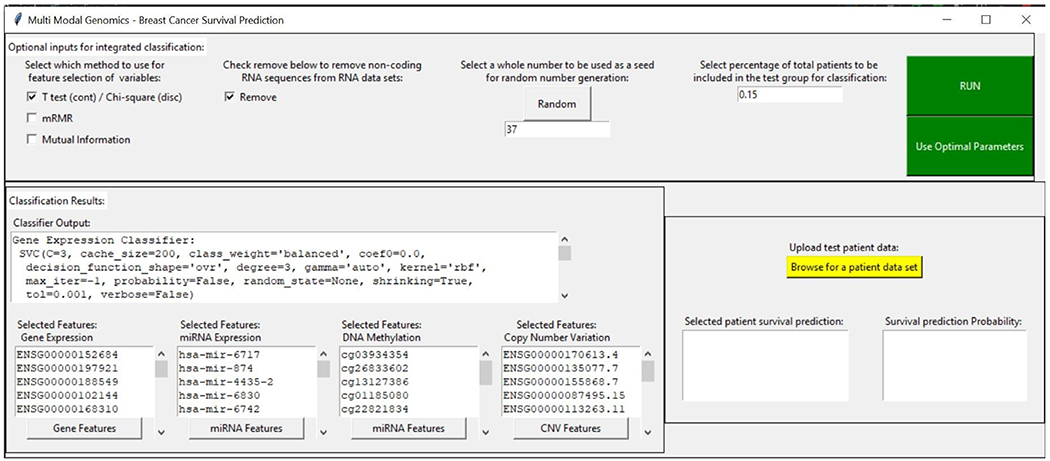
GUI of our translational pipeline for decision-level integration of multi-omics data for overall survival prediction of breast cancer patients.
V. CONCLUSIONS
The best performing classifier was the integration model built using the gene expression, miRNA expression, and methylation classifiers. Individually, these three classifiers performed similarly in terms of accuracy and AUC with gene expression performing slightly better than the other modalities. When the miRNA classifier was combined with the gene expression classifier, the accuracy improved by a similar amount as when the methylation classifier is combined with the gene expression classifier. When all three of these classifiers are combined, the predictive accuracy improves even further. These modality combination studies indicate that each of these three modalities contains at least some prognostic information that cannot be found in the other two modalities. Importantly, all of these classifiers were robust to slight changes in hyperparameters, as is indicated by the smooth gradient evident in all the heatmaps (Appendix II). These classifiers also performed similarly on the test set as on the training set, indicating their ability to generalize well.
The TCGA dataset possessed possible limitations that limited the performance of these models. The relatively small number of patients included is one such limitation. The class distribution was also imbalanced, with significantly more patients belonging to the high survival class. Due to these limitations, the integrated classifier, as well as individual classifiers, would benefit from further training analysis on larger data sets. In analyzing the enriched GSEA pathways, some of these pose potential mechanistic explanations of observed variable patient survival times. The EGFR transactivation pathway could potentially explain the difference in survival times because previous studies have shown this pathway as one of the primary mechanisms explaining acquired resistance to anti-estrogen therapies used for breast cancer [13]. Increased glycolysis may also explain differences in survival times. Some tumors rely on glycolysis for energy production even when the cells have a sufficient supply of oxygen. This phenomenon is known as aerobic glycolysis or theWarburg Effect. Aerobic glycolysis is associated with tumor aggressiveness and decreased survival, potentially explaining the role of the biomarker leading this pathway to be enriched, PGK1 [14].
VI. DISCUSSION AND FUTURE WORK
As future work, we should further validate these predictive classifiers using datasets with more samples. As previously stated, different types of classifiers should also be tested on the CNV data to see if improved performance can be achieved. Furthermore, it is likely that the somewhat arbitrary cutoff of 5-year survival limits the predictive accuracy of the model. It is possible, for example, that patients surviving less than 3 years are more genetically similar than those surviving less than 5. Further exploratory data analysis should be conducted to identify the survival time threshold that maximizes genomic differences between survival groups and minimizes genomic differences within survival groups. On this note, predictive performance could likely be improved by developing separate integrated classifiers using 1, 3, 5, and 7 year survival cutoffs. Then, these classifiers could be used in yet another ensemble classifier to further improve predictions. Wet lab experimentation should also be carried out to validate the presence/absence of the novel prognostic biomarkers identified in this study. Finally, further in vitro studies targeting these biomarkers may yield leads to new therapeutics for breast cancer that can extend patient survival.
Supplementary Material
Acknowledgement
The work was supported in part by grants from the National Center for Advancing Translational Sciences of the National Institute of Health (NIH) under Award UL1TR000454, the National Science Foundation EAGER Award NSF1651360, Children’s Healthcare of Atlanta and Georgia Tech Partnership Grant, Giglio Breast Cancer Research Fund, and Carol Ann and David D. Flanagan Faculty Fellow Research Fund. This work was also supported in part by the scholarship from China Scholarship Council (CSC) under the Grant CSC NO. 201406010343. The content of this article is solely the responsibility of the authors and does not necessarily represent the official views of the NIH.
REFERENCES
- [1].Bray F, Ferlay J, Soerjomataram I, Siegel RL, Torre LA, and Jemal A, “Global cancer statistics 2018: Globocan estimates of incidence and mortality worldwide for 36 cancers in 185 countries,” CA: a cancer journal for clinicians, vol. 68, no. 6, pp. 394–424, 2018. [DOI] [PubMed] [Google Scholar]
- [2].American Cancer Society, “Cancer facts & figures 2019.” https://www.cancer.org/research/cancer-facts-statistics/all-cancer-facts-figures/cancer-facts-figures-2019.html, May 2019.
- [3].National Cancer Institute, “Breast cancer risk in american women.” https://www.cancer.gov/types/breast/risk-fact-sheet, May 2019.
- [4].American Cancer Society, “Survival rates for breast cancer.” https://www.cancer.org/cancer/breast-cancer/understanding-a-breast-cancer-diagnosis/breast-cancer-survival-rates.html#written by, May 2019.
- [5].Sun D, Li A, Tang B, and Wang M, “Integrating genomic data and pathological images to effectively predict breast cancer clinical outcome,” Computer methods and programs in biomedicine, vol. 161, pp. 45–53, 2018. [DOI] [PubMed] [Google Scholar]
- [6].Zhao M, Tang Y, Kim H, and Hasegawa K, “Machine learning with kmeans dimensional reduction for predicting survival outcomes in patients with breast cancer,” Cancer informatics, vol. 17, p. 1176935118810215, 2018. [DOI] [PMC free article] [PubMed] [Google Scholar]
- [7].Goli S, Mahjub H, Faradmal J, Mashayekhi H, and Soltanian A-R, “Survival prediction and feature selection in patients with breast cancer using support vector regression,” Computational and mathematical methods in medicine, vol. 2016, 2016. [DOI] [PMC free article] [PubMed] [Google Scholar]
- [8].Gevaert O, Smet FD, Timmerman D, Moreau Y, and Moor BD, “Predicting the prognosis of breast cancer by integrating clinical and microarray data with bayesian networks,” Bioinformatics, vol. 22, no. 14, pp. e184–e190, 2006. [DOI] [PubMed] [Google Scholar]
- [9].Zhang Y-H, Huang T, Chen L, Xu Y, Hu Y, Hu L-D, Cai Y, and Kong X, “Identifying and analyzing different cancer subtypes using rna-seq data of blood platelets,” Oncotarget, vol. 8, no. 50, p. 87494, 2017. [DOI] [PMC free article] [PubMed] [Google Scholar]
- [10].Jayanthi VSA, Das AB, and Saxena U, “Grade-specific diagnostic and prognostic biomarkers in breast cancer,” Genomics, 2019. [DOI] [PubMed] [Google Scholar]
- [11].Grossman RL, Heath AP, Ferretti V, Varmus HE, Lowy DR, Kibbe WA, and Staudt LM, “Toward a shared vision for cancer genomic data,” New England Journal of Medicine, vol. 375, no. 12, pp. 1109–1112, 2016. [DOI] [PMC free article] [PubMed] [Google Scholar]
- [12].Uhlen M, Zhang C, Lee S, Sj E¨ostedt L. Fagerberg G. Bidkhori R. Benfeitas M Arif Z Liu F. Edfors, et al. , “A pathology atlas of the human cancer transcriptome,” Science, vol. 357, no. 6352, p. eaan2507, 2017. [DOI] [PubMed] [Google Scholar]
- [13].Osborne CK and Schiff R, “Mechanisms of endocrine resistance in breast cancer,” Annual review of medicine, vol. 62, pp. 233–247, 2011. [DOI] [PMC free article] [PubMed] [Google Scholar]
- [14].Vlassenko AG, McConathy J, Couture LE, Su Y, Massoumzadeh P, Leeds HS, Chicoine MR, Tran DD, Huang J, Dahiya S, et al. , “Aerobic glycolysis as a marker of tumor aggressiveness: preliminary data in high grade human brain tumors,” Disease markers, vol. 2015,2015 [DOI] [PMC free article] [PubMed] [Google Scholar]
Associated Data
This section collects any data citations, data availability statements, or supplementary materials included in this article.


