Abstract
Although acetaminophen (ApAP) is one of the most commonly used medicines worldwide, hepatotoxicity is a risk with overdose or in patients with compromised liver function. ApAP overdose is the most common cause of acute fulminant hepatic failure. Oxidation of ApAP to N-acetyl-p-benzoquinone imine (NAPQI) is the mechanism for hepatotoxicity. 1 is a non-hepatotoxic, metabolically unstable lipophilic ApAP analog that is not antipyretic. The newly synthesized 3 is a non-hepatotoxic ApAP analog that is stable, lipophilic, and retains analgesia and antipyresis. Intraperitoneal or po administration of the new chemical entities (NCEs), 3b and 3r, in concentrations equal to a toxic dose of ApAP did not result in the formation of NAPQI. Unlike livers from NCE-treated mice, the livers from ApAP-treated mice demonstrated large amounts of nitrotyrosine, a marker of mitochondrial free radical formation, and loss of hepatic tight junction integrity. Given the widespread use of ApAP, hepatotoxicity risk with overuse, and the ongoing opioid epidemic, these NCEs represent a novel, non-narcotic therapeutic pipeline.
Keywords: Novel acetaminophen/paracetamol analogs, Hepatotoxicity, Analgesia, Antipyresis, APAP-induced liver injury (AILI), Drug-drug interaction (DDI)
Graphical abstract
Abbreviations
- ApAP
acetaminophen
- NAPQI
N-acetyl-p-benzoquinone imine
- NCEs
new chemical entities
- NSAIDs
non-steroidal anti-inflammatory drugs
- acetaminophen, paracetamol, ApAP
N-Acetyl-4-aminophenol
- OTC
over-the-counter
- MOA
mechanism of action
- AM404
N-arachidonoyl-phenolamine
- FAAHs
fatty acid amide hydrolase enzymes
- TRPV1
transient receptor potential vanilloid 1
- CYP450
cytochrome P450
- GSH
glutathione
- Imide
1,1-dioxo-1,2-benzothiazol-3-one moiety
- HepaRG
human liver transformed cell line
- PHH
primary human hepatocyte cells
- LDH
lactate dehydrogenase
- LFTs
liver function tests
- AST
aspartate transaminase
- ALP
alkaline phosphatase
- NAC
N-acetylcysteine
- CFA
Complete Freund’s Adjuvant
- RFU
relative fluorescent units
- EVF
electric von Frey filament
- AILI
acute liver injury
- MRM
multiple reaction monitoring
1. Introduction
Management of acute and chronic pain is one of the most prevalent and costly public health issues worldwide. In the U.S. alone, pain affects more adults than diabetes and cancer combined [1] with an estimated cost of $635 billion to the healthcare system each year [2]. Current analgesics have the potential risk for abuse (e.g., opioids), liver damage (acetaminophen; ApAP), or kidney injury (non-steroidal anti-inflammatory drugs; NSAIDs). A widespread dependence on opioids, particularly following work-related accidents, and high rates of overdose in the U.S. further underscore the need for safer, effective, non-opioid pain medications. In addition to NSAIDs, N-Acetyl-4-aminophenol (acetaminophen, paracetamol, ApAP)(Fig. S1) is the most frequently used over-the-counter (OTC) analgesic and antipyretic drug [3]. Interestingly, the utility of ApAP and NSAIDs over opioids for moderate/severe pain was demonstrated recently in a trial of 416 randomized patients with moderate/severe acute extremity pain; no difference in pain reduction was found at 2 h following a single-dose NSAID and ApAP compared to an opioid/ApAP analgesic combination [4].
Although ApAP has been used for several decades, its precise mechanism of action (MOA) remains unidentified [5,6]. However, increasing evidence indicates that N-arachidonoylaminophenol (AM404) may be fundamental to ApAP’s analgesic effects. In the liver, ApAP is converted to p-aminophenol, which in turn is converted by fatty acid amide hydrolase (FAAH) in the brain in the presence of arachidonic acid to make AM404 (Fig. S1) [7,8]. In the brain, AM404 may exert analgesia via the endogenous cannabinoid system through CB1 receptors [7,9] and activation of the transient receptor potential vanilloid-1 (TRPV1) channel-receptor signaling in the periaqueductal gray area [7]. Remarkably, the FAAH/CB1 receptor/TRPV1 channel triad thought necessary for ApAP analgesia co-locates in this area of the brain [7,10]. Beyond this, the central mechanisms for ApAP’s analgesia are still unknown.
However, ApAP has a narrow therapeutic index, and hepatotoxicity is a significant risk that comes with deliberate (e.g., suicide attempt) or unintentional overuse or use in patients with compromised liver function. In fact, every year around 30,000 patients in the U.S. are hospitalized due to ApAP hepatotoxicity [11]. ApAP hepatotoxicity is linked to the formation of the electrophilic metabolite, N-acetyl-p-benzoquinone imine (NAPQI), through an oxidative process mediated by cytochrome P450 (CYP450), mainly by the CYP2E1 and CYP3A4 isoforms. Normally, NAPQI is neutralized by a Phase II conjugative process, mediated by glutathione (GSH) [12], and eliminated as a mercapturic acid (Fig. S2, Path A). In overdoses, the conjugative Phase II mechanism becomes saturated, resulting in the depletion of GSH stock and a NAPQI reaction using nucleophilic macromolecules; this triggers a cascade of events that results in hepatocellular death (Fig. S2, Path B) [13,14].
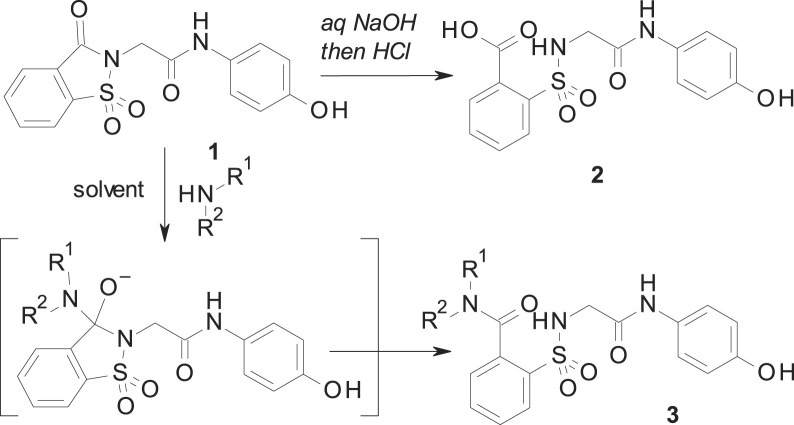
Because of ApAP’s narrow therapeutic index and the clinical demand for safer novel non-opioid analgesics, we undertook a research effort to find ApAP analogs that lacked hepatotoxicity. We created more lipophilic derivatives with the insertion of a 1,1-dioxo-1,2-benzothiazol-3-one moiety (hereafter referred to as “imide”) onto the methyl group of ApAP [15]. Unexpectedly, the resulting compound 1 (Scheme 1 ) maintained the in vivo analgesic profile of ApAP, while hepatotoxicity was considerably decreased; however, 1 is quickly metabolized in vivo into the main metabolite 2. The main metabolite 2 is a comparatively hydrosoluble carboxylic acid facilitating its quick excretion by urine. To modulate the pharmacokinetic profile of 1, a new series of analgesics is now described. These compounds are obtained by the ring opening of the imide moiety in 1 to yield the corresponding N-substituted amides 3 [16]. The synthesis and characterization of the novel class of analogs depicted in 3 are described to identify new chemical entities that lack hepatotoxicity and maintain analgesic and antipyretic properties. Compared to 2, the novel 2-(benzenesulfonamide)-N-(4-hydroxyphenyl) acetamide analogs exhibit increased stability, elevated lipophilicity, and slowed hydrolysis of the amide group.
Scheme 1.
Synthesis of 2 and 3.
2. Results and discussion
2.1. Chemistry
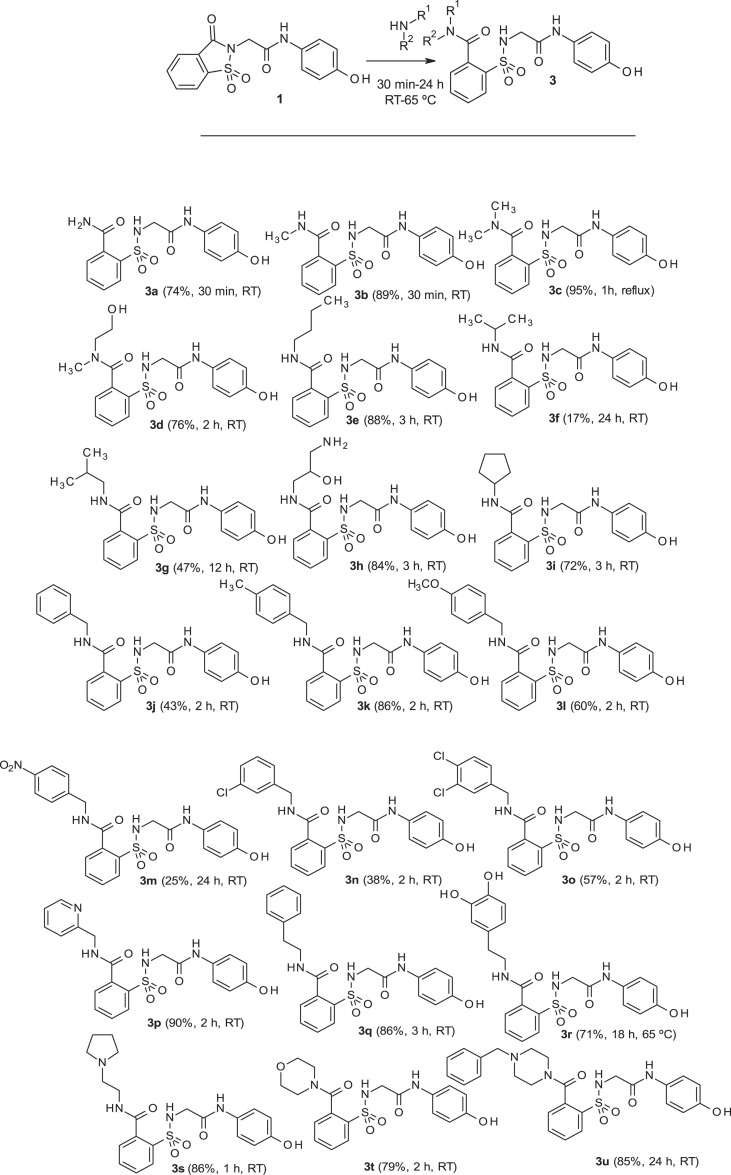
As shown in Scheme 1, the reaction between 1 and different amines produces the opening of the imide ring to give the desired N-substituted amide 3. The corresponding nucleophile (either the hydroxide or the amine) attacks the carbonyl, which is linked to the good leaving sulfonamide group. As a result, this yields either 2 (when sodium hydroxide is used) or 3 (in the case of a reaction with amines) with the intermediate indicated in Scheme 1. These reactions have been carried out mostly in acetonitrile, water or ethanol, depending of the solubility of the reagents. In each case, the reaction was carried out at room temperature, with the exception of compounds 3c (1 h at reflux) and 3r (18 h at 65 °C), until complete disappearance of 1, observed by thin-layer chromatography. Preparation of 1 was carried out by using the previously described procedure [[17], [18], [19]]. Our results and the structure of all prepared compounds are displayed in Scheme 2 and described in detail in the Experimental Section.
Scheme 2.
Synthesis of 3 and 3a–3u derivatives (2-column fitting image).
2.2. In vitro and in vivo hepatotoxicity studies
A total of 21 compounds (3a–3u, see Scheme 2 and Experimental Section) were prepared to test as novel analogs of 2 (the metabolite of ApAP analog 1). A preliminary hepatotoxicity screening for all of these compounds was done in a human liver transformed cell line (HepaRG) and in non-transformed primary human hepatocyte cells (PHH). Hepatocyte toxicity was assayed by measuring the release of lactate dehydrogenase (LDH) and the production of GSH. Additionally, hepatotoxicity was assessed in an in vivo animal model (CD1 male mice) by measuring the effects of toxic ApAP or doses of compound 3 (600 mg/kg) on liver function tests (LFTs). Antipyresis was assessed in a Baker’s yeast-induced pyrexia mouse model. Finally, cytochrome P450 enzyme metabolism assays were performed using Vivid® CYP450 screening assay kits (Life Technologies, Invitrogen/Thermo Fisher Scientific).
We first screened the library of compounds in PHH (Fig. 1 ), and the compounds that consistently proved to have toxicity similar to or worse than ApAP were discarded. A pattern of cell protection was evident; compounds that caused a decrease in hepatic cell death (as measured by low LDH release) also caused an increase in production of GSH. Decreased toxicity was noted for 3b and 3r in comparison to ApAP: LDH release was consistently decreased, and the amount of reduced GSH was consistently increased for 3b and 3r, whereas ApAP led to increased LDH release and depletion of the cytoprotective GSH in a time and dose-dependent manner. The compounds that proved to be hepatotoxic with the initial screening on PHH were not assayed in HepaRGs (Fig. 2 ). In this transformed hepatic cell line, a dose and time-dependent effect of lack of hepatotoxicity was also observed for 3b and 3r but not for ApAP, leading us to focus on these two lead compounds for further in vivo toxicity assays, followed by analgesia and antipyretic models.
Fig. 1.
Hepatotoxicity profile of ApAP and novel compounds 3 in primary human hepatocytes (PHH). LDH release was measured at 3 h, 6 h, and 12 h after exposure of PHH to either (A) 500 μM or (B) 1000 μM of drugs, respectively. Similarly, levels of reduced GSH were measured at 3 h, 6 h, and 12 h after exposure of PHH to (C) 500 μM or (D) 1000 μM of drugs. For the measurement of LDH assay (A and B), Control is LDH-positive control, i.e., solution, which will lyse the plasma membrane and release the maximum amount of LDH into the cell culture medium for the specific cell type in which the cytotoxicity is measured (PHH in this case). For the measurement of GSH assay (C and D), Control is vehicle (1x PBS), which when added to the cells should show the normal level of GSH for the specific cell type in which the cytotoxicity is measured (PHH in this case).
Fig. 2.
Hepatotoxicity profile of ApAP and select novel compounds 3 in HepaRGs. Hepatotoxicity profiles were assayed in the human transformed hepatic cell line, HepaRG, at increasing time points and concentrations. LDH release after incubation with various compounds at 50, 100, 1000 and 5000 μM was measured at time points of 6 h, 12 h, and 24 h, as shown in (A), (B), and (C), respectively. Note that the compounds that proved to be hepatotoxic with the initial screening in PHH were not assayed in HepaRGs. Similarly, levels of reduced GSH were measured at 6 h, 12 h, and 24 h, as shown respectively in (D), (E), and (F), after exposure of various compounds in HepaRG cells under 50, 100, 1000 and 5000 μM of compound. Results from this initial screening led us to choose 3b and 3r for further characterization using in vivo toxicity assays, followed by analgesia and antipyretic models.
Next, a marked reduction in LFTs was noted for 3b and 3r when compared to ApAP in an in vivo model (Fig. 3 ). Increased levels of ALT, aspartate transaminase (AST), and alkaline phosphatase (ALP) were noted in ApAP-treated mice but not in mice treated with equivalent toxic doses (600 mg/kg) of 3b and 3r. Likewise, the effect on renal function was then assessed with large doses of ApAP and the novel compounds, and unlike 3b and 3r, serum creatinine was moderately elevated with 600 mg/kg of ApAP (p < 0.01).
Fig. 3.
In vivo liver function tests (LFTs) and serum creatinine. The liver function assays, (A) alanine aminotransferase, (B) aspartate aminotransferase, and (C) alkaline phosphatase, were carried out with select novel compounds and ApAP, as well as (D) serum creatinine to assess the effects on renal function. Protein levels were measured in serum collected via transcardial perfusion from mice dosed at 600 mg/kg of either ApAP or select novel compounds; n = 5 mice per compound were dosed, and serum was collected. (∗p < 0.0001; #p < 0.01). For all novel compounds screened, measurements of ALT, AST, ALP and serum creatinine levels were comparable to control, i.e., vehicle-injected mice (0.9% NaCl), while the levels for ApAP-injected mice were significantly high.
2.3. Cytochrome P450 metabolism screen
A favorable cytochrome P450 metabolism, especially for 3r, was noted in various P450 isoenzymes, including CYP3A4, CYP2D6 and CYP2E1 (Fig. 4 ), predicting low potential for drug-drug interactions. 3r only inhibits the activity of CYP2E1 and CYP3A4 by approximately 25% compared to 50% for ApAP; 3r has only marginal inhibitory effects on CYP2D6.
Fig. 4.
Favorable cytochrome P450 isozyme profiles for ApAP, 3b, and 3r. Lack of inhibition of cytochrome P450 isozymes, 2D6 and 3A4 for (A) ApAP and the lead compounds (B) 3b and (C) 3r, as evidenced by the 10-point titration curves for the respective compounds. Inhibition for 3r is noted at high concentrations >1000 nM. ApAP and 3b have IC50 values > 10000 nM, as calculated from the 10-point titration curves for the respective compounds for the CYP450 isozymes, 2D6 and 3A4; however, 3r have IC50 values > 10000 nM for 2D6, but the IC50 value calculated for 3A4 is 4820 nM.
2.4. Lack of NAPQI is responsible for the absent hepatotoxicity
Next, we asked whether the reason for the lack of hepatotoxicity was due to a decrease or lack of formation of the toxic quinonimine 8 (NAPQI) by the leading compound 3 compared to ApAP (Fig. 5 .). ApAP-induced hepatotoxicity is related to the formation of the electrophilic reactive metabolite, NAPQI, by CYP2E1 and CYP3A4, which is detoxified through conjugation with GSH (Fig. S2). GSH is an important cellular antioxidant in the liver and GSH depletion is likely an important event in ApAP-induced acute liver injury (AILI), although this mechanism is still poorly understood [20]. Following toxic ApAP doses, GSH depletion is followed by formation of reactive oxygen and nitrogen species, leading to mitochondrial permeability and hepatocyte death [21]. Byproduct 8 is toxic and leads to acute hepatocyte necrosis. A potential mechanism by which these new chemical entities are minimally hepatotoxic is the absence of toxic byproduct 8.
Fig. 5.
Possible oxidation of the leading compound 3 to the corresponding N-acyl-p-benzoquinone imine 8.
As others have done recently [22], we developed a method for NAPQI and 8 detection using ultraperformance liquid chromatography tandem mass spectrometry (LC-MS/MS) in the serum of mice treated with toxic doses (600 mg/kg) of ApAP and our leading compounds. LC-MS/MS detected NAPQI generation by ApAP but not in mice treated with 3b and 3r (Fig. 6 ). Analytes and internal standard responded best to positive ionization with the protonated ions [M + H]+ presenting as major peaks in the fragmentation pattern of mass spectrum for NAPQI (Fig. 6E). The product ion mass spectrum obtained in multiple reaction monitoring (MRM) mode was used to identify NAPQI by monitoring the m/z transition 150.3 → 108.1.
Fig. 6.
NAPQI generation by ApAP but not by 3b and 3r. (A) Serum NAPQI peak is seen at 5.1 min on the chromatogram after ip injection of ApAP but not after injection of compounds 3b and 3r. (B) Samples from ApAP-injected animals (ip) with a standard NAPQI spiked on the sample, demonstrating the same retention time in the chromatogram. (C) Histograms demonstrate that NAPQI is significantly enhanced only after injection of ApAP, regardless of administration route. (D) Administration of the drug via po injection resulted in a mild increase in serum NAPQI; however, this increase is markedly less than the increase after ApAP is injected via the same administration route. (E) The mass spectrum shows the full fragmentation pattern of the NAPQI standard. The molecular structure inside of the spectrum suggests the possible fragments of NAPQI molecules (m/z transition 150.3/108.1) to produce given mass spectrum. (F) NAPQI full fragmentation spectrum obtained from the serum of a mouse that was ApAP injected (ip) shows very good matches to the NAPQI standard, suggesting that the conversion of NAPQI from ApAP was successfully done and able to be measured in the serum.
2.5. Histological evidence for the lack of hepatotoxicity
Hematoxylin and Eosin (H&E)-stained liver sections from CD1 mice after toxic doses (600 mg/kg) of ApAP demonstrate centrilobular hepatic hemorrhagic necrosis, but a healthy liver architecture was maintained with 3b and 3r (Fig. 7 ).
Fig. 7.
Lack of hepatotoxicity of compounds 3b and 3r. (A) Hematoxylin and Eosin-stained liver sections (100x). Centrilobular hepatic hemorrhagic necrosis is evident after exposure of male CD1 mice to toxic doses (600 mg/kg) ApAP via po injection, but not compounds 3b or 3r. Note that a healthy liver architecture if maintained with compounds 3b and 3r. (B) Nitrotyrosine-labeled hepatic sections (100x). (C) (Zonula Occludens-1 (ZO-1) staining demonstrating the loss of “chicken wire” hepatic tight junctions, which exist between hepatocytes. Flat, 2-dimensional hepatocyte cultures show clear “chicken wire” tight junction labeling with ZO-1, a constituent protein. ZO-1 labeled sections of vehicle (0.9% NaCl) control, ApAP, 3b, and 3r (all 200x) show good ZO-1 label (brown bands, white arrows); however, the ZO-1 bands tend to run out of the section plane (these are liver sections). Note the very dark ZO-1 labeling around the small associate blood vessels. (D) 3-dimensional stacking of Zo-1 staining (1000x) for sections from vehicle (0.9% NaCl) control, ApAP, 3b, and 3r. (E) Cell death was observed in ApAP-treated mice, unlike in the vehicle (0.9% NaCl) treated controls or in the 3b- or 3r-treated mice, as assessed by TUNEL-positive nuclear staining for apoptosis (all 200x). (For interpretation of the references to colour in this figure legend, the reader is referred to the Web version of this article.)
Staining for nitrotyrosine, a marker of mitochondrial free radical formation and hepatocyte injury, correlated with the centrilobular necrosis noted on the H&E stains. Loss of hepatic tight junctions, which has been recently implicated as a topographical mechanism in ApAP-induced hepatotoxicity [23], was noted in ApAP-treated mice with loss of ‘chicken wire’ hepatic tight junctions, but this was preserved with 3b and 3r. A large number of apoptotic nuclei were noted in ApAP-treated animals but not in 3b and 3r. Lastly, Kaplan-Meier survival curves were generated using four groups (n = 20 per group) of male CD1 mice exposed to 600 mg/kg po of either ApAP, 3b, 3r, or 0.9% NaCl (Vehicle) (Fig. 8 ). Survival was calculated by counting mice every 4 h for a duration of 48 h; 3b, 3r, and vehicle only showed no fatalities while ApAP had only 30% survival at 48 h.
Fig. 8.
Kaplan-Meier survival curves upon exposure to different compounds. Male CD1 mice were injected (ip) with either 0.9% NaCl (vehicle), ApAP, 3b, or 3r, all at concentrations of 600 mg/kg n = 20 mice per group. All 20 mice treated with vehicle, 3b, and 3r were alive after 48 h (100% survival); however, only 6 mice treated with ApAP were alive after 48 h (30% survival, p < 0.0001).
2.6. Analgesia and antipyresis
Next, we sought to determine whether 3b and 3r have comparable analgesic and antipyretic properties to ApAP. Analgesia was assessed utilizing the visceral pain acetic acid-induced abdominal writhing assay [24] in CD1 male mice. Abdominal contraction (writhing) is induced in mice by an ip injection of 0.4% acetic acid at a dose of 10 mL/kg, 25 min after drug administration at concentrations of 0–80 mg/kg (Fig. 9 A–C; associated scatter plots (Fig. 8D–F)). Comparable analgesia was found for ApAP, 3b, and 3r with ED50 of 68.6 μmol/kg, 45.2 μmol/kg, and 14.7 μmol/kg, respectively (Fig. 9A). Analgesia was further assessed using the von Frey assay hyperalgesia model (Fig. 11) in male Sprague Dawley rats for ApAP, 3b, and 3r. In this Complete Freund’s Adjuvant (CFA) inflammatory pain model, dose response curve and ED50 values were also similar to ApAP (245.1 μmol/kg), 3b (197.5 μmol/kg) and 3r (176.6 μmol/kg) (Fig. 9B). Finally, antipyresis was assessed utilizing a Baker’s yeast-induced hyperthermia model in CD1 mice (n = 10 for each compound (Fig. 9G), revealing similar antipyretic effects of 3b and 3r to ApAP; all were reduced compared to control (p < 0.0001) at 6 h post-drug administration.
Fig. 9.
Analgesia and antipyretic assays. The Abdominal Acetic Acid Writhing Assay counts the number of writhes for a period of 10 min 30 min after administration of (A) ApAP, (B) 3b, and (C) 3r with corresponding scatter plots of individual animals for (D) ApAP, (E) 3b and (F) 3r. Each drug was tested for analgesia using this assay at doses 5, 10, 20, 40, and 80 mg/kg respectively and dose response curves were generated and ED50 values for ApAP, 3b, and 3r calculated from them as shown in (Fig. 9A). The decrease in the number of writhes by a drug were compared to the number of writhes in mice injected with vehicle (0.9% NaCl) and analyzed for statistical significance with a one-way ANOVA followed Sidak’s multiple comparisons post-hoc test. p < 0.05 was considered as statistically significant. (G) Summary of Baker’s yeast-induced pyresis. The number of animals per group, n = 10. Baseline temperatures for each mouse was recorded, and then baker’s yeast (pyrogen) was injected to each mouse. 4 h after yeast administration there was comparable fever development in all groups. ApAP effectively reduced fever, as did compounds 3b and 3r at 2 h after drug injection (6-h time point). The decrease in temperature at 2 h after drug administration, were compared to the elevated temperature at 4 h after yeast injection (fever) and analyzed for statistical significance with a one-way ANOVA followed Sidak’s multiple comparisons post-hoc test. p < 0.05 was considered as statistically significant.
Fig. 11.
The von Frey assay demonstrates analgesia for compounds 3b, 3r, and ApAP. Refer to the Experimental Protocols and Procedures for details. (A) Latencies for the withdrawal of the left hind foot injected with complete Freund’s adjuvant (CFA) for each drug. The baseline latency for each group dropped to about 20 after plantar injection of CFA, which increased with 3b, 3r and ApAP. (B) Latencies for the withdrawal of the right hind foot (un-injected control) of CFA injected animals for each drug. (C) Similarly, latencies for the withdrawal of the left hind foot injected with 0.9% NaCl (vehicle). (D) Latencies for the withdrawal of the right hind foot (un-injected control) of 0.9% NaCl (vehicle) injected animals. Changes of the withdrawal thresholds or latencies induced by a drug were analyzed for statistical significance with a one-way ANOVA followed Sidak’s multiple comparisons post-hoc test. For ApAP, 4 doses at 10, 32, 100 and 320 mg/kg respectively were tested. These doses were selected, as they were each ½ log dose higher than the previous one, so as to facilitate generating a complete dose response curve and ED50 values were calculated. For 3b and 3r, 32 and 100 mg/kg doses were selected and ED50 values were calculated from them data shown in (Fig. 10B).
3. Materials and methods
3.1. Synthesis and characterization for compounds: 3a–3u
Reagents of the highest commercial quality were purchased and used without further purification unless otherwise stated. Reactions were monitored by thin-layer chromatography carried out on 0.25 mm E. Merck silica gel plates (60FS-254) using UV light for visualization. Column chromatography was performed using silica gel (60 F254, 70–200 mm) as the stationary phase. All melting points were determined in open capillary tubes on a Stuart Scientific SMP3 melting point apparatus. 1H and 13C NMR spectra were recorded on a Varian Gemini 200, Varian Mercury VX-300, Varian Unity 300 or Varian Unity 500 MHz spectrometer at room temperature. Chemical shifts are given in ppm (δ) downfield from TMS. Coupling constants (J) are in hertz (Hz), and signals are described as follows: s, singlet; d, doublet; t, triplet; br, broad; m, multiplet; ap, apparent, etc. Analysis of the NMR FIDs was performed using Mestrenova 6.0.2 software. HPLC-MS was recorded on an Agilent 1100 MSD-Q yielding the ESI, and chromatographic analysis was performed to determine purity of the products using an Agilent 1200 with DAD detector coupled with an MS Hewlett Packard MSD 1100 (Column C18 Luna, 100 mm × 4.6 mm x 3 μm; Elution gradient: Phase A: water with 0.1% of formic acid; Phase B: MeOH with 0.1% of formic acid. The analysis starts with 5% of B and reaches 100% of B in 20 min. Flow: 1 mL/min with Split 1; 2 for MS detection. UV wavelengths: 214.254 nm. Mass Detection: Scan 50–1000 m/z. High-resolution analysis (TOF) was performed on an Agilent 6210 time-of-flight LC/MS. 2-Chloro-N-(4-hydroxyphenyl) acetamide 6 and N-(4-hydroxyphenyl)-2-(1,1,3-trioxo-1,2-benzothiazol-2-yl)acetamide 1 have been previously described [15].
3.1.1. 2-[[2-(4-hydroxyanilino)-2-oxo-ethyl]sulfamoyl]benzamide (3a)

Compound 1 (0. 332 g, 1 mmol) was added to an ammonium hydroxide aqueous solution (28–30% wt., 3.3 mL). The mixture was stirred for 30 min at room temperature. Evaporation under reduced pressure gave a solid, which was washed with distilled water (4 mL). The white solid was dried under vacuum and crystallized from ethyl acetate to supply 2-[[2-(4-hydroxyanilino)-2-oxo-ethyl]sulfamoyl]benzamide 3a (0.258 g, 74%); with a 99.2% purity using the standard chromatographic analysis; mp 61–63 °C; 1H NMR (200 MHz; CD3OD; Me4Si) δ 3.82 (2 H, s, CH 2), 6.69 (2 H, dd, J = 6.8, 2.1 Hz, Harom), 7.18 (2 H, dd, J = 6.8, 2.1 Hz, Harom), 7.30–7.50 (1 H, bs, NH), 7.52–7.75 (3 H, m), 7.75–7.95 (3 H, m), 8.25 (1 H, bs, NH), 9.18 (1 H, bs, NH), 9.75 (1 H, s, OH); 13C NMR (75 MHz; CD3OD; Me4Si) δ 47.1, 116.1, 123.4, 130.2, 130.3, 130.7, 131.3, 134.1, 136.8, 138.3, 155.6, 168.6, 173.7; Anal calcd for C15H15N3O5S: C 51.57, H 4.33, N 12.03; found: C 51.77, H 4.55, N 12.26; HRMS (ESI-TOF) m/z calcd. for C15H16N3O5 32S [M + H]+ 350.0803 found: 350.0853.
3.1.2. 2-[[2-(4-Hydroxyanilino)-2-oxo-ethyl]sulfamoyl]-N-methylbenzamide (3b)

Compound 1 (0.332 g, 1 mmol) was added to a methylamine aqueous solution (40% wt., 5 mL, 72 mmol). The mixture was stirred for 30 min at room temperature. Evaporation under reduced pressure gave a solid. Purification by chromatography [silica gel, ethyl acetate/hexane (9:1)]. The white solid was dried under vacuum and crystallized from ethyl acetate/hexane to supply 2-[[2-(4-hydroxyanilino)-2-oxo-ethyl]sulfamoyl]-N-methylbenzamide 3b (0.323 g, 89%); with a 99.5% purity using the standard chromatographic analysis; mp 93–95 °C; 1H NMR (300 MHz; DMSO‑d 6; Me4Si) δ 2.80 (3 H, d, J = 4.5 Hz, CH 3), 3.66 (2 H, s, CH 2), 6.63 (2 H, d, J = 8.8 Hz, Harom), 7.20 (2 H, d, J = 8.8 Hz, Harom), 7.49 (1 H, bs, NH), 7.52–7.67 (3 H, m), 7.86 (1 H, d, J = 7.4 Hz), 8.69 (1 H, bd, J = 3.8 Hz, NH), 9.17 (1 H, bs, NH), 9.74 (1 H, s, OH); 13C NMR (75 MHz; DMSO‑d 6; Me4Si) δ 26.3, 45.9, 115.0, 121.0, 128.6, 129.2, 129.9, 130.0, 132.8, 135.8, 136.8, 153.5, 165.3, 168.7; Anal calcd for C16H17N3O5S: C 52.88, H 4.72, N 11.56; found: C 52.97, H 4.95, N 11.26; HRMS (ESI-TOF) m/z calcd. for C16H18N3O5 32S [M + H]+ 364.0959 found: 364.0971.
3.1.3. 2-[[2-(4-hydroxyanilino)-2-oxo-ethyl]sulfamoyl]-N,N-dimethylbenzamide (3c)
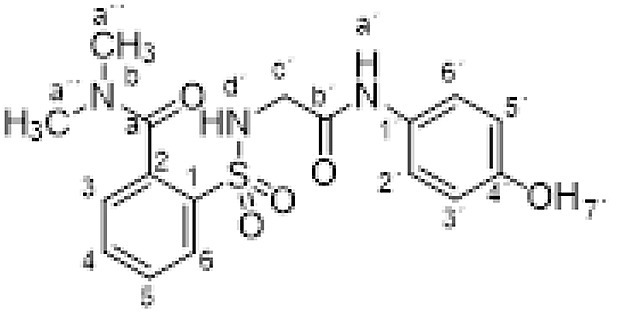
Compound 1 (0.332 g, 1 mmol) in acetonitrile (3 mL) was added to a solution of dimethylamine in THF (2 M, 3.5 mL, 7 mmol). The mixture was refluxed with stirring for 1 h. Evaporation under reduced pressure gave an oil. Purification by chromatography [silica gel, ethyl acetate/hexane (9:1)]. The white solid was triturated with CH2Cl2 to supply 2-[[2-(4-hydroxyanilino)-2-oxo-ethyl]sulfamoyl]-N,N-dimethylbenzamide 3c (0.358 g, 95%); with a 99.3% purity using the standard chromatographic analysis; mp 186–188 °C; 1H NMR (300 MHz; DMSO‑d 6; Me4Si) δ 2.74 (3 H, s, CH 3), 2.98 (3 H, s, CH 3), 3.62 (2 H, bs, CH 2), 6.63 (2 H, d, J = 8.8 Hz, Harom), 7.21 (2 H, d, J = 8.8 Hz, Harom), 7.41 (1 H, d, J = 7.3 Hz), 7.51–7.68 (3 H, m), 7.90 (1 H, d, J = 7.3 Hz), 9.17 (1 H, bs, OH), 9.67 (1 H, s, NH); 13C NMR (75 MHz; DMSO‑d 6; Me4Si) δ 34.9, 39.0, 46.1, 115.5, 121.5, 128.0, 129.0, 129.8, 130.5, 133.4, 135.8, 136.8, 154.0, 165.9, 169.4; HRMS (ESI-TOF) m/z calcd. for C17H20N3O5 32S [M + H]+ 378.1115 found: 378.1140.
3.1.4. 2-[[2-(4-hydroxyanilino)-2-oxo-ethyl]sulfamoyl]-N-(2-hydroxyethyl)-N-methyl- benzamide (3d)
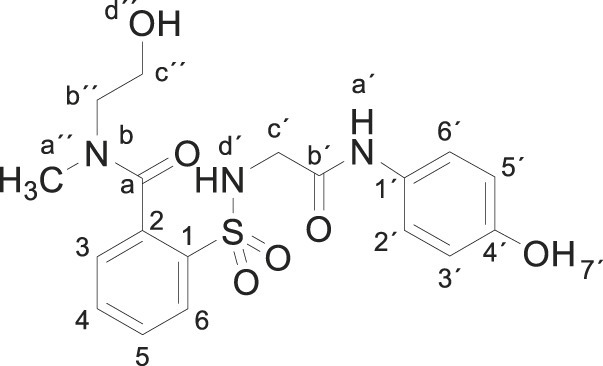
Compound 1 (0.332 g, 1 mmol) was added to a solution of N-methylethanolamine (0.150 g, 0.16 mL, 2 mmol) in acetonitrile/ethanol (6:4) (8 mL). The mixture was stirred for 2 h at room temperature. Evaporation under reduced pressure gave a solid. Purification by chromatography [silica gel, ethyl acetate/hexane (9:1)], and crystallization from ethyl acetate/hexane furnished 2-[[2-(4-hydroxyanilino)-2-oxo-ethyl]sulfamoyl]-N-(2-hydroxyethyl)-N-methylbenzamide 3d (0.310 g, 76%); with a 99.6% purity using the standard chromatographic analysis; mp 108–110 °C; 1H NMR (300 MHz; DMSO‑d 6; Me4Si) δ 2.80, 3.04 (3 H, s, CH 3, mixture of rotamers), 3.19–3.74 (6 H, m), 6.62 (2 H, d, J = 8.9 Hz, Harom), 7.21 (2 H, d, J = 8.9 Hz, Harom), 7.46 (1 H, t, J = 8.9 Hz), 7.53–7.69 (2 H, m), 7.87–7.92 (1 H, m), 9.16 (1 H, bs, NH), 9.66 (1 H, s, OH); 13C NMR (75 MHz; CD3OD; Me4Si) (mixture of rotamers) δ 33.4, 38.8, 46.9, 50.9, 54.4, 59.7, 60.0, 116.0, 123.5, 128.9. 129.7, 130.1, 130.2, 130.8, 134.2, 134.4, 136.2, 136.6, 137.8, 137.9, 155.6, 168.6, 172.1, 172.2; HRMS (ESI-TOF) m/z calcd. for C18H22N3O6 32S [M + H]+ 408.1220 found: 408.1256.
3.1.5. N-butyl-2-[[2-(4-hydroxyanilino)-2-oxo-ethyl]sulfamoyl]benzamide (3e)
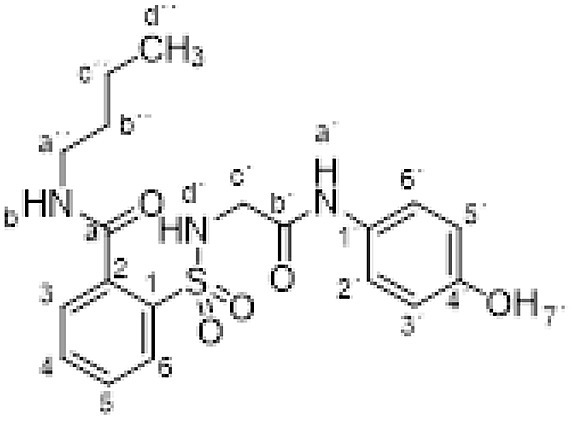
Compound 1 (0.332 g, 1 mmol) was added to a solution of n-butylamine (0.146 g, 0.20 mL, 2 mmol) in acetonitrile (5 mL). The mixture was stirred for 3 h at room temperature. Evaporation under reduced pressure gave a solid. Purification by chromatography [silica gel, ethyl acetate/hexane (8:2)], and crystallization from ethyl acetate/hexane furnished N-butyl-2-[[2-(4-hydroxyanilino)-2-oxo-ethyl]sulfamoyl]benzamide 3e as a white solid (0.357g, 88%); with a 99.3% purity using the standard chromatographic analysis; mp 68–69 °C; 1H NMR (300 MHz; DMSO‑d 6; Me4Si) δ 0.90 (3 H, t, J = 7.2 Hz, CH 3), 1.34–1.39 (2 H, m, CH 2), 1.39–1.41 (2 H, m, CH 2), 3.25–3.31 (2 H, m, CH 2), 3.65 (2 H, d, J = 3.6 Hz CH 2), 6.62 (2 H, d, J = 8.9 Hz, Harom), 7.19 (2 H, d, J = 8.9 Hz, Harom), 7.43 (1 H, bs, NH), 7.51 (1 H, d, J = 7.3 Hz), 7.58–7.70 (2 H, m), 7.86 (1 H, d, J = 7.6 Hz), 8.75 (1 H, t, J = 3.6 Hz, NH), 9.21 (1 H, s, NH), 9.76 (1 H, s, OH); 13C NMR (75 MHz; CD3OD; Me4Si) δ 14.1, 21.2, 32.2, 40.8, 47.1, 116.1, 123.4, 130.1, 130.2, 130.8, 131.1, 134.1, 137.3, 138.3, 155.5, 168.5, 171.1; Anal calcd for C19H23N3O5S: C 56.28, H 5.72, N 10.36; found: C 55.92, H 5.46, N 9.99; HRMS (ESI-TOF) m/z calcd. for C19H24N3O5 32S [M + H]+ 406.1427 found: 406.1476.
3.1.6. 2-[[2-(4-hydroxyanilino)-2-oxo-ethyl]sulfamoyl]-N-isopropylbenzamide (3f)
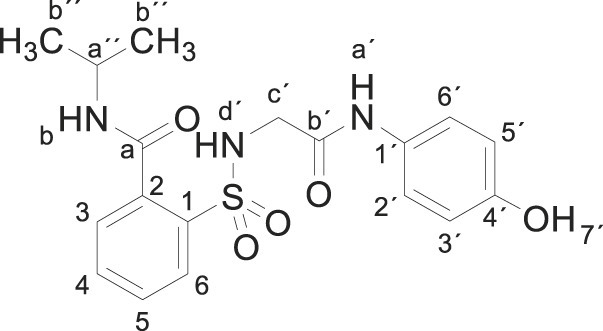
Compound 1 (0.332 g, 1 mmol) was added to a solution of isopropylamine (0.118 g, 0.17 mL, 2 mmol) in acetonitrile/ethanol (8:2) (8 mL). The mixture was stirred for 24 h at room temperature. Evaporation under reduced pressure gave a solid. Purification by chromatography [silica gel, ethyl acetate/hexane (8:2)], and crystallization from ethyl acetate/hexane furnished 2-[[2-(4-hydroxyanilino)-2-oxo-ethyl]sulfamoyl]-N-isopropylbenzamide 3f as a white solid (0.067 g, 17%); with a 99.2% purity using the standard chromatographic analysis; mp 84–85 °C; 1H NMR (300 MHz; DMSO‑d 6; Me4Si) δ 1.16 (6 H, d, J = 6.8 Hz, 2CH 3) δ 3.65 (2H, s, CH 2), 4.00–4.13 (1 H, m, CH), 6.63 (2 H, d, J = 8.9 Hz, Harom), 7.20 (2 H, d, J = 8.9 Hz, Harom), 7.40 (1 H, bs, NH), 7.50 (1 H, dd, J = 7.0, 1.5 Hz), 7.57–7.68 (2 H, m), 7.86 (1 H, dd, J = 7.4, 1.5 Hz), 8.64 (1 H, bd, J = 7.7 Hz, NH), 9.18 (1 H, s, NH), 9.75 (1 H, s, OH); 13C NMR (75 MHz; CD3OD; Me4Si) δ 22.4, 43.3, 47.2, 116.0, 123.3, 130.0, 130.6, 130.8, 133.9, 137.2, 138.0, 155.4, 168.4, 170.1; HRMS (ESI-TOF) m/z calcd. for C18H22N3O5 32S [M + H]+ 392.1271 found: 382.1280.
3.1.7. 2-[[2-(4-hydroxyanilino)-2-oxo-ethyl]sulfamoyl]-N-isobutylbenzamide (3g)
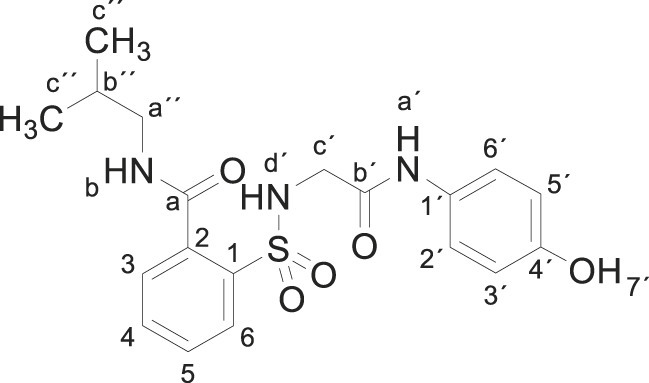
Compound 1 (0.332 g, 1 mmol) was added to a solution of isobutylamine (0.146 g, 0.20 mL, 2 mmol) in acetonitrile (2.5 mL). The mixture was stirred for 3 h at room temperature. Evaporation under reduced pressure gave a solid. Purification by chromatography [silica gel, ethyl acetate/hexane (8:2)] and crystallization from ethyl acetate/hexane furnished 2-[[2-(4-hydroxyanilino)-2-oxo-ethyl]sulfamoyl]-N-isobutylbenzamide 3g as a white solid (0.340g, 84%); with a 99.4% purity using the standard chromatographic analysis; mp 79–80 °C; 1H NMR (300 MHz; DMSO‑d 6; Me4Si) δ 0.92 (6 H, d, J = 6.4 Hz, 2CH 3), 1.82–1.97 (1 H, m, CH), 3.04–3.11 (2 H, m, CH 2), 3.65 (2 H, s, CH 2), 6.63 (2 H, d, J = 8.9 Hz, Harom), 7.20 (2 H, d, J = 8.9 Hz, Harom), 7.41 (1 H, bs, NH), 7.54 (1 H, dd, J = 7.0, 1.5 Hz), 7.57–7.68 (2 H, m), 7.87 (1 H, dd, J = 7.4, 1.5 Hz), 8.81 (1 H, t, J = 5.5 Hz, NH), 9.18 (1 H, s, NH), 9.75 (1 H, s, OH)); 13C NMR (75 MHz; CD3OD; Me4Si) δ 20.7, 29.5, 47.2, 48.6, 116.1, 123.4, 130.2, 130.3, 130.8, 131.1, 134.1, 137.3, 138.3, 155.6, 168.5, 171.2; HRMS (ESI-TOF) m/z calcd. for C19H24N3O5 32S [M + H]+ 406.1427 found: 406.1439.
3.1.8. N-(3-amino-2-hydroxypropyl)-2-[[2-(4-hydroxyanilino)-2-oxo-ethyl]sulfamoyl] benzamide (3h)
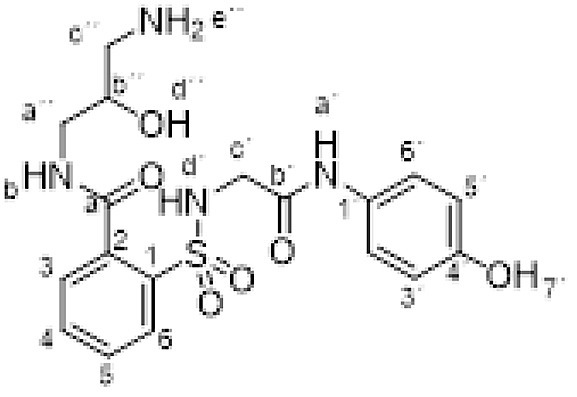
Compound 1 (0.332 g, 1 mmol) was added to a solution of 1,3-diamino-2-propanol (0.180 g, 2 mmol) in ethanol (5 mL). The mixture was stirred for 12 h at room temperature. Evaporation under reduced pressure gave a solid. Purification by chromatography [silica gel, methanol/Et3N (60:40)], and crystallization from ethanol/ethyl acetate furnished compound 3h (0.198 g, 47%); with a 99.6% purity using the standard chromatographic analysis; mp 185–187 °C; 1H NMR (200 MHz; CD3OD; Me4Si) δ 2.82–3.05 (2 H, m), 3.40–3.61 (2 H, m), 3.85 (2 H, s, CH 2), 3.90–4.02 (1 H, m, CH), 6.68 (2 H, d, J = 8.5 Hz, Harom), 7.12 (2 H, d, J = 8.5 Hz, Harom), 7.51–7.74 (3 H, m), 7.99 (1 H, d, J = 6.8 Hz); 13C NMR (125 MHz; DMSO‑d 6; Me4Si) δ 42.7, 44.2, 45.8, 69.1, 114.5, 120.5, 127.9, 128.9, 129.2, 129.4, 131.8, 135.3, 137.0, 153.0, 165.7, 167.7; Anal calcd for C18H22N4O6S: C 51.18, H 5.25, N 13.26; found: C 51.42, H 5.09, N 13.47; HRMS (ESI-TOF) m/z calcd. for C18H23N4O6 32S [M + H]+ 423.1338 found: 423.1339.
3.1.9. N-cyclopentyl-2-[[2-(4-hydroxyanilino)-2-oxo-ethyl]sulfamoyl]benzamide (3i)
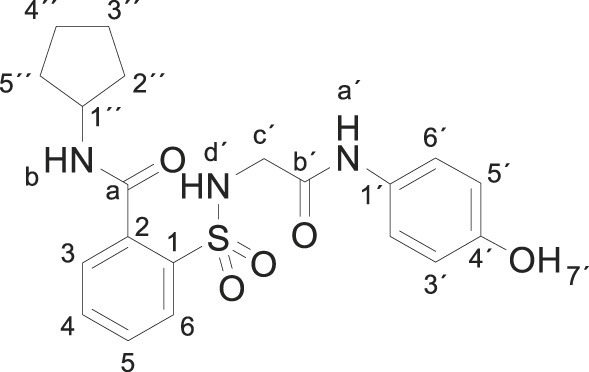
Compound 1 (0.332 g, 1 mmol) was added to a solution of cyclopentylamine (0.170 g, 0.20 mL, 2 mmol) in acetonitrile (2.5 mL). The mixture was stirred for 3 h at room temperature. Evaporation under reduced pressure gave a solid. Purification by chromatography [silica gel, ethyl acetate/hexane (8:2)] and crystallization from ethyl acetate/hexane furnished N-cyclopentyl-2-[[2-(4-hydroxyanilino)-2-oxo-ethyl]sulfamoyl] benzamide 3i as a white solid (0.301 g, 72%); with a 99.3% purity using the standard chromatographic analysis; mp 81–82 °C; 1H NMR (300 MHz; DMSO‑d 6; Me4Si) δ 1.43–1.72 (6 H, m), 1.73–1.93 (2 H, m), 3.64 (2 H, s, CH 2), 4.10–4.24 (1 H, m, CH), 6.61 (2 H, d, J = 8.7 Hz, Harom), 7.18 (2 H, d, J = 8.7 Hz, Harom), 7.38 (1 H, bs, NH), 7.49 (1 H, d, J = 7.5 Hz), 7.54–7.65 (2 H, m), 7.84 (1 H, d, J = 7.5 Hz), 8.68 (1 H, d, J = 7.2 Hz, NH), 9.15 (1 H, s, NH), 9.72 (1 H, s, OH); 13C NMR (75 MHz; CD3OD; Me4Si) δ 24.9, 33.2, 47.1, 53.1, 116.1, 123.4, 130.12, 130.22, 130.7, 131.0, 134.1, 137.3, 138.1, 155.5, 168.5, 170.7; HRMS (ESI-TOF) m/z calcd. for C20H24N3O5 32S [M + H]+ 418.1427 found: 418.144.
3.1.10. N-benzyl-2-[[2-(4-hydroxyanilino)-2-oxo-ethyl]sulfamoyl]benzamide (3j)
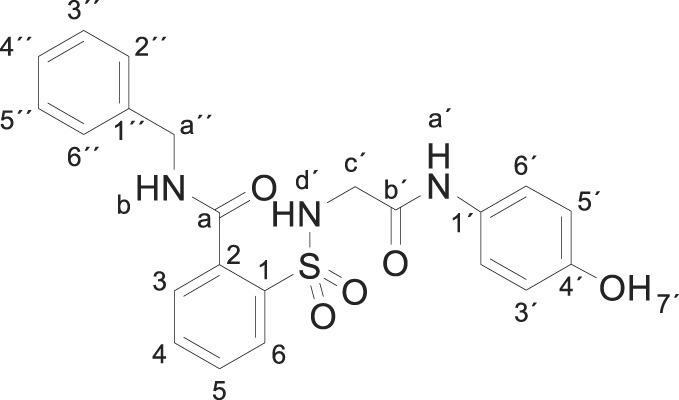
Compound 1 (0.332 g, 1 mmol) was added to a mixture of benzylamine (0.214 g, 0.22 mL, 2 mmol) in water (5 mL). The mixture was stirred for 2 h at room temperature. Evaporation under reduced pressure gave a solid. Purification by chromatography [silica gel, CH2Cl2/ethyl acetate (8:2)] and crystallization from ethyl acetate/hexane furnished N-benzyl-2-[[2-(4-hydroxyanilino)-2-oxo-ethyl]sulfamoyl]benzamide 3j (0.189 g, 43%); with a 99.3% purity using the standard chromatographic analysis; mp 87–88 °C; 1H NMR (300 MHz; DMSO‑d 6; Me4Si) δ 3.67 (2 H, s, CH 2), 4.50 (2 H, d, J = 5.7 Hz, CH 2), 6.62 (2 H, d, J = 8.6 Hz, Harom), 7.19 (2 H, d, J = 8.6 Hz, Harom), 7.25 (1 H, t, J = 7.2 Hz), 7.34 (2 H, t, J = 7.9 Hz), 7.41 (2 H, d, J = 7.3 Hz), 7.44 (1 H, bs, NH), 7.61–7.75 (3 H, m), 7.89 (1 H, d, J = 7.6 Hz), 9.20 (1 H, s, NH), 9.30 (1 H, bt, J = 5.7 Hz, NH), 9.75 (1 H, s, OH); 13C NMR (75 MHz; DMSO‑d 6; Me4Si) δ 43.1, 46.4, 115.4, 121.4, 127.3, 127.7, 128.7, 129.1, 129.8, 130.4, 130.5, 133.3, 135.9, 137.4, 139.3, 153.9, 165.7, 168.7; Anal calcd for C22H21N3O5S: C 60.12, H 4.82, N 9.56; found: C 60.26, H 5.05, N 9.54; HRMS (ESI-TOF) m/z calcd. for C22H22N3O5 32S [M + H]+ 440.1271 found: 440.1243.
3.1.11. 2-[[2-(4-hydroxyanilino)-2-oxo-ethyl]sulfamoyl]-N-[(4-methylphenyl) methylbenzamide (3k)
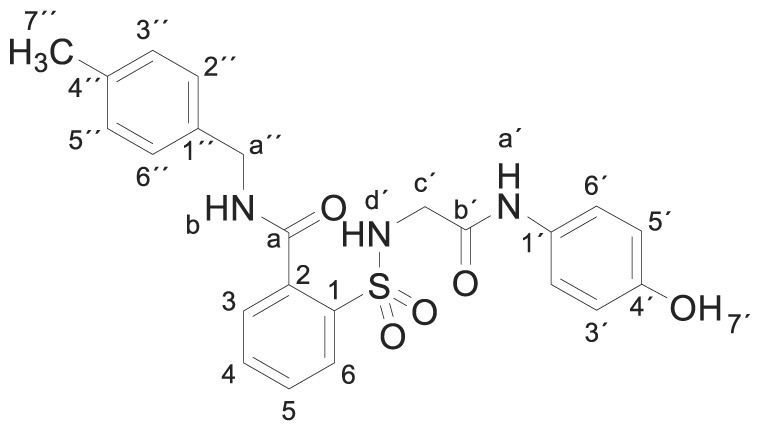
Compound 1 (0.332 g, 1 mmol) was added to a mixture of 4-methylbenzylamine (0.242 g, 0.25 mL, 2 mmol) in acetonitrile (2.5 mL). The mixture was stirred for 2 h at room temperature. Evaporation under reduced pressure gave a solid. Purification by chromatography [silica gel, ethyl acetate/hexane (8:2)] and crystallization from ethyl acetate/hexane furnished 2-[[2-(4-hydroxyanilino)-2-oxo-ethyl]sulfamoyl]-N-(p-tolylmethyl)benzamide 3k (0.390 g, 86%); with a 99.6% purity using the standard chromatographic analysis; mp 75–76 °C; 1H NMR (300 MHz; DMSO‑d 6; Me4Si) δ 2.27 (3 H, s, CH 3), 3.68 (2 H, s, CH 2), 4.45 (2 H, d, J = 6.0 Hz, CH 2), 6.62 (2 H, d, J = 8.7 Hz, Harom), 7.13 (2 H, d, J = 8.0 Hz), 7.18 (2 H, d, J = 8.7 Hz), 7.28 (2 H, d, J = 8.0 Hz), 7.45 (1 H, bs, NH), 7.53–7.71 (3 H, m), 7.89 (1 H, d, J = 7.5 Hz), 9.17 (1 H, s, NH), 9.26 (1 H, bt, J = 6.0 Hz, NH), 9.75 (1 H, s, OH); 13C NMR (75 MHz; DMSO‑d 6; Me4Si) δ 20.7, 42.4, 46.0, 115.0, 120.9, 127.3, 128.7, 128.8, 129.4, 130.0, 130.1, 132.8, 135.5, 135.8, 135.9, 136.9, 153.5, 165.3, 168.3. HRMS (ESI-TOF) m/z calcd. for C23H24N3O5 32S [M + H]+ 454.1427 found: 454.1439.
3.1.12. 2-[[2-(4-hydroxyanilino)-2-oxo-ethyl]sulfamoyl]-N-[(4-methoxyphenyl) methylbenzamide (3l)
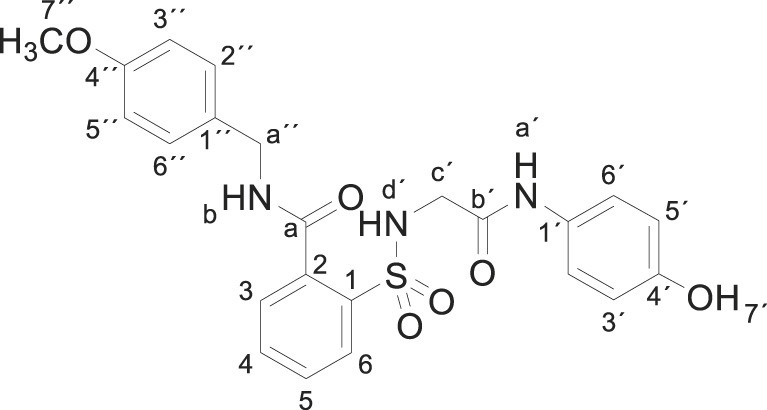
Compound 1 (0.332 g, 1 mmol) was added to a mixture of 4-methoxybenzylamine (0.274 g, 0.26 mL, 6 mmol) in acetonitrile (5 mL). The mixture was stirred for 2 h at room temperature. Evaporation under reduced pressure gave a solid. Purification by chromatography [silica gel, ethyl acetate/hexane (80:20)] and crystallization from ethyl acetate/hexane furnished 2-[[2-(4-hydroxyanilino)-2-oxo-ethyl]sulfamoyl]-N-[(4-methoxyphenyl)methylbenzamide 3l (0.281 g, 60%) as a white solid; with a 99.2% purity using the standard chromatographic analysis; mp 70–71 °C; 1H NMR (200 MHz; DMSO‑d 6; Me4Si) δ 3.67 (2 H, d, J = 4.7 Hz, CH 2), 3.73 (3 H, s, OCH 3), 4.43 (2 H, d, J = 5.1 Hz, CH 2), 6.62 (2 H, d, J = 8.9 Hz, Harom), 6.89 (2 H, d, J = 8.3 Hz), 7.18 (2 H, d, J = 8.9 Hz, Harom), 7.32 (2 H, d, J = 8.3 Hz), 7.45 (1 H, bt, J = 4.7 Hz, NH), 7.59–7.77 (3 H, m), 7.89 (1 H, d, J = 8.5 Hz), 9.18 (1 H, bs, NH), 9.24 (1 H, bt, J = 5.1 Hz, NH), 9.75 (1 H, s, NH); 13C NMR (75 MHz; CD3OD; Me4Si) δ 44.1, 47.1, 55.7, 114.9, 116.0, 123.4, 130.1, 130.3, 130.4, 130.8, 131.2, 131.6, 134.1, 137.1, 138.5, 155.6, 160.5, 168.6, 170.9; HRMS (ESI-TOF) m/z calcd. for C23H24N3O6 32S [M + H]+ 470.1376 found: 470.1343.
3.1.13. 2-[[2-(4-hydroxyanilino)-2-oxo-ethyl]sulfamoyl]-N-[(4-nitrophenyl) methylbenzamide (3m)
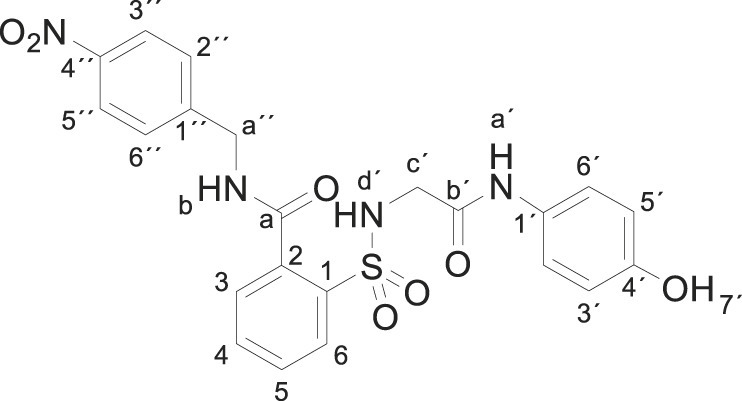
4-Nitrobenzylamine hydrochloride (0.376 g, 2 mmol) was basified in the presence of a saturated solution of Na2CO3 in water. After extraction with EtOAc and drying (Na2SO4), the resulting oil was dissolved in acetonitrile (5 mL) and compound 1 (0.332 g, 1 mmol) was added. The mixture was stirred for 24 h at room temperature. Evaporation under reduced pressure gave a solid. Purification by chromatography [silica gel, ethyl acetate] and crystallization from ethyl acetate/hexane furnished compound 2-[[2-(4-hydroxyanilino)-2-oxo-ethyl]sulfamoyl]-N-[(4-nitrophenyl) methylbenzamide 3m (0.121 g, 25%) as a white solid; with a 99.4% purity using the standard chromatographic analysis; mp 228–229 °C; 1H NMR (300 MHz; acetone-d 6; Me4Si) δ 3.68 (2 H, s, CH 2), 4.80 (2 H, d, J = 5.3 Hz, CH 2), 6.62 (2 H, d, J = 8.5 Hz, Harom), 7.11 (1 H, bs, NH), 7.31 (2 H, d, J = 8.5 Hz, Harom), 7.73–7.79 (5 H, m), 7.91 (1 H, d, J = 7.2 Hz), 8.15 (s, 1H, NH), 8.22 (2 H, d, J = 8.5 Hz), 8.71 (1 H, bs, NH), 9.17 (1 H, s, OH); 13C NMR (75 MHz; DMSO‑d 6; Me4Si) δ 41.9, 45.4, 114.6, 120.6, 123.0, 127.9, 128.3, 128.9, 129.5, 129.9, 132.4, 134.4, 136.5, 146.1, 146.5, 153.1, 164.9, 168.2; Anal calcd for C22H29N4O7S: C 54.54, H 4.16, N 11.56; found: C 54.55, H 4.39, N 11.21; HRMS (ESI-TOF) m/z calcd. for C22H21N4O7 32S [M + H]+ 485.1121 found: 485.1128.
3.1.14. N-[(3-chlorophenyl)methyl]-2-[[2-(4-hydroxyanilino)-2-oxo-ethyl]sulfamoyl] benzamide (3n)
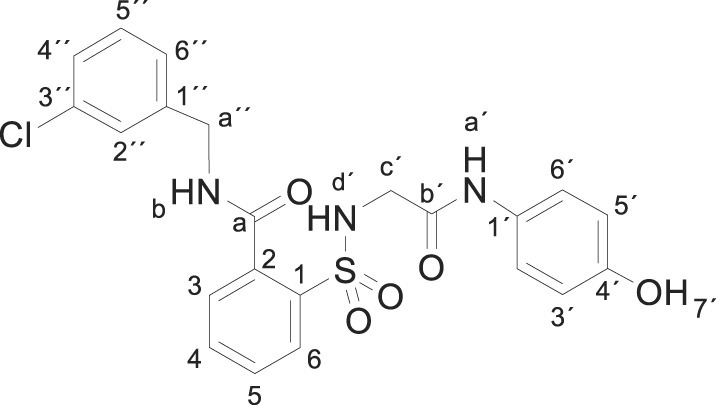
Compound 1 (0.332 g, 1 mmol) was added to a mixture of 3-chlorobenzylamine (0.283 g, 0.24 mL, 2 mmol) in acetonitrile (5 mL). The mixture was stirred for 2 h at room temperature. Evaporation under reduced pressure gave a solid. Purification by chromatography [silica gel, ethyl acetate] and crystallization from ethyl acetate/hexane furnished N-[(3-chlorophenyl)methyl]-2-[[2-(4-hydroxyanilino)-2-oxo-ethyl]sulfamoyl]benzamide 3n (0.180 g, 38%), as a white solid; with a 99.3% purity using the standard chromatographic analysis; mp 64–65 °C; 1H NMR (300 MHz; DMSO‑d 6; Me4Si) δ 3.68 (2 H, s, CH 2), 4.51 (2 H, d, J = 5.9 Hz, CH 2), 6.62 (2 H, d, J = 8.7 Hz, Harom), 7.18 (2 H, d, J = 8.7 Hz, Harom), 7.31–7.41 (4 H, m), 7.48 (1 H, s), 7.60–7.71 (3 H, m), 7.90 (1 H, d, J = 7.2 Hz), 9.18 (s, 1H, NH), 9.34 (1 H, t, J = 5.9 Hz, NH), 9.75 (1 H, s, OH); 13C NMR (75 MHz; DMSO‑d 6; Me4Si) δ 42.1, 45.9, 114.9, 120.8, 125.8, 126.7, 127.0, 128.5, 129.2, 129.8, 129.9, 130.0, 132.7, 132.9, 135.1, 136.8, 141.2, 153.3, 165.0, 168.3; Anal calcd for C22H20ClN3O5S: C 55.76, H 4.25, N 8.87; found: C 55.42, H 4.56, N 8.61; HRMS (ESI-TOF) m/z calcd. for C22H21 35ClN3O5 32S [M + H]+ 474.0881 found: 474.0905.
3.1.15. N-[(3,4-dichlorophenyl)methyl]-2-[[2-(4-hydroxyanilino)-2-oxo-ethyl]sulfamoyl] benzamide (3o)
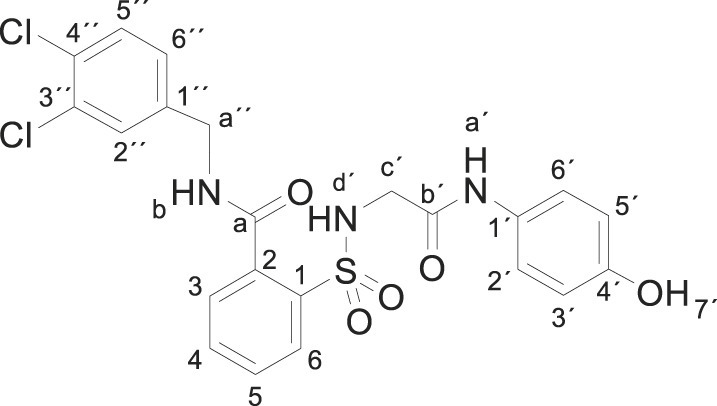
Compound 1 (0.332 g, 1 mmol) was added to a mixture of 3,4-dichlorobenzylamine (0.352 g, 0.27 mL, 2 mmol) in acetonitrile (5 mL). The mixture was stirred for 2 h at room temperature. Evaporation under reduced pressure gave a solid. Purification by chromatography [silica gel, ethyl acetate/hexane (8:2)], and crystallization from ethyl acetate/hexane furnished N-[(3,4-dichlorophenyl)methyl]-2-[[2-(4-hydroxyanilino)-2-oxo-ethyl]sulfamoyl]benzamide 3o (0.290 g, 57%) as a white solid; with a 99.5% purity using the standard chromatographic analysis; mp 98–99 °C; 1H NMR (300 MHz; DMSO‑d 6; Me4Si) δ 3.68 (2 H, s, CH 2), 4.49 (2 H, d, J = 5.9 Hz, CH 2), 6.64 (2 H, d, J = 8.7 Hz, Harom), 7.17 (2 H, d, J = 8.7 Hz, Harom), 7.38 (1 H, d, J = 8.4 Hz), 7.53–7.74 (5 H, m), 7.88 (1 H, d, J = 7.5 Hz), 9.19 (s, 1H, NH), 9.32 (1 H, t, J = 5.9 Hz, NH), 9.71 (1 H, s, OH); 13C NMR (75 MHz; CD3OD; Me4Si) δ 43.4, 47.1, 116.1, 123.3, 128.6, 130.2, 130.4, 130.7, 130.8, 131.4, 131.5, 131.9, 133.3, 134.2, 136.6, 138.5, 140.5, 155.5, 168.5, 171.2; Anal calcd for C22H19Cl2N3O5S: C 51.98, H 3.77, N 8.27; found: C 51.83, H 4.01, N 8.11; HRMS (ESI-TOF) m/z calcd. for C22H20 35Cl2N3O5 32S [M + H]+ 508.0491 found: 508.0497.
3.1.16. 2-[[2-(4-hydroxyanilino)-2-oxo-ethyl]sulfamoyl]-N-(2-pyridylmethyl)benzamide (3p)
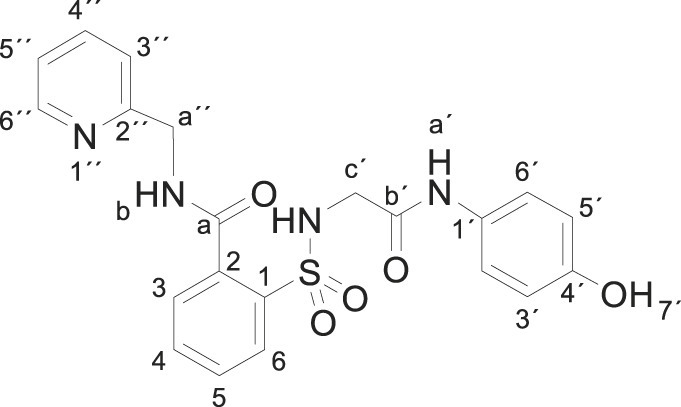
Compound 1 (0.332 g, 1 mmol) was added to a mixture of 2-picolylamine (0.216 g, 0.21 mL, 2 mmol) in acetonitrile (2.5 mL). The mixture was stirred for 2 h at room temperature. Evaporation under reduced pressure gave a solid. Purification by chromatography [silica gel, ethyl acetate/ethanol (7:3)] and crystallization from ethanol/ethyl acetate furnished 2-[[2-(4-hydroxyanilino)-2-oxo-ethyl]sulfamoyl]-N-(2-pyridylmethyl)benzamide 3p (0.396 g, 90%) as a white solid; with a 99.2% purity using the standard chromatographic analysis; mp 141–142 °C; 1H NMR (300 MHz; DMSO‑d 6; Me4Si) δ 3.76 (2 H, s, CH 2), 4.63 (2 H, d, J = 4.9 Hz, CH 2), 6.61 (2 H, d, J = 8.7 Hz, Harom), 7.11 (2 H, d, J = 8.7 Hz, Harom), 7.30 (1 H, dd, J = 7.6, 5.0 Hz, HPyr), 7.50 (1 H, d, J = 7.9 Hz, HPyr), 7.58–7.76 (3 H, m), 7.80 (1 H, dt, J = 7.7, 1.6 Hz, HPyr), 7.89 (1 H, d, J = 7.6 Hz), 8.22 (bs, 1H, NH), 8.54 (1 H, d, J = 5.0 Hz, HPyr), 9.19 (1 H, s, NH), 9.37 (1 H, t, J = 4.9 Hz, NH), 9.77 (1 H, s, OH); 13C NMR (75 MHz; CD3OD; Me4Si) δ 45.6, 46.9, 115.9, 123.2, 123.3, 123.7, 130.2, 130.3, 130.5, 131.0, 133.9, 136.9, 138.3, 138.8, 149.3, 155.4, 158.3, 168.5, 170.7; HRMS (ESI-TOF) m/z calcd. for C21H21N4O5 32S [M + H]+ 441.1223 found: 441.1237.
3.1.17. 2-[[2-(4-hydroxyanilino)-2-oxo-ethyl]sulfamoyl]-N-(2-phenylethyl)benzamide (3q)
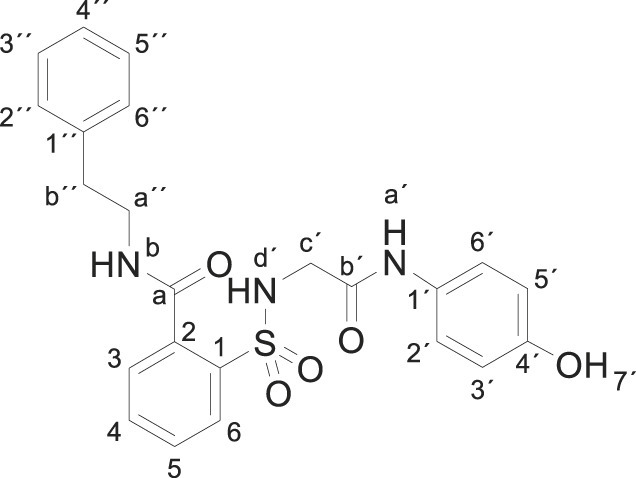
Compound 1 (0.332 g, 1 mmol) was added to a mixture of 2-phenethylamine (0.242 g, 0.25 mL, 2 mmol) in acetonitrile/ethanol (6:4) (8 mL). The mixture was stirred for 3 h at room temperature. Evaporation under reduced pressure gave a solid. Purification by chromatography [silica gel, CH2Cl2/ethyl acetate (8:2)], and crystallization from ethyl acetate/hexane furnished 2-[[2-(4-hydroxyanilino)-2-oxo-ethyl]sulfamoyl]-N-(2-phenylethyl)benzamide 3q (0.363 g, 86%) as a white solid; with a 99.5% purity using the standard chromatographic analysis; mp 102–103 °C; 1H NMR (300 MHz; DMSO‑d 6; Me4Si) δ 2.85 (2 H, t, J = 7.2 Hz, CH 2), 3.47 (2 H, q, J = 7.2 Hz, CH 2), 3.66 (2 H, bs, CH 2), 6.62 (2 H, d, J = 8.7 Hz, Harom), 7.18 (2 H, d, J = 8.7 Hz, Harom), 7.22–7.33 (5 H, m), 7.37–7.48 (2 H, m), 7.54–7.68 (2 H, m), 7.86 (1 H, d, J = 8.7 Hz), 8.86 (1 H,bt, J = 5.4 Hz, NH), 9.17 (1 H, s, NH), 9.74 (1 H, s, OH); 13C NMR (75 MHz; CD3OD; Me4Si) δ 36.1, 42.6, 47.1, 116.1, 123.4, 127.4, 129.5, 130.0, 130.2, 130.3, 130.8, 131.1, 134.1, 137.1, 138.3, 140.6, 155.6, 168.5, 171.1. HRMS (ESI-TOF) m/z calcd. for C23H24N3O5 32S [M + H]+ 454.1427 found: 454.1441.
3.1.18. N-[2-(3,4-dihydroxyphenil)ethyl]-2-[[2-(4-hydroxyanilino)-2-oxo-ethyl]sulfamoyl] benzamide (3r)
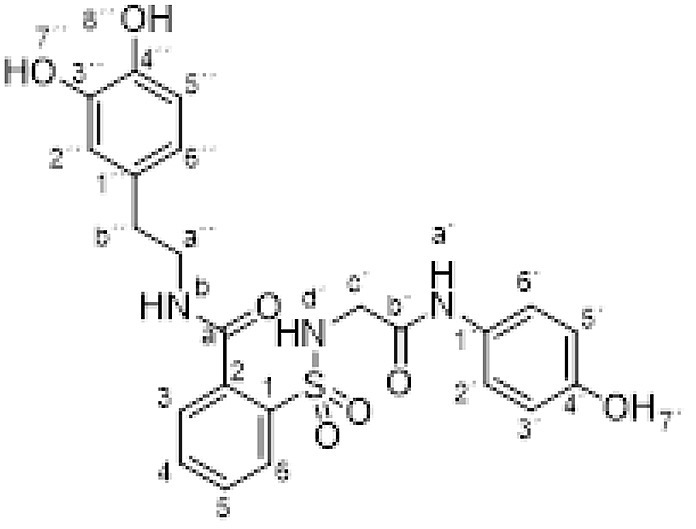
Dopamine hydrochloride (0.379 g, 2 mmol), Na2CO3 (0.212 g, 2 mmol) and compound 1 (0.332 g, 1 mmol) were dispersed in EtOH (10 mL) and heated to 65 °C for 18 h. Evaporation under reduced pressure gave a solid. Purification by chromatography [silica gel, ethyl acetate/EtOH (9:1)] and the compound was triturated in CH2Cl2. Crystallization from ethyl acetate/hexane furnished N-[2-(3,4-dihydroxyphenil)ethyl]-2-[[2-(4-hydroxyanilino)-2-oxo-ethyl]sulfamoyl] benzamide 3r (0.344 g, 71%) as a white solid; with a 99.3% purity using the standard chromatographic analysis; mp 87–89 °C; 1H NMR (300 MHz; DMSO‑d 6; Me4Si) δ 2.68 (2 H, t, J = 7.4 Hz, CH 2), 3.40 (2 H, t, J = 6.8 Hz, CH 2), 3.68 (2 H, d, J = 5.8 Hz, CH 2), 6.50 (1 H, dd, J = 8.0, 1.5 Hz), 6.58–6.70 (4 H, m), 7.21 (2 H, d, J = 8.7 Hz, Harom), 7.39–7.50 (2 H, m), 7.57–7.72 (2 H, m), 7.87 (1 H, dd, J = 7.3, 1.0 Hz), 8.65 (1 H, s, OH), 8.77 (1 H, s, OH), 8.82 (1 H, t, J = 5.6 Hz, NH), 9.18 (1 H, s, NH), 9.75 (1 H, s, OH); 13C NMR (75 MHz; DMSO‑d 6; Me4Si) δ 34.3, 41.4, 46.0, 115.0, 115.4, 115.9, 119.2, 120.9, 128.5, 129.1, 129.8, 129.9, 130.0, 132.6, 135.6, 136.7, 143.4, 145.0, 153.3, 165.1, 168.1; HRMS (ESI-TOF) m/z calcd. for C23H24N3O7 32S [M + H]+ 486.1325 found: 486.1336.
3.1.19. 2-[[2-(4-hydroxyanilino)-2-oxo-ethyl]sulfamoyl]-N-(2-pyrrolidin-1-ylethyl) benzamide (3s)
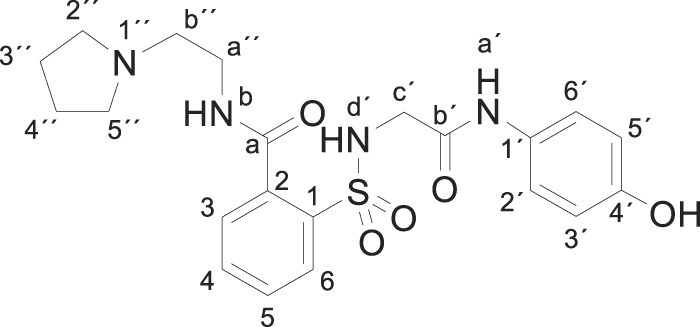
Compound 1 (0.332 g, 1 mmol) was added to a solution of 1-(2-aminoethyl)pyrrolidine (0.228 g, 0.25 mL, 2 mmol) in acetonitrile (5 mL). The mixture was stirred for 1 h at room temperature. Evaporation under reduced pressure gave a solid. Purification by crystallization from acetonitrile furnished compound 3s (0.384 g, 86%); with a 99.4% purity using the standard chromatographic analysis; mp 141–142 °C; 1H NMR (300 MHz; DMSO‑d 6; Me4Si) δ 1.62–1.79 (4 H, m, 2CH 2), 2.49–2.59 (4 H, m, 2CH 2), 2.64 (2 H, t, J = 4.8 Hz, CH 2), 3.38–3.49 (2 H, m, CH 2), 3.80–3.87 (2 H, m, CH 2), 6.59 (2 H, d, J = 7.8 Hz, Harom), 6.95 (2 H, d, J = 7.8 Hz, Harom), 7.41–7.48 (2 H, m), 7.56 (1 H, t, J = 7.5 Hz), 7.80 (1 H, d, J = 7.7 Hz), 8.80 (1 H, bt, J = 4.4 Hz, NH), 9.21 (1 H, bs, NH), 9.87 (1 H, s, NH), 9.94 (1 H, bs, OH); 13C NMR (75 MHz; CD3OD; Me4Si) δ 24.1, 38.7, 46.5, 54.6, 55.4, 116.1, 123.3, 129.9, 130.4, 130.5, 130.9, 134.0, 137.5, 138.4, 155.7, 169.2, 170.7; Anal calcd for C21H26N4O5S: C 56.49, H 5.87, N 12.55; found: C 56.42, H 6.09, N 12.47; HRMS (ESI-TOF) m/z calcd. for C21H27N4O5 32S [M + H]+ 447.1691.
3.1.20. N-(4-hydroxyphenyl)-2-[[2-(morpholine-4-carbonyl)phenyl]sulfonylamino] acetamide (3t)
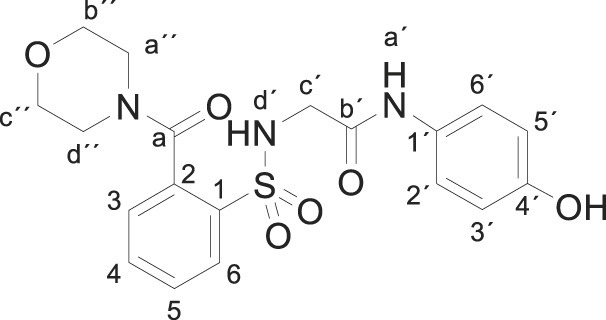
Compound 1 (0.332 g, 1 mmol) was added to a solution of morpholine (0.164 g, 0.16 mL, 2 mmol) in water (2.5 mL). The mixture was stirred for 2 h at room temperature. Evaporation under reduced pressure gave a solid. Purification by chromatography [silica gel, ethyl acetate/hexane (1:1)] and crystallization from ethyl acetate/hexane furnished compound 3t (0.331 g, 79%) as a white solid; with a 99.5% purity using the standard chromatographic analysis; mp 82–83 °C; 1H NMR (300 MHz; DMSO‑d 6; Me4Si) δ 3.02–3.18 (2 H, m), 3.47–3.55 (2 H, m), 3.57–3.71 (6 H, m), 6.62 (2 H, d, J = 8.7 Hz, Harom), 7.20 (2 H, d, J = 8.7 Hz, Harom), 7.39–7.49 (2 H, m), 7.57–7.71 (2 H, m), 7.91 (1 H, d, J = 8.1 Hz), 9.17 (1 H, s, NH), 9.65 (1 H, s, OH); 13C NMR (75 MHz; CD3OD; Me4Si) δ 43.5, 46.9, 67.0, 67.1, 116.0, 123.4, 128.9, 130.3, 130.7, 131.00, 134.4, 135.7, 138.4, 155.5, 168.5, 170.4; Anal calcd for C19H21N3O6S: C 54.41, H 5.05, N 10.02; found: C 54.77, H 4.95, N 10.26; HRMS (ESI-TOF) m/z calcd. for C19H22N3O6 32S [M + H]+ 420.1220 found: 420.1283.
3.1.21. 2-[[2-(4-benzylpiperazine-1-carbonyl)phenyl]sulfonylamino]-N-(4-hydroxyphenyl) acetamida (3u)
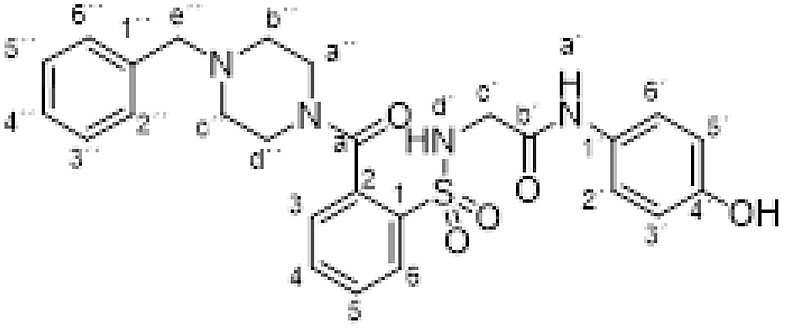
Compound 1 (0.332 g, 1 mmol) was added to a solution of N-benzylpiperazine (0.352 g, 0.35 mL, 2 mmol) in acetonitrile/ethanol (6:4) (8 mL). The mixture was stirred for 24 h at room temperature. Evaporation under reduced pressure gave a solid. Purification by chromatography [silica gel, ethyl acetate] and crystallization from ethyl acetate/hexane furnished compound 3u (0.432 g, 85%) as a white solid; with a 99.6% purity using the standard chromatographic analysis; mp 110–111 °C; 1H NMR (300 MHz; DMSO‑d 6; Me4Si) δ 2.00–2.48 (4 H, m), 3.00–3.29 (2 H, m), 3.47 (2 H, s, CH 2), 3.53–3.76 (4 H, m), 6.61 (2 H, d, J = 8.9 Hz, Harom), 7.18 (2 H, d, J = 8.9 Hz, Harom), 7.22–7.34 (4 H, m), 7.38 (1 H, dd, J = 7.2, 1.2 Hz), 7.43–7.78 (3 H, m), 7.88 (1 H, dd, J = 7.5, 1.2 Hz), 9.15 (1 H, s, NH), 9.63 (1 H, s, OH); 13C NMR (75 MHz; CD3OD; Me4Si) δ 42.9, 46.9, 53.1, 53.2, 63.7, 115.9, 123.3, 128.3, 128.7, 129.2, 130.2, 130.4, 130.4, 130.8, 134.2, 135.8, 138.2, 138.3, 155.4, 168.4, 170.0; HRMS (ESI-TOF) Calcd for C26H29N4O5 32S: M + H 509.1859. Found 509.1883.
3.2. Experimental procedures for hepatotoxicity assays
3.2.1. Hepatocyte culture protocol
A transformed human hepatocyte cell line HepaRG™ was procured from Thermo Fisher and grown and maintained in William’s E medium supplemented with GlutaMAX, HepaRG™ Maintenance/Metabolism Medium Supplement, and penicillin-streptomycin and incubated at 37 °C/5% CO2. Primary human hepatocytes (PHH) from a 61-year-old Caucasian male non-alcoholic, non-smoker donor were purchased from Seckisui Xenotech. PHH were grown and maintained in OptiCULTURE Hepatocyte Media (K8300, Seckisui Xenotech) and incubated at 37 °C/5% CO2. Cultures (80% confluent) of HepaRG cells and PHH growing in 24, 48, and 96-well plates were incubated 6–8 h in serum-free medium. For HepaRG cells, HepaRG™ Serum-free Induction Medium Supplement was used, and for PHH, OptiCULTURE medium, which is a serum-free medium, was used. The serum-starved cells were treated with compounds in a dose-dependent manner or vehicle control for 3 h, 6 h, and 12 h at 37 °C.
3.2.2. Lactate dehydrogenase (LDH) assay
Using the Pierce LDH Cytotoxicity assay kit from Thermo Scientific, cells were incubated in the presence of various drug compounds (ApAP, compounds 1–3), followed by collection of the medium supernatant. Release of LDH was measured in 96-well plate formats. A Molecular Devices SpectraMAX M5e plate reader was used to quantify fluorescence in all assays mentioned hereinafter. The absorbance was measured at 490 nm and 680 nm, and the final result was absorbance observed at 680 nm subtracted from absorbance observed at 490 nm (A490nm-A680nm) at 3 h, 6 h, and 12 h at concentrations of 0.5 mM and 1 mM.
3.2.3. Glutathione (GSH) assay
The incubated cells mentioned above in the LDH Assay protocol were stained using the ThiolTracker Violet Glutathione Detection reagent from Molecular Probes (Invitrogen). After hepatocytes were incubated in the presence of various compounds, incubation medium was removed and cells rinsed with D-PBS-conditioned medium, followed by incubation with pre-warmed ThiolTracker Violet dye (working solution prepared as per manufacturer’s instructions) for 30 min. Fluorescence was measured at the following wavelengths: excitation (404 nm) and emission (526 nm). The final results were expressed as relative fluorescent units (RFU), which indicates the cellular level of GSH in intact cells.
3.2.4. Cytochrome P450 enzyme metabolism profile
The Vivid® CYP450 screening assay kits (Life Technologies, Invitrogen/Thermo Fisher Scientific) were used as an in vitro high-throughput screening. Here, each compound was mixed with a master pre-mix comprising of CYP450 baculosomes, reagent, and regeneration system, which contained glucose-6-phosphate and glucose 6-phosphate dehydrogenase. The mixture was pre-incubated at room temperature for 20 min. Following this, each CYP enzyme-specific substrate and NADP+ was added and the mixture incubated at room temperature for 30 min. The reaction was stopped by addition of 0.5 M Tris base. CYP activity was evaluated by measuring the fluorescence of fluorescent metabolites generated from each CYP enzyme-specific substrate at the respective wavelengths suggested by the manufacturers’ protocol.
3.3. Animal experiments
All animal protocols and procedures were completed under the pre-approved provisions of the Institutional Animal Care and Use Committee (IACUC) of Louisiana State University Health Sciences Center (LSUHSC), New Orleans. Male CD1 mice and male Sprague-Dawley rats were purchased from a commercial vendor (Charles River); animals were acclimated to the LSUHSC New Orleans Neuroscience Center of Excellence vivarium for at least seven days before experimental protocols began. All animals were kept in a 12 h day-night cycle with food and water available ad libitum.
3.4. Liver function tests (LFTs), NAPQI identification and characterization
Male CD1 mice were fasted for 15 h and dosed with ApAP or compounds 1–3 at 600 mg/kg doses administered via po injections. After administration of compounds, animals were returned to their respective cages and maintained with food and water provided ad libitum for 12 h. After 12 h, animals were euthanized under 5% isoflurane anesthesia; whole blood samples were collected in sterile microcentrifuge tubes without anti-coagulants from animals by transcardial perfusion and stored for 0.5 h at room temperature (25 °C) for whole blood coagulation; afterwards, whole blood was centrifuged at 1000 g for 5 min at 4 °C. Serum samples were collected, aliquoted, and stored at −80 °C for LFTs. Alanine Aminotransferase (ALT), Aspartate Aminotransferase (AST), Alkaline Phosphatase (ALP) and serum Creatinine were measured using serum samples by commercially available kits from Sigma-Aldrich and Abcam, according to the manufacturers’ suggested protocols.
3.5. Method of NAPQI detection using LC-MS/MS
NAPQI was extracted from the serum by adding 3 vol of ethyl-acetate on ice for 30 min, centrifuged at 3000 g for 30 min, and the supernatant was transferred into mass spectrometry vials and dried under N2 gas. The serum was washed with another 3 vol of ethyl-acetate, and the supernatant was added to the same mass spectrometry vial. The sample was re-suspended with 50 μl of 1:1 MeOH:H2O for LC-MS/MS experimentation. The mass spectrophotometer was operated in multiple reaction monitoring (MRM) mode using positive ion electrospray. NAPQI was detected by monitoring the m/z transition 150.3/108.1.
3.6. Analgesia assays
Two different assays were utilized to quantify the analgesic effects of the compounds: the acetic acid-induced abdominal writhing assay, the cold-tail flick assay, and the von Frey assay. All tests were performed on either male CD1 mice or male Sprague-Dawley rats. Compounds 1, 2, and 3r or ApAP (Sigma St. Louis, MO) were administered in varying concentrations from 5 mg/kg to 80 mg/kg after suspension in the vehicle (0.9% NaCl and no more than 10% DMSO). Compounds or vehicle were administered via po injection to animals that were fasted overnight (15 h).
3.6.1. Acetic acid-induced abdominal writhing assay
In this model of visceral pain, abdominal contraction (writhing) is induced in mice by an ip injection of 0.4% acetic acid at a dose of 10 mL/kg 25 min after drug administration. The number of writhes is counted for 10 min beginning 5 min after acetic acid injection [25]. All animals (male CD1 mice) were fasted overnight (15 h) prior to testing, and the compounds were administered via po injection to animals belonging to the treatment groups: ApAP and compounds 3b and 3r, were tested at doses of 5, 10, 20, 40, and 80 mg/kg respectively. Data are expressed as mean ± SEM, n > 15 for each group, and the exact number of animals are indicated within each histogram (Fig. 9A–C).
3.6.2. Von Frey (eVF) analgesic assay
In this model of mechanonociception, the analgesic effects of ApAP and compounds 3b and 3r were assessed in male Sprague-Dawley rats [26]. In this assay, one hind paw at a time is stimulated with a von Frey filament (noxious source) until the animal retracts the paw from the mechanical stimulus [27]. The baseline withdrawal thresholds of both the right and left paws of all animals were recorded, and animals were assigned to different treatment groups so that each group had an approximately equal withdrawal threshold average in the left paw. After baseline testing and group assignments, treatment groups received subcutaneous plantar injections (150 μl) of 50% Complete Freund’s Adjuvant (CFA) to the left hind paw, and another group plantar injection (150 μl) of 0.9% NaCl to the left hind paw. CFA induces inflammation, resulting in a left hind paw that is hypersensitive to the mechanical stimulus, while the right hind paw serves as a baseline within each animal. To obtain pressure recordings, each animal was placed on a perforated metallic grid platform in an individual plastic observation compartment, which provided access to the plantar surface of the hind paws.
The rats were allowed to acclimate to the environment for 30 min, and mechanical hypersensitivity was assessed by stimulating the mid-plantar area of each hind paw with a rigid tip von Frey filament attached to the eVF meter (Ugo Basile 38450) until animals withdrew the paw from the filament. The withdrawal threshold was defined as the average force (g) required for the rat to withdraw the stimulated paw. A brisk withdrawal of the paw (often followed by a sustained retraction and/or licking) was considered a positive response, but paw withdrawals due to locomotion or weight shifting were not counted. In these studies, the average baseline withdrawal threshold to the electric von Frey filament (eVF) was approximately 40 g pressure. After injection of CFA, the withdrawal threshold was between 20 and 25 g for the injected left hind paw (indicating hyperalgesia/allodynia), while for un-injected right hind paw, the withdrawal threshold was approximately 40 g pressure.
After the initial eVF testing to verify the efficacy of CFA and 0.9% NaCl injections, ApAP, 3b, or 3r were administered via ip injection. ApAP was administered in a cumulative dose-response manner; injections at concentrations of 10 mg/kg, 32 mg/kg, 100 mg/kg and 320 mg/kg were given at intervals of 45 min. Both 3b and 3r were also administered in a cumulative dose-response manner; injections at concentrations of 32 mg/kg and 100 mg/kg were given at intervals of 45 min. In all animals, eVF withdrawal threshold recordings were taken at 30 min after drug injection in both hind paws. Withdrawal threshold readings were taken as specified in the paragraph above. Data from these experiments are presented in Fig. 11 and in the Results section.
3.7. Antipyresis
The antipyretic effect of the compounds was assessed utilizing baker yeast-induced hyperthermia (15% yeast, 0.1 mL/kg). All animals used in this assay were male CD1 mice, which were fasted overnight (15h) before the start of the assay. The baseline temperature of all animals was recorded using a Cole-Parmer rectal thermometer probe. Experimental groups received ip injections of the pyrogen or 0.9% NaCl. Rectal temperatures were recorded at 4 h post-injection. Febrile animals were assigned to groups so that each group had an approximately equal average body temperature prior to the administration of the drugs; animals that were non-febrile were not included in the experiment. After measurement of average body temperature and group assignment, the drugs or 0.9% NaCl were administered via po injection to febrile animals at a concentration of 80 mg/kg. Rectal temperatures were recorded at 2 h post-injection to determine the change in average body temperature. Data are expressed as mean ± SEM, n = 10.
3.8. Histology and immunohistochemistry
CD1 male mice were fasted overnight with water provided ad libitum and then drugs (ApAP [n = 10] or 3b [n = 5] or 3r [n = 5]) and vehicle only (n = 5) were administered via ip injection at concentrations of 600 mg/kg with an injection volume of 10 mL/kg. At 12 h post-injection, mice were anesthetized under 5% isoflurane and fixed via transcardial perfusion with 10% Neutral Buffered Formalin (NBF) after exsanguination using 0.9% NaCl. Hepatic tissue was extracted and stored in NBF for 24 h; after fixing, liver tissues were transferred to 80% EtOH for storage prior to paraffine embedding, sectioning, and immunological staining.
3.9. Statistics
Changes of the withdrawal thresholds or latencies induced by a drug were first analyzed with a one-way ANOVA. Comparisons between the effects of different drugs were then subjected to t-test for unpaired means. A value of p < 0.05 was considered significant. All statistical analyses were performed using GraphPad Prism 8.3.1.
4. Conclusion
We describe novel ApAP analogs that in pre-clinical in vivo models lack hepatotoxicity, yet retain analgesia and antipyresis through an efficient synthesis by the ring opening of the heterocyclic moiety in compound 1 to supply the corresponding N-substituted amides. As depicted in the graphical abstract, the N-acetyl-p-aminophenol portion of the molecule is the likely analgesic fragment, which toxicity is likely reduced by the benzenesulfonamide fragment. Lastly, varying the R modulates the lipophilicity and toxicity. The lack of hepatotoxicity is explained by the inability of these compounds to generate 8 (N-acyl-p-benzoquinone imine) and the maintenance of hepatic tight junctions [23], which are disrupted in high doses of ApAP and confirmed in vitro (PHH, Fig. 1; HepaRG, Fig. 2) and in vivo (Fig. 3). An in vivo model of visceral pain (Fig. 9A–F, Fig. 10A) and hyperalgesia/allodynia model (Fig. 10 B, Fig. 11) demonstrate the analgesic properties of 3b and 3r. First, we utilized the acetic acid-induced abdominal writhing model of visceral pain quantifies contraction of the abdominal muscles and stretching of the hind limbs in response to ip injection of acetic acid (Fig. 9A–C, Fig. 10A) [25]. In the second model, CFA inflammatory pain assay with von Frey detection [26] the CFA-inflamed hind paw is stimulated with a von Frey filament until the animal retracts the paw from the noxious source, while the un-injected hind paw serves as a within-subject control (non-injured) baseline. Demonstration of efficacy in this model is valuable since inflammatory pain represents the most prevalent pain condition in humans.
Fig. 10.
Dose-response curves and ED50 values for ApAP, 3b, and 3r. ED50 curves for 3b and 3r are shifted to the left compared to ApAP in the (A) Abdominal Writhing Assay visceral pain and (B) the von Frey assay hyperalgesia/allodynia. ED50 values for the Abdominal Writhing Assay are 68.58 μmol/kg for ApAP, 45.16 μmol/kg for 3b, 14.70 μmol/kg for 3r. ED50 values for the von Frey assay are 245.1 μmol/kg for ApAP, 197.5 μmol/kg for 3b, and 176.6 μmol/kg for 3r.
We then asked whether 3b and 3r are not hepatotoxic because they do not lead to formation of the toxic N-acyl-p-benzoquinone imine, NAPQI. One of the mechanisms for ApAP-induced hepatotoxicity is via formation of the electrophilic reactive metabolite, NAPQI, which is detoxified through conjugation with reduced GSH. GSH is an important cellular antioxidant in the liver, and GSH depletion appears to be a key event in ApAP-induced acute liver injury, although this mechanism is still poorly understood [20]. However, following a toxic dose of ApAP, GSH depletion is followed by formation of reactive oxygen and nitrogen species leading to mitochondrial permeability and hepatocyte death [21]. We developed a method to detect NAPQI from plasma using LC-MS/MS in CD1 mice treated with ApAP, 3b or 3r (each at 600 mg/kg; Fig. 6). Our results support the idea that they are not hepatotoxic because they do not generate NAPQI [28,29]. Moreover, (H&E)-stained liver sections from CD1 mice after a toxic (600 mg/kg) dose of ApAP demonstrate centrilobular hepatic hemorrhagic necrosis. In contrast, a healthy liver architecture was observed in mice treated with the same dose of 3b and 3r (Fig. 7). Staining for nitrotyrosine, a marker of mitochondrial free radical formation and of hepatocyte injury, correlated with centrilobular necrosis observed on H&E stains. Loss of hepatic tight junctions has been recently described as a microscopic marker of ApAP-induced hepatotoxicity [23], resulting in loss of ‘chicken wire’ hepatic tight junctions and apoptosis of hepatocytes, a pattern also observed in liver sections from animals treated with ApAP but not 3b and 3r.
An application of developing these compounds could be to help curb the large opioid abuse epidemic in the United States. In 2017, drug overdose deaths peaked at more than 70,000 cases, mostly due to prescription opioid pain relievers and heroin (www.cdc.gov/opioids/strategy.html) with management of pain being the cause of long-term abuse in up to half of opioid deaths. Workplace injuries may be driving many of these cases, and there is evidence that prescribed oral narcotics are the most likely source of overdose (CDC 2016). A recent randomized clinical trial of 240 patients with chronic back pain and hip and knee osteoarthritis pain showed equivalent analgesia with non-opioid medications compared to opioid use [30]. Additionally, use of opioids was demonstrated in a recent randomized trial of 416 patients to be no better than non-opioids in managing acute upper or lower extremity pain in the emergency department [4]. A safer, novel, non-opioid analgesic with a marked improvement in the hepatotoxicity profile could be an important new tool to combat opioid use disorders during management of acute and chronic minor and moderate pain. Lastly, this pipeline could also be particularly important in the search for an antipyretic with a safer profile in the COVID-19 pandemic and its associated kidney and liver disease in some critically ill SARS-CoV-2 patients.
Author contributions
HAB, SB and NGB designed the study. HAB, NGB, SB and JAB wrote the paper and all co-authors contributed to the final version. JAB, CB and VA, performed the medicinal chemistry. WCG performed all histology and immunohistochemistry. SB, AP, SE, JH and DP conducted the experiments for analgesia; SB, JH and AL conducted the antipyresis assay. BJ and NGB performed the LC-MS/MS studies.
Declaration of competing interestCOI
The authors declare the following financial interests/personal relationships which may be considered as potential competing interests: HAB, CBG, DP, JAB and NGB are named on a patent lodged by the Louisiana State University Health Sciences Center describing the synthesis and characterization of the novel non-hepatotoxic acetaminophen analogs. It is patent PCT/US2018/022029; international filing date: 12.03.2018; publication date: 28.02.2019. HAB and NGB are co-founders of South Rampart Pharma, LLC – a company that develops novel analgesic therapies.
Acknowledgments
We gratefully acknowledge FEDER funds and Comunidad de Madrid (CAM, project B2017/BMD-3688 MULTI-TARGET&VIEW-CM FEDER FUNDS), Ministerio de Economia, Industria y Competitividad (project CTQ2017-85203-P), Instituto de Salud Carlos III (FEDER funds, ISCIII RETIC REDINREN RD16/0009/0015 FEDER FUNDS) and Universidad de Alcalá (CCG2017/EXP-021 and CCG2018/EXP-051) for financial support. J. R. also thanks the Universidad de Alcalá for a predoctoral grant. We thank Mr. Jeremy E. Mix for their assistance with animal care and analgesia assays.
Footnotes
Supplementary data to this article can be found online at https://doi.org/10.1016/j.ejmech.2020.112600.
Appendix A. Supplementary data
The following is the Supplementary data to this article:
References
- 1.C. Institute of Medicine (US) Committee on Advancing Pain Research, andEducation . 2011. Relieving Pain in America: A Blueprint for Transforming Prevention, Care, Education, and Research. [PubMed] [Google Scholar]
- 2.DJ G., P R. The economic costs of pain in the United States. J. Pain. 2012;13 doi: 10.1016/j.jpain.2012.03.009. official journal of the American Pain Society. [DOI] [PubMed] [Google Scholar]
- 3.Castaneda-Arriaga R., Galano A. Exploring chemical routes relevant to the toxicity of paracetamol and its meta-analogue at a molecular level. Chem. Res. Toxicol. 2017;30:1286–1301. doi: 10.1021/acs.chemrestox.7b00024. [DOI] [PubMed] [Google Scholar]
- 4.Chang A.K., Bijur P.E., Esses D., Barnaby D.P., Baer J. Effect of a single dose of oral opioid and nonopioid analgesics on acute extremity pain in the emergency department: a randomized clinical trial. J. Am. Med. Assoc. 2017;318:1661–1667. doi: 10.1001/jama.2017.16190. the journal of the American Medical Association. [DOI] [PMC free article] [PubMed] [Google Scholar]
- 5.Drahl C. How does acetaminophen work? Researchers still aren’t sure. Chem. Eng. News. 2014;92:31–32. [Google Scholar]
- 6.Ghanem C.I., Perez M.J., Manautou J.E., Mottino A.D. Acetaminophen from liver to brain: new insights into drug pharmacological action and toxicity. Pharmacol. Res. 2016;109:119–131. doi: 10.1016/j.phrs.2016.02.020. [DOI] [PMC free article] [PubMed] [Google Scholar]
- 7.Barriere D.A., et al. Paracetamol is a centrally acting analgesic using mechanisms located in the periaqueductal grey. Br. J. Pharmacol. 2020;177:1773–1792. doi: 10.1111/bph.14934. [DOI] [PMC free article] [PubMed] [Google Scholar]
- 8.Hogestatt E.D., et al. Conversion of acetaminophen to the bioactive N-acylphenolamine AM404 via fatty acid amide hydrolase-dependent arachidonic acid conjugation in the nervous system. J. Biol. Chem. 2005;280:31405–31412. doi: 10.1074/jbc.M501489200. [DOI] [PubMed] [Google Scholar]
- 9.Klinger-Gratz P.P., et al. Acetaminophen relieves inflammatory pain through CB1 cannabinoid receptors in the rostral ventromedial medulla. J. Neurosci. 2018;38:322–334. doi: 10.1523/JNEUROSCI.1945-17.2017. [DOI] [PMC free article] [PubMed] [Google Scholar]
- 10.Kauer J.A., Gibson H.E. Hot flash: TRPV channels in the brain. Trends Neurosci. 2009;32:215–224. doi: 10.1016/j.tins.2008.12.006. [DOI] [PubMed] [Google Scholar]
- 11.Blieden M., Paramore L.C., Shah D., Ben-Joseph R. A perspective on the epidemiology of acetaminophen exposure and toxicity in the United States. Expet Rev. Clin. Pharmacol. 2014;7:341–348. doi: 10.1586/17512433.2014.904744. [DOI] [PubMed] [Google Scholar]
- 12.Mosedale M., Watkins P.B. Understanding idiosyncratic toxicity: lessons learned from drug-induced liver injury. J. Med. Chem. 2020 Jun 25;63(12):6436–6461. doi: 10.1021/acs.jmedchem.9b01297. Epub 2020 Feb 21. [DOI] [PubMed] [Google Scholar]
- 13.Moles A., Torres S., Baulies A., Garcia-Ruiz C., Fernandez-Checa J.C. Mitochondrial-lysosomal Axis in acetaminophen hepatotoxicity. Front. Pharmacol. 2018;9:453. doi: 10.3389/fphar.2018.00453. [DOI] [PMC free article] [PubMed] [Google Scholar]
- 14.Tiegs G., Karimi K., Brune K., Arck P. New problems arising from old drugs: second-generation effects of acetaminophen. Expet Rev. Clin. Pharmacol. 2014;7:655–662. doi: 10.1586/17512433.2014.944502. [DOI] [PubMed] [Google Scholar]
- 15.Vaccarino A.L., et al. Synthesis and in vivo evaluation of non-hepatotoxic acetaminophen analogs. Bioorg. Med. Chem. 2007;15:2206–2215. doi: 10.1016/j.bmc.2006.07.054. [DOI] [PubMed] [Google Scholar]
- 16.N. G. Bazan, H. A. Bazan, J. Alvirez-Builla Gomez, D. Paul, C. Burgos (United States).
- 17.Breton G.W. Selective monoacetylation of unsymmetrical diols catalyzed by silica gel-supported sodium hydrogen sulfate. J. Org. Chem. 1997;62:8952–8954. [Google Scholar]
- 18.Das B.T. A highly selective and efficient acetylation of alcohols and amines with acetic anhydride using NaHSO4·SiO2 as a heterogeneous catalyst using NaHSO4.SiO2 as a heterogenous catalyst. J. Mol. Catal. Chem. 2007;269:12–16. P. [Google Scholar]
- 19.Miao L., Xu L., Narducy K.W., Trudell M.L. First multi-gram preparation SCP-123, A novel water soluble analgesic. Org. Process Res. Dev. 2009;13:820. doi: 10.1021/op900113b. [DOI] [PMC free article] [PubMed] [Google Scholar]
- 20.Abdelmegeed M.A., Moon K.H., Chen C., Gonzalez F.J., Song B.J. Role of cytochrome P450 2E1 in protein nitration and ubiquitin-mediated degradation during acetaminophen toxicity. Biochem. Pharmacol. 2010;79:57–66. doi: 10.1016/j.bcp.2009.07.016. [DOI] [PMC free article] [PubMed] [Google Scholar]
- 21.Hinson J.A., Reid A.B., McCullough S.S., James L.P. Acetaminophen-induced hepatotoxicity: role of metabolic activation, reactive oxygen/nitrogen species, and mitochondrial permeability transition. Drug Metab. Rev. 2004;36:805–822. doi: 10.1081/dmr-200033494. [DOI] [PubMed] [Google Scholar]
- 22.Zhang X., et al. A reliable LC-MS/MS method for the quantification of N-acetyl-p-benzoquinoneimine, acetaminophen glutathione and acetaminophen glucuronide in mouse plasma, liver and kidney: method validation and application to a pharmacokinetic study. Biomed. Chromatogr. 2018;32 doi: 10.1002/bmc.4331. [DOI] [PubMed] [Google Scholar]
- 23.Gamal W., et al. Low-dose acetaminophen induces early disruption of cell-cell tight junctions in human hepatic cells and mouse liver. Sci. Rep. 2017;7:37541. doi: 10.1038/srep37541. [DOI] [PMC free article] [PubMed] [Google Scholar]
- 24.Hendershot L.C., Forsaith J. Antagonism of the frequency of phenylquinone-induced writhing in the mouse by weak analgesics and nonanalgesics. J. Pharmacol. Exp. Therapeut. 1959;125:237–240. [PubMed] [Google Scholar]
- 25.Gupta A.K., et al. Analgesic and anti-inflammatory properties of gelsolin in acetic acid induced writhing, tail immersion and carrageenan induced paw edema in mice. PloS One. 2015;10 doi: 10.1371/journal.pone.0135558. [DOI] [PMC free article] [PubMed] [Google Scholar]
- 26.Edwards S., et al. Development of mechanical hypersensitivity in rats during heroin and ethanol dependence: alleviation by CRF(1) receptor antagonism. Neuropharmacology. 2012;62:1142–1151. doi: 10.1016/j.neuropharm.2011.11.006. [DOI] [PMC free article] [PubMed] [Google Scholar]
- 27.Chaplan S.R., Bach F.W., Pogrel J.W., Chung J.M., Yaksh T.L. Quantitative assessment of tactile allodynia in the rat paw. J. Neurosci. Methods. 1994;53:55–63. doi: 10.1016/0165-0270(94)90144-9. [DOI] [PubMed] [Google Scholar]
- 28.Brune K., Renner B., Tiegs G. Acetaminophen/paracetamol: a history of errors, failures and false decisions. Eur. J. Pain. 2015;19:953–965. doi: 10.1002/ejp.621. [DOI] [PubMed] [Google Scholar]
- 29.Dahlin D.C., Miwa G.T., Lu A.Y., Nelson S.D. N-acetyl-p-benzoquinone imine: a cytochrome P-450-mediated oxidation product of acetaminophen. Proc. Natl. Acad. Sci. U. S. A. 1984;81:1327–1331. doi: 10.1073/pnas.81.5.1327. [DOI] [PMC free article] [PubMed] [Google Scholar]
- 30.Krebs E.E., et al. Effect of opioid vs nonopioid medications on pain-related function in patients with chronic back pain or hip or knee osteoarthritis pain: the SPACE randomized clinical trial. J. Am. Med. Assoc. 2018;319:872–882. doi: 10.1001/jama.2018.0899. the journal of the American Medical Association. [DOI] [PMC free article] [PubMed] [Google Scholar]
Associated Data
This section collects any data citations, data availability statements, or supplementary materials included in this article.


