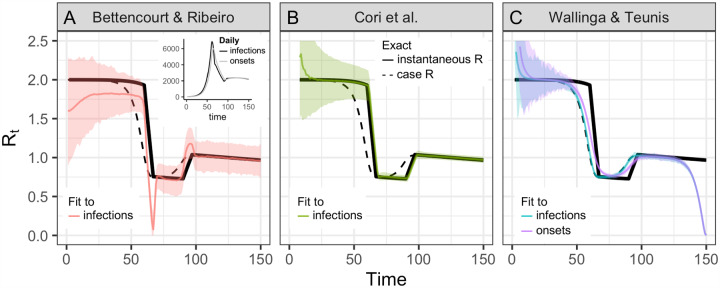
Figure 2: Accuracy of Rt estimation methods given ideal, synthetic data.
Solid black line shows the instantaneous reproductive number, which is estimated by Bettencourt Ribiero and Cori et al. Dashed black line shows the case reproductive number, which is estimated by Wallinga and Teunis. To mimic an epidemic progressing in real time, the time series of infections or symptom onset events up to t = 150 was input into each estimation method (inset). Terminating the time series while Rt is falling or rising produces similar results B.2. (A) By assuming a SIR model (rather than SEIR, the source of the synthetic data), the method of Bettencourt and Ribeiro systematically underestimates Rt when the true value is substantially higher than one. The method is also biased as transmission rates shift. (B) The Cori method accurately measures the instantaneous reproductive number. (C) The Wallinga and Teunis method estimates the cohort reproductive number, which incorporates future changes in transmission rates. Thus, the method produces Rt estimates that lead the instantaneous effective reproductive number and becomes unreliable for real-time estimation at the end of the observed time series without adjustment for right truncation [4,26]. In (A,B) the colored line shows the posterior mean and the shaded region the 95% credible interval. In (C) the colored line shows the maximum likelihood estimate and the shaded region the 95% confidence interval.

