

Abstract
Low-frequency repetitive transcranial magnetic stimulation (rTMS) to supplementary motor area (SMA) showed clinical benefit in obsessive-compulsive disorder (OCD). Here we tested whether clinical improvement was associated with enhanced cortical inhibition as measured by single and paired-pulse TMS variables. In 18 OCD patients receiving 4 weeks of either active or sham rTMS in a doubleblind randomized trial, we assessed bilateral resting and active motor thresholds (RMT and AMT), cortical silent period (CSP), short-interval intracortical inhibition (SICI) and intracortical facilitation (ICF). We tested correlations between changes in Yale-Brown Obsessive Compulsive Scale-Self-report (Y-BOCS-SR), Clinical Global Impression-Severity subscale (CGI-S) and cortical excitability measures. Active rTMS increased right hemisphere RMT whose change correlated with Y-BOCS-SR improvement. Baseline RMT hemispheric asymmetry, defined as the difference between left and right hemispheres RMT, and its normalization after active rTMS correlated with Y-BOCS-SR and CGI-S improvements. Active rTMS also increased right hemisphere SICI whose change correlated with Y-BOCS-SR and CGI-S at week 4, and with normalization of baseline RMT hemispheric asymmetry. Treatment-induced changes in cortical excitability measures are consistent with an inhibitory action of SMA rTMS on dysfunctional motor circuits in OCD. Correlations of neurophysiology measures with therapeutic outcome are supportive of the role of SMA in the modulation of OCD symptoms.
Keywords: Transcranial magnetic stimulation, Obsessive-compulsive disorder, Supplementary motor area, Motor threshold, Cortical silent period, Short-interval intracortical inhibition, Intracortical facilitation
1. Introduction
It has been hypothesized that malfunctioning of cortico-striato-thalamo-cortical circuitry (CSTC), and in particular deficits in inhibition of irrelevant information and response control in obsessive compulsive disorder (OCD) (Van den Heuvel et al., 2005; Chamberlain et al., 2005), may account for the reduced ability of patients to inhibit intrusive thoughts, impulses, or images and repetitive motor responses or mental rituals. This deficient inhibition has been posited to have a neurophysiologic signature, associated with a higher than normal level of cortical excitability (Leocani et al., 2001; Rossi et al., 2005).
Transcranial magnetic stimulation (TMS) measures of motor cortex excitability provide some evidence for deficient cortical inhibition in OCD. For example, the minimum magnetic field intensity required to elicit a twitch in a relaxed hand muscle, resting motor threshold (RMT), a marker of ion channel function (Ziemann et al., 1996a), is reduced in OCD compared with healthy comparison subjects (Greenberg et al., 2000). Short-interval intracortical inhibition (SICI), a marker of GABA(A)-ergic function (Ziemann et al., 1996b), has also been reported to be reduced in patients with OCD (Greenberg et al., 1998; Greenberg et al., 2000). Patients with OCD demonstrated significantly shortened Cortical Silent Period (CSP), a marker of GABA(B)-ergic function (Siebner et al., 1998), and increased intracortical facilitation (ICF), a marker of glutamatergic function (Ziemann et al., 1998), compared with healthy subjects (Richter et al., 2012).
Consistent with these physiological findings, a neuroimaging study suggested that premotor areas, such as supplementary motor area (SMA), are hyperactive in OCD, and that this hyperactivity may relate to deficient inhibitory control of behavior (Yücel et al., 2007). Using functional magnetic resonance imaging (fMRI) with a task encompassing inhibitory control processes (the Multi-Source Interference Task), OCD patients had greater relative activation of a spatially extended SMA/dorsal anterior cingulate cortex (ACC) region (peaking in the pre-SMA), along with greater deactivation of the rostral ACC during high- versus low-conflict trials.
Given this evidence of deficient motor inhibitory control in OCD, the use of low-frequency repetitive TMS (rTMS) to enhance inhibition in motor circuits (Chen et al., 1997) may be a fruitful avenue to explore as a putative treatment. We hypothesized that the pre-SMA may be a therapeutic target for rTMS in OCD because that region is involved in cognitive aspects of internal movement generation (Picard and Strick, 2001) and with the conscious urge to act (Fried et al., 1991).
To explore the impact of rTMS on OCD symptoms and motor cortex excitability, we applied low-frequency (1-Hz) rTMS to the pre-SMA in 10 patients in an open study, and measured RMT before and after 2 weeks of open-label treatment. The 1-Hz rTMS treatment applied to the pre-SMA resulted in OCD symptoms improvement and restored physiological levels of cortical excitability in the right hemisphere, as indexed by RMT (Mantovani et al., 2006). In case reports of two additional patients with OCD and Tourette's Syndrome (TS) (Mantovani et al., 2007), we again found a significant clinical improvement and rTMS induced increase in RMT, in a direction that tended to normalize a baseline hemispheric imbalance. Analyses of clinical and neurophysiology measures in a subgroup of patients affected with TS (n=10) and comorbid OCD (n=5), and enrolled in a randomized controlled trial (RCT), showed an average reduction of 54% in the Yale-Global Tic Severity Scale (Y-GTSS), 44% in the Yale-Brown Obsessive Compulsive Scale (Y-BOCS), and an improvement from markedly to mildly ill on Clinical Global Impression-Severity subscale (CGIS), whose change correlated with increased right hemisphere SICI (Mantovani et al., 2012).
In a larger (n=21) randomized sham-controlled trial we recently reported that 1-Hz rTMS to the pre-SMA had significant benefit in treatment-resistant OCD (Mantovani et al., 2010). Here we present pre- and post-rTMS intervention measures of motor cortex excitability for that trial, and test whether rTMS clinical effects were associated with changes in RMT, AMT, CSP, SICI, and ICF. Our hypothesis was that therapeutic effect would be linked to an increase in cortical inhibition.
2. Methods
2.1. Subjects
All patients gave written informed consent, and the protocol was approved by the New York State Psychiatric Institute/Columbia University Institutional Review Board. Patients were randomly assigned in a 1:1 ratio to either active rTMS or sham, five times per week, for 4 consecutive weeks.
To be eligible patients had to be 18–70 years old, right-handed, have a primary diagnosis of OCD (confirmed via Structured Clinical Interview/SCID for DSM-IV) (First et al., 1997), current episode duration of at least one year, have clinically significant OCD symptoms (defined as a total Y-BOCS score of ≥ 16) (Goodman et al., 1989a, 1989b) despite treatment with an adequate trial of a Serotonin Reuptake Inhibitor (SRI) and Cognitive Behavior Therapy (CBT). An adequte SRI trial was defined as treatment for at least 12 weeks on the SRI, that meets or exceeds recommended dosage level for OCD (Koran et al., 2007). Individuals who could not tolerate, due to side effects, medications of this class at the specified dose and duration were also included. An adequate trial of CBT was defined as at least once a week for 8 weeks with clear evidence of exposure during sessions and homework given. Patients currently on medication and/or psychotherapy must have been in stable treatment for at least 12 weeks before initiation and throughout the study. Patients were excluded if they were treatment-refractory (defined as non-response to clomipramine, at least 2 selective SRIs (SSRIs) at adequate dose and duration plus CBT in the last year) and were diagnosed with severe major depressive disorder (MDD) (confirmed by SCID and measured by the Hamilton Depression Rating Scale (HDRS-24 ≥ 20)). Patients who exhibited significant acute suicide risk, or with a history of bipolar disorder, of any psychotic disorder, or of substance abuse or dependence within the past year were excluded. Patients with neurological disorders, increased risk of seizure, use of proconvulsant medications (such as bupropion, maprotiline, tricyclic antidepressants, classical antipsychotics), implanted devices, metal in the brain, unstable medical conditions, pregnancy, or breast-feeding were also excluded.
To avoid confounds on motor cortex excitability measures, medications with a known inhibitory effect on brain excitability (such as anticonvulsants, benzodiazepines, atypical antipsychotics) were not allowed. We excluded patients with prior TMS exposure to reduce risk of unblinding.
Twenty-one right handed outpatients (13 male and 8 female; mean age=38.9 years, S.D.=11.9) who met study criteria were recruited and randomly assigned to active or sham rTMS. Three patients (2 randomized to active and 1 to sham) were withdrawn before starting rTMS: two experienced a worsening of depression and the other fainted during the RMT determination. Therefore, analyses were conducted on the 18 completers (nine in the active and nine in the sham group); demographics and clinical characteristics of this sample are shown in Table 1.
Table 1.
Demographic and clinical characteristics of the sample.
| Active rTMS | Sham | p | |
|---|---|---|---|
| Sample size | 9 | 9 | – |
| Right-handed | 8 | 8 | ns |
| Female/male | 4/5 | 3/6 | ns |
| Age (mean ± S.D.) | 39.7±8.6 years | 39.4±10.2 years | ns |
| Employed/unemployed | 7/2 | 6/3 | ns |
| Age of onset | 16.7±8.3 years | 16.8±10.1 years | ns |
| Duration of illness | 22.4±13.8 years | 22.1±7.3 years | ns |
| Duration of current episode | 3.5±3.7 years | 5.3±5.5 years | ns |
| No. of SRI trials in the current episode | 2.7±1.2 | 2.7±1.7 | ns |
| No. of patients with co-morbid MDD | 4 | 6 | ns |
| No. of patients on SRI | 6 | 6 | ns |
| No. of patients on psychotherapy | 3 | 2 | ns |
| Baseline Y-BOCS | 26±5.4 | 26.7±5.5 | ns |
| Baseline Y-BOCS-SR | 26.1±5.7 | 27.3±6.9 | ns |
| Baseline HDRS-24 | 15.3±10.6 | 14.8±7.7 | ns |
| Baseline CGI-S | 5±0.7 | 5.2±0.9 | ns |
SRI=Serotonin Reuptake Inhibitor; MDD=Major Depressive Disorder; Y-BOCS =Yale-Brown Obsessive Compulsive Scale; Y-BOCS-SR=Yale-Brown Obsessive Compulsive Scale-Self Report; HDRS-24=Hamilton Depression Rating Scale; CGI-S=Clinical Global Impression-Severity.
2.2. Concomitant medications
Six of 18 patients were medication free, while the remaining 12 were on medications held stable for 3 months prior and throughout the trial. Five patients were on fluoxetine (average dose=76mg/d), two on escitalopram (average dose=30 mg/d), two on citalopram (average dose=60 mg/d), one on fluvoxamine (average dose=300mg/d), and two on sertraline (average dose=225 mg/d). Five patients continued receiving supportive psychotherapy at a stable frequency during the trial.
2.3. Outcome measures
Patients were evaluated every 2 weeks by raters (HBS, BAF) blind to treatment assignment, and completed self-rating forms at the end of each week of treatment. The primary efficacy measures were the Y-BOCS (Goodman et al., 1989a, 1989b), the Y-BOCS-Self-report (Y-BOCS-SR), a scale very similar to the clinician-administered rating, with excellent internal consistency and test-retest reliability (Baer et al., 1993; Steketee et al., 1996), and the CGI-Severity subscale (CGI-S) (Guy, 1976).
2.4. rTMS methods
rTMS was administered with the biphasic MAGSTIM super-rapid stimulator (Magstim Company, Ltd., Whitland, UK) using a vacuum cooled 70-mm figure-8 coil (AM). Stimulation parameters were 1-Hz, 20 min train (1200 pulses/day) at 100% of resting MT (using the lowest value of right or left hemisphere resting MTs obtained with the biphasic stimulator), once a day, 5 days a week, for 4 weeks, hence well within safety margins (Rossi et al., 2009a, 2009b). The coil was positioned over pre-SMA, targeted using the International 10-20 EEG System and defined at 15% of the distance between inion and nasion anterior to Cz (vertex) on the sagittal midline. The coil was placed with the handle along the sagittal midline, pointing towards the occiput to stimulate bilaterally and simultaneously the pre-SMA. Once the stimulation site had been determined, it was marked in the Brainsight™ (Rogue Research, Montreal, Canada) neuronavigation computer program, in order to monitor online during each session the optimal positioning of the coil, hence reducing the variability of the induced electric currents within the brain (Cincotta et al., 2010).
2.5. Masking and protection of the blind
Sham rTMS was administered using the Magstim Sham coil which contains a mu-metal shield that diverts the majority of the magnetic flux such that a minimal (less than 3%) magnetic field is delivered to the cortex. This coil looks and sounds like an active coil, however it does not feel exactly like active rTMS, which generates a stronger tapping sensation on the scalp. In order to maintain the blind, we kept the raters blinded to treatment condition and created a separation between the clinical team (HBS, BF), neurophysiology data analyst (BDB), and rTMS treating physician (AM). Specifically, the rTMS treating physician did not know if rTMS was set to active or sham; in fact, after resting MT determination, the TMS lab managers (TS, TN), who were not involved in rTMS treatment sessions, set up the active or sham coil while the rTMS treating physician was not in the laboratory. We also excluded patients who received TMS before.
2.6. Motor cortex excitability measures
The primary measures of motor cortex excitability in both hemispheres were resting motor threshold (RMT), active motor threshold (AMT), cortical silent period (CSP) and paired-pulse (PP) short-interval intracortical inhibition (SICI) and intracortical facilitation (ICF). RMT was collected at baseline and every week prior to the rTMS session. The other measures were collected at baseline and every 2 weeks immediately after the end of rTMS. The experimental design is shown in details in a flow chart (Fig. 1), and each measure is described briefly in the following paragraphs. The acquisition and analysis of neurophysiology measures are described in detail in the Supplementary Material.
Fig. 1.
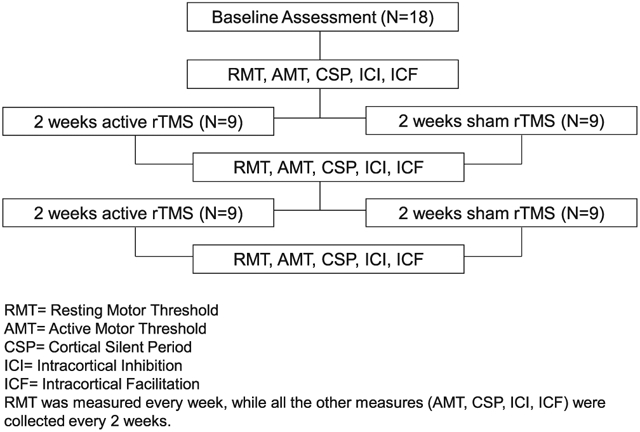
Experimental design.
2.6.1. Resting motor threshold
The RMT, a marker of ion channel function (Ziemann et al., 1996a), was defined as the minimum magnetic flux needed to elicit a threshold EMG response (greater than 50 μV in peak to peak amplitude) in a resting target muscle (Abductor Pollicis Brevis-APB) with 50% probability using single-pulse TMS administered to the contralateral primary motor cortex (Rossini et al., 1994). The position for stimulating the APB was defined as the area eliciting the maximal Motor Evoked Potential (MEP), with the coil rotated 45° from the sagittal plane. This optimal spot was targeted by systematically moving the coil in 0.5 cm steps across the scalp until the site corresponding with the largest muscle movement and MEP response was found. Once the optimal stimulation site had been determined, and it was marked in the Brainsight™ neuronavigation computer program, all stimuli were administered and monitored for that site. The same optimal spot on each hemisphere was used to conduct RMT, AMT, CSP and PP measures. RMT was repeated weekly on both right and left hemisphere, and the lowest RMT was used to adjust rTMS intensity.
2.6.2. Active motor threshold and cortical silent period
For AMT and CSP, the target hand muscle maintained light contraction, defined as 10% of the maximum contraction (strain gauge) while single magnetic pulses were administered to the contralateral primary motor cortex (Brasil-Neto et al., 1995). AMT, another measure of ion channel function (Ziemann et al., 1996a), was defined as the minimum magnetic flux needed to elicit a threshold EMG response (200 μV in peak to peak amplitude) in a contracted target muscle (APB) in five out of 10 trials. CSP, a marker of GABA(B)-ergic function (Siebner et al., 1998), was defined as the brief period of EMG silence following the motor evoked potential until the first reoccurrence of spontaneous EMG activity (Brasil-Neto et al., 1995). It was measured in milliseconds and obtained by applying randomly 10 trials each of single pulses at 110%, 130%, and 150% of the AMT.
2.6.3. Short-interval intracortical inhibition and intracortical facilitation
The results of the paired-pulse stimulation were used to generate measures of SICI and ICF. Suprathreshold (110% of the RMT) single magnetic pulses (or “test pulses”) applied to the primary motor cortex were preceded at randomly varying intervals (1, 3, 6, 8, 10 and 12 ms) by weaker subthreshold (80% of the RMT) single magnetic pulses (or “conditioning pulses”), with intervals selected based upon published literature (Kujirai et al., 1993). The intensities of the conditioning and test pulses were adjusted based on the individual RMT. The paired-pulse experiment was divided into three blocks of 40 trials. Each block contained 30 trials with paired stimuli and 10 trials with the test stimulus alone. The 30 paired stimuli in each block consisted of 5 repeats of each of six interstimulus intervals presented in a pseudorandomized and counterbalanced order. The effect of conditioning stimuli on MEP amplitude at each interstimulus interval (ISI) was determined as the ratio of the average amplitude of the conditioned MEP to the average amplitude of the unconditioned test MEP for each 10-trial block. The degree to which the motor response to the test pulse is inhibited or facilitated by the preceding pulse, respectively yields an index of short-interval intracortical inhibition (SICI), a marker of GABA(A)-ergic function (Ziemann et al., 1996b) and intracortical facilitation (ICF), a marker of glutamatergic function (Ziemann et al., 1998), since in recent pharmacological studies blockade of NMDA receptors reduces ICF (Schwenkreis et al., 2000; Reis et al., 2006).
2.7. Statistical methodology
Statistical analyses were performed using SPSS library, 18.0 version. Chi-Square and Student t-test were applied to compare demographic and baseline clinical measures (Y-BOCS, Y-BOCS-SR, HDRS-24, CGI-S) between the active and sham groups. Student t-test was also applied to compare baseline neurophysiologic data (RMT, AMT, CSP, paired-pulse measures of SICI and ICF) between the active and sham groups. Repeated-measures analysis of variance (ANOVA) were applied to evaluate group and time-dependent effects of rTMS on psychometric scale mean scores. Baseline HDRS-24 was used as covariate in the ANOVA (ANCOVA) to examine the effect of depression on OCD symptom change. The same statistical approach (ANOVA) was used to test whether rTMS affects measures of motor cortex excitability after 2 and 4 weeks of treatment; the between subjects variables included the type of treatment (active rTMS and sham), the within subject variables were the side (left and right hemispheres motor thresholds-MTs) and in cortical silent period the additional effect of TMS intensity (110%, 130%, and 150% of AMT) while in paired-pulse measures the additional effect of ISI (1, 3, 6, 8, 10 and 12 ms). Baseline hemispheric asymmetry, defined as the difference between left and right hemispheres RMT and SICI at 3 ms of ISI, was used as covariate (ANCOVA) to examine whether the time by group interactions in right hemisphere RMT and SICI at 3 ms of ISI were still significant. Correlations were applied separately in the active and sham groups to examine the relationship between changes in OCD and CGI-S with changes in motor cortex excitability. All tests were conducted with two-sided significance levels (α=0.05) without corrections for multiple comparisons, due to the small sample size and to the exploratory nature of the study.
3. Results
3.1. Clinical outcome
Detailed clinical measures at baseline, after 2, and 4 weeks of active or sham rTMS in 18 completers are presented elsewhere (Mantovani et al., 2010). In summary, active and sham groups did not differ significantly in demographics or baseline clinical ratings. After 4 weeks of treatment, clinical response rate, defined as Y-BOCS reduction ≥ 25% (Simpson et al., 2006), in 18 patients was 67% (6 out of 9) with active and 22% (2 out of 9) with sham rTMS (Fig. 2). Repeated-measures ANOVA revealed a significant time by group interactions on Y-BOCS-SR (F=2.8, d.f.=4, p=0.031) and CGI-S (F=3.4, d.f.=2, p=0.044) (Table 2). Time by group interaction on the Y-BOCS-SR remained significant after controlling for baseline HDRS-24 (F=2.6, d.f.=4, p=0.043). On average, the active group showed a 25% reduction in Y-BOCS at 4 weeks, while the sham group showed a 12% reduction. On the Y-BOCS-SR, the active group showed a 30% reduction at 4 weeks, while the sham group showed an 8% reduction.
Fig. 2.
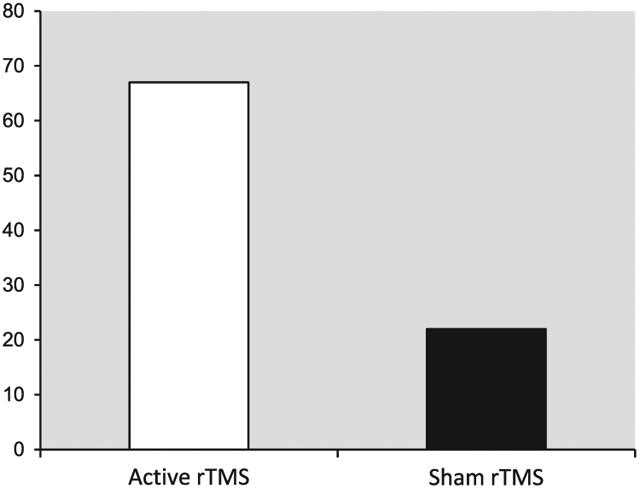
Clinical response rate after 4 weeks of active rTMS and sham*.
*Clinical response rate was defined as Y-BOCS reduction ≥ 25%.
Table 2.
Y-BOCS-SR and CGI-S across 4 weeks of active rTMS and sham to SMA in 18 patients with OCD.
| Dependent measures | Active rTMS (n=9) |
Sham (n=9) |
ANOVAa | ANOVAb | ||||
|---|---|---|---|---|---|---|---|---|
| Baseline | Week 2 | Week 4 | Baseline | Week 2 | Week 4 | |||
| Y-BOCS | 26±5.4 | 21.8±6 | 19.4±5.6 | 26.7±5.5 | 25±6.9 | 23.5±9 | F=12.6, d.f.=2, p=0.000 | ns |
| Y-BOCS-SR* | 26.1±5.7 | 20.4±7.1 | 18.4±8 | 27.3±6.9 | 26.1±8.1 | 25.1±8.9 | F=8.4, d.f.=4, p=0.000 | F=2.8, d.f.=4, p=0.031 |
| CGI-S | 5±0.7 | 4.4±0.8 | 4.1±0.9 | 5.2±0.9 | 5.1±1.1 | 5±1.3 | F=9.3, d.f.=2, p=0.001 | F=3.4, d.f.=2, p=0.044 |
Repeated-measures analysis of variance (ANOVA), main effect of time.
Repeated-measures analysis of variance (ANOVA), time by group (active versus sham) interaction.
Y-BOCS-SR was administered every week; in the table we report the mean scores obtained every 2 weeks.
3.2. Motor thresholds (MTs)
As reported previously (Mantovani et al., 2010), baseline RMT in the right hemisphere was lower in patients randomized to active rTMS (RMT=42.5±6.4) than sham (RMT=52.6±9.7) (t=−2.5, d.f.=2.16, p=0.02). We found a significant time by group interaction in right hemisphere RMT (F=4.5, d.f.=2.15, p=0.018), even when baseline RMT hemispheric asymmetry, defined as the difference between left and right hemispheres RMT, was used as covariate (F=3.1, d.f.=2.14, p=0.047). No significant time by group interaction was found in left hemisphere RMT.
Repeated measures ANOVA applied separately in each group showed that right hemisphere RMT increased with time in the active group (F=3, d.f.=4.5, p=0.032), and did not change significantly in the sham group although it numerically decreased after 4 weeks. The hemispheric asymmetry in RMT was greater at baseline in those patients assigned to the active rather than sham group (t=−2.4, d.f.=16, p=0.029), and this hemispheric difference was no longer evident after 4 weeks of active rTMS (Fig. 3).
Fig. 3.
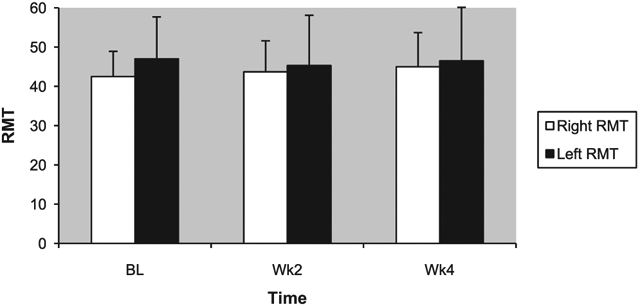
Resting motor thresholds (RMTs) across 4 weeks of active rTMS.
Baseline AMT in the right hemisphere was numerically lower, but not statistically significant, in patients randomized to active rTMS (AMT=35.5±6.2) than sham (AMT=40.2±8.3). We found no significant time by group interaction in either right or left hemisphere AMTs.
3.3. Cortical silent period (CSP)
Baseline CSP measured at 110%, 130%, and 150% of AMT in the left and right hemispheres did not significantly differ between the active and sham groups. Repeated-measures ANOVA did not reveal a significant time by group interaction in CSP at the three different intensities specified above in either the right or the left hemispheres.
3.4. Short-interval intracortical inhibition (SICI) and intracortical facilitation (ICF)
Baseline SICI and ICF in the left and right hemispheres did not significantly differ between the active and sham groups. However, repeated-measures ANOVA revealed a significant time by group interaction in SICI at 3 ms of interstimulus interval on the right hemisphere. Active, but not sham, rTMS significantly increased right hemisphere SICI (F=5.3, d.f.=2.14, p=0.019) after 4 weeks as shown by the reduction of the ratio between the average amplitude of the conditioned MEP and the average amplitude produced by the test pulse alone when the PP interstimulus interval was 3 ms (Fig. 4). The same pattern was seen when hemispheric asymmetry, defined as the difference between left and right SICI with paired-pulse interstimulus interval of 3 ms, was used as covariate (F=21.6, d.f.=2.13, p=0.000). We did not find a significant time by group interaction in SICI at 1 ms of interstimulus interval in either the right or the left hemispheres. No significant time by group interaction was found for the remaining paired-pulse interstimulus intervals, including in ICF.
Fig. 4.
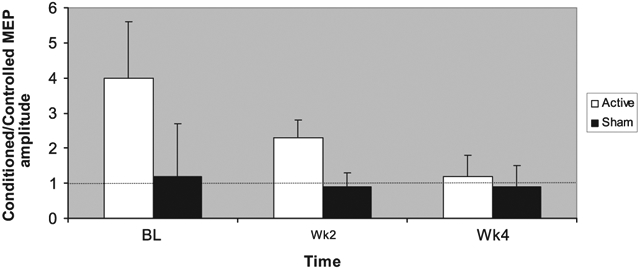
Right hemisphere short-interval intracortical inhibition (SICI) at ISI of 3 ms across 4 weeks of active rTMS or sham.
3.5. Relationship between clinical outcomes and neurophysiology measures
Because of the small sample we applied Spearman's correlations, considered more conservative and appropriate in order to decrease chance for type I error. Y-BOCS-SR and CGI-S, which significantly differentiated the active from the sham group after 4 weeks of rTMS, were correlated with neurophysiology measures. In the active group the increase in right hemisphere RMT after 4 weeks of rTMS was correlated with Y-BOCS-SR total score at baseline and at week 4 (R=0.8, p=0.009; R=0.7, p=0.047, respectively). Right hemisphere RMT at week 4 correlated with baseline Y-BOCS-SR total score (R=0.7, p=0.026).
Baseline hemispheric asymmetry in RMT and normalization of RMT asymmetry from baseline to week 4 after active rTMS correlated with Y-BOCS-SR improvement (R=0.7, p=0.025 and R=0.7, p=0.032, respectively) and with the decrease in CGI-S as well (R=−0.7, p=0.034 and R=−0.8, p=0.008, respectively).
Both baseline hemispheric asymmetry in RMT and its normalization after 4 weeks correlated with Y-BOCS-SR (R=−0.9, p=0.001 and R=−0.9, p=0.001) at week 4. There was a correlation between CGI-S at week 4 and normalization of baseline hemispheric asymmetry in RMT (R=−0.8, p=0.005).
Finally, in the active group right hemisphere SICI measurements (ISI of 3 ms) at 4 weeks correlated with Y-BOCS-SR total score and CGI-S at week 4 (R=0.7, p=0.040 and R=0.7, p=0.045, respectively) and with normalization of baseline hemispheric asymmetry in RMT (R=−0.8, p=0.020).
No significant correlations between motor cortex excitability measures and clinical outcomes were found in the group that received sham.
4. Discussion
Although patients were not randomized based on baseline cortical excitability measures, we found that active rTMS applied to the SMA in treatment-resistant OCD increased right hemisphere RMT, thereby normalizing hemispheric asymmetry in RMT, and increased right SICI. Furthermore, we found that cortical excitability measures correlated with effective clinical response. Specifically, treatment-induced increases in inhibition in right hemisphere, as evidenced by increased RMT and increased SICI, were correlated with therapeutic response. On the contrary, the mild clinical improvement in the sham group was not associated with significant changes in motor cortex excitability measures and is likely due to a placebo effect, which may involve other brain regions (Benedetti et al., 2005). This is the first rTMS clinical trial in OCD to demonstrate that TMS measures of cortical excitability, recorded before and after active treatment, are correlated with OCD response and clinical global improvement. These results, although preliminary, might shed light on possible mechanisms of action of active rTMS involving predominantly right hemispheric inhibitory action in OCD patients presenting with baseline motor cortex hyper-excitability (Greenberg et al., 1998; Greenberg et al., 2000).
Our finding of treatment-induced right hemisphere inhibition correlating with clinical response suggests that the anti-OCD action of bilateral pre-SMA rTMS may be mediated by predominantly right hemisphere motor circuits. This is in agreement with other studies which suggest that OCD treatment produces predominantly right-sided changes in cerebral activity (Saxena et al., 2002; Kang et al., 2003; Rauch et al., 2006). Thus, even though our intervention was bilateral, a unilateral impact on a physiological measure is consistent with other studies implicating hemispheric asymmetries in OCD and treatment response.
Our finding of a significant effect on SICI obtained with the 3 ms of interstimulus interval (ISI) and not the 1 ms ISI is consistent with recent literature reporting that intracortical inhibition has at least two distinct phases (1 ms and 3–5 ms ISI) with differing mechanisms (Hanajima et al., 2003). The 3 ms ISI is thought to be GABAergic in basis (Fisher et al., 2002; Roshan et al., 2003; Kang et al., 2007). Thus our findings also have implications for abnormality in inhibitory neurotransmitter levels in OCD. Specifically, rTMS-induced increase in right hemisphere SICI, a measure of GABA(A)-ergic function, and its correlations to clinical outcomes would support an important role for GABA(A) in OCD. In addition, we did not find a significant effect of rTMS on CSP, a measure of GABA(B)-ergic function; therefore, it might be possible that the rTMS applied in this study affected GABA(A)-ergic rather than GABA(B)-ergic functions.
In line with the hypothesis of a GABAergic dysfunction in OCD, Simpson et al. (2012) found decreased GABA signals in the medial prefrontal cortex of patients versus controls, and another study showed a significant increase in GABA signals in SMA after 4 weeks of MRI-guided rTMS, which resulted in significant clinical improvements in treatement-resistant OCD (Mantovani et al., 2011).
Our finding that 1-Hz rTMS to pre-SMA increased inhibition in primary motor cortex, as measured by RMT and SICI, is in line with Bäumer et al. (2009) who reported using TMS a direct functional connection from pre-motor ventral cortex to the ipsilateral primary motor cortex in healthy subjects. We hypothesize that inhibiting pre-SMA may alleviate OCD symptoms by modulating hyperactivity in the CTSC circuitry. In support of this hypothesis, tract-tracing studies in non-human primates demonstrate anatomical connections between SMA and ACC (Hatanaka et al., 2003); resting-state fMRI in both OCD patients and healthy controls demonstrate functional connectivity between the pre-SMA and the caudate and putamen (Harrison et al., 2009). Therefore, the clinical efficacy of pre-SMA rTMS in OCD might be explained by a trans-synaptic effect to the primary motor cortex, as we demonstrated, as well as to deeper regions of the CSTC circuitry implicated in OCD (Saxena and Rauch, 2000; Menzies et al., 2008). The trans-synaptic effect of premotor cortex rTMS has been demonstrated by evoked positive BOLD MRI responses in connected brain regions such as ACC and caudate nucleus (Bestmann et al., 2005).
Limitations of the study are the relatively small sample size and the fact that the groups were not randomized based on baseline RMT measures, considering that there was a difference between them at baseline; however, the effects of active rTMS on some of these measures (i.e. right hemisphere RMT) remained significant after adjusting for baseline differences. Neverthless, it is possible that the significant effect of active rTMS on the right hemisphere RMT may be due to regression to the mean, as in the active and sham groups the right hemisphere RMTs moved in opposite directions across 4 weeks. In the next clinical trial subjects will be stratified according to the baseline RMT.
We also note that 12 patients (n=6 active rTMS; n=6 sham) were receiving concomitant SSRIs. Both acute and chronic administration of SSRI medications have been associated with changes in motor cortex excitability (Gerdelat-Mas et al., 2005; Loubinoux et al., 2005). However, given that each group had the same number of patients on SSRIs, held stable for 3 months prior and throughout the trial, it is unlikely that changes in motor cortex excitability were due to an SSRI effect. Furthermore, the medicated and unmedicated groups did not differ in baseline excitability measures, or in therapeutic outcome on OCD symptoms (Mantovani et al., 2010).
Another limitation of the study concerns the rTMS intensity, set up at resting motor threshold, which could explain why no significant change in AMT and CSP was found after treatement. This suggests that our rTMS paradigm induces a change in brain excitability at rest (i.e. RMT and SICI) that is lost during voluntary activation (i.e. APB contraction during AMT and CSP measurements). In other words, it is possible that in the active state cortico-spinal excitability is significantly increased rendering our rTMS induced effects more difficult to detect. These effects would be expected to become more apparent at rest. Our results provide support for this view as active rTMS did not affect AMT and CSP but clearly increased RMT and SICI. Finally, the sample size was too small to permit meaningful comparison of OCD subgroups or symptom clusters.
Although the study presents limitations, and the neurophysiologic results found in the first randomized sham-controlled trial of SMA stimulation in the treatment of OCD should be considered exploratory, they are informative and support further investigation into the potential mechanism of action of therapeutic applications of rTMS in this disabling condition.
Supplementary Material
Acknowledgments
This research was supported by the Department of Psychiatry, Columbia University/New York State Psychiatric Institute, the Department of Neuroscience, Siena University, and by an International Obsessive Compulsive Foundation award (to AM) and a NIH K24 MH091555 (to HBS). We thank Dr Naihua Duan, Director of the Division of Biostatistics and Data Coordination at the Department of Psychiatry of Columbia University and New York State Psychiatric Institute for his contribution in reviewing the statistical analyses of the data. We also thank the TMS lab managers, Timothy Spellman, BA, and Teresa Ngyuen, BS, who coordinated subjects' recruitment and experimental set up at Columbia University Department of Psychiatry/New York State Psychiatric Institute.
This study was presented in abstract form at the 65th annual meeting of the Society of Biological Psychiatry, May 20–22, 2010.
Footnotes
Financial disclosures
Drs Mantovani, Fallon, and Rossi as well as Bruce Bassi have no competing interests to report.
Dr. Simpson has received research funds for clinical trials from Janssen Pharmaceuticals (2006–2012), Transcept Pharmaceuticals (2011–2013), and Neuropharm, Ltd. (2009), served on a Scientific Advisory Board for Pfizer (for Lyrica, 2009–2010) and Jazz Pharmaceuticals (for Luvox CR, 2007–2008), consulted for Quintiles, Inc. (on therapeutic needs for OCD, September, 2012), and receives royalties from Cambridge University Press and UpToDate, Inc.
Dr. Lisanby has served as PI on industry-sponsored research grants to Columbia/RFMH or Duke (Neurosync, Neuronetics (past), Brainsway, ANS/St. Jude, Cyberonics (past)); equipment loans to Columbia or Duke (Magstim, MagVenture); is co-inventor on a patent application assigned to Columbia for TMS technology not the topic of study here; and has no consultancies, speakers bureau memberships, board affiliations, or equity holdings in related industries.
Appendix A. Supporting information
Supplementary data associated with this article can be found in the online version at http://dx.doi.org/10.1016/j.psychres.2013.08.054.
References
- Baer L, Brown-Beasley MW, Sorce J, Henriques AI, 1993. Computer-assisted telephone administration of a structured interview for obsessive-compulsive disorder. American Journal of Psychiatry 150, 1737–1738. [DOI] [PubMed] [Google Scholar]
- Bäumer T, Schippling S, Kroeger J, Zittel S, Koch G, Thomalla G, Rothwell JC, Siebner HR, Orth M, Münchau A, 2009. Inhibitory and facilitatory connectivity from ventral premotor to primary motor cortex in healthy humans at rest—a bifocal TMS study. Clinical Neurophysiology 120, 1724–1731. [DOI] [PubMed] [Google Scholar]
- Benedetti F, Mayberg HS, Wager TD, Stohler CS, Zubieta JK, 2005. Neurobiological mechanisms of the placebo effect. Journal of Neuroscience 25, 10390–10402. [DOI] [PMC free article] [PubMed] [Google Scholar]
- Bestmann S, Baudewig J, Siebner HR, Rothwell JC, Frahm J, 2005. BOLD MRI responses to repetitive TMS over human dorsal premotor cortex. Neuroimage 28, 22–29. [DOI] [PubMed] [Google Scholar]
- Brasil-Neto JP, Cammarota J, Valls-Sole J, Pascual-Leone A, Hallett M, Cohen LG, 1995. Role of intracortical mechanisms in the late part of the silent period to transcranial stimulation of the human motor cortex. Acta Neurologica Scandinavia 92, 383–386. [DOI] [PubMed] [Google Scholar]
- Chamberlain SR, Blackwell AD, Fineberg NA, Robbins TW, Sahakian BJ, 2005. The neuropsychology of obsessive compulsive disorder: the importance of failures in cognitive and behavioural inhibition as candidate endophenotypic markers. Neuroscience and Biobehavioral Review 29, 399–419. [DOI] [PubMed] [Google Scholar]
- Chen R, Classen J, Gerloff C, Celnik P, Wassermann EM, Hallett M, 1997. Depression of motor cortex excitability by low-frequency transcranial magnetic stimulation. Neurology 48, 1398–1403. [DOI] [PubMed] [Google Scholar]
- Cincotta M, Giovannelli F, Borgheresi A, Balestrieri F, Toscani L, Zaccara G, Carducci F, Viggiano MP, Rossi S, 2010. Optically tracked neuronavigation increases the stability of hand-held focal coil positioning: evidence from “transcranial” magnetic stimulation-induced electrical field measurements. Brain Stimulation 3, 119–123. [DOI] [PubMed] [Google Scholar]
- First MB, Spitzer RL, Gibbon M, Williams JB, 1997. Structured Clinical Interview for DSM-IV® Axis I Disorders (SCID-I), Clinician Version. American Psychiatry Publishing Inc., Virginia. [Google Scholar]
- Fisher RJ, Nakamura Y, Bestmann S, Rothwell JC, Bostock H, 2002. Two phases of intracortical inhibition revealed by transcranial magnetic threshold tracking. Experimental Brain Research 143, 240–248. [DOI] [PubMed] [Google Scholar]
- Fried I, Katz A, McCarthy G, Sass KJ, Williamson P, Spencer SS, Spencer DD, 1991. Functional organization of human supplementary motor cortex studied by electrical stimulation. Journal of Neuroscience 11, 3656–3666. [DOI] [PMC free article] [PubMed] [Google Scholar]
- Gerdelat-Mas A, Loubinoux I, Tombari D, Rascol O, Chollet F, Simonetta-Moreau M, 2005. Chronic administration of selective serotonin reuptake inhibitor (SSRI) paroxetine modulates human motor cortex excitability in healthy subjects. Neuroimage 27, 314–322. [DOI] [PubMed] [Google Scholar]
- Goodman WK, Price LH, Rasmussen SA, Mazure C, Fleischmann RL, Hill CL, Heninger GR, Charney DS, 1989a. The Yale-Brown Obsessive Compulsive Scale. I. Development, use, and reliability. Archives of General Psychiatry 46, 1006–1011. [DOI] [PubMed] [Google Scholar]
- Goodman WK, Price LH, Rasmussen SA, Mazure C, Delgado P, Heninger GR, Charney DS, 1989b. The Yale-Brown Obsessive Compulsive Scale. II. Validity. Archives of General Psychiatry 46, 1012–1016. [DOI] [PubMed] [Google Scholar]
- Greenberg BD, Ziemann U, Harmon A, Murphy DL, Wassermann EM, 1998. Decreased neuronal inhibition in cerebral cortex in obsessive-compulsive disorder on transcranial magnetic stimulation. Lancet 352, 881–882. [DOI] [PubMed] [Google Scholar]
- Greenberg BD, Ziemann U, Cora-Locatelli G, Harmon A, Murphy DL, Keel JC, Wassermann EM, 2000. Altered cortical excitability in obsessive-compulsive disorder. Neurology 54, 142–147. [DOI] [PubMed] [Google Scholar]
- Guy W, 1976. ECDEU Assessment Manual for Psychopharmacology. Revised. National Institute of Mental Health, Rockville, MD. (DHEW publication no. (ADM) 76–338). [Google Scholar]
- Harrison BJ, Soriano-Mas C, Pujol J, Ortiz H, López-Solà M, Hernández-Ribas R, Deus J, Alonso P, Yücel M, Pantelis C, Menchon JM, Cardoner N, 2009. Altered corticostriatal functional connectivity in obsessive-compulsive disorder. Archives of General Psychiatry 66, 1189–1200. [DOI] [PubMed] [Google Scholar]
- Hanajima R, Furubayashi T, Iwata NK, Shiio Y, Okabe S, Kanazawa I, Ugawa Y, 2003. Further evidence to support different mechanisms underlying intracortical inhibition of the motor cortex. Experimental Brain Research 151,427–434. [DOI] [PubMed] [Google Scholar]
- Hatanaka N, Tokuno H, Hamada I, Inase M, Ito Y, Imanishi M, Hasegawa N, Akazawa T, Nambu A, Takada M, 2003. Thalamocortical and intracortical connections of monkey cingulate motor areas. Journal of Comprehensive Neurology 462, 121–138. [DOI] [PubMed] [Google Scholar]
- Kang DH, Kwon JS, Kim JJ, Youn T, Park HJ, Kim MS, Lee DS, Lee MC, 2003. Brain glucose metabolic changes associated with neuropsychological improvements after 4 months of treatment in patients with obsessive-compulsive disorder. Acta Psychiatrica Scandinavica 107, 291–297. [DOI] [PubMed] [Google Scholar]
- Kang SY, Shin HW, Sohn YH, 2007. Different modulation of the cortical silent period by two phases of short interval intracortical inhibition. Yonsei Medical Journal 48, 795–801. [DOI] [PMC free article] [PubMed] [Google Scholar]
- Koran LM, Hanna GL, Hollander E, Nestadt G, Simpson HB, 2007. American Psychiatric Association: practice guideline for the treatment of patients with obsessive-compulsive disorder. American Journal of Psychiatry, 164;, pp. 5–53. [PubMed] [Google Scholar]
- Kujirai T, Caramia MD, Rothwell JC, Day BL, Thompson PD, Ferbert A, Wroe S, Asselman P, Marsden CD, 1993. Corticocortical inhibition in human motor cortex. Journal of Physiology 471, 501–519. [DOI] [PMC free article] [PubMed] [Google Scholar]
- Leocani L, Locatelli M, Bellodi L, Fornara C, Hénin M, Magnani G, Mennea S, Comi G, 2001. Abnormal pattern of cortical activation associated with voluntary movement in obsessive-compulsive disorder: an EEG study. American Journal of Psychiatry 158, 140–142. [DOI] [PubMed] [Google Scholar]
- Loubinoux I, Tombari D, Pariente J, Gerdelat-Mas A, Franceries X, Cassol E, Rascol O, Pastor J, Chollet F, 2005. Modulation of behavior and cortical motor activity in healthy subjects by a chronic administration of a serotonin enhancer. Neuroimage 27, 299–313. [DOI] [PubMed] [Google Scholar]
- Mantovani A, Lisanby SH, Pieraccini F, Ulivelli M, Castrogiovanni P, Rossi S, 2006. Repetitive transcranial magnetic stimulation (rTMS) in the treatment of obsessive-compulsive disorder (OCD) and Tourette's syndrome (TS). International Journal of Neuropsychopharmacology 9, 95–100. [DOI] [PubMed] [Google Scholar]
- Mantovani A, Leckman JF, Grantz H, King RA, Sporn AL, Lisanby SH, 2007. Repetitive transcranial magnetic stimulation of the supplementary motor area in the treatment of Tourette syndrome: report of two cases. Clinical Neurophysiology 118, 2314–2315. [DOI] [PubMed] [Google Scholar]
- Mantovani A, Fallon B, Simpson H, Rossi S, Lisanby SH, 2010. Randomized sham-controlled trial of repetitive transcranial magnetic stimulation in treatment-resistant obsessive-compulsive disorder. International Journal of Neuropsychopharmacology 13, 217–227. [DOI] [PubMed] [Google Scholar]
- Mantovani A, Kegeles LS, Simpson BH, Aly M, Allart A, Harrison A, Rossi S, Lisanby SH, 2011. Modulation of premotor GABAergic circuits in Obsessive-Compulsive Disorder (OCD) via transcranial magnetic stimulation: evidence from magnetic resonance spectroscopy. Clinical Neurophysiology 122 (1S-214S), 181. [Google Scholar]
- Mantovani A, Leckman J, Aly M, Harrison A, Murphy D, Lisanby S, 2012. Effect of transcranial magnetic stimulation (TMS) on clinical symptoms and motor cortex excitability measures in tourette's syndrome. International. Journal of Neuropsychopharmacology, 15; , pp. 1S–271S. [Google Scholar]
- Menzies L, Chamberlain SR, Laird AR, Thelen SM, Sahakian BJ, Bullmore ET, 2008. Integrating evidence from neuroimaging and neuropsychological studies of obsessive-compulsive disorder: the orbitofronto-striatal model revisited. Neuroscience & Biobehavioral Reviews 32, 525–549. [DOI] [PMC free article] [PubMed] [Google Scholar]
- Picard N, Strick PL, 2001. Imaging the premotor areas. Current Opinions in Neurobiology 11, 663–672. [DOI] [PubMed] [Google Scholar]
- Rauch SL, Dougherty DD, Malone D, Rezai A, Friehs G, Fischman AJ, Alpert NM, Haber SN, Stypulkowski PH, Rise MT, Rasmussen SA, Greenberg BD, 2006. A functional neuroimaging investigation of deep brain stimulation in patients with obsessive-compulsive disorder. Journal of Neurosurgery 104, 558–565. [DOI] [PubMed] [Google Scholar]
- Reis J, John D, Heimeroth A, Mueller HH, Oertel WH, Arndt T, Rosenow F, 2006. Modulation of human motor cortex excitability by single doses of amantadine. Neuropsychopharmacology 31, 2758–2766. [DOI] [PubMed] [Google Scholar]
- Richter MA, de Jesus DR, Hoppenbrouwers S, Daigle M, Deluce J, Ravindran LN, Fitzgerald PB, Daskalakis ZJ, 2012. Evidence for cortical inhibitory and excitatory dysfunction in obsessive compulsive disorder. Neuropsychopharmacology 37, 1144–1151. [DOI] [PMC free article] [PubMed] [Google Scholar]
- Roshan L, Paradiso GO, Chen R, 2003. Two phases of short-interval intracortical inhibition. Experimental Brain Research 151, 330–337. [DOI] [PubMed] [Google Scholar]
- Rossi S, Bartalini S, Ulivelli M, Mantovani A, Di Muro A, Goracci A, Castrogiovanni P, Battistini N, Passero S, 2005. Hypofunctioning of sensory gating mechanisms in patients with obsessive-compulsive disorder. Biological Psychiatry 57, 16–20. [DOI] [PubMed] [Google Scholar]
- Rossi S, De Capua A, Tavanti M, Calossi S, Polizzotto NR, Mantovani A, Falzarano V, Bossini L, Passero S, Bartalini S, Ulivelli M, 2009a. Dysfunctions of cortical excitability in drug-naïve post-traumatic stress disorder patients. Biological Psychiatry 166, 54–61. [DOI] [PubMed] [Google Scholar]
- Rossi S, Hallett M, Rossini PM, Pascual-Leone A, 2009b. Safety of TMS Consensus Group: safety, ethical considerations, and application guidelines for the use of transcranial magnetic stimulation in clinical practice and research. Clinical Neurophysiology 120, 2008–2039. [DOI] [PMC free article] [PubMed] [Google Scholar]
- Rossini PM, Barker AT, Berardelli A, Caramia MD, Caruso G, Cracco RQ, Dimitrijević MR, Hallett M, Katayama Y, Lücking CH, de Noordhout M, Marsden CD, Murray NMF, Rothwell JC, Swash M, Tomberg C, 1994. Non-invasive electrical and magnetic stimulation of the brain, spinal cord and roots: basic principles and procedures for routine clinical application. Electroencephalography and Clinical Neurophysiology 91, 79–92. [DOI] [PubMed] [Google Scholar]
- Saxena S, Rauch SL, 2000. Functional neuroimaging and the neuroanatomy of OCD. Psychiatric Clinics of North America 23, 563–586. [DOI] [PubMed] [Google Scholar]
- Saxena S, Brody AL, Ho ML, Alborzian S, Maidment KM, Zohrabi N, Ho MK, Huang SC, Wu HM, Baxter LR Jr., 2002. Differential cerebral metabolic changes with paroxetine treatment of obsessive-compulsive disorder vs major depression. Archives of General Psychiatry 59, 250–261. [DOI] [PubMed] [Google Scholar]
- Schwenkreis P, Liepert J, Witscher K, Fischer W, Weiller C, Malin JP, Tegenthoff M, 2000. Riluzole suppresses motor cortex facilitation in correlation to its plasma level. A study using transcranial magnetic stimulation. Experimental Brain Research 135, 293–299. [DOI] [PubMed] [Google Scholar]
- Siebner HR, Dressnandt J, Auer C, Conrad B, 1998. Continuous intrathecal baclofen infusions induced a marked increase of the transcranially evoked silent period in a patient with generalized dystonia. Muscle & Nerve 21, 1209–1212. [DOI] [PubMed] [Google Scholar]
- Simpson HB, Huppert JD, Petkova E, Foa EB, Liebowitz MR, 2006. Response versus remission in obsessive-compulsive disorder. Journal of Clinical Psychiatry 67, 269–276. [DOI] [PubMed] [Google Scholar]
- Simpson HB, Shungu DS, Bender J, Mao X, Xu X, Slifstein M, Kegeles LS, 2012. Investigation of cortical glutamate–glutamine and γ-aminobutyric acid in obsessive-compulsive disorder by proton magnetic resonance spectroscopy. Neurpsychopharmacology 37, 2684–2692. [DOI] [PMC free article] [PubMed] [Google Scholar]
- Steketee G, Frost R, Bogart K, 1996. The Yale-Brown Obsessive Compulsive Scale: interview versus self-report. Behavioral Research and Therapy 34, 675–684. [DOI] [PubMed] [Google Scholar]
- Van den Heuvel OA, Veltman DJ, Groenewegen HJ, Cath DC, van Balkom AJ, van Hartskamp J, Barkhof F, van Dyck R, 2005. Frontal-striatal dysfunction during planning in OCD. Archives of General Psychiatry 62, 301–309. [DOI] [PubMed] [Google Scholar]
- Yucel M, Harrison BJ, Wood SJ, Fornito A, Wellard RM, Pujol J, Clarke K, Phillips ML, Kyrios M, Velakoulis D, Pantelis C, 2007. Functional and biochemical alterations of the medial frontal cortex in OCD. Archives of General Psychiatry 64, 946–955. [DOI] [PubMed] [Google Scholar]
- Ziemann U, Lönnecker S, Steinhoff BJ, Paulus W, 1996a. Effects of antiepileptic drugs on motor cortex excitability in humans: a transcranial magnetic stimulation study. Annals of Neurology 40, 367–378. [DOI] [PubMed] [Google Scholar]
- Ziemann U, Lönnecker S, Steinhoff BJ, Paulus W, 1996b. The effect of lorazepam on the motor cortical excitability in man. Experimental Brain Research 109, 127–135. [DOI] [PubMed] [Google Scholar]
- Ziemann U, Chen R, Cohen LG, Hallett M, 1998. Dextromethorphan decreases the excitability of the human motor cortex. Neurology 51, 1320–1324. [DOI] [PubMed] [Google Scholar]
Associated Data
This section collects any data citations, data availability statements, or supplementary materials included in this article.