

Abstract
In this article we will review the imaging features of coronavirus disease 2019 (COVID-19) across multiple modalities, including radiography, CT, MRI, PET/CT, and US. Given that COVID-19 primarily affects the lung parenchyma by causing pneumonia, our directive is to focus on thoracic findings associated with COVID-19. We aim to enhance radiologists’ understanding of this disease to help guide diagnosis and management.
Supplemental material is available for this article.
© RSNA, 2020
Summary
The purpose of this review is to describe the spectrum of radiologic features seen in coronavirus disease 2019 across multiple imaging modalities and provide an overview of their clinical utility in both the diagnosis and management of patients.
Essentials
■ Describe the clinical utility and imaging features of the modalities most commonly used in diagnosis and evaluation of coronavirus disease 2019 (COVID-19), namely chest radiography and CT.
■ Describe the clinical utility and imaging features of the modalities less commonly used in diagnosis and evaluation of COVID-19, particularly MRI and PET/CT.
■ Describe the clinical utility of chest US and echocardiography in COVID-19, specifically as a point of care evaluation in the emergency department or intensive care setting for both diagnosis and evaluation of extent of lung disease and complications such as pulmonary embolism and right heart strain.
■ Discuss potential future applications of artificial intelligence in COVID-19 diagnosis and management.
■ Examine thromboembolic and extrathoracic imaging features in COVID-19.
Introduction
Coronavirus disease 2019 (COVID-19) is caused by the novel severe acute respiratory syndrome coronavirus 2. COVID-19 rapidly spread worldwide soon after the first diagnosis was confirmed in China’s Hubei province in December 2019 (1).
The clinical presentation of COVID-19 can be nonspecific, and diagnosis is confirmed by a positive reverse-transcription polymerase chain reaction (RT-PCR) nasopharyngeal or oropharyngeal swab test. The test is highly specific; however, the sensitivity is reportedly as low as 60%–70% due to insufficient viral load or failure of nucleic acid extraction (2,3). The high rate of false-negative results, particularly early in disease time course, and the inconsistent availability of testing, means that a systematic approach to diagnosis must be employed, including the use of radiologic imaging. While chest radiography and CT are not official components of the diagnostic criteria for COVID-19 in the United States, CT and, less frequently, chest radiography have been used to support the diagnosis, determine severity, guide treatment, and assess treatment response (4).
Still, without consensus, there may be a role for other imaging modalities as well. Preliminary investigators have suggested that chest US may play a useful role in early diagnosis, particularly as a point-of-care service (POC) (5). Given the role that inflammation may play in COVID-19’s pathophysiology and progression, PET imaging has also been explored (6–8). At the time of writing, no reports on MRI findings of COVID-19 have been published with respect to pulmonary findings, and only a few case reports have been published with respect to cardiac-related disease; however, images are included in this review. The utility of echocardiography in evaluating patients with COVID-19 is also discussed. The growing incidence of extrathoracic and thrombotic manifestations of COVID-19 are described as well. The role and potential applications of artificial intelligence (AI), which is playing a burgeoning role concurrent with these various modalities, will also be considered.
Clinical Presentation
COVID-19 typically manifests with lower respiratory manifestations. Nonspecific signs and symptoms include fever, dry or productive cough, fatigue, and shortness of breath. Less common symptoms include myalgia, headache, sore throat, and chills (9). Gastrointestinal symptoms are much less frequent but may occur (10). Anosmia and hyposmia are reported in up to two-thirds of those infected and may be the only clinical manifestation, particularly in children and young adults (11).
Disease severity varies widely from asymptomatic to critically severe. Most patients have mild disease, which is characterized by a lack of radiographic evidence of pneumonia on chest radiograph and peripheral capillary oxygen saturation SpO2 > 94%. Moderate disease is characterized by imaging findings of pneumonia or an SpO2 < 94%. Severe disease is characterized by an SpO2 < 94% at rest, requiring oxygen supplementation with high-flow nasal cannula, nonrebreather mask, bilevel positive airway pressure, or mechanical ventilation (12). Critical disease is characterized by respiratory failure requiring oxygen supplementation with signs of extrapulmonary end-organ damage, including cardiovascular shock, acute renal injury (as measured by an estimated glomerular filtration rate of < 30 mL/min/1.73 m2), or acute liver injury (as measured by alanine aminotransferase greater than 5 times the upper limit of normal) (13).
Special Circumstances Related to Workflow and Technique
The stresses of COVID-19 on a radiology department have caused alterations to workflow that have varied on the basis of institution and country. COVID-19 has forced both academic and private radiology practices to adjust to substantial decreases in outpatient imaging volumes, which has impactful economic ramifications. When chest CT is indicated, it may be performed without contrast material according to the department’s standard chest CT protocol without change to technical parameters, although some have adopted a low-dose protocol because abnormalities can be readily detected at reduced radiation doses (14).
Chest Radiography
For most patients who present with COVID-19, the first, and possibly only, imaging evaluation is a solitary portable anteroposterior chest radiograph. Length and severity of infection at the time of image acquisition affect appearance on chest radiograph. In conjunction with clinical findings such as symptoms and oxygen saturation, appearance on chest radiograph can aid in assessing severity of illness and guiding management.
Unfortunately, many patients who are positive for COVID-19 on PCR testing will have a falsely negative chest radiography result (15). There are multiple reasons for a normal chest radiograph in COVID-19–positive patients, including lack of lung involvement at the time of presentation, acquisition early in disease course, and subtlety of findings on chest radiograph, particularly on more limited portable anteroposterior radiographs. As a result, chest radiography findings have been reported to have a lower sensitivity than initial RT-PCR testing (69% vs 70%–91%, respectively) (16).
When baseline chest radiography is positive, COVID-19 manifests with consistent findings, the most common of which is hazy opacification, the likely radiographic correlate of ground-glass opacity (GGO) seen at CT (17). The opacities are sometimes rounded in morphology and have a peripheral and lower lung distribution (Fig 1, A). Lung findings may be unilateral or bilateral, and as the disease progresses, more of the mid to upper lungs may be affected. While uncommon, isolated opacities can appear in the upper lobes in the setting of mild disease.
Figure 1:

A, Posteroanterior chest radiograph in a 29-year-old woman with no past medical history, who presented to the emergency department with 4 days of fever, cough, pleuritic chest pain, diarrhea, and myalgias, shows faint peripheral rounded opacities in a lower lung distribution (arrows). B, Chest radiograph in a 40-year-old man with a history of diabetes mellitus who presented from a group home with fever, cough, and shortness of breath of duration 1 week demonstrates diffuse bilateral opacities with dense consolidation in the mid to lower lungs. C, Portable chest radiograph in an intubated 50-year-old man with a history of hypertension who presented with 1 week of fever, cough, congestion, and myalgias. On his 7th day of admission, 14 days after symptom onset, chest radiograph demonstrates multiple bilateral diffuse hazy pulmonary opacities. The patient was noted to have elevated inflammatory markers including C-reactive protein, interleukin-6, d-dimer, lactate dehydrogenase, and fibrinogen. All patients were confirmed positive for coronavirus disease 2019 with polymerase chain reaction testing, and the patient in C died two days later.
As the disease progresses and becomes more severe, the opacities may coalesce and become denser, presenting as patchy consolidative opacities (Fig 1, B). These findings typically peak 10–12 days after symptom onset. Additionally, pulmonary opacification may become diffuse, mimicking the imaging (and clinical) presentation of diffuse alveolar damage, such as may be seen in the setting of acute respiratory distress syndrome (Fig 1, C).
While two-view posteroanterior and lateral chest radiography is the ideal radiographic technique, portable anteroposterior chest radiography is adequate in assessing parenchymal findings associated with COVID-19. By employing portable radiography, hospitals can limit transport of these highly contagious patients, as well as exposure to radiology staff. The American College of Radiology recommends that COVID-19 patients undergo only portable chest radiography as their primary means of imaging assessment (16). Performing serial portable chest radiography allows the radiologist and the treatment team to monitor progression of disease within the lungs. In addition, assessment of lines and tubes and potential complications such as pneumothorax, subcutaneous emphysema, and pneumomediastinum can be performed (Fig 2).
Figure 2:
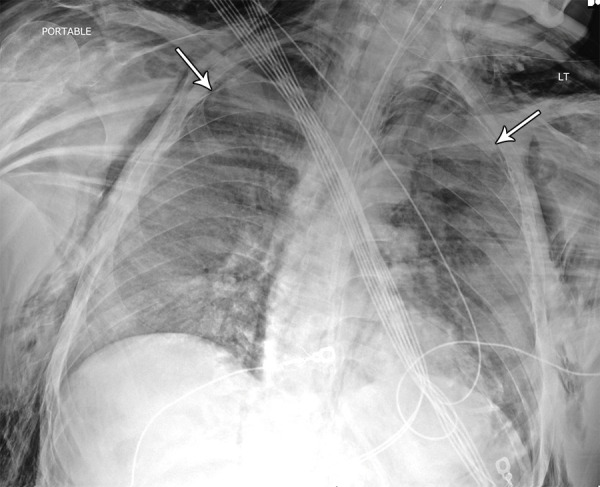
Image in 42-year-old man with no past medical history other than obesity intubated in the intensive care unit. Chest radiograph demonstrates diffuse dense opacities with small bilateral pneumothoraces (arrows) in addition to severe bilateral neck and chest wall subcutaneous emphysema. The etiology of the air leak is unknown but suspected to be related to mechanical ventilation and high positive end-expiratory pressure settings, a finding that has been previously associated with acute respiratory distress syndrome. The patient was confirmed to be positive for coronavirus disease 2019 with polymerase chain reaction testing.
CT
While chest radiography remains an adequate screening and assessment tool for COVID-19 in most patients, chest CT is far more sensitive, with early reports of up to 97% sensitivity (3). CT can detect early disease, as occult or subtle hazy opacities on chest radiographs appear as readily identifiable GGOs on CT scans (Fig 3). The typical findings of COVID-19 at chest CT are multiple bilateral GGOs (57%) with or without consolidation (29%), often with a rounded morphology and peripheral and lower lung distribution (18). Sublobar and segmental consolidation, though less common, can also be seen (Fig 4). On CT scans, GGO is defined as hazy increased lung attenuation with preservation of the bronchial and vascular margins, while consolidation refers to denser opacification that obscures vessel margins and airway walls. Pure GGO lesions are characteristic of mild or early COVID-19 pneumonia with progression on serial CT scans showing increased lung involvement and development of mixed attenuation (the second most prevalent pattern). In addition, GGO with superimposed interlobular septal thickening and visible intralobular lines (“crazy paving”) may be present, particularly later in disease time course (15).
Figure 3:
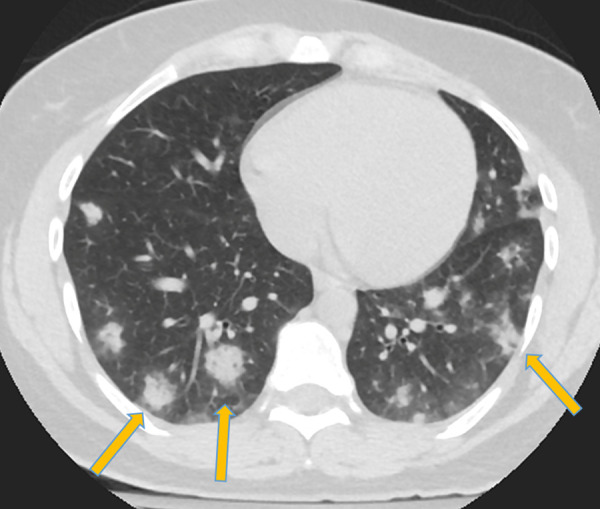
Corresponding axial chest CT scan without intravenous contrast material in patient in Figure 1 shows typical findings of coronavirus disease 2019 with peripheral and lower lobe–predominant dense consolidative opacities with a rounded morphology and mild surrounding ground-glass opacification (arrows).
Figure 4:

A, Chest radiograph and B, axial non–contrast-enhanced chest CT scan in a 27-year-old man with no past medical history, who presented with a fever, vomiting, and myalgias of duration 3 days, demonstrate dense consolidation in the apicoposterior segment of the left upper lobe (arrows). The patient was confirmed to be positive for coronavirus disease 2019 with polymerase chain reaction testing. This single upper lobe involvement represents an atypical pattern of disease without any associated identifying factors in the patient’s history or presentation.
CT abnormalities progress rapidly after symptom onset and are reported to peak between days 6 and 13 of the illness (19,20). In later and more severe stages, consolidation can become the predominant abnormality and can become diffusely distributed with a more reticular configuration (Fig 5). There is an expected but variable pattern of resolution and healing thereafter—an evolution consistent with organization and fibrosis that occurs after any form of acute lung injury (21). In one study, 66 of 70 patients (94%) discharged from the hospital had residual disease on their latest CT scans, most often GGO (19).
Figure 5:
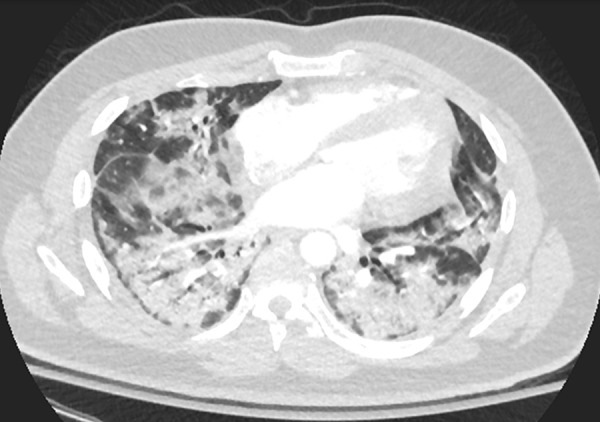
Axial chest CT scan following intravenous contrast material administration in the lower lungs of a 30-year-old male former smoker with a history of asthma who presented with fever, cough, and left lower back pain 3 weeks after symptom onset. CT demonstrates extensive dense patchy consolidation with relative subpleural sparing, most severe in the lung bases. Throughout the patient’s hospital course, he required supplemental oxygen via a nonrebreather mask and was noted to have elevated inflammatory markers, including C-reactive protein and interleukin-6. The patient was confirmed to be positive for coronavirus disease 2019 with polymerase chain reaction testing.
Less commonly reported imaging findings include subsegmental vascular engorgement (defined in studies as peripheral vessels measuring more than 3 mm in diameter) in areas of lung opacity; in one study, this was observed in 89% of patients with confirmed COVID-19 pneumonia and may be related to proinflammatory factors or infection-induced hyperemia (22).
Another relatively infrequently reported finding is the atoll sign (or “reverse halo” sign) on CT scans, defined as a rounded area of more lucent GGO surrounded by a complete or almost complete ring of denser consolidation (15). This finding is typically encountered in the subacute to chronic stages of lung injury with the development of organization and early fibrosis, which may be a reason why the earliest COVID-19 investigators found this imaging feature to be infrequent (Fig 6). Of note, the atoll sign can also be concerning for pulmonary infarction (23). In this clinical context, patients should undergo further workup for pulmonary embolism, either through chest CT pulmonary angiography or venous duplex ultrasonography when CT pulmonary angiography is contraindicated; these considerations are discussed in further detail below. The CT halo sign, defined as consolidative nodules or masses surrounded by GGO, is another atypical finding reported in COVID-19. It has also been seen in other viral pneumonias, angioinvasive fungal infections, hypervascular metastases, and vasculitides and may be related to perilesional hemorrhage or edema.
Figure 6:
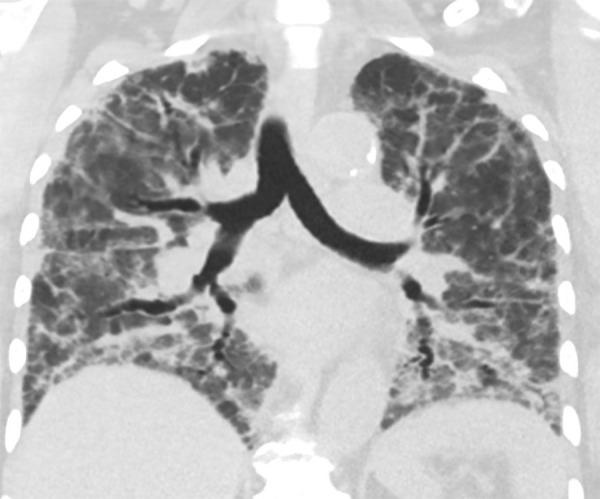
Coronal chest CT scan in a 73-year-old woman with a history of hypertension and lupus and hospitalized for worsening respiratory status. Follow-up CT scan 30 days after initial symptoms demonstrates widespread reticulation with geographic regions of bronchiectasis and ground-glass opacity and clear demarcations between spared lobules, consistent with an organizing pattern.
It is noteworthy that early in the disease, there is a notable absence of pleural effusions, lung cavitation, mediastinal lymphadenopathy, and discrete pulmonary nodules (eg, centrilobular nodules or tree-in-bud opacities) (17,21,24).
The imaging findings of COVID-19 represent an interesting form of acute lung injury that progresses to an acute respiratory distress syndrome–like picture with patterns that overlap with organizing pneumonia of any cause (25). Distinguishing COVID-19 infection from other conditions with similar chest radiography and CT findings requires consideration of all clinical information, exposure history, and alternative diagnoses (26).
Regarding diagnostic capability, CT boasts an impressive sensitivity (∼94%) in detecting COVID-19. However, the overlapping features described above result in a poor specificity (∼39%), leading to concerns over its use in screening. A recent meta-analysis comparing CT and RT-PCR demonstrated that CT possessed a low positive predictive value and a concomitant risk of high false-positive results in low-prevalence areas (27). In areas with high prevalence, the benefit of diagnostic use must be considered against the risks of radiation and infection.
In addition to its utility in identifying early parenchymal lung disease and evaluating disease progression, chest CT can identify alternative or concurrent diagnoses, especially in patients with multiple comorbidities. As discussed below, there are increasing reports of hospitalized patients developing coagulopathies and pulmonary thromboembolism; therefore, we anticipate that the role of CT pulmonary angiography for patients with COVID-19 will become more defined (4). In particular, CT pulmonary angiography has been demonstrated to be a powerful tool specifically in the risk stratification and diagnosis of hemodynamically stable patients presenting with acute pulmonary embolism, as evidenced by high Well score, revised Geneva score, or d-dimer value (28). In this group, prognosis has been shown to be correlated with central localization of emboli (29). CT pulmonary angiography can further be used to determine extent of clot burden, document right heart strain, assess for reflux of contrast material, and elucidate potential complications such as pulmonary infarct (29,30).
MRI
To date, the pulmonary MRI features of COVID-19 have not been described. Currently, cardiac MRI is not being performed for many patients with elevations in troponin or suspected of having myocardial injury related to myocarditis, as part of a risk and benefit assessment related to infection control measures. Due to the overwhelming prevalence of the disease, MRI examinations performed for various indications, including cardiac, vascular, and upper abdominal MRI, can demonstrate incidental findings related to COVID-19 in the pulmonary parenchyma. The pulmonary distribution of COVID-19 at MRI is consistent with CT and chest radiography, including basilar- and peripheral-predominant disease. On MR images, the parenchymal changes of COVID-19 pneumonia appear as regions of abnormal increased signal intensity on both T1- and T2-weighted sequences, corresponding to the ground-glass or consolidative opacities seen on chest radiographs and CT scans (Fig 7). Cardiac MRI may also have some useful applications, as myocarditis and cardiomyopathy have been described in COVID-19 patients (31). With only two reported cardiac MRI cases in the literature to date, the cardiac MRI findings of COVID-19 would be expected to be consistent with myocarditis, showing regional or global wall motion abnormalities on cine steady-state free precession images, more diffuse rise in T1 relaxation values on T1 mapping images, late gadolinium enhancement in a midmyocardial or transmural pattern, and, if acute, signal hyperintensity representing edema on electrocardiography-gated black blood T2-weighted sequence images (31,32).
Figure 7:
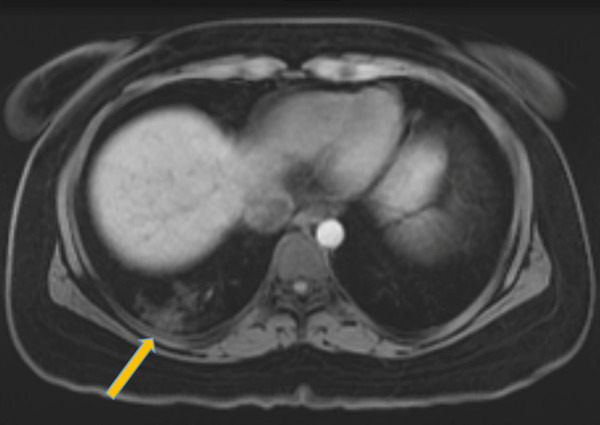
Image in 26-year-old woman with a recent history of sleeve gastrectomy complicated by splenic vein thrombosis who presented to the emergency department with left lower quadrant abdominal pain. T1-weighted axial MRI with intravenous contrast material of the abdomen and pelvis incidentally noted peripheral signal intensity abnormalities in the right lung base (arrow). The patient subsequently tested positive for coronavirus disease 2019 with polymerase chain reaction testing.
Extrapulmonary MRI features of COVID-19 in the brain are discussed below.
PET/CT
Although fluorine 18 fluorodeoxyglucose (18F-FDG) PET/CT is not used in emergency settings, it can identify inflammatory processes in the lungs, monitor disease progression, and evaluate disease following treatment. During viral infection, the host response triggers a rapid surge of inflammatory mediators, including neutrophils, monocytes, and chemokines. In the setting of acute infection, neutrophils depend on anaerobic glycolysis to maintain cellular activity. This increase in glucose requirement is reflected by a concomitant increase in FDG uptake at PET/CT (33).
Few reports exist of FDG PET/CT findings in COVID-19 (6–8). However, commonalities among these reports illustrate general themes. The characteristic ground-glass and mixed-attenuation CT findings discussed above correspond to sites of FDG avidity (Fig 8). Reported maximum standardized uptake values have ranged from 4.6 to 12.2 (6–8). Furthermore, even in the absence of anatomically enlarged thoracic lymph nodes, radiotracer uptake is common in lymph nodes, particularly in the hilar, supraclavicular, and mediastinal regions (7).
Figure 8:

Images in 33-year-old man with history of human immunodeficiency virus and treated Hodgkin lymphoma undergoing PET/CT for oncologic restaging. B, Fused PET/CT imaging shows bilateral peripheral-predominant intense sites of fluorodeoxyglucose avidity that correspond to ground-glass and mixed attenuation opacities on A, CT scans. A maximum standardized uptake value of 9.98 was seen. The patient was asymptomatic at time of imaging but presented to the emergency department 10 days later after developing hypoxia with 85% oxygen saturation on room air. The patient was confirmed to be positive for coronavirus disease 2019 with polymerase chain reaction testing.
Additional utility of FDG PET may be established in the future. Proposed applications include the monitoring of treatment response, prediction of recovery, and surveillance of long-term sequelae, as FDG uptake may be correlated with healing times (34). Furthermore, extrapulmonary manifestations of COVID-19 have been reported, which will be discussed below (10,35–37). PET/CT has potential as a whole-body noninvasive examination to assess chronic end-organ complications. What might be most relevant, however, is the potential increase in incidental findings of COVID-19. PET/CT is regularly indicated for oncologic staging, and reports exist of the incidental discovery of COVID-19 pneumonia on nuclear medicine examination (38). To this end, nuclear medicine services should anticipate these findings and prepare accordingly.
US
Chest US has been useful as a POC evaluation in emergency and intensive care settings (39). Reports have cited lung US as valuable for imaging of acute respiratory failure and have advised bedside US use in the emergency department setting for prompt diagnosis of COVID-19 pneumonia (5,40). Commonly reported findings include thickened pleural lines, B-lines (multifocal, discrete, or confluent), consolidative patterns with or without air bronchograms (Fig 9), and A-lines during the recovery phase (40). Some prospective studies have reported superior sensitivity of lung US in diagnosing pneumonia when compared with chest radiography (41). Many physicians in the emergency department or intensive care unit settings have advocated for the widespread adoption of POC US, touting its ease of use, repeatability, low cost, absence of radiation exposure, and triage optimization (42). In particular, its lack of ionizing radiation makes it appealing for children and pregnant patients. Published data regarding the risk of disease transmission to ultrasonography technologists is currently unavailable; however, this consideration should be noted when determining appropriate use of resources.
Figure 9:

A, Lung US in a 17-year-old boy being treated for coronavirus disease 2019, on bilevel positive airway pressure in the pediatric intensive care unit, shows consolidation in the left lung with multiple echogenic foci representing “air bronchograms” (arrow). B, Chest radiograph in the same patient reveals multiple patchy consolidative pulmonary opacities most predominantly within the left lower lobe.
Moreover, a notable role of US imaging has arisen in the context of COVID-19–induced coagulopathy. Increased clot burden and thrombosis risk have been well documented in infected patients (43). Furthermore, patients have demonstrated increased baseline levels of prothrombin time, d-dimer , and other inflammatory markers (44). With the interpretation of d-dimer tests being skewed in acutely hospitalized patients, the use of upper and lower extremity vascular US will undoubtedly rise in the diagnostic workup of patients suspected of having deep vein thrombosis.
Echocardiography
In institutions with a high prevalence of COVID-19 infection, deep vein thrombosis and peripheral thrombosis are common complications due to associated hypercoagulability, and clinicians have observed a concomitant surge in incidence of pulmonary embolism (PE) (45). As these cases continue to emerge, the use of echocardiography is expected to increase, as it has been widely validated and adopted for use in high-risk hemodynamically unstable patients (“massive” PEs) (46).
Its main role in this specific population is in confirmation and prognostication for PE. Many studies have corroborated the ability of echocardiography to detect secondary right ventricular dysfunction, a highly sensitive and poor prognostic factor (47,48). Thus, echocardiography is a powerful tool in the stratification of patients with acute PE, similar to CT angiography as discussed earlier. It is not useful as a screening tool due to its low sensitivity and high rate of false-positive findings in diagnosis of PE (47). Furthermore, it lacks the ability to visualize the pulmonary vessels.
Highly specific echocardiographic signs of acute PE include right heart thrombus, McConnell sign (akinesis of the right ventricle free wall and hypercontractility of its apical wall), and paradoxical interventricular septal movement (49). With respect to right ventricle dilatation, current guidelines from the American Society of Echocardiography define thresholds as ventricular diameter of greater than 42 mm at the base and 35 mm at the midcavitary level (50).
Similar to chest US, POC echocardiography might have particular utility in intensive care unit settings. The sensitivity of right ventricle dilatation in the detection of PE using POC echocardiography has been reported as high as 90% (51).
Echocardiography is also indicated for evaluation of COVID-19–related acute cardiac injury, as it can identify cardiomyopathy and cardiogenic shock as a cause of decompensation. Furthermore, abnormalities at echocardiography are associated with more severe disease and worse prognosis (52).
AI
The benefits of AI during this pandemic primarily relate to its potential for high-throughput analysis and pattern recognition of imaging findings. In institutions with high disease prevalence and limited resources, the number of imaging studies requiring evaluation accumulates rapidly. Parallel AI processing of images can facilitate triage of patients. Furthermore, the rapid progression of disease necessitates frequent CT scanning during hospitalization to monitor therapeutic response. Although qualitative evaluation is valuable, subtle changes across serial CT scans might be overlooked. Computerization can aid in quantification of these changes and subsequent trend analysis to track disease progression in an individual or population.
The centerpiece of clinical AI lies in the plasticity of deep learning networks, which allows these systems to adapt to various manifestations of pathology. Early AI investigators have begun to lay the groundwork for more detailed exploration of deep learning algorithms to rapidly screen for, identify, and quantify disease in the setting of an acute pandemic (53–57).
Early studies have reported proof of concept establishing the feasibility of developing such algorithms using lung segmentation and quantitative opacity measurements (53,58). Published sensitivities and specificities have been high, with values for each reportedly in the high 90th percentile (56,57). Further efforts have been devoted toward differentiating COVID-19 from other causes of pneumonia, with similarly promising diagnostic results (54,55).
The limitations of deep learning in radiology are inherent to its image-based framework. To develop an adequately discerning program, teaching algorithms requires thousands of studies. Furthermore, these studies must possess adequate quality. When segmentation quality is insufficient, appropriate quantification is impossible (58). Finally, in all radiologic deep learning methods, it is not possible to determine which imaging features are being used to determine output. Many use heatmaps to ameliorate this issue by highlighting vital regions, but these alone are still insufficient in determining the ultimate key diagnostic features (55).
Thromboembolic Manifestations of COVID-19
The association between COVID-19 and coagulopathy has been described in literature showing that elevations in coagulation markers such as partial thromboplastin time and d-dimer level were increased in COVID-19 patients and also associated with increased mortality (59–61). A presumed consequence of this coagulopathy was described by two centers in France that showed an association between COVID-19 and venous thromboembolism (62,63).
The hypercoagulability seen in COVID-19 may result in deep vein thrombosis, manifesting as filling defects at Doppler US or venous phase CT. (Fig 10). In the unfortunate situation that these clots dislodge and migrate to the heart, a pulmonary embolism can form, creating filling defects detectable at CT angiography (Fig 10).
Figure 10:

Venous thromboembolic disease in coronavirus disease 2019 (COVID-19). A, Doppler US image of the left lower extremity in a 57-year-old man with COVID-19 demonstrates nonocclusive thrombus in the popliteal vein (arrow). B, Pelvic CT scan in a 33-year-old man demonstrates nonocclusive thrombus in the right common femoral vein (arrow). C, CT chest angiogram in a 69-year-old man demonstrates saddle pulmonary embolus (arrow).
Cases of noncerebral arterial thromboembolic disease have also been reported and may involve the celiac trunk or renal arteries, leading to downstream hypoperfusion changes (Fig 11).
Figure 11:

Arterial thrombosis in coronavirus disease 2019 (COVID-19). A, Sagittal CT angiogram of the abdomen in a 66-year-old woman with COVID-19 demonstrates thrombus in the celiac artery (arrow). B, Axial CT angiogram in the same patient demonstrates thrombus in both renal arteries (arrows) with associated hypoperfusion changes in both kidneys.
Cerebral infarction has also been described in association with COVID-19, with a recent series reporting large vessel occlusions in young patients, raising the suspicion for a thromboembolic etiology (64,65). These infarcts may be evident on non–contrast-enhanced CT as hypoattenuated large vessel territories or at CT angiography as focal arterial occlusions (Fig 12).
Figure 12:

Cerebral arterial thrombosis in coronavirus disease 2019 (COVID-19). A, Non–contrast-enhanced head CT scan in a 57-year-old man with COVID-19 demonstrates hypoattenuation throughout the left middle cerebral artery territory. B, CT angiogram in the same patient demonstrates focal occlusion of the left M2 branch (arrow) without distal reconstitution.
Additional Extrapulmonary Manifestations
A number of extrapulmonary manifestations of COVID-19 have been reported, including in organ systems such as the gastrointestinal tract, brain, heart, and kidneys (10,35–37).
A subgroup of patients with severe COVID-19 may develop acute necrotizing encephalopathy, a rare complication that has been previously described as a complication of influenza and other viral infections. The pathogenesis is thought to be related to an intracranial cytokine storm, which can result in blood-brain barrier breakdown, despite the lack of inflammatory cells seen in the brain parenchyma, such as the case with other types of encephalomyelitis (66). Reported lesions of COVID-19–associated acute necrotizing encephalopathy demonstrate hypoattenuation at head CT localized to the bilateral medial thalami. MRI features include T2 and fluid-attenuated inversion-recovery signal hyperintensity and internal hemorrhage indicated by hypointense signal on susceptibility-weighted imaging, often with rim enhancement on T1-weighted postcontrast imaging. Similar to CT, reported MRI findings have been located in the thalami, but also other midline structures, such as the medial temporal lobe and the subinsular region (67).
Further study will be needed to assess the role of abdominal imaging for possible associated secondary findings of enterocolitis and hepatitis (10). Reported CT findings of COVID-19–associated enterocolitis include bowel wall thickening with associated pericolic fat stranding, mural hyperenhancement, and mesenteric hypervascularity (Figure E1 [supplement]). Distribution can be rather variable, ranging from single segment to pancolonic involvement. (68,69). What is more specific, however, is the pattern of ground-glass high-attenuation area that can be seen around the intestinal wall, which is not characteristic of bacterial enterocolitis (70).
Conclusion
This multimodality imaging review provides information on the spectrum of COVID-19 thoracic imaging findings at chest radiography, CT, MRI, PET/CT, US, and echocardiography (Table). The features described dovetail with findings of other early investigators. Our chest radiography and CT observations add to the growing body of evidence that multilobar, predominantly peripheral and basilar ground-glass and mixed-attenuation opacities are the most common thoracic imaging findings. Given its poor sensitivity for detection of mild pulmonary changes, chest radiography can be insensitive for detection of early or mild disease but is useful in triaging patients and monitoring care in those with radiographically detectable pneumonia. CT changes are now understood to demonstrate a pattern of temporal evolution typical of organizing pneumonia as a response to acute lung injury. Chest US, particularly in POC evaluation, has been helpful, and the appearance correlates well with CT findings. The MRI and PET/CT findings have yet to be comprehensively described, but our sample MRI and PET/CT images demonstrate that they correspond closely to characteristic CT imaging appearances. Extrathoracic and thromboembolic complications manifest across multiple modalities. The long-term sequelae of COVID-19 infection are not yet well established.
Pulmonary Features of Various Imaging Modalities and Selected Studies

SUPPLEMENTAL FIGURES
Acknowledgments
Acknowledgments
The authors would like to thank Jose Concepcion, MD, and Sean Yogesh Gupta, MD, for their guidance and dedication to scientific discovery regarding the COVID-19 pandemic. Most importantly, we express our gratitude to frontline providers and essential workers for their selfless efforts during these unprecedented times.
S.M. and J.W. contributed equally to this work.
Disclosures of Conflicts of Interest: S.M. disclosed no relevant relationships. J.W. Activities related to the present article: disclosed no relevant relationships. Activities not related to the present article: author is member of National Cancer Institute’s Physician Data Query board for cancer screening and prevention, unrelated to the topic of this article; participation is not reimbursed but travel to meetings is reimbursed. Other relationships: disclosed no relevant relationships. S.Z.M. disclosed no relevant relationships. D.T. disclosed no relevant relationships. N.V. disclosed no relevant relationships. M.F. disclosed no relevant relationships. M.A.C. disclosed no relevant relationships. J.D. disclosed no relevant relationships. C.E. disclosed no relevant relationships. A.J. disclosed no relevant relationships. M.C. disclosed no relevant relationships. A.B. disclosed no relevant relationships.
Abbreviations:
- FDG
- fluorodeoxyglucose
- AI
- artificial intelligence
- COVID-19
- coronavirus disease 2019
- GGO
- ground-glass opacity
- PE
- pulmonary embolism
- POC
- point of care
- RT-PCR
- reverse-transcription polymerase chain reaction
References
- 1.Huang C, Wang Y, Li X, et al. Clinical features of patients infected with 2019 novel coronavirus in Wuhan, China. Lancet 2020;395(10223):497–506 [Published correction appears in Lancet 2020;395(10223):496.]. [DOI] [PMC free article] [PubMed] [Google Scholar]
- 2.Coronavirus COVID-19 Global Cases by the Center for Systems Science and Engineering (CSSE) at Johns Hopkins University. (JHU). The Johns Hopkins University School of Medicine. https://coronavirus.jhu.edu/map.html. Published 2020. Accessed March 2020. [Google Scholar]
- 3.Ai T, Yang Z, Hou H, et al. Correlation of Chest CT and RT-PCR Testing in Coronavirus Disease 2019 (COVID-19) in China: A Report of 1014 Cases. Radiology 2020. 10.1148/radiol.2020200642. Published online February 26, 2020. [DOI] [PMC free article] [PubMed] [Google Scholar]
- 4.Rubin GD, Ryerson CJ, Haramati LB, et al. The Role of Chest Imaging in Patient Management during the COVID-19 Pandemic: A Multinational Consensus Statement from the Fleischner Society. Radiology 2020. 10.1148/radiol.2020201365. Published online April 7, 2020. [DOI] [PMC free article] [PubMed] [Google Scholar]
- 5.Buonsenso D, Piano A, Raffaelli F, Bonadia N, de Gaetano Donati K, Franceschi F. Point-of-Care Lung Ultrasound findings in novel coronavirus disease-19 pnemoniae: a case report and potential applications during COVID-19 outbreak. Eur Rev Med Pharmacol Sci 2020;24(5):2776–2780. [DOI] [PubMed] [Google Scholar]
- 6.Polverari G, Arena V, Ceci F, et al. 18F-Fluorodeoxyglucose Uptake in Patient With Asymptomatic Severe Acute Respiratory Syndrome Coronavirus 2 (Coronavirus Disease 2019) Referred to Positron Emission Tomography/Computed Tomography for NSCLC Restaging. J Thorac Oncol 2020;15(6):1078–1080. [DOI] [PMC free article] [PubMed] [Google Scholar]
- 7.Qin C, Liu F, Yen TC, Lan X. 18F-FDG PET/CT findings of COVID-19: a series of four highly suspected cases. Eur J Nucl Med Mol Imaging 2020;47(5):1281–1286. [DOI] [PMC free article] [PubMed] [Google Scholar]
- 8.Zou S, Zhu X. FDG PET/CT of COVID-19. Radiology 2020. 10.1148/radiol.2020200770. Published online March 6, 2020. [Google Scholar]
- 9.Li LQ, Huang T, Wang YQ, et al. COVID-19 patients’ clinical characteristics, discharge rate, and fatality rate of meta-analysis. J Med Virol 2020. 10.1002/jmv.25757. Published online March 12, 2020. [DOI] [PMC free article] [PubMed] [Google Scholar]
- 10.Gao QY, Chen YX, Fang JY. 2019 Novel coronavirus infection and gastrointestinal tract. J Dig Dis 2020;21(3):125–126. [DOI] [PMC free article] [PubMed] [Google Scholar]
- 11.Vaira LA, Salzano G, Deiana G, De Riu G. Anosmia and ageusia: common findings in COVID-19 patients. Laryngoscope 2020. 10.1002/lary.28692. Published online April 1, 2020. [DOI] [PMC free article] [PubMed] [Google Scholar]
- 12.World Health Organization . Clinical management of severe acute respiratory infection (SARI) when COVID-19 disease is suspected: interim guidance. https://apps.who.int/iris/bitstream/handle/10665/331446/WHO-2019-nCoV-clinical-2020.4-chi.pdf. Published March 13, 2020. Accessed March 2020. [Google Scholar]
- 13.Deng Y, Liu W, Liu K, et al. Clinical characteristics of fatal and recovered cases of coronavirus disease 2019 (COVID-19) in Wuhan, China: a retrospective study. Chin Med J (Engl) 2020. 10.1097/CM9.0000000000000824. Published online March 20, 2020. [DOI] [PMC free article] [PubMed] [Google Scholar]
- 14.Cavallo JJ, Forman HP. The Economic Impact of the COVID-19 Pandemic on Radiology Practices. Radiology 2020. 10.1148/radiol.2020201495. Published online April 15, 2020. [DOI] [PMC free article] [PubMed] [Google Scholar]
- 15.Zu ZY, Jiang MD, Xu PP, et al. Coronavirus Disease 2019 (COVID-19): A Perspective from China. Radiology 2020. 10.1148/radiol.2020200490. Published online February 21, 2020. [DOI] [PMC free article] [PubMed] [Google Scholar]
- 16.Wong HYF, Lam HYS, Fong AH, et al. Frequency and Distribution of Chest Radiographic Findings in COVID-19 Positive Patients. Radiology 2019. 10.1148/radiol.2020201160. Published online March 27, 2019. [DOI] [PMC free article] [PubMed] [Google Scholar]
- 17.Shi H, Han X, Jiang N, et al. Radiological findings from 81 patients with COVID-19 pneumonia in Wuhan, China: a descriptive study. Lancet Infect Dis 2020;20(4):425–434. [DOI] [PMC free article] [PubMed] [Google Scholar]
- 18.Chung M, Bernheim A, Mei X, et al. CT Imaging Features of 2019 Novel Coronavirus (2019-nCoV). Radiology 2020;295(1):202–207. [DOI] [PMC free article] [PubMed] [Google Scholar]
- 19.Wang Y, Dong C, Hu Y, et al. Temporal Changes of CT Findings in 90 Patients with COVID-19 Pneumonia: A Longitudinal Study. Radiology 2020. 10.1148/radiol.2020200843. Published online March 19, 2020. [DOI] [PMC free article] [PubMed] [Google Scholar]
- 20.Kanne JP, Little BP, Chung JH, Elicker BM, Ketai LH. Essentials for Radiologists on COVID-19: An Update-Radiology Scientific Expert Panel. Radiology 2020. 10.1148/radiol.2020200527. Published online February 27, 2020. [DOI] [PMC free article] [PubMed] [Google Scholar]
- 21.Bernheim A, Mei X, Huang M, et al. Chest CT Findings in Coronavirus Disease-19 (COVID-19): Relationship to Duration of Infection. Radiology 2020;295(3):200463. [DOI] [PMC free article] [PubMed] [Google Scholar]
- 22.Caruso D, Zerunian M, Polici M, et al. Chest CT Features of COVID-19 in Rome, Italy. Radiology 2020. 10.1148/radiol.2020201237. Published online April 3, 2020. [DOI] [PMC free article] [PubMed] [Google Scholar]
- 23.Walker CM, Mohammed TL, Chung JH. “Reversed halo sign”. J Thorac Imaging 2011;26(3):W80. [DOI] [PubMed] [Google Scholar]
- 24.Ng MY, Lee EYP, Yang J, et al. Imaging Profile of the COVID-19 Infection: Radiologic Findings and Literature Review. Radiol Cardiothorac Imaging 2020;2(1):e200034. [DOI] [PMC free article] [PubMed] [Google Scholar]
- 25.Kligerman SJ, Franks TJ, Galvin JR. From the radiologic pathology archives: organization and fibrosis as a response to lung injury in diffuse alveolar damage, organizing pneumonia, and acute fibrinous and organizing pneumonia. RadioGraphics 2013;33(7):1951–1975. [DOI] [PubMed] [Google Scholar]
- 26.Koo HJ, Lim S, Choe J, Choi SH, Sung H, Do KH. Radiographic and CT Features of Viral Pneumonia. RadioGraphics 2018;38(3):719–739. [DOI] [PubMed] [Google Scholar]
- 27.Kim H, Hong H, Yoon SH. Diagnostic Performance of CT and Reverse Transcriptase-Polymerase Chain Reaction for Coronavirus Disease 2019: A Meta-Analysis. Radiology 2020. 10.1148/radiol.2020201343. Published online April 17, 2020. [DOI] [PMC free article] [PubMed] [Google Scholar]
- 28.Albrecht MH, Bickford MW, Nance JW Jr, et al. State-of-the-Art Pulmonary CT Angiography for Acute Pulmonary Embolism. AJR Am J Roentgenol 2017;208(3):495–504. [DOI] [PubMed] [Google Scholar]
- 29.Vedovati MC, Becattini C, Agnelli G, et al. Multidetector CT scan for acute pulmonary embolism: embolic burden and clinical outcome. Chest 2012;142(6):1417–1424. [DOI] [PubMed] [Google Scholar]
- 30.Hariharan P, Dudzinski DM, Rosovsky R, et al. Relation Among Clot Burden, Right-Sided Heart Strain, and Adverse Events After Acute Pulmonary Embolism. Am J Cardiol 2016;118(10):1568–1573 [Published correction appears in Am J Cardiol 2017;120(3):515.]. [DOI] [PubMed] [Google Scholar]
- 31.Inciardi RM, Lupi L, Zaccone G, et al. Cardiac Involvement in a Patient With Coronavirus Disease 2019 (COVID-19). JAMA Cardiol 2020. 10.1001/jamacardio.2020.1096. Published online March 27, 2020. [DOI] [PMC free article] [PubMed] [Google Scholar]
- 32.Kim IC, Kim JY, Kim HA, Han S. COVID-19-related myocarditis in a 21-year-old female patient. Eur Heart J 2020;41(19):1859. [DOI] [PMC free article] [PubMed] [Google Scholar]
- 33.Jones HA, Marino PS, Shakur BH, Morrell NW. In vivo assessment of lung inflammatory cell activity in patients with COPD and asthma. Eur Respir J 2003;21(4):567–573. [DOI] [PubMed] [Google Scholar]
- 34.Lütje S, Marinova M, Kütting D, Attenberger U, Essler M, Bundschuh RA. Nuclear medicine in SARS-CoV-2 pandemia: 18F-FDG-PET/CT to visualize COVID-19. Nuklearmedizin 2020. 10.1055/a-1152-2341. Published online April 7, 2020. [DOI] [PubMed] [Google Scholar]
- 35.Are Kidneys Targeted by the Novel Coronavirus? Cath Lab Digest. https://www.cathlabdigest.com/content/are-kidneys-targeted-novel-coronavirus. Accessed March 2020.
- 36.Clinical Characteristics of COVID-19 Patients With Digestive Symptoms in Hubei. China. PracticeUpdate. https://www.practiceupdate.com/content/clinical-characteristics-of-covid-19-patients-with-digestive-symptoms-in-hubei-china/98000. Accessed March 2020. [DOI] [PMC free article] [PubMed] [Google Scholar]
- 37.Song F, Shi N, Shan F, et al. Emerging 2019 Novel Coronavirus (2019-nCoV) Pneumonia. Radiology 2020;295(1):210–217. [DOI] [PMC free article] [PubMed] [Google Scholar]
- 38.Albano D, Bertagna F, Bertoli M, et al. Incidental Findings Suggestive of COVID-19 in Asymptomatic Patients Undergoing Nuclear Medicine Procedures in a High-Prevalence Region. J Nucl Med 2020;61(5):632–636. [DOI] [PubMed] [Google Scholar]
- 39.Copetti R. Is lung ultrasound the stethoscope of the new millennium? Definitely yes! Acta Med Acad 2016;45(1):80–81. [DOI] [PubMed] [Google Scholar]
- 40.Peng QY, Wang XT, Zhang LN; Chinese Critical Care Ultrasound Study Group (CCUSG). Findings of lung ultrasonography of novel corona virus pneumonia during the 2019-2020 epidemic. Intensive Care Med 2020;46(5):849–850. [DOI] [PMC free article] [PubMed] [Google Scholar]
- 41.Amatya Y, Rupp J, Russell FM, Saunders J, Bales B, House DR. Diagnostic use of lung ultrasound compared to chest radiograph for suspected pneumonia in a resource-limited setting. Int J Emerg Med 2018;11(1):8. [DOI] [PMC free article] [PubMed] [Google Scholar]
- 42.Mayo PH, Copetti R, Feller-Kopman D, et al. Thoracic ultrasonography: a narrative review. Intensive Care Med 2019;45(9):1200–1211. [DOI] [PubMed] [Google Scholar]
- 43.Thachil J, Tang N, Gando S, et al. ISTH interim guidance on recognition and management of coagulopathy in COVID-19. J Thromb Haemost 2020;18(5):1023–1026. [DOI] [PMC free article] [PubMed] [Google Scholar]
- 44.Yu B, Li X, Chen J, et al. Evaluation of variation in D-dimer levels among COVID-19 and bacterial pneumonia: a retrospective analysis. Research Square. 10.21203/rs.3.rs-20056/v1. Accessed March 2020. [DOI] [PMC free article] [PubMed] [Google Scholar]
- 45.Danzi GB, Loffi M, Galeazzi G, Gherbesi E. Acute pulmonary embolism and COVID-19 pneumonia: a random association? Eur Heart J 2020;41(19):1858. [DOI] [PMC free article] [PubMed] [Google Scholar]
- 46.Dabbouseh NM, Patel JJ, Bergl PA. Role of echocardiography in managing acute pulmonary embolism. Heart 2019;105(23):1785–1792. [DOI] [PubMed] [Google Scholar]
- 47.Miniati M, Monti S, Pratali L, et al. Value of transthoracic echocardiography in the diagnosis of pulmonary embolism: results of a prospective study in unselected patients. Am J Med 2001;110(7):528–535. [DOI] [PubMed] [Google Scholar]
- 48.Fields JM, Davis J, Girson L, et al. Transthoracic Echocardiography for Diagnosing Pulmonary Embolism: A Systematic Review and Meta-Analysis. J Am Soc Echocardiogr 2017;30(7):714–723.e4. [DOI] [PubMed] [Google Scholar]
- 49.Mansencal N, Vieillard-Baron A, Beauchet A, et al. Triage patients with suspected pulmonary embolism in the emergency department using a portable ultrasound device. Echocardiography 2008;25(5):451–456. [DOI] [PubMed] [Google Scholar]
- 50.Rudski LG, Lai WW, Afilalo J, et al. Guidelines for the echocardiographic assessment of the right heart in adults: a report from the American Society of Echocardiography endorsed by the European Association of Echocardiography, a registered branch of the European Society of Cardiology, and the Canadian Society of Echocardiography. J Am Soc Echocardiogr 2010;23(7):685–713; quiz 786–788. [DOI] [PubMed] [Google Scholar]
- 51.Taylor RA, Moore CL. Accuracy of emergency physician-performed limited echocardiography for right ventricular strain. Am J Emerg Med 2014;32(4):371–374. [DOI] [PubMed] [Google Scholar]
- 52.Driggin E, Madhavan MV, Bikdeli B, et al. Cardiovascular Considerations for Patients, Health Care Workers, and Health Systems During the COVID-19 Pandemic. J Am Coll Cardiol 2020;75(18):2352–2371. [DOI] [PMC free article] [PubMed] [Google Scholar]
- 53.Wang S, Kang B, Ma J, et al. A deep learning algorithm using CT images to screen for Corona Virus Disease (COVID-19). medRxiv: 2020.02.14.20023028 [preprint] 10.1101/2020.02.14.20023028. Posted April 24, 2020. Accessed March 2020. [DOI] [PMC free article] [PubMed] [Google Scholar]
- 54.Xu X, Jiang X, Ma C, et al. Deep Learning System to Screen Coronavirus Disease 2019 Pneumonia. arXiv: 2002.09334 [physics.med-ph] [preprint] https://arxiv.org/abs/2002.09334. Published February 21, 2020. Accessed March 2020. [Google Scholar]
- 55.Li L, Qin L, Xu Z, et al. Artificial Intelligence Distinguishes COVID-19 from Community Acquired Pneumonia on Chest CT. Radiology 2020. 10.1148/radiol.2020200905. Published online March 19, 2020. [Google Scholar]
- 56.Song Y, Zheng S, Li L, et al. Deep learning Enables Accurate Diagnosis of Novel Coronavirus (COVID-19) with CT images. medRxiv: 2020.02.23.20026930 [preprint]. Posted February 25, 2020. Accessed March 2020. [DOI] [PMC free article] [PubMed] [Google Scholar]
- 57.Zheng C, Deng X, Fu Q, et al. Deep Learning-based Detection for COVID-19 from Chest CT using Weak Label. medRxiv: https://doi.org/10.1101/2020.03.12.20027185 [preprint] https://doi.org/10.1101/2020.03.12.20027185. Posted March 26, 2020. Accessed March 2020. [Google Scholar]
- 58.Huang L, et al. Serial Quantitative Chest CT Assessment of COVID-19: Deep-Learning Approach. Radiol Cardiothorac Imaging 2020;2(2):e200075. [DOI] [PMC free article] [PubMed] [Google Scholar]
- 59.Chen N, Zhou M, Dong X, et al. Epidemiological and clinical characteristics of 99 cases of 2019 novel coronavirus pneumonia in Wuhan, China: a descriptive study. Lancet 2020;395(10223):507–513. [DOI] [PMC free article] [PubMed] [Google Scholar]
- 60.Wang D, Hu B, Hu C, et al. Clinical Characteristics of 138 Hospitalized Patients With 2019 Novel Coronavirus-Infected Pneumonia in Wuhan, China. JAMA 2020;323(11):1061–1069. [DOI] [PMC free article] [PubMed] [Google Scholar]
- 61.Zhou F, Yu T, Du R, et al. Clinical course and risk factors for mortality of adult inpatients with COVID-19 in Wuhan, China: a retrospective cohort study. Lancet 2020;395(10229):1054–1062 [Published correction appears in Lancet 2020;395(10229):1038.]. [DOI] [PMC free article] [PubMed] [Google Scholar]
- 62.Klok FA, Kruip MJHA, van der Meer NJM, et al. Incidence of thrombotic complications in critically ill ICU patients with COVID-19. Thromb Res 2020;191:145–147. [DOI] [PMC free article] [PubMed] [Google Scholar]
- 63.Poissy J, Goutay J, Caplan M, et al. Pulmonary Embolism in COVID-19 Patients: Awareness of an Increased Prevalence. Circulation 2020. 10.1161/CIRCULATIONAHA.120.047430. Published online April 24, 2020. [DOI] [PubMed] [Google Scholar]
- 64.Li Y, Wang M, Zhou Y, et al. Acute Cerebrovascular Disease Following COVID-19: A Single Center, Retrospective, Observational Study. SSRN Electronic Journal. https://svn.bmj.com/content/5/3/279. Published 2020. Accessed March 2020. [DOI] [PMC free article] [PubMed] [Google Scholar]
- 65.Oxley TJ, Mocco J, Majidi S, et al. Large-Vessel Stroke as a Presenting Feature of Covid-19 in the Young. N Engl J Med 2020;382(20):e60. [DOI] [PMC free article] [PubMed] [Google Scholar]
- 66.Rossi A. Imaging of acute disseminated encephalomyelitis. Neuroimaging Clin N Am 2008;18(1):149–161, ix. [DOI] [PubMed] [Google Scholar]
- 67.Poyiadji N, Shahin G, Noujaim D, Stone M, Patel S, Griffith B. COVID-19-associated Acute Hemorrhagic Necrotizing Encephalopathy: CT and MRI Features. Radiology 2020. 10.1148/radiol.2020201187. Published online March 31, 2020. [DOI] [PMC free article] [PubMed] [Google Scholar]
- 68.Thoeni RF, Cello JP. CT imaging of colitis. Radiology 2006;240(3):623–638. [DOI] [PubMed] [Google Scholar]
- 69.Carvalho A, Alqusairi R, Adams A, et al. SARS-CoV-2 Gastrointestinal Infection Causing Hemorrhagic Colitis: Implications for Detection and Transmission of COVID-19 Disease. Am J Gastroenterol 2020. 10.14309/ajg.0000000000000667. Published online April 17, 2020. [DOI] [PMC free article] [PubMed] [Google Scholar]
- 70.Takifuji K, Terasawa H, Oka M, Sahara M, Hara T, Itoh H. Computerized tomography scan findings of a patient with severe enterocolitis associated with the coronavirus disease 2019: a case report. Research Square. 10.21203/rs.3.rs-21006/v1. Accessed March 2020. [DOI] [Google Scholar]
Associated Data
This section collects any data citations, data availability statements, or supplementary materials included in this article.