

Abstract
Background:
Obesity is an independent risk factor for many diseases. Many studies have investigated the benefits of losing weight as well as the best methods for weight loss. This research evaluated the impact of various weight loss programs on health enhancement among overweight women aged 40–60 years.
Methods:
This was a retrospective observational study that analyzed data from 145 overweight women in weight loss programs. Each woman joined one of four programs: 8 weeks of exercise plus diet (exe + nutr), 8 weeks of diet only (nutrition), 8 weeks of exercise only, or a control group. Women completed a psychological questionnaire and also underwent anthropometric tests, blood pressure checks, a predicted maximal oxygen consumption (VO2 max) test on an ergometer bicycle, a one-leg balance test, straight leg test, and a sit and reach test, both before and after the program. Participants also provided a blood sample.
Results:
All of the measured variables improved in the exe + nutr and nutrition programs when compared with the control group; the exe + nutr group improved the most: body mass index, −1.3 kg/m2; body fat, −2.9%; lean body mass, +1.1; VO2 max, +4.8; body image, +1.02; and p < 0.01.
Conclusion:
The hypothesis-generating findings showed that weight loss programs improved anthropometric, biochemical, physiological, physical, and psychological variables in women aged 40–60 years. The program that included diet restriction with exercise, guidance, and regular counseling showed the best results.
Keywords: balance, blood pressure, body image, body mass index, hamstring flexibility, lean body mass, self-efficacy, self-image, VO2 max, weight loss, weight loss program, well-being
Introduction
Obesity is one of the greatest threats to the future of human health, as it can lead to a reduction in life span and chronic diseases such as heart failure, diabetes, cancer, arthritis, and metabolic syndrome.1,2 Despite being a major global concern, the extent of obesity has nonetheless more than doubled since the 1980s. In 2016, over 1.9 billion adults around the world were considered as overweight. Among adults (over the age of 18 years), 39% are defined as overweight and 13% as obese. Of the total world population, 65% live in countries where more people die from complications related to being overweight compared to being underweight.1 Obesity also increases the risk of cardiovascular disease and elevates triglycerides, cholesterol, and glucose levels.3 It leads to a bigger waist circumference (WC), hip circumference (HC), and waist–hip ratio (WHR).4,5 A rise in one unit of body mass index (BMI) increases the risk of high blood pressure by 8%. The risk of high blood pressure due to obesity is five times higher than among people with a healthy weight.2,6
In addition, it has been shown that overweight people have a lower maximum oxygen capacity than people at a healthy weight7 and are more likely to suffer from pulmonary problems, as being overweight can reduce the strength and endurance of the pulmonary muscles. Pulmonary discomfort may lead to a decrease in physical activity, which can cause even lower oxygen capacity, resulting in a reduction in the ability to manage regular daily living with less fatigue and effort.7 A decrease in physical abilities is a serious negative implication of obesity; obese people can have difficulties performing simple daily activities such as going shopping, tying shoelaces, or even getting up from a seated position. Increased fat mass also reduces flexibility and range of motion, especially in the shoulders, hips, knees, and vertebrate column.8,9 Błaszczyk et al.10 showed that overweight people are less stable and tend to fall more than people with a healthy weight due to the changes in the central mass of their body. Obesity leads to pain, discomfort, and low life quality, along with psychological problems such as a low sense of well-being, low body image and self-image, low self-esteem, stress, and depression.11–16 Middle-aged women are at a higher risk of gaining weight compared to younger women, and therefore, have to deal not only with body changes due to menopause but also the consequences of gaining weight.17,18
Maintaining a healthy weight improves lipoprotein and lipid blood profiles reduces the level of cholesterol and sugar in the blood and lowers the risk of cardiovascular disease and diabetes.19,20 Studies have shown that weight reduction improves balance and reduces the number of falls, as well as improves flexibility.8,9,21,22 Reaching the goal of a normal weight improves not only physiological body variables but also psychological status and quality of life.23 Thus, losing weight and learning how to lose weight have become major issues in the modern world. While there is much research concerning the different ways to lose weight, the technique as to the best way to lose weight is not unified: some studies recommend just dietary restrictions, some emphasize exercise, and others recommend both dieting and exercising.24–26 All the studies have generally agreed that, while in the short term, it is possible to lose weight in a dietary restriction program, intervention programs that include both diet and exercise are more beneficial for the long term.24–26 Different studies have shown that integrating physical activity with a diet program improves physiological performance, stability, and maximum oxygen uptake; lowers blood pressure; and has a positive effect on emotional states.26–30 Nonetheless, each study presents just one or two variables, and not all the changes can be necessarily attributed to different ways of losing weight. Therefore, it is not entirely clear as to the best type of intervention program for losing weight. This study aims to fill this gap by exploring which kind of intervention program can best help middle-aged overweight women lose weight, while improving anthropometric, biochemical, physiological, physical, and psychological variables.
Materials and methods
Study setting and description of the program
Data and results from women who participated in a variety of weight loss programs at a sports center called “The Fitness Way for Life,” located in a large city in the center of Israel, were analyzed. The women were offered to participate in an 8-week program for a reduced fee at the fitness center. The women were randomly assigned to each program. Since the spots filled up very quickly, those who enrolled last and had no place were promised that they could participate in the next session occurring within 8 weeks. The women who agreed to wait 8 weeks went through the registration process, including taking the pre-tests again before starting the program. These women were considered as the control group.
The different programs consisted of both exercise and diet instruction (exe + nutr), only diet restriction instruction (nutrition), or only exercise instruction. The length of each program was 8 weeks. At both the beginning and end of the program, the participants were required to undergo a large number of tests and assessments and answer questionnaires. (This was done to emphasize to the participants the significant change they went through.) After completing their specific program, 199 women agreed to share all their data (before and after the program) for research purposes. The control group consisted of a group of women who had not yet started a program and were to participate in the next program session. Once agreeing to share their data, all women signed a written consent form.
Research design and data collection
There were 199 overweight women aged 40–60 years who participated in the weight loss program. The women responded to a newspaper advertisement about a weight loss program and were assigned randomly to the different groups (exe + nutr, nutrition, or exercise) by the fitness center. (Each time a participant was added to a different group until the groups were filled.) After 2 months, when the programs ended and after receiving all the data, participants with active infections, cancer, grade 3 obesity, or major orthopedic problems were excluded from the analysis. Of the 145 women who matched the characteristics of the study and completed the baseline evaluation, only 96 were found to complete the post-tests and were analyzed. Figure 1 shows the flow diagram of the study population. Six months after the program ended, women who were analyzed in this study were contacted by telephone and were asked several follow-up questions, including: Have you continued to diet/exercise since the program ended? Have you gained or lost weight? How many kilograms have you gained or lost? Do you exercise independently or in an organized manner? How many days a week do you exercise?
Figure 1.
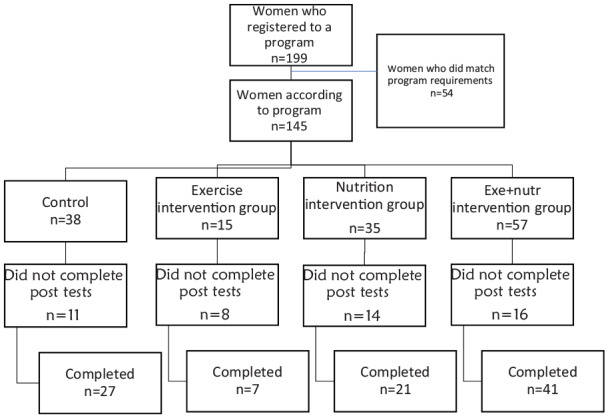
Flow diagram of the study population.
All the women lived in or near the center of Israel (Tel Aviv and surroundings). The average age was 53.8 (standard deviation (SD) 6.65) years. All the women started the program with a BMI of over 24 kg/m2. Approximately 81% were born in Israel, 66% were married, 18% were divorced, 8% were single, 2% were widowed, and 6% lived with a spouse but were not married. Approximately, 13% reported to having a high school education, 15% had a vocational high school education, and 72% had a college education. The average number of years of school education was 15.8 (SD = 3.25). The average number of children was 2.6 (SD = 1.21), with a range of 0–7 children.
Measures and survey instruments
Five major variables were tested: anthropometric, biochemical, physiological, physical ability, and psychological parameters. Each variable was measured at the beginning and end of the study.
Anthropometric variables (BMI, body fat percentage, WC, HC, and lean body mass)
Height, body mass, and body fat percentage were measured prior to and at the end of each program. Height was measured in centimeters using a wall-mounted altimeter to the nearest 0.1 cm, while weight was measured using an Omron Karada Scan (model HBF-356) to the nearest 0.1 kilogram (kg). When being measured, participants were allowed to wear only light clothing and no shoes. BMI was calculated by dividing weight (kg) by height (square meter (m²)) and classified according to the World Health Organization criteria: normal weight (18.5–24.9 kg/m2), overweight (25.0–29.9 kg/m2), and obese (>30 kg/m2).31
Body fat percentage was measured according to the bio-impedance analysis technique using an Omron Karada Scan (model HBF-356). WC and HC were measured using a measuring tape to the nearest 0.1 cm. WHR was calculated according to the ratio between WC and HC. Fat mass was calculated by multiplying body weight by body fat percentage, and lean body mass (LBM) was calculated by subtracting the fat mass from total body weight.
Biochemical variables (triglycerides, cholesterol, low-density lipoprotein, high-density lipoprotein, and fasting glucose)
Triglycerides, cholesterol, low-density lipoprotein (LDL), high-density lipoprotein (HDL), and fasting glucose measures (mg %) were obtained from the participant’s health maintenance organization records. Before the start of the program, each participant was asked to provide blood test results taken within the previous 2 months. The women were asked to undergo another blood test within 1 month following the end of the program. The normal range of the blood values were in accordance with Kasper et al.32
Physiological variables (blood pressure and predicted maximal oxygen consumption (VO2 max))
Blood pressure was measured during rest in a seated position using a Tensoval comfort blood pressure device, manufactured by Hartman, USA. Blood pressure was measured three times, the final result being an average of the three measurements. Predicted VO2 max was measured using an ergometer bicycle (Monark Ergomedic 818). The protocol of the test was the Astrand and Ryhming test as described in Legge and Banister’s study (1986). The women cycled for 15 min; the workload started at 25 or 50 W and every 5 min, the workload was increased by 25 W. At the end of each 5-min stage, heart rate was measured (using a polar watch).
Physical ability variables (balance and flexibility)
Physical ability was tested using a one-leg balance test and two range of motion tests. The protocol for the one-leg balance test was taken from several studies and adjusted to fit each participant’s profile.33–35 The participants were asked to stand on one leg with their hands on their waist. The other leg was bent, with the knee pointed to the ground at 90°. Time in seconds was measured using a stopwatch. The test ended at one of three possible points: when the participant’s hand touched any object, when the participant’s raised leg touched the floor, or after reaching 3 min. The test was performed on each leg.
Flexibility of the hamstrings and range of motion of the hip area were measured using two range of motion tests: a sit and reach test and a straight leg raise (SLR). The sit and reach test was performed as mentioned in Heyward and Gibson (2014).36 The measuring box was purchased from Acuflex, USA. The participants were asked to sit in front of the box with straight legs and their feet touching the box. In a controlled manner, they were asked to bend forward as far as possible toward the ruler on the box and to stay in that position for 2 s. The test was performed three times (with gaps of 30 s in between). The average of the three tests was marked as the final score. The SLR test was performed using a goniometer purchased from Petterson, USA, as mentioned in Heyward and Gibson (2014).36 The participants were also asked to lie on their backs on the floor with their legs straight on the ground. In a controlled manner, the instructor raised one of the participant’s legs until they felt discomfort or a stretch in the back of the thigh. The range of motion was measured in degrees using the goniometer in both legs. Since the results from both tests were very similar, only the SLR test is presented in the results.
Psychological variables (subjective well-being, self-efficacy, body image, and self-image)
Several questionnaires, comprised of 50 questions, were distributed. Demographic data, including personal and family details (age, educational level, religion, and socioeconomic status) were obtained from each participant at baseline. The questionnaires also included diet and physical activity habits taken from the “Knowledge, Attitude and Practices” Israeli national surveys.37 Before and after the program, the participants filled in a subjective well-being (SWB) questionnaire, a general perceived self-efficacy questionnaire, and a body image and self-image questionnaire. The SWB questionnaire was originally developed by Veit and Ware38 and was validated by Florian and Drori.39 In this study, in the SWB questionnaires, there were 10 questions measured on a five-point scale, ranging from 1 (completely disagree) to 5 (completely agree); an alpha-Cronbach’s (α of 0.96 was found. The general perceived self-efficacy questionnaire comprised a 10-item self-report measure used to assess general self-efficacy and to measure one’s general sense of perceived self-efficacy.40 An α = 0.81 was found, which allowed the researchers to use this questionnaire.
In order to assess body image, a modified Gray’s questionnaire was used.41 Twelve questions were measured on a five-point Likert-type scale, ranging from 1 (completely disagree) to 5 (completely agree). Internal consistencies for body image (α = 0.83) subscales were excellent. For self-image, the Tennessee self-concept scale was used.42 In this study, 13 questions were measured on a five-point scale, ranging from 1 (completely disagree) to 5 (completely agree). Internal consistencies for self-image (α = 0.81) subscales were excellent.
Program procedure
The women arrived at the fitness center following a newspaper advertisement about a weight loss program. The women were divided into the different programs randomly (after registering for the program, the women were added to different groups until they were all filled). After completing all the pre-tests and assessments, the women who participated in the diet restriction only group (nutrition) participated in a session with a nutritionist, who provided a diet protocol as described elsewhere,25,26 but with adjustment and customization to each participant, according to weight, height, and age. The participants continued to diet for 8 weeks and could consult with the nutritionist whenever necessary. In general, carbohydrates were restricted except 60 g of “Fiber 1” cereal in the morning. Each meal consisted of one serving of low-fat protein (beef, chicken, fish, eggs, and dairy products) and vegetables. Green vegetables were unlimited, while other vegetables were limited (the participants were provided with a long list of permitted, limited, and prohibited foods). The total daily calorie allowance was estimated between 1000 and 1500 calories, according to height, weight, and daily activities, but never went below their basic metabolic rate. The diet restriction group did not receive any advice concerning physical activity and were told to continue with their regular physical activity habits, but not to add any new activity. The exercise and diet (exe + nutr) group went through the same process as the diet restriction group concerning the diet program and were also required to go to the gym facilities at least three times a week and participate in three different workout classes: an aerobics class (e.g. cycling or walking/running), strength training (in a class with an instructor or in the gym using workout equipment), and a stretching class. Each class lasted 60 min. The exercise protocol was based on other studies25,26 and adjusted by a special exercise physiologist. Once a week, the women in this group met with their personnel trainer, who would adjust the activity if necessary. They were also able to call and consult with their nutritionist if needed. The exercise group participated in the workout program just as the exercise and diet (exe + nutr) group did but did not receive any consulting regarding diet changes.
Data analyses
A descriptive analysis was conducted on each sample population. In addition, a paired t-test analysis was executed to analyze the difference before and after the weight loss program. A one-way analysis of variance (ANOVA) test was conducted to examine the differences between the different groups. The exercise group started with only 15 participants because of dropout rate during the first 2 weeks of the program, due to problems with the instructor. This group ended with a total of only seven women because of a low response to the post-tests, thus although their data are presented in the results, it is not discussed in ‘Discussion’ section and should be examined with great caution.
Results
Survey findings
In this study, five major research topics were investigated on the topic of weight loss programs and their impact on anthropometric, biochemical, physiological, physical, and psychological variables.
Anthropometric variables
Table 1 shows the results of the anthropometric variables measured, namely, body weight, BMI, body fat percentage, WC, HC, fat mass, LBM, and WHR. The women participating in the exe + nutr and nutrition programs showed a significant reduction in their body weight, losing an average of 3.5–3.9 kg; no change was exhibited in the exercise or control groups. The women in the exe + nutr and nutrition groups reduced their body weight, BMI, body fat percentage, WC, HC, and fat mass; WHR did not change in either group. The women in the nutrition group showed a reduction in LBM, while those in the exe + nutr group maintained their muscle mass and showed no change in LBM. In the exercise group, there was a significant reduction only in the WC. In addition, a one-way ANOVA analysis to measure the differences between the groups in the changes (from post-test to pre-test) that occurred following the program found that WC and HC were more significantly reduced in the exe + nutr group (5.7 and 5.8 cm, respectively) than in the nutrition group (2.2 and 2.7 cm, respectively).
Table 1.
Anthropometric changes following nutrition and exercise programs.
| Variable | Exe + nutr (n = 41) | Nutrition (n = 21) | Exercise (n = 7) | Control (n = 27) | ||||||||||||
|---|---|---|---|---|---|---|---|---|---|---|---|---|---|---|---|---|
| Before | After | T(p) | Percentage change | Before | After | T(p) | Percentage change | Before | After | T(p) | Percentage change | Before | After | T(p) | Percentage change | |
| Age (years) | 53.3 (6.8) | – | – | – | 55.6 (5.5) | – | – | – | 54.2 (6.3) | – | – | 53.2 (7.2) | – | – | – | |
| Body weight (kg) | 81.3 (11.4) | 77.8 (11.8) | 9.1* | −4.3 | 83.2 (11.5) | 79.2 (10.9) | 7.2* | −4.8 | 87.9 (17.7) | 87.2 (17) | 1.1 | −0.8 | 83.5 (14.5) | 83.4 (14.1) | 0.08 | −0.1 |
| BMI (kg/m 2 ) | 30.8 (4.1) | 29.5 (4.1) | 9.4* | −4.2 | 31.9 (4.5) | 30.3 (4.2) | 7.1* | −5.0 | 33.9 (6.7) | 33.6 (6.5) | 1.1 | −0.9 | 30.5 (4.8) | 30.4 (4.6) | 0.18 | −0.3 |
| Body fat (%) | 42.1 (6.1) | 39.2 (5.9) | 4.8* | −6.9 | 43.2 (4.0) | 41.6 (4.4) | 3.1* | −3.7 | 46.1 (5.4) | 45.4 (6.2) | 1.2 | −1.5 | 40.2 (5.8) | 40.2 (5.6) | 0.09 | 0 |
| WC a (cm) | 101.7 (9.5) | 96.1 (10.1) | 7.6* | −5.5 | 102.5 (9.8) | 100.3 (9.0) | 1.9 | −0.5 | 108.7 (14.8) | 106 (12.7) | 2.3* | −2.5 | 102.2 (12.6) | 101.5 (11.9) | 0.67 | −0.68 |
| HC (cm) | 114.1 (7.8) | 108.2 (8.5) | 10.9* | −5.2 | 116.4 (9.6) | 113.6 (12.2) | 2.1* | −2.4 | 116.7 (12.7) | 115.8 (12.2) | 0.5 | −0.8 | 111.4 (8.2) | 111.1 (7.5) | 0.53 | 0.26 |
| Fat mass (kg) | 34.5 (8.4) | 30.9 (8.4) | 6.8* | −10.4 | 36.2 (7.7) | 33.2 (7.6) | 5.4* | −8.3 | 41.3 (12.6) | 40.4 (12.7) | 1.2 | −2.2 | 33.9 (9.3) | 33.9 (9.3) | 0.1 | 0 |
| LBM (kg) | 46.8 (5.8) | 46.9 (5.2) | 0.2 | 0.2 | 46.9 (4.8) | 45.9 (4.5) | 2.7* | −2.3 | 46.7 (6) | 46.7 (5.2) | 0.13 | 0 | 49.5 (7.3) | 49.5 (7.0) | 0.03 | 0 |
| WHR | 0.89 (0.05) | 0.88 (0.05) | 0.8 | −1.1 | 0.88 (0.07) | 0.89 (0.05) | −0.2 | 1.1 | 0.93 (0.07) | 0.88 (0.05) | 3.8* | −5.3 | 0.92 (0.08) | 0.91 (0.07) | 0.48 | −1.1 |
exe + nutr: exercise + nutrition program; kg: kilograms; BMI: body mass index; kg/m2: kilograms/square meter; WC: waist circumference; cm: centimeters; HC: hip circumference; LBM: lean body mass; WHR: waist–hip ratio.
Variables were tested with t-test for dependent samples.
p < 0.05.
Biochemical variables
Five biochemical variables were measured: triglycerides, cholesterol, LDL, HDL, and fasting blood glucose (Table 2). In the exe + nutr and nutrition groups, there was a general reduction in all variables, while in the exercise and the control group, there were no significant changes. The results of the biochemical variables should be analyzed with caution, since only a small number of the participants provided their blood test results after the program ended. (The blood tests were carried out and provided by the participants’ own health maintenance organization, and the participants were responsible for providing their blood test results and not all of them did so.)
Table 2.
Biochemical changes following nutrition and exercise programs.
| Variable (mg %) | Exe + nutr (n = 41) | Nutrition (n = 21) | Exercise (n = 7) | Control (n = 27) | ||||||||||||
|---|---|---|---|---|---|---|---|---|---|---|---|---|---|---|---|---|
| Before | After | T(p) | Percentage change | Before | After | T(p) | Percentage change | Before | After | T(p) | Percentage change | Before | After | T(p) | Percentage change | |
| Triglycerides | 135. 5 (50.8) | 105.3 (43.9) | 2.9* | −20.3 | 119.3 (18.8) | 105.9 (26.8) | 1.2 | −11.2 | 126.7 (65.7) | 138 (89.7) | 0.59 | +8.9 | 133.7 (58.2) | 149.2 (76.3) | 1.2 | +11.6 |
| Cholesterol total | 202.1 (45.5) | 182.5 (36.8) | 3.3* | −9.7 | 212.2 (41.1) | 194.4 (45.3) | 3.1* | −8.4 | 213.7 (20.5) | 219.3 (53.4) | 0.32 | +2.6 | 202.9 (30.7) | 194.9 (33.8) | 1.1 | −3.9 |
| LDL cholesterol | 123.8 (42.7) | 114.9 (34.9) | 1.96 | −7.2 | 137.2 (40.4) | 123.1 (41.3) | 3.99* | −10.3 | 129 (23.5) | 125.7 (47.9) | 0.22 | +2.6 | 121.7 (26.8) | 115.6 (25.9) | 0.9 | −5 |
| HDL cholesterol | 57.8 (15.2) | 54.9 (11.1) | 1.1 | −5 | 49.7 (12.5) | 47.3 (8.8) | 0.65 | −4.8 | 61.1 (16) | 58.2 (11.3) | 0.83 | −4.7 | 53.9 (12.1) | 51.6 (11.2) | 1.5 | −4.3 |
| Fasting blood glucose | 97.2 (16.5) | 93.8 (9.3) | 1.6 | −3.5 | 94.4 (13.2) | 92.4 (9.1) | 0.4 | −2.1 | 89.7 (3.6) | 87.7 (14) | 0.32 | −2.2 | 103.7 (25.8) | 109.1 (31.5) | 2.3 | +5.2 |
exe + nutr: exercise + nutrition program; mg: milligram; LDL: low-density lipoprotein; HDL: high-density lipoprotein.
Variables were tested with t-test for dependent samples.
p < 0.05.
Physiological and physical variables
Four physiological variables were measured: blood pressure, predicted VO2 max, balance, and hip range of motion (Figure 2(a) and (b) and Figure 3(a) and (b)). These four variables were measured because it is known that when a person performs physical exercise on a regular basis, it has a significant impact on physiological parameters and physical capabilities. It is also known that losing weight, especially reducing fat mass with no physical activity, can also improve physiological and physical performance.19,21,23 A t-test analysis for dependent samples was performed for all variables. Blood pressure was reduced in both exe + nutr and nutrition groups, but not in the exercise and control groups. Predicted VO2 max, as well as leg balance, was improved only in exe + nutr and nutrition groups, while hip range was improved in both exe + nutr and exercise groups. The control group did not show changes in any of the physiological variables. Furthermore, in a one-way ANOVA analysis to measure the difference between the groups in the change (from post-test to pre-test) that happened following the program, a significant difference in blood pressure was found between the groups (exe + nutr and nutrition) and the control group (−5.06, −3.65, and +0.57, respectively, p = 0.002). In predicted VO2 max, a significant difference was found between the exe + nutr and nutrition groups compared to the control group (4.79, 3.19, and −0.61, respectively, p = 0.001). A significant difference in the change that occurred before and after the program between the groups was also found in the one-leg balance test (8.38, 14.78, and −5.39, respectively, p = 0.005).
Figure 2.

Average blood pressure and predicted VO2 max measurement before and after the program. (a) Average blood pressure before and after the program. Values shown are the means and the standard deviations are represented by vertical bars. The difference between the average blood pressure before and after the programs was measured using a t-test analysis for dependent samples. (b) Predicted VO2 max measurement before and after the program. Values shown are the means and the standard deviations are represented by vertical bars. The difference between predicted VO2 max before and after the programs was measured using a t-test analysis for dependent samples.
*p < 0.05, **p < 0.01.
Figure 3.
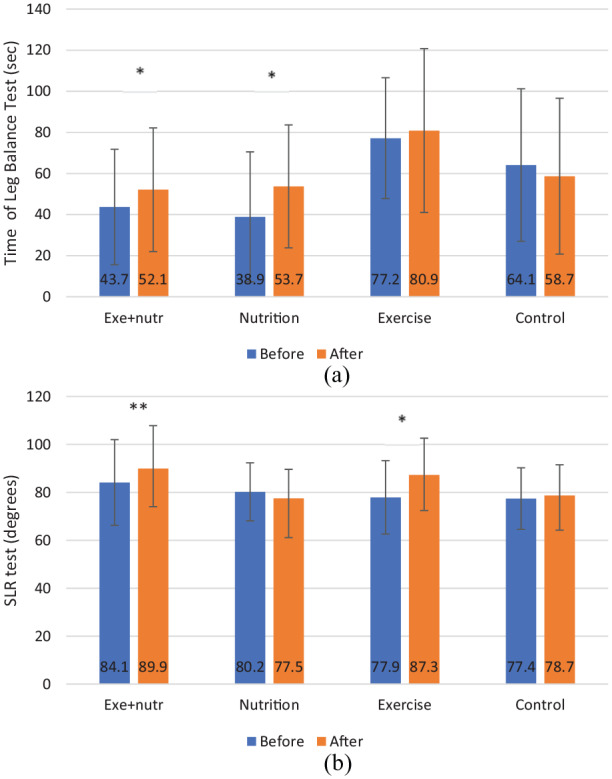
One-leg balance test and range of motion of the hip joint before and after the program. (a) One-leg balance test before and after the program. Values shown are the means and the standard deviations are represented by vertical bars. Balance was measured using the one-leg balance test before and after the different programs. The difference before and after was measured using a t-test analysis for dependent samples. (b). Range of motion of the hip joint before and after the program. Values shown are the means and the standard deviations are represented by vertical bars. The range of motion of the hip joint was measured using the straight leg raise (SLR) test before and after the different programs. The difference was measured using a t-test analysis for dependent samples.
*p < 0.05, **p < 0.01.
Psychological variables
This study also measured the psychological variables that play major roles in losing weight and maintaining a healthy lifestyle. Four psychological variables were measured: well-being, self-efficacy, body image, and self-image. In the exe + nutr group, all four psychological variables increased in medium to high levels (Table 3). In the nutrition group, only body image and self-image increased; in the exercise and control groups, there was almost no improvement in any of the psychological variables.
Table 3.
Psychological changes following nutrition and exercise programs.
| Variable | Exe + nutr (n = 41) | Nutrition (n = 21) | Exercise (n = 7) | Control (n = 27) | ||||||||||||
|---|---|---|---|---|---|---|---|---|---|---|---|---|---|---|---|---|
| Before | After | T(p) | Percentage change | Before | After | T(p) | Percentage change | Before | After | T(p) | Percentage change | Before | After | T(p) | Percentage change | |
| Well-being | 3.36 (0.57) | 3.51 (0.53) | 2.5* | +4.5 | 3.41 (0.57) | 3.54 (0.39) | 1.2 | +3.8 | 2.87 (0.4) | 2.94 (0.68) | 0.46 | +2.43 | 3.41 (0.74) | 3.4 (0.67) | 0.11 | −0.29 |
| Self-efficacy | 3.14 (0.62) | 3.41 (0.57) | 3.9* | +8.6 | 2.99 (0.68) | 3.17 (0.67) | 1.7 | +6 | 2.97 (0.4) | 2.87 (1.03) | 0.31 | −3.37 | 3.14 (0.61) | 3.14 (0.63) | 0.04 | 0 |
| Body image | 2.62 (0.68) | 3.28 (0.8) | 7.2* | +25 | 2.73 (0.55) | 3.06 (0.57) | 2.2* | +12 | 2.53 (0.72) | 2.3 (1.3) | 0.54 | −9.1 | 2.64 (0.59) | 2.88 (0.57) | 2.5* | +9.1 |
| Self-image | 3.24 (0.6) | 3.65 (0.61) | 5.4* | +12.7 | 3.34 (0.38) | 3.71 (0.43) | 3.3* | +11.1 | 2.99 (0.47) | 3.23 (0.55) | 1.27 | +8 | 3.27 (0.49) | 3.38 (0.55) | 1.4 | +3.4 |
exe + nutr: exercise + nutrition program.
Variables were tested with t-test for dependent samples.
p < 0.05.
When measuring the difference between the three groups in the change (post-test to pre-test) that occurred following the program (using a one-way ANOVA analysis), there was a significant difference (p < 0.05) in self-efficacy, body image, and self-image between the exe + nutr group (0.26, 0.65, and 0.41, respectively) and the control group (0.003, 0.23, and 0.11, respectively).
Six months after the programs ended, a follow-up study was conducted. The participants answered a phone-based survey asking the following questions: Have you continued to diet/exercise after the program ended? Have you gained or lost weight? How many kilograms have you gained or lost? Do you exercise independently or in an organized manner? How many days a week do you exercise? As can be seen in Table 4, regarding most of the questions, there was no difference between the exe + nutr group and the nutrition group once the program ended. There were more participants in the exe + nutr group who continued to diet than in the nutrition group, but the difference was not significant. There was no difference between the exe + nutr and nutrition group regarding the number of participants who gained or lost weight or experienced any weight change (Table 4). In both groups, approximately 50% of the participants gained weight after the program ended. Among the participants who lost weight after the program ended (n = 13), those from the nutrition group lost more weight than the women from the exe + nutr group. In both groups, approximately 50% of the women exercised after the program ended. In the exe + nutr group, 53.8% of the women preferred to exercise independently, while in the nutrition group, the women who exercised preferred to do so either in an organized manner or in both an organized manner and independently. The exe + nutr group exercised 2.27 (SD = 2.61) times a week, and the nutrition group exercised 1.34 (SD = 1.65) times a week. The exercise group was not included in the follow-up study because this group continued exercising in the facilities in an additional diet program.
Table 4.
Follow-up phone survey 6 months after the end of the program.
| Follow-up questions | Answers | Exe + nutr | Nutrition | χ2(p) |
|---|---|---|---|---|
| Have you continued to diet? | Yes | 45.2% | 31.0% | 0.23 |
| No | 54.8% | 69.0% | ||
| Have you gained or lost weight? | Lost | 23.8% | 10.3% | 0.18 |
| No change | 23.8% | 41.2% | ||
| Gained | 52.4% | 48.3% | ||
| How many kg have you lost? (number of women from both groups who lost weight: n = 13) |
Mean | −4.10 | −15.0 | T(p) = 0.001 |
| SD | 2.77 | 7.0 | ||
| How many kg have you gained? (number of women from both groups who gained weight: n = 36) |
Mean | 4.21 | 4.92 | T(p) = 0.39 |
| SD | 2.41 | 2.23 | ||
| Have you exercised/continued to exercise? | Yes | 52.4% | 44.8% | 0.53 |
| No | 47.6% | 55.2% | ||
| Do you exercise independently or in an organized manner? | By yourself | 53.8% | 15.4% | 0.05 |
| Organized | 26.9% | 38.5% | ||
| Both | 19.2% | 46.2% | ||
| How many days a week do you exercise? | Mean | 2.27 | 1.34 | T(p) = 0.08 |
| SD | 2.61 | 1.65 |
exe + nutr: exercise + nutrition program; kg: kilograms; SD: standard deviation.
The analysis included χ2test for nominal variables and t-test for independent sample for Likert-type scale variables; n = 70.
Discussion
The main purpose of this study was to strengthen the idea that the use of diet together with exercising for the purpose of losing weight is better than solely dieting, or solely exercising, because when combining exercising and eating a healthier diet, there is an improvement to more aspects of life and at larger scales.
This study analyzed the differences between weight loss programs among middle-aged women. While there are many studies on this issue, this was the first to measure anthropometric, biochemical, physiological, physical, and psychological variables at the same time and using the same study participants. This research paradigm allowed for a better overview of all the aspects involved in losing weight and enabled a better analysis and comparison between different weight loss programs.
In this study, all anthropometric variables were reduced in both the exe + nutr and nutrition groups, but not in the control group (Table 1). Because the exercise group included only seven participants, it is not possible to draw conclusions from their results, thus most conclusions excluded the exercise group. The exe + nutr and nutrition groups both showed a reduction in body weight, BMI, body fat percentage, WC, and HC. Although both showed the same trend and there was no significant difference between the groups (in body weight, BMI, fat mass, and body fat percentage), the exe + nutr group showed a better reduction in all parameters. The difference between the two groups was significant regarding WC and HC, with a smaller WC and HC in the exe + nutr group. It was noteworthy that even with a small sample, participants from the exercise group showed significant reduction in WC and WHR. A wide body circumference and WHR are important factors when evaluating cardiovascular disease and diabetes;43 a reduction in body circumference and especially WC, therefore, lessens the risk of morbidity and mortality caused by cardiovascular disease, high cholesterol, and diabetes.4,5,43
Another important difference between the groups was the finding that the exe + nutr group showed no reduction in LBM, unlike the nutrition group (Table 1). This result emphasizes the contribution of exercising while dieting to maintaining muscle mass. This concurs with many other studies, which have demonstrated that when reducing calorie intake without exercising, weight loss includes losing fat and also muscle mass.26 Body fat percentage was measured according to the bio-impedance analysis technique, which is not the gold standard to measure fat mass and has its limits. Due to this, fat loss was also measured by WC and HC using a measuring tape.
Following a loss of 3.5–3.9 kg during the program (in the exe + nutr and nutrition groups), there was a reduction in triglycerides, cholesterol total, LDL, HDL, and fasting blood glucose levels. The reduction of all these variables following weight loss has been well studied and documented and is one of the main motivators of weight loss.20 Although not all variables decreased in a significant manner, both the exe + nutr and nutrition groups were still different from the control group in spite of the brevity of the program and an average weight loss of only 3–4 kg (Table 2). It should be noted, however, that the results might not be significant and one should be careful to draw conclusions, due to the fact that the participants were responsible for collecting their blood results from tests conducted in their own health maintenance organizations; only a small number of participants supplied their blood results at the end of the program. The blood results were collected from three different health maintenance organizations and were adjusted by a well-skilled physician, though there could still be some discrepancies.
Another important reason for wanting to lose excess weight is due to high blood pressure.44,45 In accordance with other studies,44,45 our results presented in Figure 2(a) exhibit that a loss of excess weight leads to a reduction in blood pressure even in a program as short as 8 weeks. The average blood pressure was reduced in both groups by 5.06 mmHg (exe + nutr group) and 3.65 mmHg (nutrition group), while the control group exhibited a small rise.
Physical ability has a major role in daily function. In this study, three physical ability tests were carried out: a flexibility test (SLR for range of motion in the hip joint and sit and reach test), a balance test (one-leg balance test), and an aerobic fitness test (VO2 max test). Higher aerobic fitness enables a person to manage regular daily living with less fatigue and less effort.46 During the 8-week program, women in the exe + nutr group participated in many exercise classes including aerobic workouts. It was anticipated that this group would show a greater rise in aerobic capacity, which would be expressed in a higher VO2 max value. It should be noted that the values of VO2 max are expressed in mL/kg/min and if an individual loses weight, the VO2 max value will rise even without any exercise. Thus, both groups showed an elevation in VO2 max values (Figure 2(b)), with the exe + nutr group exhibiting a higher rise (4.79 ± 4.38 mL/kg/min) than the nutrition group (3.19 ± 4.17 mL/kg/min). The control group showed no elevation and even a small decrease in VO2 max values (0.61 ± 5.06 mL/kg/min). One reason for the lack of significant differences between the groups could be the small number of participants from the nutrition group (n = 12) who agreed to perform the test after the program ended. The test requires carrying out exercise at an elevated heart rate; if a person is not used to this kind of physical effort, there is a tendency to stop during the test. Many of the nutrition group participants indeed asked to stop the test due to a feeling of strenuous effort.
It is very important to improve flexibility in obese people, as gaining fat mass is negatively correlated with flexibility, and a reduction in flexibility can reduce basic daily functioning.8 People who exercise, especially those who emphasize stretching and strength exercises, are able to improve their range of motion, thus improving their score in the sit and reach test.47,48 The exe + nutr group showed a two-fold better range of motion following the program than the nutrition group (Figure 3(b)).
A person who loses excess weight can improve his or her physical performance, including stability and balance, due to weight loss alone.21,22 Thus, in the one-leg balance test, both the exe + nutr and nutrition groups performed better after the program (Figure 3(a)). It is well known that certain strength and balance exercises can improve stability and reduce falls,49 but this study emphasized that reducing body weight can improve balance, as has been mentioned elsewhere.22 Physical aspects were improved in the exe + nutr and nutrition programs, although the outcomes were better in the exe + nutr group, leading to better physical ability and daily function.
This study suggests that losing excess weight by either diet alone or diet and exercise together improves anthropometric, biochemical, physiological, and physical variables, with a small preference for the latter program.26,50–52 But one of the major variables influencing quality of life and a healthy lifestyle is a person’s psychological state. We found that by losing weight, the women participating in either the exe + nutr or nutrition program also increased their well-being, self-efficacy, body image, and self-image, especially among the exe + nutr group (Table 3). This concurs with other studies that have shown improvement in psychological parameters following a diet and exercise program and their importance on the quality of life of middle-aged women.53–55
One of the main perks of the programs was that during the 8 weeks, the participants could consult with the sports instructor (in the exe + nutr and exercise groups) or nutritionist (exe + nutr and nutrition groups) at any time. Consultation and encouragement are believed to be very influential factors that play a role in weight loss.56 Six months after the program ended, the participants were contacted and were asked if they continued to diet and/or exercise. Prior to the end of the program, all participants were informed about how to continue dieting and exercising, as well as how to continue to lose weight. Six months following the end of the program, many of the participants had not continued dieting or exercising, and many of them had gained weight (Table 4). This stresses the importance of guiding, consulting, and supporting an individual throughout the weight loss journey.
This study has a few limitations that should be taken into consideration. This was a retrospective observational study, with data taken from 96 out of 145 participants (67%), due to lack of response to the post-test assessments. Although it was a convenience sample and 33% were excluded (as well as the exercise group being excluded from the discussion because of such a small sample), the sample was still big enough to show significance and suggest that the exe + nutr group proved to be the best program for losing weight. Moreover, the study emphasized the important of analyzing multiple variables measured within the same cohort. This study does not purport to generalize the entire menopausal women population, but to direct a spotlight on the importance of multiple variables: anthropometric, biochemical, physiological, physical, and psychological, in the same cohort within various weight loss programs. This study presents an initial picture of this type of weight loss program, and future prospective studies should be done with larger samples.
Conclusion
The results of this study indicate that weight loss may influence many aspects of life in overweight middle-aged women. The unique contribution of this study relates to the evaluation of a large variety of physical parameters along with psychological measures. We suggest that even in a relatively short-term weight loss program, there was improvement in all anthropometric, biochemical, physiological, physical, and psychological parameters. While there was improvement when participating in both diet and diet and exercise programs, combining diet and exercise showed the best results. We suggest the implementation of prospective investigations and/or implementation of such programs for the betterment of health in the overweight, middle-aged female population.
Supplemental Material
Supplemental material, appendix for A comparison of diet versus diet + exercise programs for health improvement in middle-aged overweight women by Gili Joseph, Rinat Arviv-Eliashiv and Riki Tesler in Women’s Health
Acknowledgments
Many thanks to the Seminar Hakibbutzim students, Tali Lahat-Sidon, Ovadia Sidon, Iris Sasa, Mor Schwarzbard, Maayan Frishman, Eti Liberman, Yael Schapiro, Yael Weiss, Eti Yaniv-Levi, and Ran Magen. We would also like to thank “Derech Hachosher Lachaim” for agreeing to participate in this study and providing the facilities, the environment, the infrastructure, and the instructors for the weight loss programs. We would also like to thank the participants for their willingness to share their information and data after finishing the programs.
Footnotes
Declaration of conflicting interests: The author(s) declared the following potential conflicts of interest with respect to the research, authorship, and/or publication of this article: The authors do not have any prior interactions with Women’s Health regarding this manuscript. All authors have approved this manuscript; this manuscript has not been previously published, is not under consideration elsewhere,, and will not be submitted elsewhere until an editorial decision is rendered.
Ethical approval: This study was conducted in accordance with the Declaration of Helsinki and approved by the Ethics Committee of Seminar Hakibbutzim College (Approval No. GILI130414). All respondents were given explanations before data collection and were advised that participation was voluntary. After agreeing to share their information, all women signed an informed written consent form.
Funding: The author(s) received no financial support for the research, authorship, and/or publication of this article.
ORCID iD: Gili Joseph  https://orcid.org/0000-0002-2568-9751
References
- 1. World Health Organization (WHO). Fact Sheet no. 311 (updated 2013): obesity and overweight, http://www.who.int/mediacentre/factsheets/fs311/en/
- 2. Haslam DW, James WPT. Obesity. Lancet 2005; 366(9492): 1197–1209. [DOI] [PubMed] [Google Scholar]
- 3. Sarwar N, Danesh J, Eiriksdottir G, et al. Triglycerides and the risk of coronary heart disease. Circulation 2007; 115(4): 450–458. [DOI] [PubMed] [Google Scholar]
- 4. Lean ME, Han TS, Seidell JC. Impairment of health and quality of life in people with large waist circumference. Lancet 1998; 351: 853–856. [DOI] [PubMed] [Google Scholar]
- 5. de Koning L, Merchant AT, Pogue J, et al. Waist circumference and waist-to-hip ratio as predictors of cardiovascular events: meta-regression analysis of prospective studies. Eur Heart J 2007; 28(7): 850–856. [DOI] [PubMed] [Google Scholar]
- 6. Julius S, Gudbrandsson T. Early association of sympathetic over activity hypertension insulin resistance, and coronary risk. J Cardiovasc Pharmacol 1992; 20(Suppl. 8): S40–S48. [PubMed] [Google Scholar]
- 7. Shazia SM, Badaam KM, Deore DN. Assessment of aerobic capacity in overweight young females: a cross-sectional study. Int J Appl Basic Med Res 2015; 5(1): 18–20. [DOI] [PMC free article] [PubMed] [Google Scholar]
- 8. Park W, Ramachandran J, Weisman P, et al. Obesity effect on male active joint range of motion. Ergonomics 2010; 53(1): 102–108. [DOI] [PubMed] [Google Scholar]
- 9. Gilleard W, Smith T. Effect of obesity on posture and hip joint movements during a standing task, and trunk forward flexion motion. Int J Obes (Lond) 2007; 31: 267–271. [DOI] [PubMed] [Google Scholar]
- 10. Błaszczyk JW, Cieślinska-Świder J, Plewa M, et al. Effects of excessive body weight on postural control. J Biomech 2009; 42(9): 1295–1300. [DOI] [PubMed] [Google Scholar]
- 11. Atlantis E, Baker M. Obesity effects on depression: systematic review of epidemiological studies. Int J Obes (Lond) 2008; 32(6): 881–891. [DOI] [PubMed] [Google Scholar]
- 12. De Wit L, Luppino F, Straten A, et al. Depression and obesity: a meta-analysis of community-based studies. Psychiatry Res 2010; 178: 230–235. [DOI] [PubMed] [Google Scholar]
- 13. Teixeira PJ, Going SB, Houtkooper LB, et al. Exercise motivation, eating, and body image variables as predictors of weight control. Med Sci Sports Exerc 2006; 38(1): 179–188. [DOI] [PubMed] [Google Scholar]
- 14. Carraça EV, Silva MN, Markland D, et al. Body image change and improved eating self-regulation in a weight management intervention in women. Int J Behav Nutr Phys Act 2011; 8: 75–86. [DOI] [PMC free article] [PubMed] [Google Scholar]
- 15. Swencionis C, Wylie-Rosett J, Lent MR, et al. Weight change, psychological well-being, and vitality in adults participating in a cognitive–behavioral weight loss program. Health Psychol 2013; 32(4): 439–446. [DOI] [PMC free article] [PubMed] [Google Scholar]
- 16. Pan A, Sun Q, Czernichow S, et al. Bidirectional association between depression and obesity in middle-aged and older women. Int J Obes (Lond) 2012; 36(4): 595–602. [DOI] [PMC free article] [PubMed] [Google Scholar]
- 17. Cheng C, Hsu C, Liu J. Effects of dietary and exercise intervention on weight loss and body composition in obese postmenopausal women: a systematic review and meta-analysis. Menopause 2018; 25(7): 772–782. [DOI] [PubMed] [Google Scholar]
- 18. Wieder-Huszla S, Malgorzata S, Jurczak A, et al. Effects of socio-demographic, personality and medical factors on quality of life of postmenopausal women. Int J Environ Res Public Health 2014; 11(7): 6692–6708. [DOI] [PMC free article] [PubMed] [Google Scholar]
- 19. Poobalan A, Aucott L, Smith WCS, et al. Effects of weight loss in overweight/obese individuals and long-term lipid outcomes—a systematic review. Obes Rev 2004; 5(1): 43–50. [DOI] [PubMed] [Google Scholar]
- 20. Kelley GA, Kelley KS, Roberts S, et al. Combined effects of aerobics exercise and diet on lipids and lipoproteins in overweight and obese adults: a meta- analysis. J Obes 2012; 2012; 985902. [DOI] [PMC free article] [PubMed] [Google Scholar]
- 21. Handrigan G, Hue O, Simoneau M, et al. Weight loss and muscular strength affect static balance control. Int J Obes (Lond) 2010; 34(5): 936–942. [DOI] [PubMed] [Google Scholar]
- 22. Goulding A, Jones IE, Taylor RW, et al. Dynamic and static tests of balance and postural sway in boys: effects of previous wrist bone fractures and high adiposity. Gait Posture 2003; 17(2): 136–141. [DOI] [PubMed] [Google Scholar]
- 23. Olsson LA, Hurtig-Wennlöf A, Nilsson TK. Subjective well-being in Swedish active seniors and its relationship with physical activity and commonly available biomarkers. Clin Interv Aging 2014; 9: 1233–1239. [DOI] [PMC free article] [PubMed] [Google Scholar]
- 24. Finkelstein EA, Trogdon JG, Cohen JW, et al. Annual medical spending attributable to obesity: payer-and service-specific estimates. Health Aff (Millwood) 2009; 28(5): w822–w831. [DOI] [PubMed] [Google Scholar]
- 25. Johns DJ, Hartmann-Boyce J, Jebb SA, et al. Behavioral Weight Management Review Group. Diet or exercise interventions vs combined behavioral weight management programs: a systematic review and meta-analysis of direct comparisons. J Acad Nutr Diet 2014; 114(10): 1557–1568. [DOI] [PMC free article] [PubMed] [Google Scholar]
- 26. Miller WC, Koceja DM, Hamilton EJ. A meta-analysis of the past 25 years of weight loss research using diet, exercise or diet plus exercise intervention. Int J Obes Relat Metab Disord 1997; 21: 941–947. [DOI] [PubMed] [Google Scholar]
- 27. Smith PJ, Blumenthal JA, Babyak MA, et al. Effects of the dietary approaches to stop hypertension diet, exercise, and caloric restriction on neurocognition in overweight adults with high blood pressure. Hypertension 2010; 55(6): 1331–1338. [DOI] [PMC free article] [PubMed] [Google Scholar]
- 28. Del Porto H, Pechak C, Smith D, et al. Biomechanical effects of obesity on balance. Int J Exerc Sci 2012; 5(4): 301–320. [Google Scholar]
- 29. Maffiuletti NA, Agosti F, Proietti M, et al. Postural instability of extremely obese individuals improves after a body weight reduction program entailing specific balance training. J Endocrinol Invest 2005; 28(1): 2–7. [DOI] [PubMed] [Google Scholar]
- 30. Annesi JJ. Relations of perceived bodily changes with actual changes and changes in mood in obese women initiating an exercise and weight loss program. Percept Mot Skills 2006; 103(1): 238–240. [DOI] [PubMed] [Google Scholar]
- 31. World Health Organization (WHO). Obesity and overweight, 2004, https://www.who.int/news-room/fact-sheets/detail/obesity-and-overweight (accessed March 2018).
- 32. Kasper D, Fauci A, Hauser S, et al. Harrison’s principles of internal medicine. 19th ed. New York: McGraw-Hill, 2015. [Google Scholar]
- 33. Legge BJ, Banister EW. The Astrand-Ryhming nomogram revisited. J Appl Physiol (1985) 1986; 61(3): 1203–1209. [DOI] [PubMed] [Google Scholar]
- 34. Vellas BJ, Rubenstein LZ, Ousset PJ, et al. One-leg standing balance and functional status in a population of 512 community-living elderly persons. Aging (Milano) 1997; 9(1–2): 95–98. [DOI] [PubMed] [Google Scholar]
- 35. Rikli RE, Edwards DJ. Effects of a three-year exercise program on motor function and cognitive processing speed in older women. Res Q Exerc Sport 1991; 62(1): 61–67. [DOI] [PubMed] [Google Scholar]
- 36. Heyward VH, Gibson AL. Advanced fitness assessment and exercise prescription. 7th ed. Champaign, IL: Human Kinetics; 2014. [Google Scholar]
- 37. The knowledge attitudes and health-related practices (KAP) survey Israel Center for Disease Control (ICDC) in collaboration with the Department of Education and Health Promotion, 2013. [Google Scholar]
- 38. Veit CT, Ware JE., Jr. The structure of psychological distress and wellbeing in general populations. J Consult and Clin Psychol 1983; 51(5): 730–742. [DOI] [PubMed] [Google Scholar]
- 39. Florian V, Drori Y. Mental Health Inventory (MHI): psychometric characteristics and normative data regarding the Israeli population. Psychology 1990; 1: 26–35. [Google Scholar]
- 40. Chen G, Gully SM, Eden D. Validation of a new general self-efficacy scale. Organ Res Methods 2001; 4: 62–83. [Google Scholar]
- 41. Gray-Donald K, O’Loughlin J, Richard L, et al. Validation of a short-administered questionnaire to evaluate dietary interventions in low income communities in Montreal, Canada. J Epidemiol Comm Health 1997; 51: 326–331. [DOI] [PMC free article] [PubMed] [Google Scholar]
- 42. Fitts WH, Warren WN. Tennessee self-concept scale. 2nd ed. Torrance, CA: Western Psychological Services, 1996. [Google Scholar]
- 43. Ashwell M, Gunn P, Gibson S. Waist-to-height ratio is a better screening tool than waist circumference and BMI for adult cardiometabolic risk factors: systematic review and meta-analysis. Obes Rev 2012; 13(3): 275–286. [DOI] [PubMed] [Google Scholar]
- 44. Berkow SE, Barnard ND. Blood pressure regulation and vegetarian diets. Nutr Rev 2005; 63(1): 1–8. [DOI] [PubMed] [Google Scholar]
- 45. Wang L, Manson JE, Gaziano JM, et al. Fruit and vegetable intake and the risk of hypertension in middle-aged and older women. Am J Hypertens 2012; 25(2): 180–189. [DOI] [PMC free article] [PubMed] [Google Scholar]
- 46. Villareal DT, Chode S, Parimi N, et al. Weight loss, exercise, or both and physical function in obese older adult. N Engl J Med 2011; 364: 1218–1229. [DOI] [PMC free article] [PubMed] [Google Scholar]
- 47. Sainz de, Baranda P, Ayala F. Chronic flexibility improvement after 12 week of stretching program utilizing the ACSM recommendations: hamstring flexibility. Int J Sports Med 2010; 31(6): 389–396. [DOI] [PubMed] [Google Scholar]
- 48. Fatouros IG, Taxildaris K, Tokmakidis SP, et al. The effects of strength training, cardiovascular training and their combination on flexibility of inactive older adults. Int J Sports Med 2002; 23(2): 112–119. [DOI] [PubMed] [Google Scholar]
- 49. Howe TE, Rochester L, Jackson A, et al. Exercise for improving balance in older people. Cochrane Database Syst Rev 2007; 4: 1465–1858. [DOI] [PubMed] [Google Scholar]
- 50. Imayama I, Alfano CM, Kong A, et al. Dietary weight loss and exercise interventions effects on quality of life in overweight/obese postmenopausal women: a randomized controlled trial. Int J Behav Nutr Phys Act 2011; 8: 118–129. [DOI] [PMC free article] [PubMed] [Google Scholar]
- 51. Foster-Schubert K, Alfano CM, Duggan CR, et al. Effect of diet and exercise, alone or combined, on weight and body composition in overweight-to-obese post-menopausal women. Obesity (Silver Spring) 2012; 20(8): 1628–1638. [DOI] [PMC free article] [PubMed] [Google Scholar]
- 52. Ashford S, Edmunds J, French DP. What is the best way to change self-efficacy to promote lifestyle and recreational physical activity. Br J Health Psychol 2010; 15(Pt 2): 265–288. [DOI] [PubMed] [Google Scholar]
- 53. Andersen RE, Wadden TA, Bartlett SJ, et al. Effects of lifestyle activity vs structured aerobic exercise in obese women: a randomized trial. JAMA 1999; 218(4): 335–340. [DOI] [PubMed] [Google Scholar]
- 54. Franz MJ, VanWormer JJ, Crain AL, et al. Weight loss outcomes: a systematic review and meta-analysis of weight loss clinical trials with a minimum 1-year follow-up. J Am Diet Assoc 2007; 107(10): 1755–1767. [DOI] [PubMed] [Google Scholar]
- 55. Swift DL, Johannsen NM, Lavie CJ, et al. The role of exercise and physical activity in weight loss and maintenance. Prog Cardiovasc Dis 2014; 56(4): 441–447. [DOI] [PMC free article] [PubMed] [Google Scholar]
- 56. Annesi JJ. Relations of changes in physical self-appraisal and perceived energy with weight change in obese women beginning a supported exercise and nutrition information program. Pyschol Rep 2007; 99(3): 925–929. [DOI] [PubMed] [Google Scholar]
Associated Data
This section collects any data citations, data availability statements, or supplementary materials included in this article.
Supplementary Materials
Supplemental material, appendix for A comparison of diet versus diet + exercise programs for health improvement in middle-aged overweight women by Gili Joseph, Rinat Arviv-Eliashiv and Riki Tesler in Women’s Health