Abstract
Background
T-box transcription factor protein 21 (TBX21) is expressed in immune cells and some tumor cells. Defects in TBX21 gene can cause Th1/Th2 imbalance, which is closely related to tumorigenesis. The expression and clinical value of TBX21 in skin cutaneous melanoma (SKCM) are not clear.
Material/Methods
RNA-Seq expression and clinical information were downloaded from The Cancer Genome Atlas (TCGA) and Genotype-Tissue Expression (GTEx) databases. Wilcoxon signed-rank test and logistic regression were used to explore the relationship between TBX21 expression and clinical parameters such as gender, stage, etc. The correlation between clinicopathological characteristics and overall survival of SKCM patients was estimated by Cox regression and the Kaplan-Meier method. Gene set enrichment analysis (GSEA) and protein-protein interaction (PPI) were conducted to analyze the potential mechanism of TBX21 in the progression of SKCM.
Results
Compared with normal samples, TBX21 was significantly upregulated in SKCM tissues. SKCM patients with lower TBX21 expression might have a worse prognosis than those with higher TBX21 expression according to Kaplan-Meier survival analysis. Cox analysis also reached the same conclusion: TBX21 was an independent prognostic indicator. GSEA showed that the highly expressed phenotypes in TBX21 were enriched to varying degrees with various signaling pathways. PPI network showed the top 10 proteins that were closely related to TBX21.
Conclusions
TBX21 expression was significantly correlated with the prognosis of SKCM patients and was found to be involved in a great many immunological pathways that affect the occurrence and development of tumors.
MeSH Keywords: Biological Markers, Melanoma, Prognosis, Skin Diseases
Background
Skin cutaneous melanoma (SKCM) is the most aggressive skin tumor and the main cause of skin cancer death [1]. Its incidence is growing faster than any of the top 10 cancers [2].The prognosis of SKCM remains tremendously poor, and only 15–20% of patients with distance metastases survive for 5 years after diagnosis [3]. Obvious geographical regional differences have been shown in the incidence characteristics of SKCM. Among the Asian Eastern populations, the incidence of SKCM occurs mostly at the extremities, and the V-raf murine sarcoma viral oncogene homolog (BRAF) gene mutation rate is about 24.3% [4]. While in the Caucasian Western populations, it is more common in the head and face [5], and the BRAF gene mutation rate about 50% [6]. Some genes and their effects have been shown to be related to SKCM and its metastasis, such as the chemokine C-X-C receptor 4 (CXCR4) gene silencing of melanoma invasion and metastasis [7], the promotion of mitogen-activated protein kinase (MAPK) and phosphoinositide 3-kinase (PI3K) pathways on the progression of SKCM [8], and the prediction of distant metastasis by serum lactate dehydrogenase (LDH) [9]. However, there are still no promising biomarkers to predict prognosis and treatment, especially immunotherapy in SKCM. Therefore, it is meaningful to explore novel biomarkers at the molecular level.
T-box transcription factor protein 21 (TBX21) is one of the T-box family and TBX21 is a specific transcription factor for T helper 1 (Th1) cell transformation which regulates the expression of interferon gamma (IFNG) and the hallmark Th1 cytokine interferon [10,11]. TBX21 contains 530 amino acids and has an open reading frame of about 1607 bp in length. Among them, there is a 189 amino acid-containing domain that can bind to T-box DNA (i.e., T-site). This region is highly conserved and can be combined with the corresponding DNA sequence to perform its function. TBX21 is located on human chromosome 17 and mouse chromosome 11. Extensive evidence has suggested that TBX21 is associated with cancer progression such as esophageal cancer [12], lung cancer [13], etc., by regulating a host’s immune response. However, few studies have reported on the expression and role of TBX21 in SKCM. It is of urgent need to elucidate the expression, prognosis, and mechanism of TBX21 in the development of SKCM.
Material and Methods
Patient datasets
The clinical data and gene expression profiles of SKCM patients and normal controls in this paper are mainly derived from The Cancer Genome Atlas (TCGA) (https://portal.gdc.cancer.gov/) and the Genotype-Tissue Expression (GTEx) (https://toil.xenahubs.net/download/GTEX_phenotype.gz) datasets on 09-30-2019. TCGA-SKCM and GTEx gene expression data were analyzed by same library preparation and sequencing platform for the minimized potential batch effects and previous studies have successfully compared gene expression data from TCGA and GTEx [14–18]. Excluding SKCM patients with loss or follow-up time <90 days, a total of 445 patients (all from TCGA) and 813 normal controls (1 from TCGA and the rest from GTEx) were statistically analyzed for follow-up (Table 1).
Table 1.
Clinical features of SKCM patients in TCGA database.
| Clinical characteristics | Total (445) | Percent (%) | ||
|---|---|---|---|---|
| Age at diagnosis (years) | <58 | 217 | 48.76 | |
| ≥58 | 228 | 51.24 | ||
| Gender | Female | 168 | 37.75 | |
| Male | 277 | 62.25 | ||
| Fustat | Live | 207 | 47.09 | |
| Death | 238 | 52.91 | ||
| Clinical stage | 0 | 6 | 1.49 | |
| I | 77 | 19.15 | ||
| II | 130 | 32.34 | ||
| III | 169 | 42.04 | ||
| IV | 20 | 4.98 | ||
| T stage | Tis | 7 | 1.74 | |
| T0 | 23 | 5.72 | ||
| T1 | 66 | 16.42 | ||
| T2 | 76 | 18.91 | ||
| T3 | 88 | 21.89 | ||
| T4 | 142 | 35.32 | ||
| Distant metastasis | Negative | 400 | 95.01 | |
| Positive | 21 | 4.99 | ||
| Lymph nodes | Negative | 221 | 55.67 | |
| Positive | 1 | 73 | 18.39 | |
| 2–3 | 49 | 12.34 | ||
| ≥4 | 54 | 13.60 | ||
SKCM – skin cutaneous melanoma; TCGA – The Cancer Genome Atlas. The median age at diagnosis was 58 years old.
Gene set enrichment analysis (GSEA) and protein-protein interaction (PPI)
Using GSEA, we first generated an orderly gene list according to the correlation between all genes and TBX21 expression, and then identified the significant survival difference between high TBX21 group and low TBX21 group through GSEA. There were 1000 genome permutations per analysis. The expression level of TBX21 was used as a phenotype marker. Nominal P-value and normalized enrichment score (NES) were used to rank the enriched pathways in each phenotype. Then we analyzed the protein-protein interaction (PPI) network of TBX21 through the STRING v11.0 database, and selected interaction score >0.4 to extract PPI for TBX21.
Statistical analysis
R (v.3.6) was used in all statistical analysis. Wilcoxon test and logistic regression were utilized to explore the relevance between TBX21 and clinical factors. Cox regression and Kaplan-Meier method were conducted to compare the effect of TBX21 expression and other clinical characteristics on survival. The cutoff value of TBX21 expression was determined by its median value.
Results
Patient characteristics
Basic information of 445 SKCM patients from TCGA used for analysis is summarized in Table 1, of which 228 patients were 58 years old or older and 217 were less than 58 years old (median age was 58 years old). Of the 445 SKCM patients, 62.25% were male and 37.75% were female. By the time we download the data (09-30-2019), 47.09% of patients were alive and 52.91% of patients were dead. Of the 402 cases for clinical stage, 6 cases were in stage 0 (1.49%), 77 cases were in stage I (19.15%), 130 cases were in stage II (32.34%), 169 cases were in stage III (42.04%), and 20 cases were in stage IV (4.98%). Stage Tis was found in 7 patients (1.74%), T0 in 23 patients (5.72%), T1 in 66 patients (16.42%), T2 in 76 patients (18.91%), T3 in 88 patients (21.89%), and T4 in 142 patients (35.32%). There were 21 out of 421 cases that had distant metastases and 176 out of 397 cases (44.33%) that had lymph node metastases.
Expression and distribution of TBX21 in normal human tissues
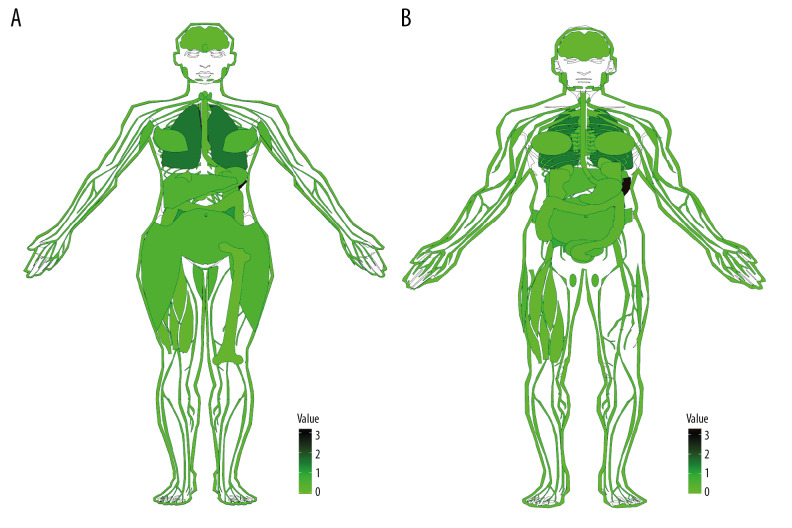
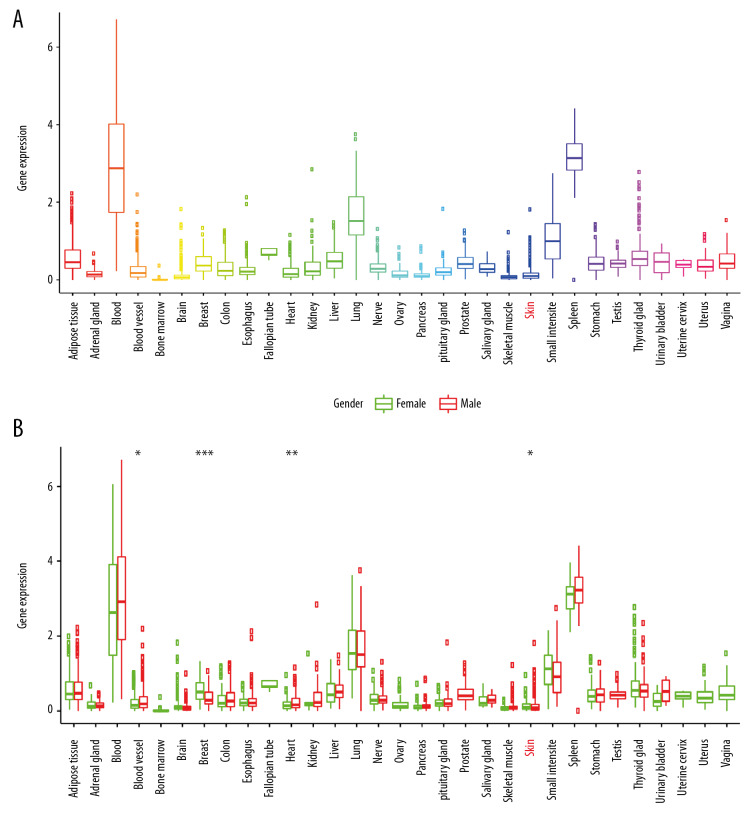
The GTEx database collected thousands of autopsy samples, covering solid organ tissues, brain regions, whole blood, cell lines from the donor’s blood and skin, for a total of 9783 normal samples. Analytical maps (Figure 1) and box plots (Figure 2) of TBX21 distribution in human normal tissues were drawn using the R language gganatogram and ggpubr software packages. Figures 1 and 2 indicated that TBX21 gene expression was low in normal tissues and organs.
Figure 1.
Anatomical profile of TBX21 expression in normal human tissues (A) Female; (B) Male; TBX21 expression level gradually increased from light to dark in the picture, value=log(x+1,2), x is the specific expression of TBX21 in each tissue.
Figure 2.
TBX21 is expressed and distributed in normal human tissues and organs. (A) Box plot; (B) gender difference box plot; green for female, red for male. * P<0.05; ** P<0.01; *** P<0.001).
Differential expression of TBX21 in melanoma and normal skin tissue
There are 33 types of cancer collected in TCGA, including a total of 9736 tumor samples, but only 726 normal samples are provided. Therefore, the analysis between tumor and normal data only based on TCGA will result in low analysis efficiency due to this imbalance. The GTEx collected gene expression sequencing data has 9783 normal samples. Meanwhile, the expression data from TCGA and GTEx are calculated under the same pipeline, so the data of GTEx and TCGA can be integrated, analyzed, and compared. By integrating normal skin samples from GTEx and TCGA databases, a total of 813 normal samples were obtained, including 812 from GTEx database and 1 from TCGA database; in addition, 471 tumor samples were obtained from TCGA. Compared with control group, TBX21 was significantly upregulated in SKCM (P<0.001; Figure 3).
Figure 3.
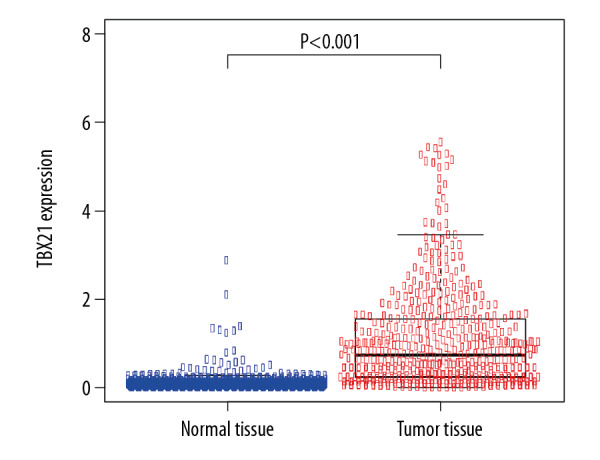
Differential expression of TBX21 in normal skin and skin cutaneous melanoma tissues (P<0.001).
Association with TBX21 expression and clinical factors
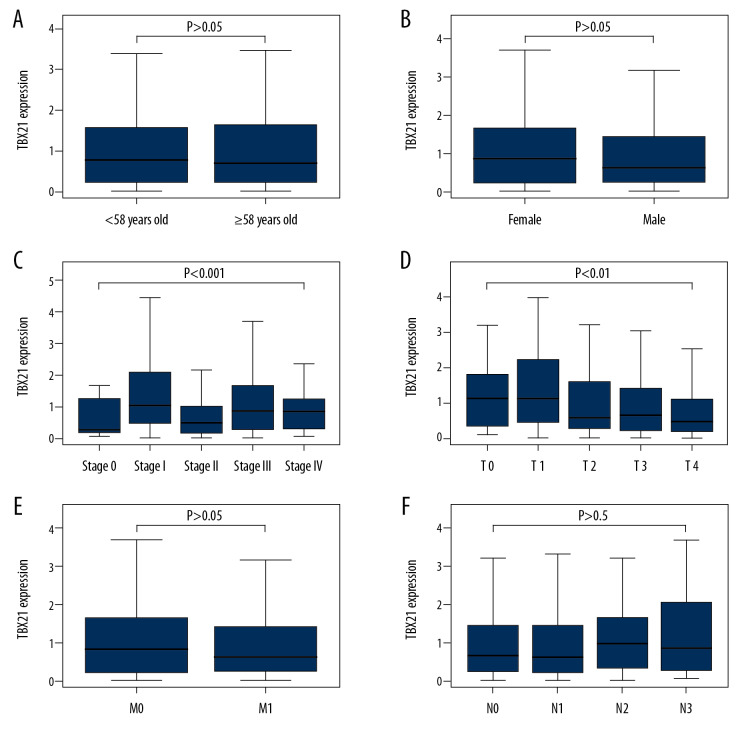
We then analyzed 445 SKCM samples from TCGA to investigate the relationship between the expression level of TBX21 and clinicopathologic variables. The related results are shown in Figure 4A–4F). The expression of TBX21 was significantly correlated with clinical stage (P<0.001) and T stage (P<0.01). Further univariate analysis using logistic regression indicated that the expression of TBX21 was related to clinical stage (stage II versus stage I: odds ratio [OR]=0.4567 (0.2570–0.8031), P=0.0069) and T stage (T2 versus T1: OR=0.4643 (0.2053–1.0122), P=0.0581). These results suggested that the expression of TBX21 decreased gradually in the development of SKCM (Table 2).
Figure 4.
Relationship between TBX21 expression and clinical pathology. (A) Age. (B) Gender. (C) Clinical stage. (D) T stage. TBX21 expression was statistically significant during clinical stage and T stage (clinical stage: P<0.001; T stage: P<0.01). (E) Distant metastasis. (F) Lymph node metastasis.
Table 2.
Logistic regression analysis of the relationship between TBX21 expression and clinical factors.
| Clinical factors | Total (N) | OR (95% CI) | P-value | |
|---|---|---|---|---|
| Age (years) | ≥58 vs. <58 | 445 | 0.9221 (0.6349–1.3386) | 0.6697 |
| Gender | Male vs. Female | 445 | 0.7841 (0.5358–1.1456) | 0.2093 |
| Stage | II vs. I | 216 | 0.4567 (0.2570–0.8031) | 0.0069 |
| III vs. I | 246 | 0.8784 (0.5062–1.5138) | 0.6419 | |
| IV vs. I | 99 | 0.9455 (0.3694–2.4707) | 0.9071 | |
| T stage | T2 vs. T1 | 119 | 0.4643 (0.2053–1.0122) | 0.0581 |
| T3 vs. T1 | 131 | 0.5306 (0.2383–1.1380) | 0.1101 | |
| T4 vs. T1 | 193 | 0.3469 (0.1624–0.7089) | 0.0046 | |
| Lymph nodes | N1 vs. N0 | 308 | 1.0320 (0.6104–1.7424) | 0.9062 |
| N2 vs. N0 | 283 | 1.3369 (0.7214–2.5003) | 0.3577 | |
| N3 vs. N0 | 288 | 1.3616 (0.7526–2.4855) | 0.3092 | |
| Distant metastasis | M1 vs. M0 | 440 | 1.1932 (0.5218–2.7760) | 0.6749 |
TBX21 – T-box transcription factor protein 21; OR – odds ratio; CI – confidence interval. P<0.05 was considered statistically significant, and P-value less than 0.05 in the table are shown in bold; the median age at diagnosis was 58 years old.
Survival outcomes and multivariate analysis
According to the median value of TBX21 expression, SKCM patients were divided into a high TBX21 expression group and a low TBX21 expression group. As shown in Figure 5, the Kaplan-Meier survival analysis showed that SKCM patients with low TBX21 expression had a worse prognosis than those with high TBX21 expression (hazard ratio [HR]: 0.6911 (0.5745–0.8315); log-rank P=1.009e-04). Univariate Cox analysis showed the same conclusion (HR: 0.6911 (0.5745–0.8315); P<0.001). And other clinical factors associated with poor overall survival (OS) included age, clinical stage, T stage, and lymph node metastasis (Table 3, Figure 6A). Multivariate Cox analysis showed that TBX21 was an independent predictor of prognosis (HR: 0.7265 (0.6058–0.8713); P<0.001), along with age, T stage, and lymph node metastasis (Table 3, Figure 6B).
Figure 5.
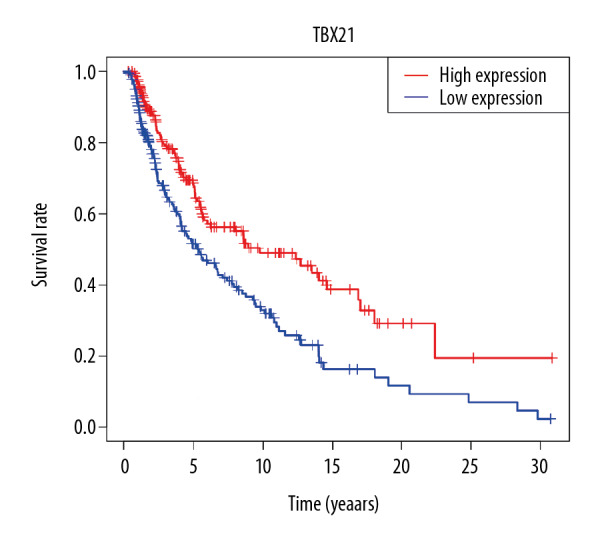
Effect of TBX21 expression on survival of skin cutaneous melanoma patients.
Table 3.
Univariate and multivariate Cox analysis of clinical factors and overall survival in SKCM patients.
| Clinical factors | Univariate analysis | Multivariate analysis | ||
|---|---|---|---|---|
| HR (95% CI) | P-value | HR (95% CI) | P-value | |
| Age | 1.0193 (1.0084–1.0302) | 0.0005 | 1.0133 (1.0022–1.0245) | 0.0183 |
| Gender | 1.0291 (0.7378–1.4355) | 0.8657 | 1.0430 (0.7438–1.4624) | 0.8073 |
| Stage | 1.3961 (1.1673–1.6699) | 0.0003 | 1.0110 (0.7896–1.2945) | 0.9311 |
| T stage | 1.3380 (1.1730–1.5261) | <0.0001 | 1.3017 (1.1350–1.4929) | 0.0002 |
| M stage | 1.7568 (0.7174–4.3020) | 0.2175 | 1.4131 (0.5433–3.6751) | 0.4783 |
| N stage | 1.4202 (1.2137–1.6620) | <0.0001 | 1.4847 (1.1913–1.8504) | 0.0004 |
| TBX21 | 0.6911 (0.5745–0.8315) | <0.0001 | 0.7265 (0.6058–0.8713) | 0.0006 |
HR – hazard ratio; CI – confidence interval; SKCM – skin cutaneous melanoma P<0.05 was statistically significant, and P-value less than 0.05 in the table are shown in bold.
Figure 6.
Forest map of univariate (A) and multivariate (B) Cox analysis.
GSEA and PPI
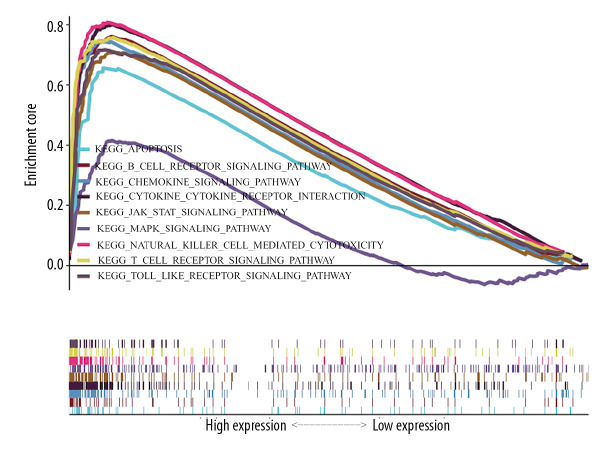
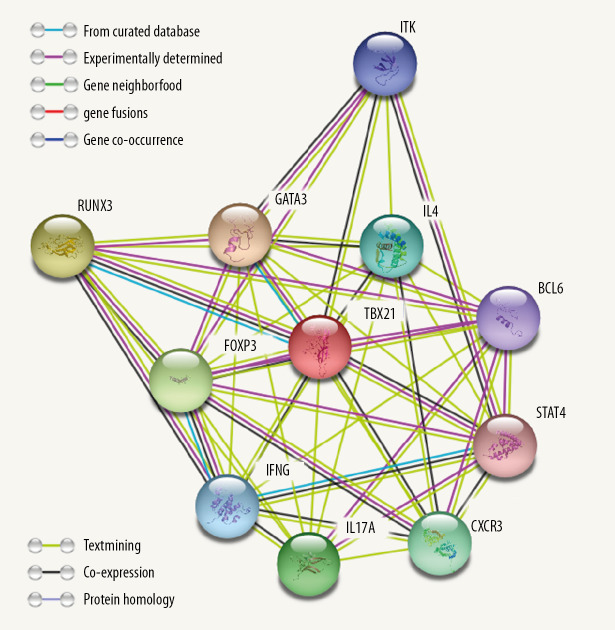
Finally, GSEA was conducted to explore the low and high expression data sets of TBX21 and identify differences in the SKCM signaling pathway. As shown in Figure 7 and Table 4 for the normalized enrichment scores, the highly expressed phenotypes in TBX21 were enriched to varying degrees with various signaling pathways. From high to low: chemokine signaling pathway, cytokine-cytokine receptor interaction, natural killer cell (NK) cell mediated cytotoxicity, T cell receptor signaling pathway, JAK-STAT signaling pathway, Toll-like receptor (TLR) signaling pathway, apoptosis, B cell signaling pathway, and MAPK signaling pathway. We entered TBX21 into the STRING database to forecast PPI; the result showed that trans-acting T cell-specific transcription factor 3 (GATA3), runt-related transcription factor 3 (RUNX3), Forkhead box protein 3 (FOXP3), interleukin-17A (IL-17A), C-X-C chemokine receptor type 3 (CXCR3), IL-4, IFNG, tyrosine-protein kinase (ITK/TSK), B-cell lymphoma 6 (BCL6) protein and signal transducer and activator of transcription 4 (STAT4) were enriched in the top 10 (Figure 8).
Figure 7.
Enrichment plots from gene set enrichment analysis (GSEA).
Table 4.
Gene set enrichment analysis.
| Name | NES | NOM P-val | FDR q-val |
|---|---|---|---|
| KEGG_Chemokine_Signaling_Pathway | 2.7256 | <0.001 | <0.001 |
| KEGG_Cytokine_Cytokine_Receptor_Interaction | 2.6925 | <0.001 | <0.001 |
| KEGG_Natural_Killer_Cell_Mediated_Cytotoxicity | 2.6638 | <0.001 | <0.001 |
| KEGG_T_Cell_Receptor_Signaling_Pathway | 2.5619 | <0.001 | <0.001 |
| KEGG_JAK_STAT_Signaling_Pathway | 2.5563 | <0.001 | <0.001 |
| KEGG_TOLL_Like_Receptor_Signaling_Pathway | 2.5174 | <0.001 | <0.001 |
| KEGG_Apoptosis | 2.4450 | <0.001 | <0.001 |
| KEGG_B_Cell_Receptor_Signaling_Pathway | 2.4338 | <0.001 | <0.001 |
| KEGG_MAPK_Signaling_Pathway | 1.8407 | <0.001 | <0.05 |
NES – normalized enrichment score; NOM P-val – nominal P-value; FDR q-val – false discovery rate q-value; KEGG – Kyoto Encyclopedia of Genes and Genomes. Gene sets with NOM P-val <0.05 and FDR q-val <0.25 are considered as significant.
Figure 8.
Protein-protein interaction network. Network nodes represent proteins, content of node shows 3-dimensional structure of protein, edges represent protein-protein associations.
Discussion
An increasing amount of research has shown that TBX21 plays a critical part in genesis and progression of tumor [19–21]. But the expression of TBX21 and its prognostic value on SKCM has not yet been reported. In this work, the association between the TBX21 gene and SKCM was analyzed based on TCGA and GTEx databases. The results revealed that TBX21 was overexpressed in SKCM tissues obviously and patients with increased TBX21 expression had a better prognosis. The expression level of TBX21 was an independent prognostic index along with age, T stage, and lymph nodes metastasis. M stage could be used as a prognostic factor of SKCM patients in univariate Cox analysis according to other studies [22–24]. In our study, M stage was not a prognostic factor of SKCM patients in both univariate and multivariate analyses. Our study only included 21 patients with positive distant metastasis, which might be the cause of the difference.
TBX21, also known as T-bet, is specifically expressed in immune cells such as Th1 cells, NK cells, and dendritic cells. Therefore, as Figures 1 and 2 show, the expression of TBX21 is higher in blood, lung, small intestine, and spleen, and it is lower in skin. T-bet regulates the balance of Th1/Th2 cells [10]. Tumor progression including melanoma is usually linked to the shift of Th1 to Th2 [25,26]. Increased Th2 cells produce IL-4, which further inhibits the differentiation of Th1 cells. Lee et al. reported that TBX21-deficient mice were more sensitive to tumor development due to dysfunction of immune cells such as Th1 dysfunction; restoration of TBX21 suppressed tumor growth in mice [27]. The recognition and clearance of tumor cells by the immune system requires increased expression of TBX21 [20,28]. Consequently, TBX21 is overexpressed in melanoma tissue compared to normal skin sample. However, as the tumor progressed, Th2 cells and regulatory T cells gradually dominated, and TBX21 expression was suppressed [29].
Furthermore, we also screened TBX21-related signaling pathways in SKCM to find the potential mechanism of TBX21 regulating the development of SKCM. Most of these signaling pathways were immune-related. The occurrence of malignant tumors is known to be a long-term, multi-stage, multi-gene accumulation process, and changes in apoptosis-related genes are involved in this process. Inhibition of tumor cell apoptosis is a significant pathway of tumorigenesis, so it is an important strategy for tumor therapy to induce tumor cell apoptosis. T-bet can control the type of immunoglobulin (Ig) expressed by B cells, and the expression of T-bet can promote the production of IgG2a, IgG2b, and IgG3 and inhibit the production of IgG1 and IgE [30]. Chemokines, including CXCR3, are small molecule-secreted proteins that can control the directed movement of immune cells. Many studies have looked at their chemotactic properties to improve the efficacy of tumor immunotherapy [31]. Cytokines such as IL-4, IL-17, and IFNG regulate oncogenesis and progression of tumors by binding to the corresponding cytokine receptors on the cell surface [32]. The JAK-STAT and MAPK signaling pathways are important transmitters from the cell surface to the inside of the cell which regulate various cellular processes, such as growth, proliferation, and differentiation [33–35]. NK cell is a type of non-specific tumor cell killer without prior sensitization, which plays an important role in mediating tumor microenvironment through secreting IFNG [36–38]. Anti-tumor immune responses are mainly mediated by T cells, the type 1 cellular immune response is modulated by CD8+CTLs, and CD4+Th1 cells are the most important among those. T-bet is known to regulate differentiation and effector functions of Th1 and CD8+ T cells [39]. Toll-like receptor (TLR) activates a variety of immune cells through different recognition pathways, initiates non-specific immune responses and stimulates adaptive immune responses [40].
Finally, the PPI screened 10 proteins closely related to TBX21. Chemokines CXCR3 transcription factor STAT4 and T-bet have been reported to control the differentiation of Th0 to Th1 cells [41,42]. Th1 cells secrete IFNG and IL-2, which activates STAT1 and JAK1/JAK2 signaling pathways, and positively regulates TBX21 expression [43]. Transcription factor GATA-3 is required in the differentiation of Th2 cells [44]. Activated Th2 cells produce IL-4, which inhibits TBX21 expression. RUNX3 and FOXP3 upregulate the expression of T (Treg) cells and downregulate the immune response [45]. IL-17A is a characteristic cytokine produced by T-helper cells (Th17 cells) [46]. IFNG and IL-4 inhibit Th17 differentiation. All the aforementioned indicates that TBX21 can inhibit occurrence and progression of SKCM by controlling various signaling pathways and proteins. ITK is an important protein, controlling cell growth and differentiation [47].
In a recent study [48], RNA-Seq was used to analyze transcriptome data of 41 advanced SKCM patients who received anti-PD-1 therapy. The results suggest that biopsy samples from patients responding to PD-1 blockade show higher expression of TBX21. Thus, TBX21 might be used as a prognostic biomarker for the effect of SKCM on immune checkpoint inhibitors. More preclinical and clinical studies are needed to confirm and explore these underlying mechanisms, which we plan to be the focus of our future research.
In this work, we analyzed the association between the expression of individual TBX21 genes and overall survival in SKCM patients. Furthermore, we investigated the potential mechanism of TBX21 genes in SKCM patient prognosis through the GSEA database. In the future, we plan to carry out more in-depth and detailed experimental research to verify these study findings.
Conclusions
This study suggests that TBX21 is overexpressed in SKCM, and it can inhibit SKCM development through multiple signaling pathways and proteins. TBX21 might be a promising prognostic biomarker for SKCM.
Footnotes
Conflict of interests
None.
Source of support: This work was supported by the Jiangsu Provincial Medical Innovation Team (grant numbers CXTDA2017034) and Scientific Research Project of Jiangsu Health Committee (grant numbers H2018116)
References
- 1.Rajkumar S, Watson IR. Molecular characterisation of cutaneous melanoma: Creating a framework for targeted and immune therapies. Br J Cancer. 2016;115(2):145–55. doi: 10.1038/bjc.2016.195. [DOI] [PMC free article] [PubMed] [Google Scholar]
- 2.Spencer KR, Mehnert JM. Mucosal melanoma: Epidemiology, biology and treatment. Cancer Treat Res. 2016;167:295–320. doi: 10.1007/978-3-319-22539-5_13. [DOI] [PubMed] [Google Scholar]
- 3.Siegel RL, Miller KD, Jemal A. Cancer statistics, 2016. Cancer J Clin. 2016;66(1):7–30. doi: 10.3322/caac.21332. [DOI] [PubMed] [Google Scholar]
- 4.Wu X, Yan J, Dai J, et al. Mutations in BRAF codons 594 and 596 predict good prognosis in melanoma. Oncol Lett. 2017;14(3):3601–5. doi: 10.3892/ol.2017.6608. [DOI] [PMC free article] [PubMed] [Google Scholar]
- 5.Slominski AT, Brozyna AA, Zmijewski MA, et al. Vitamin D signaling and melanoma: Role of vitamin D and its receptors in melanoma progression and management. Lab Invest. 2017;97(6):706–24. doi: 10.1038/labinvest.2017.3. [DOI] [PMC free article] [PubMed] [Google Scholar]
- 6.Li Y, Umbach DM, Li L. Putative genomic characteristics of BRAF V600K versus V600E cutaneous melanoma. Melanoma Res. 2017;27(6):527–35. doi: 10.1097/CMR.0000000000000388. [DOI] [PMC free article] [PubMed] [Google Scholar]
- 7.McConnell AT, Ellis R, Pathy B, et al. The prognostic significance and impact of the CXCR4-CXCR7-CXCL12 axis in primary cutaneous melanoma. Br J Dermatol. 2016;175(6):1210–20. doi: 10.1111/bjd.14720. [DOI] [PubMed] [Google Scholar]
- 8.Leonardi GC, Falzone L, Salemi R, et al. Cutaneous melanoma: From pathogenesis to therapy (review) Int J Oncol. 2018;52(4):1071–80. doi: 10.3892/ijo.2018.4287. [DOI] [PMC free article] [PubMed] [Google Scholar]
- 9.Agarwala SS, Keilholz U, Gilles E, et al. LDH correlation with survival in advanced melanoma from two large, randomised trials (Oblimersen GM301 and EORTC 18951) Eur J Cancer. 2009;45(10):1807–14. doi: 10.1016/j.ejca.2009.04.016. [DOI] [PubMed] [Google Scholar]
- 10.Lazarevic V, Glimcher LH, Lord GM. T-bet: A bridge between innate and adaptive immunity. Nat Rev Immunol. 2013;13(11):777–89. doi: 10.1038/nri3536. [DOI] [PMC free article] [PubMed] [Google Scholar]
- 11.Miller SA, Weinmann AS. Molecular mechanisms by which T-bet regulates T-helper cell commitment. Immunol Rev. 2010;238(1):233–46. doi: 10.1111/j.1600-065X.2010.00952.x. [DOI] [PMC free article] [PubMed] [Google Scholar]
- 12.Zhang LH, Li Q, Li P, et al. Association between gastric cancer and -1993 polymorphism of TBX21 gene. World J Gastroenterol. 2012;18(10):1117–22. doi: 10.3748/wjg.v18.i10.1117. [DOI] [PMC free article] [PubMed] [Google Scholar]
- 13.Reppert S, Boross I, Koslowski M, et al. A role for T-bet-mediated tumour immune surveillance in anti-IL-17A treatment of lung cancer. Nat Commun. 2011;2:600. doi: 10.1038/ncomms1609. [DOI] [PubMed] [Google Scholar]
- 14.Venkat S, Tisdale AA, Schwarz JR, et al. Alternative polyadenylation drives oncogenic gene expression in pancreatic ductal adenocarcinoma. Genome Res. 2020;30(3):347–60. doi: 10.1101/gr.257550.119. [DOI] [PMC free article] [PubMed] [Google Scholar]
- 15.Cancer Genome Atlas Research Network. Integrated genomic characterization of pancreatic ductal adenocarcinoma. Cancer Cell. 2017;32(2):185–203.e13. doi: 10.1016/j.ccell.2017.07.007. [DOI] [PMC free article] [PubMed] [Google Scholar]
- 16.Zeng WZD, Glicksberg BS, Li Y, Chen B. Selecting precise reference normal tissue samples for cancer research using a deep learning approach. BMC Med Genomics. 2019;12(Suppl 1):21. doi: 10.1186/s12920-018-0463-6. [DOI] [PMC free article] [PubMed] [Google Scholar]
- 17.Kosti I, Jain N, Aran D, et al. Cross-tissue analysis of gene and protein expression in normal and cancer tissues. Sci Rep. 2016;6:24799. doi: 10.1038/srep24799. [DOI] [PMC free article] [PubMed] [Google Scholar]
- 18.Aran D, Camarda R, Odegaard J, et al. Comprehensive analysis of normal adjacent to tumor transcriptomes. Nat Commun. 2017;8(1):1077. doi: 10.1038/s41467-017-01027-z. [DOI] [PMC free article] [PubMed] [Google Scholar]
- 19.Garrett WS, Punit S, Gallini CA, et al. Colitis-associated colorectal cancer driven by T-bet deficiency in dendritic cells. Cancer Cell. 2009;16(3):208–19. doi: 10.1016/j.ccr.2009.07.015. [DOI] [PMC free article] [PubMed] [Google Scholar]
- 20.Andreev K, Trufa DI, Siegemund R, et al. Impaired T-bet-pSTAT1alpha and perforin-mediated immune responses in the tumoral region of lung adenocarcinoma. Br J Cancer. 2015;113(6):902–13. doi: 10.1038/bjc.2015.255. [DOI] [PMC free article] [PubMed] [Google Scholar]
- 21.Gorter A, Prins F, van Diepen M, et al. The tumor area occupied by Tbet+ cells in deeply invading cervical cancer predicts clinical outcome. J Transl Med. 2015;13:295. doi: 10.1186/s12967-015-0664-0. [DOI] [PMC free article] [PubMed] [Google Scholar]
- 22.Tas F, Erturk K. Neurotropism as a prognostic factor in cutaneous melanoma patients. Neoplasma. 2018;65(2):304–8. doi: 10.4149/neo_2018_170426N312. [DOI] [PubMed] [Google Scholar]
- 23.Tas F, Erturk K. Presence of histological regression as a prognostic factor in cutaneous melanoma patients. Melanoma Res. 2016;26(5):492–96. doi: 10.1097/CMR.0000000000000277. [DOI] [PubMed] [Google Scholar]
- 24.Tas F, Erturk K. Elevated erythrocyte sedimentation rate is associated with metastatic disease and worse survival in patients with cutaneous malignant melanoma. Mol Clin Oncol. 2017;7(6):1142–46. doi: 10.3892/mco.2017.1440. [DOI] [PMC free article] [PubMed] [Google Scholar]
- 25.Kharkevitch DD, Seito D, Balch GC, et al. Characterization of autologous tumor-specific T-helper 2 cells in tumor-infiltrating lymphocytes from a patient with metastatic melanoma. Int J Cancer. 1994;58(3):317–23. doi: 10.1002/ijc.2910580302. [DOI] [PubMed] [Google Scholar]
- 26.McCarter M, Clarke J, Richter D, Wilson C. Melanoma skews dendritic cells to facilitate a T helper 2 profile. Surgery. 2005;138(2):321–28. doi: 10.1016/j.surg.2005.06.011. [DOI] [PubMed] [Google Scholar]
- 27.Lee K, Min HJ, Jang EJ, et al. In vivo tumor suppression activity by T cell-specific T-bet restoration. Int J Cancer. 2010;127(9):2129–37. doi: 10.1002/ijc.25238. [DOI] [PubMed] [Google Scholar]
- 28.Kachler K, Holzinger C, Trufa DI, et al. The role of Foxp3 and T-bet co-expressing Treg cells in lung carcinoma. Oncoimmunology. 2018;7(8):e1456612. doi: 10.1080/2162402X.2018.1456612. [DOI] [PMC free article] [PubMed] [Google Scholar]
- 29.Mulligan AM, Pinnaduwage D, Tchatchou S, et al. Validation of intratumoral T-bet+ lymphoid cells as predictors of disease-free survival in breast cancer. Cancer Immunol Res. 2016;4(1):41–48. doi: 10.1158/2326-6066.CIR-15-0051. [DOI] [PubMed] [Google Scholar]
- 30.Peng SL, Szabo SJ, Glimcher LH. T-bet regulates IgG class switching and pathogenic autoantibody production. Proc Natl Acad Sci USA. 2002;99(8):5545–50. doi: 10.1073/pnas.082114899. [DOI] [PMC free article] [PubMed] [Google Scholar]
- 31.Nagarsheth N, Wicha MS, Zou W. Chemokines in the cancer microenvironment and their relevance in cancer immunotherapy. Nat Rev Immunol. 2017;17(9):559–72. doi: 10.1038/nri.2017.49. [DOI] [PMC free article] [PubMed] [Google Scholar]
- 32.Tumino N, Martini S, Munari E, et al. Presence of innate lymphoid cells in pleural effusions of primary and metastatic tumors: Functional analysis and expression of PD-1 receptor. Int J Cancer. 2019;145(6):1660–68. doi: 10.1002/ijc.32262. [DOI] [PMC free article] [PubMed] [Google Scholar]
- 33.Chen J, Wang S, Su J, et al. Interleukin-32alpha inactivates JAK2/STAT3 signaling and reverses interleukin-6-induced epithelial-mesenchymal transition, invasion, and metastasis in pancreatic cancer cells. Onco Targets Ther. 2016;9:4225–37. doi: 10.2147/OTT.S103581. [DOI] [PMC free article] [PubMed] [Google Scholar]
- 34.Plotnikov A, Zehorai E, Procaccia S, Seger R. The MAPK cascades: Signaling components, nuclear roles and mechanisms of nuclear translocation. Biochim Biophys Acta. 2011;1813(9):1619–33. doi: 10.1016/j.bbamcr.2010.12.012. [DOI] [PubMed] [Google Scholar]
- 35.Shahmarvand N, Nagy A, Shahryari J, Ohgami RS. Mutations in the signal transducer and activator of transcription family of genes in cancer. Cancer Sci. 2018;109(4):926–33. doi: 10.1111/cas.13525. [DOI] [PMC free article] [PubMed] [Google Scholar]
- 36.Malmberg KJ, Carlsten M, Bjorklund A, et al. Natural killer cell-mediated immunosurveillance of human cancer. Semin Immunol. 2017;31:20–29. doi: 10.1016/j.smim.2017.08.002. [DOI] [PubMed] [Google Scholar]
- 37.Chan LL, Wucherpfennig KW, de Andrade LF. Visualization and quantification of NK cell-mediated cytotoxicity over extended time periods by image cytometry. J Immunol Methods. 2019;469:47–51. doi: 10.1016/j.jim.2019.04.001. [DOI] [PubMed] [Google Scholar]
- 38.Bassani B, Baci D, Gallazzi M, et al. Natural killer cells as key players of tumor progression and angiogenesis: old and novel tools to divert their pro-tumor activities into potent anti-tumor effects. Cancers (Basel) 2019;11(4) doi: 10.3390/cancers11040461. pii: E461. [DOI] [PMC free article] [PubMed] [Google Scholar]
- 39.Mullen AC, High FA, Hutchins AS, et al. Role of T-bet in commitment of TH1 cells before IL-12-dependent selection. Science. 2001;292(5523):1907–10. doi: 10.1126/science.1059835. [DOI] [PubMed] [Google Scholar]
- 40.Hou Y, Lu X, Zhang Y. IRAK inhibitor protects the intestinal tract of necrotizing enterocolitis by inhibiting the Toll-like receptor (TLR) inflammatory signaling pathway in rats. Med Sci Monit. 2018;24:3366–73. doi: 10.12659/MSM.910327. [DOI] [PMC free article] [PubMed] [Google Scholar]
- 41.Gaya M, Barral P, Burbage M, et al. Initiation of antiviral B cell immunity relies on innate signals from spatially positioned NKT cells. Cell. 2018;172(3):517–33.e20. doi: 10.1016/j.cell.2017.11.036. [DOI] [PMC free article] [PubMed] [Google Scholar]
- 42.Ma X, Nakayamada S, Kubo S, et al. Expansion of T follicular helper-T helper 1 like cells through epigenetic regulation by signal transducer and activator of transcription factors. Ann Rheum Dis. 2018;77(9):1354–61. doi: 10.1136/annrheumdis-2017-212652. [DOI] [PubMed] [Google Scholar]
- 43.Kim DH, Park HJ, Lim S, et al. Regulation of chitinase-3-like-1 in T cell elicits Th1 and cytotoxic responses to inhibit lung metastasis. Nat Commun. 2018;9(1):503. doi: 10.1038/s41467-017-02731-6. [DOI] [PMC free article] [PubMed] [Google Scholar]
- 44.Shen Y, Li J, Wang SQ, Jiang W. Ambiguous roles of innate lymphoid cells in chronic development of liver diseases. World J Gastroenterol. 2018;24(18):1962–77. doi: 10.3748/wjg.v24.i18.1962. [DOI] [PMC free article] [PubMed] [Google Scholar]
- 45.Zhang Y, Zhang Y, Gu W, Sun B. TH1/TH2 cell differentiation and molecular signals. Adv Exp Med Biol. 2014;841:15–44. doi: 10.1007/978-94-017-9487-9_2. [DOI] [PubMed] [Google Scholar]
- 46.Sandquist I, Kolls J. Update on regulation and effector functions of Th17 cells. F1000Res. 2018;7:205. doi: 10.12688/f1000research.13020.1. [DOI] [PMC free article] [PubMed] [Google Scholar]
- 47.Banerjee H, Kane LP. Immune regulation by Tim-3. F1000Res. 2018;7:316. doi: 10.12688/f1000research.13446.1. [DOI] [PMC free article] [PubMed] [Google Scholar]
- 48.Abril-Rodriguez G, Torrejon DY, Liu W, et al. PAK4 inhibition improves PD-1 blockade immunotherapy. Nat Cancer. 2020;1(1):46–58. doi: 10.1038/s43018-019-0003-0. [DOI] [PMC free article] [PubMed] [Google Scholar]


