Abstract
Purpose:
This study explores the possibility of using a gradient moment balanced sequence with a quadratically varied RF excitation phase in the magnetic resonance fingerprinting (MRF) framework to quantify T2* in addition to δf, T1, and T2 tissue properties.
Methods:
The proposed quadratic RF phase-based MRF method (qRF-MRF) combined a varied RF excitation phase with the existing balanced SSFP (bSSFP)-based MRF method to generate signals that were uniquely sensitive to δf, T1, T2, as well as the distribution width of intravoxel frequency dispersion, Γ. A dictionary, generated through Bloch simulation, containing possible signal evolutions within the physiological range of δf, T1, T2, and Γ, was used to perform parameter estimation. The estimated T2 and Γ were subsequently used to estimate T2*. The proposed method was evaluated in phantom experiments and healthy volunteers (N = 5).
Results:
The T1 and T2 values from the phantom by qRF-MRF demonstrated good agreement with values obtained by traditional gold standard methods (r2 = 0.995 and 0.997, respectively; concordance correlation coefficient = 0.978 and 0.995, respectively). The T2* values from the phantom demonstrated good agreement with values obtained through the multi-echo gradient-echo method (r2 = 0.972, concordance correlation coefficient = 0.983). In vivo qRF-MRF-measured T1, T2, and T2* values were compared with measurements by existing methods and literature values.
Conclusion:
The proposed qRF-MRF method demonstrated the potential for simultaneous quantification of δf, T1, T2, and T2* tissue properties.
Keywords: magnetic resonance fingerprinting, multiparametric mapping, quantitative MRI, T2*
1 |. INTRODUCTION
Transverse relaxation time T2* is an MR tissue property that provides insight into underlying tissue physiology and pathology. The clinical value of such insight has led to the incorporation of T2* contrast-dependent methods such as MR-SWI and BOLD contrast-based techniques within various clinical protocols. The T2* tissue property is affected by tissue iron concentration, making it sensitive to iron containing blood products, and has been observed to change in several disease states. Parkinson’s disease is associated with increased iron in the substantia nigra, globus pallidus, and hippocampus.1–4 Alzheimer’s disease has been associated with increased iron stores in the basal ganglia, as well as hippocampal and cortical regions of the brain.1,5,6 Huntington’s disease has been associated with increased iron concentration in the globus palladus and putamen.3 Outside of the brain, T2*-sensitive techniques are used to monitor iron overload of the liver and heart in transfusion-dependent patients.7,8 Iron nanoparticle-based MR contrast agents have also been engineered for versatile biological specificity that rely on MR T2*-sensitive methods for detection.9
Empirically, T2* is the exponential decay time constant of the tissue MR signal. This time constant can be decomposed into two components described by the following relationship:
| (1) |
where T2 is the time constant of non-refocusable transverse magnetization decay, and T′2 is the time constant of refocusable transverse magnetization decay arising from intravoxel frequency dispersion. Although both T2 and T′2 properties are affected by tissue iron concentrations, neither property alone is specific to pathologies affecting tissue iron.10 For example, T2 is also affected by tissue water content, and T′2 is also affected by macroscopic field inhomogeneities and other sources of tissue susceptibility.8 Thus, MR methods capable of simultaneous quantification of T2, T′2, and T2* properties may provide greater sensitivity and specificity to pathology. For this reason, methods such as the GESFIDE (Gradient-Echo Sampling of Free Induction Decay and Echo)11 sequence have been developed. These methods require relatively long acquisition times because they must sample both refocused and non-refocused signal echoes, and as a result, have not yet gained widespread adoption.
Magnetic resonance fingerprinting (MRF) is a recently developed framework for the simultaneous quantification of multiple tissue properties.12 In its initial implementation, the framework was applied to reduce quantification time for brain tissue T1 and T2 relaxation properties by incorporating spatial and temporal incoherence to transient signals in a balanced SSFP-based pulse sequence (bSSFP-MRF).12 Other MRF implementations have since been developed to increase measurement robustness,13 be applied to other organ systems,14,15 or quantify additional tissue properties.16,17 Application of the MRF framework to T2* quantification may enable fast and robust quantification of T2* along with other tissue properties within a clinical exam. However, the initially proposed bSSFP-MRF method has only slight T2* sensitivity.18
This work introduces the novel quadratic RF phase-based MRF (qRF-MRF) method for the robust measurement of tissue T2* simultaneously with tissue T1, T2, and off-resonance (δf) properties within a single acquisition. The method was adapted from the original bSSFP-MRF method because of its sensitivity to T1, T2, and off-resonance ( δf) properties.12 The qRF-MRF T2* sensitivity is obtained using a varied RF phase scheme that is able to generate both high signal amplitude and signal dependence to intravoxel variations in δf. These properties are exploited to generate unique signal evolutions with high SNR within the MRF framework for robust and rapid quantification.
2 |. THEORY
Traditional bSSFP experiments have a well-characterized amplitude and phase behavior.19,20 Typical acquisition parameters in bSSFP experiments include constant high flip angle (FA), constant short TR, constant (linear) increment in RF excitation phase (PH), and zero net gradient moment per TR. The signal observed from isochromats are highly dependent on the relative RF phase increment, defined as the difference between the PH increment and the phase accumulated over the duration of a TR due to δf precession.
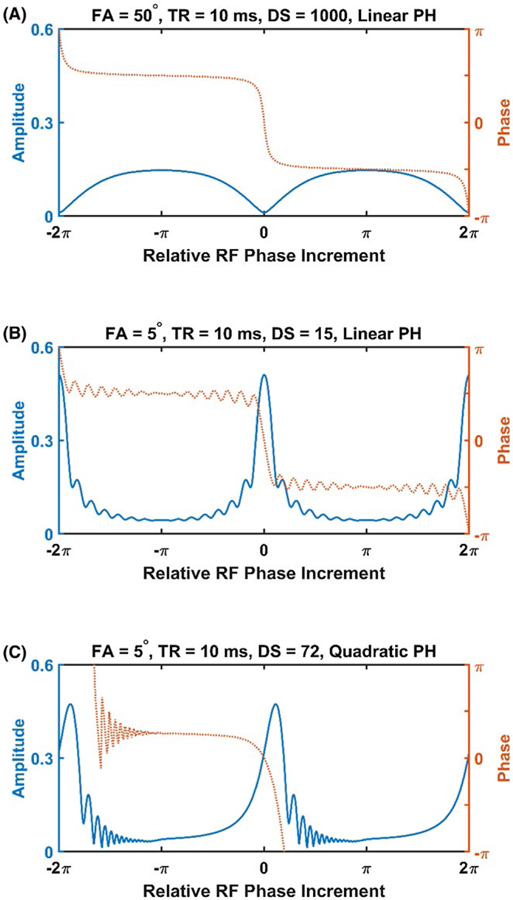
Figure 1A shows the amplitude and phase profiles for isochromats with different relative RF phase increments. When using large flip angles, isochromats with a relative RF phase increment approximately equal to an odd multiple of π have high amplitudes and similar phase values at sampling time TE. Signals from such isochromats are coherent during bSSFP experiments, regardless of the presence or absence of δf variations, due to their similar phase values. Without sensitivity to δf variations, the generated signals by these isochromats are not sensitive to T′2. Isochromats with relative phase increments close to an even multiple of π behave differently. Such isochromats have a steep phase profile, allowing for δf variation-dependent signal attenuation through phase cancelation. However, these isochromats have low signal amplitude, and signals from them cannot be reliably detected. Without signal regimes with both high amplitude and steep phase profile, the traditional bSSFP experiment is not sensitive to T′2, and therefore is not appropriate for T2* quantification.
FIGURE 1.
Amplitude and phase responses during variations of balanced SSFP (bSSFP)-type sequences. Responses are plotted as functions of the relative phase increment between consecutive RF phase from a rotating reference frame locked to the isochromat precession frequency. Traditional bSSFP (A) with high flip angle (FA), many preparation dummy scans (DS), and linear RF phase increment (PH) generates high signal amplitude with flat phase response when PH increment is an odd multiple of π. Low FA bSSFP with low DS (B) shows high signal amplitude with steep phase response for PH increments near even multiples of π. Low FA with a quadratic PH evolution (C) shows a similar response profile as low-FA bSSFP. High amplitude and steep phase response is maintained regardless of DS number with quadratic RF phase
Adjustments to the typical acquisition parameters during a bSSFP experiment can substantially increase T′2 sensitivity. Figure 1B shows the amplitude and phase profiles corresponding to a bSSFP experiment with a low FA and a reduced number of preparation pulses. Here, isochromats with an even multiple of π RF phase increment maintain the steep phase profile necessary for generation of T2*-weighted signal through intravoxel signal dephasing, but will transiently develop a large transverse amplitude before its steady state. In fact, this amplitude may surpass 50% of M0, even greater than those encountered in traditional bSSFP experiments.
Approaches using such acquisition parameters for T2*-weighted signal generation in bSSFP experiments have been explored previously.21 These approaches depend on the selection of acquisition parameters such that the resulting δf frequencies with steep phase profile coincide with the imaging regions of interest. The δf frequencies associated with this band, with the potential for T2*-weighted signal generation, is dependent on the choice of PH and TR used. Since PH and TR may be varied across imaging frames within an experiment, the frequency positions of this band, during the nth frame, is approximately given by
| (2) |
where N is any integer. As traditional bSSFP experiments use constant PH and TR parameters, the resulting band is also constant. The T2* sensitive regimes may be limited due to the macroscopic field inhomogeneity would the imaging FOV. By using a varied PH or TR between frames, the band can vary accordingly and allow for greater FOV coverage.
In the proposed method, a quadratic RF phase increment was selected such that PH was constantly varied. As a result, high-amplitude T2*-weighted signal bands were swept through different δf values. Figure 1C shows the transient amplitude and phase profiles of an experiment with a quadratic RF phase, demonstrating preserved high amplitude and steep phase characteristics necessary for T′2 and T2* sensitivity. In this way, macroscopic field inhomogeneity would not limit the sensitive FOV.
3 |. METHODS
3.1 |. Pulse sequence design
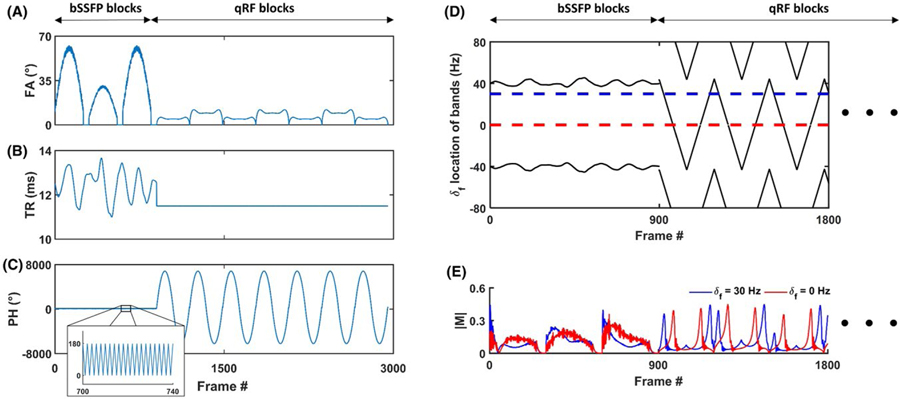
The proposed acquisition strategy used in qRF-MRF is based on a bSSFP-type sequence with a varied FA, TR, and PH. Pulse sequence FAs, TRs, and PHs were selected to generate unique signal shapes for combinations of δf, T1, T2, and intravoxel frequency dispersion properties within clinically relevant ranges. Figure 2A–C shows the FAs, TRs, and PHs used in the proposed method. Because bSSFP-MRF already fulfills both pulse sequence design criteria for the subset of δf, T1 and T2 properties, the initial 900 time frames of the proposed qRF-MRF method were performed using the identical FA, TR, and PH scheme as the bSSFP-MRF method,12 organized into 3 “bSSFP blocks” of 300 frames each.
FIGURE 2.
Pulse sequence description. The FA (A), TR (B), and RF PH (C) used during acquisition of each time frame of the proposed method are shown. During the first 900 time frames, three bSSFP-based blocks of excitations are using parameters identical to previously established bSSFP-MRF, including the use of alternated phase cycling. During the latter 2100 time frames, seven quadratic RF (qRF) blocks of excitations are acquired using low FA, constant TR, and quadratic PH acquisition parameters. The resulting off-resonance frequency position of high T2*-sensitive bands (D), calculated using Eq. (2), are shown for the first 1800 frames. Two example signal evolutions (E), differing only in δf value, are shown to illustrate signal behavior caused by the addition of quadratic phase RF. During quadratic RF lobes, high-amplitude signals from isochromats develop whenever resonance bands intersect the respective δf value
For the remaining frames, a new scheme of acquisitions, using seven repeated “qRF blocks” dedicated toward intravoxel frequency dispersion sensitivity, was performed by using low FA with quadratically varied PH increment. The FA pattern (Figure 2A) of each qRF block consisted of a smoothly varied base shape that ranged from 0°–6° for odd-numbered blocks, and 0°–12° for even-numbered blocks. The qRF blocks used a constant 11.5-ms TR (Figure 2B). Within the first and second halves of each qRF block, the PH (Figure 2C) of the piecewise nth frame is given by
| (3) |
and
| (4) |
respectively. Each qRF block consisted of only 293 frames to reduce repetition of combinations of the sampled gradient trajectory with the FA, TR, and PH acquisition parameters used throughout the method. Finally, 49 frames, acquired with 0° FA excitation, were appended to the end of the sequence, such that a total of 3000 frames were acquired in the method, consistent with the bSSFP-MRF method.
Figure 2D shows the corresponding frequency positions of T2*-sensitive bands during different frames of the method, as calculated by Eq. (2). These bands remain relatively stationary near ≈ ±40 Hz during the initial 900 frames, where constant alternated RF phase is used. Minor fluctuations in the position of resonance bands during these frames occurs as a result of the variations in TR. However, isochromats with δf values near bands during these frames develop the signal voids typically associated with bSSFP null-bands due to the relatively high FA. After the qRF blocks are initiated, the bands linearly traverse the full span of possible δf values. During these frames, isochromats develop transverse magnetization amplitude during particular frames, depending on δf value, an example of which is shown in Figure 2E. For frames in which a band traverses through a given isochromat’s δf value, a high transverse magnetization is developed.
A variable-density spiral trajectory22 designed with zeroth-moment and first-moment nulling was used to acquire data. The spiral trajectory required 24 and 48 interleaves to fully sample the inner and outer region of k-space, respectively. One spiral interleaf was sampled each frame, resulting in highly undersampled k-space data per frame. Previous MRF methods used a constant rotation of 7.5° of the spiral trajectory between frames to obtain spatial incoherence. In the current method, incoherence was further increased by adopting a bit-reversed ordering of sampled spiral interleafs that repeated itself every 48 frames. All acquisitions were single slice with FOV = 300 × 300 mm2, matrix size = 256 × 256 (in-plane pixel size of 1.2 × 1.2 mm2), and slice thickness of 5 mm. All 3000 frames for each single 2D slice were acquired in 35 seconds.
3.2 |. Dictionary
A dictionary-based approach was used to perform parameter estimation for δf, T1, T2, and T2* properties from undersampled image frame data following reconstruction. The dictionary used for parameter estimation was generated in two steps. First, a base dictionary, Sbase (n, δf, T1,T2, describing the signal at each of the 3000 frames, n, for different combinations of δf, T1 and T2 values, was simulated using the Bloch equation as described previously.12 This base dictionary was calculated for a wide range of 421 possible δf values, 89 possible T1 values, and 99 possible T2 values. Values for δf ranged from ±70 Hz with 0.33-Hz step size. Values for T1 ranged from 50 ms to 3700 ms with a variable step size, in which each value was 5% greater than the value immediately smaller than it. Values for T2 ranged from 5 ms to 135 ms with a constant step size of 3 ms, and then 135 ms to 2000 ms with a variable step size, each with a value 5% greater than the value immediately smaller than it.
This base dictionary was then convolved by a shape function, L(δf, Γ), to generate the full dictionary, S(n, δf, T1,T2,Γ), such that
| (5) |
In the current work, the shape function was limited to a Lorentzian distribution, parameterized by the Γ value that represents the FWHM of the distribution as described by
| (6) |
Although the Lorentzian distribution may not precisely reflect the underlying distribution in vivo, this shape was chosen such that the pulse sequence simulation of a gradient-echo (GRE)-type pulse sequence would generate a monoexponentially decaying transverse signal evolution. Curve-fitting this simulated signal evolution would yield the decay time constant, T2*, given by
| (7) |
Shapes, given by L(δf, Γ), were generated for 52 different values of Γ. Values for Γ ranged from 0 (the Dirac delta function) to 40 Hz. Between the values of 0 Hz and 0.825 Hz, Γ varied with a constant step size of 0.075 Hz. Between 0.825 Hz and 40 Hz, Γ increased with a variable step size that increased 10% per value. Before the convolution step in Eq. (5), each Lorentzian shape was truncated to span ±20 Hz and normalized. After computation, S(TR, δf, T1,T2,Γ) was decimated to 1-Hz resolution in δf values to reduce memory requirements. The final dictionary, consisting of 30 251 520 entries, spanned 101 values for δf that ranged from ±50 Hz. Dictionary generation was implemented in MATLAB (The MathWorks, Natick, MA) using custom-developed code.
3.3 |. Pattern recognition
The inner-product-based pattern recognition method used in this work has been described previously.12,13 For each pixel, the calculated dictionary and measured time course signals were normalized to their sum-squared magnitudes. The inner products between each pixel and dictionary entry was calculated, and the entry corresponding to the maximum value of the inner product was taken to represent the closest signal evolution to the acquired pixel. The estimated values for δf, T1, T2, and Γ were then derived from this entry. Relative proton density was derived from the scaling factor between the measured pixel signal and the matched dictionary entry. The value of T2* for each pixel was calculated from match-derived T2 and Γ values using Eq. (7).
3.4 |. Phantom experiments
To evaluate the accuracy of qRF-MRF, a phantom study was performed. All studies were performed using a 16-channel head receiver array on a Siemens Magnetom Skyra 3T system (Siemens AG Medical Solutions, Erlangen, Germany). The accuracy of T1 and T2 were compared against traditional Cartesian spin-echo methods. Both phantom composition and traditional spin-echo methods have been described previously.23 Briefly, the phantom consisted of 10 cylindrical compartments with different concentrations of gadopentate dimeglumine (Magnevist) and agarose (Sigma-Aldrich, St. Louis, MO). Reference T1 values were measured using an inversion-recovery spin echo (8 log-spaced TIs ranging from 21 ms-3500 ms with 12-ms TE and 10-second TR). The T2 values were measured using a repeated spin-echo sequence (7 log-spaced echoes that ranged from 13 ms-203 ms using a TR of 10 seconds). Reference T2* values used the multi-echo GRE method (25° FA excitation using 15 linearly spaced echoes ranging from 4 ms-152 ms with a TR of 200 ms). T1 values were calculated pixel-wise by solving the equation S(TI) = a + bexp(-TI/T1) using a 3-parameter nonlinear least-squares fitting routine. The T2 values were determined pixel-wise by solving the equation S(TE) = aexp(-TE/T2) using a 2-parameter nonlinear least-squares fitting routine. The T2* values were fit similarly to T2. The concordance correlation coefficient (CCC)24 was used to assess measurement accuracy.
To assess how the number of frames affected quantification, the values for T1, T2, and T2* were obtained from the dictionary pattern-recognition process using different numbers of frames. The number of frames was varied from 200–3000 frames with a 200-frame increment.
3.5 |. In vivo experiments
In vivo volunteer brain data were acquired in an internal review board-approved study, with written informed consent obtained before each scan. The proposed qRF-MRF method was performed in five volunteers. For comparison of quantified δf, T1, and T2 properties, bSSFP-MRF25 maps were acquired using 3000 time frames. For T2* measurement validation, a multi-echo GRE method using Cartesian-based sampling (25° FA excitation using 11 echoes ranging from 4 ms-80 ms using a TR of 200 ms) was acquired. Quantified properties were assessed for each method in manually drawn regions of interest corresponding to the gray matter, white matter, the substantia nigra, and the red nucleus. The CCC24 was used to assess agreement between quantified maps by qRF-MRF, bSSFP-MRF, and multi-echo GRE methods.
3.6 |. Postprocessing
The postprocessing for all fingerprinting data was consistent with previous methods.12 Acquired spiral data were reconstructed as described previously.13 Briefly, the nonuniform fast Fourier transform,26 using measured spiral trajectories,27 was used to separately reconstruct each undersampled time frame from each coil. These frames were combined using the adaptive coil combination method.28 Finally, all time frames were normalized to the combined coil sensitivity map.29
4 |. RESULTS
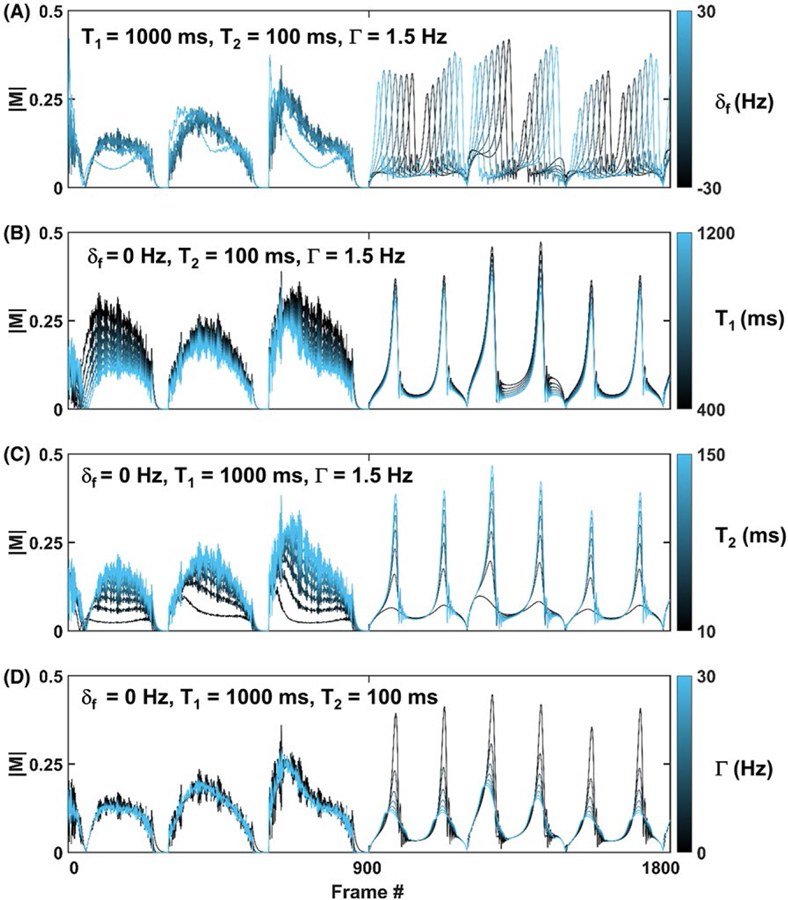
Figure 3 shows example entries from the qRF-MRF dictionary. In each plot, the first 1800 of 3000 total frames of representative signal evolutions are shown. Shown in each subplot are seven signal evolutions that differ in only 1 of the 4 of the varied dictionary properties, δf, T1, T2 and Γ, while the other 3 properties are held constant. During the first 900 frames of the qRF-MRF method, changes in the shape of signal evolutions due to each property of δf, T1, and T2 are apparent. This is expected, as the FA, TR, and PH scheme in these frames are identical to bSSFP-MRF. However, only subtle differences can be observed due to variations of the Γ property. Starting from the 901st frame, a different scheme of low FA, constant TR, and quadratic PH starts. During these acquisition blocks, substantial signal shape variations can be observed due to δf, T2, and Γ properties. As shown in Figure 3A, the frames with high signal during qRF blocks depends on δf value. Despite the signal now arising from the sum of a distribution of δf values, high signal frames are still band-dependent. Changes in T1 (Figure 3B) during qRF blocks are not as apparent as changes during bSSFP blocks. Changes in T2*, either by a decrease in T2 (Figure 3C) or increase in Γ value (Figure 3D), result in blunting of high-amplitude signal response during qRF blocks due to the dephasing.
FIGURE 3.
Sets of representative dictionary entries. In each plot, only 1 of the 4 matched dictionary properties is varied (color bar), whereas the remaining 3 are fixed (values shown in insets). The 4 matched dictionary properties are δf (A), T1 (B), T2 (C), and intravoxel frequency dispersion Γ (D)
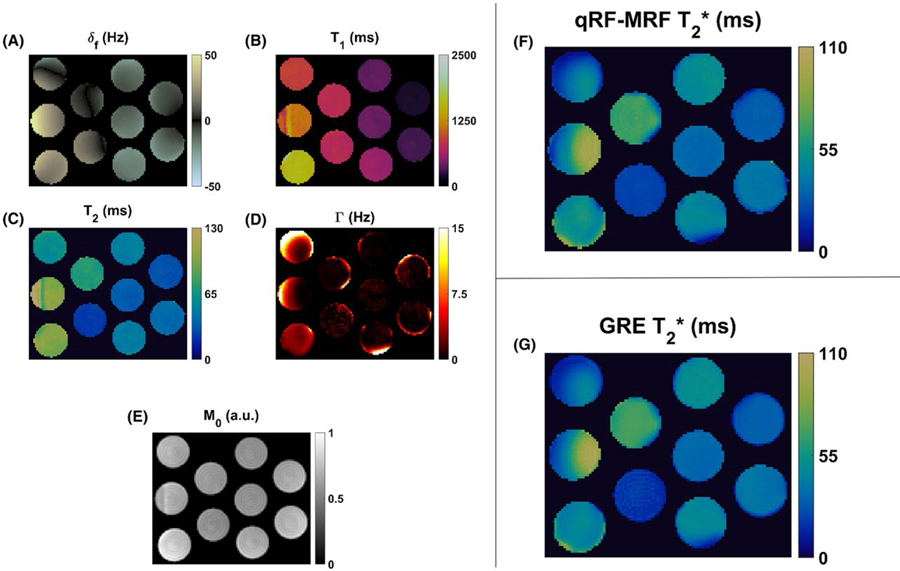
Figure 4 shows the quantitative maps from phantom experiments. Figure 4A–E displays the maps obtained directly through the qRF-MRF dictionary-matching process. The δf map, shown in Figure 4A, shows substantial variation across the imaging FOV due to in-plane B0 field inhomogeneity. For most phantom compartments, the δf variation was restricted between ±40 Hz. For these phantom compartments, T1 and T2 maps showed homogenous quantification. Pixels that mapped to +40 Hz in δf also showed errors in T1 and T2 quantification. This is due to the null-band behavior of bands for ±40 Hz during bSSFP acquisition blocks. The Γ maps were smooth within phantom compartments, but differed in spatial distribution as compared with T1, T2, or δf maps. The Γ in compositionally homogenous phantoms primarily represented the summed effects of in-plane and through-plane B0 field inhomogeneity. The edges of phantom compartments, in which susceptibility differences near air interfaces can be expected to introduce intravoxel frequency variation, mapped to large matched Γ values. Relative M0 maps calculated from the ratio between measured and matched signal evolutions are shown in Figure 4E. The relative M0 map was smooth with the exception of pixels with propagated T1 and T2 errors at +40 Hz δf. Figure 4F shows the corresponding T2* map. The reference multi-echo GRE T2* map is shown in Figure 4G. The CCC between qRF-MRF-measured and GRE-measured T2* maps was 0.90.
FIGURE 4.
Values of δf (A), T1 (B), T2 (C), Γ (D), and relative M0 (E) are shown for phantom with varied concentrations of gadopentate dimeglumine and agarose generated using qRF-MRF. The resulting qRF-MRF T2* map (F) shown was derived from T2 and Γ maps using Eq. (7). The comparison multi-echo gradient-echo (GRE) quantified T2* map (G) is also shown
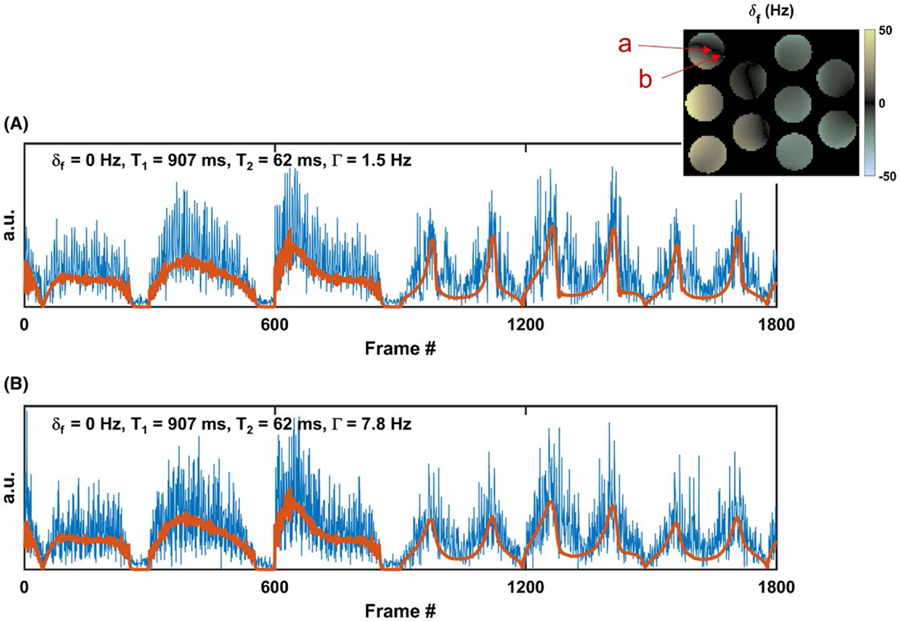
Figure 5 shows two example signal evolutions from the phantom experiment with superimposed corresponding matched fingerprints. Both signal evolutions originated from pixels within the same compartment. Dictionary matching of both signals obtained the same δf, T1, and T2 values but different Γ values, and thus different T2* values, due to local variations in intravoxel B0 field homogeneity. High-amplitude noise-appearing undersampling artifacts are apparent within the measured signal evolutions. However, the matching process was still able to recognize the best matching dictionary shape and extract the corresponding δf, T1, T2, and Γ properties.
FIGURE 5.
Example undersampled time-frame data, with best matching dictionary entries, from two pixels originating within the same homogenous phantom compartment shown in Figure 4 ( δf subfigure reproduced in inset). Differences in underlying signal shapes represent differences primarily caused by local field homogeneity within pixels. Property values extracted from the best dictionary matches are shown in inset
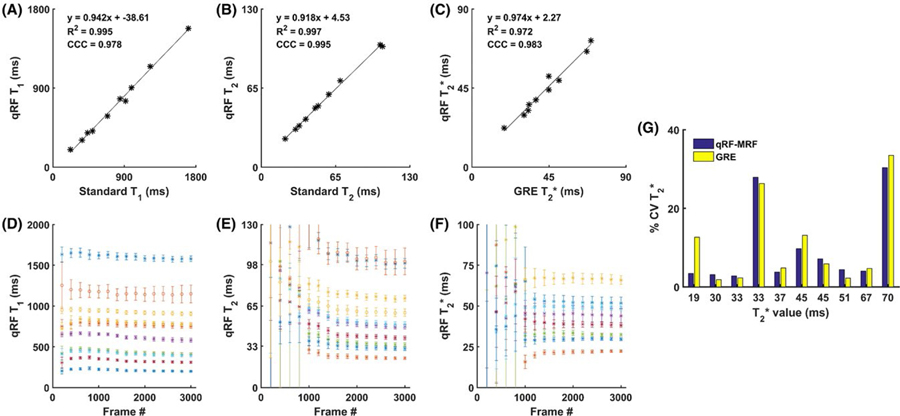
Figure 6A–C shows the correlation of quantified T1, T2, and T2* values obtained using all 3000 frames qRF-MRF against standard spin-echo and GRE methods, along with their corresponding linear regression, R2 coefficient of determination, and concordance correlation results. Figure 6D–F shows the mean and SD of quantified T1, T2, and T2* values according to the number of frames used in the matching process. Quantification of T1 required fewer frames than T2 and T2* to accurately quantify. Dictionary matching using less than 900 frames, before the qRF acquisition blocks, showed unreliable T2 and T2* quantification. After the 900th frame, the SD of the T2 and T2* measurements decreased. Slight changes in the mean and SD of the quantification of T1, T2, and T2* values was observed as the number of frames increased. Coefficient of variation, defined as the ratio between the SD and the mean of the measurements, for T2* within each compartment is shown in Figure 6G. Due to differences in local B0 inhomogeneity between phantom compartments, the coefficient of variation between compartments varied considerably between compartments. However, within the same phantom compartment, the qRF-MRF and GRE methods showed comparable coefficient of variations, with the exception of the shortest T2* compartment. In this compartment, the TEs used for the GRE method insufficiently covered the T2* decay curve, which led to a variability in quantification.
FIGURE 6.
Accuracy and reproducibility of qRF-MRF. The values of T1 (A) and T2 (B) values were measured within each phantom compartment using qRF-MRF against spin-echo methods. The T2* (C) values were measured within each phantom compartment using qRF-MRF against the multi-echo GRE method. The mean and SD of T1 (D), T2 (E), and T2* (F) measured within each compartment are shown with increasing number of time frames used during the dictionary-matching process. G, Coefficient of variation given by the SD divided by the mean, for T2* measurement for both qRF-MRF and GRE methods against the GRE-measured mean T2* value. The 2 compartments with large CV variation caused by poor local field homogeneity were excluded from (F) and plotted using circle markers in (D) and (E). Abbreviations: CCC, concordance correlation coefficient; CV, coefficient of variation
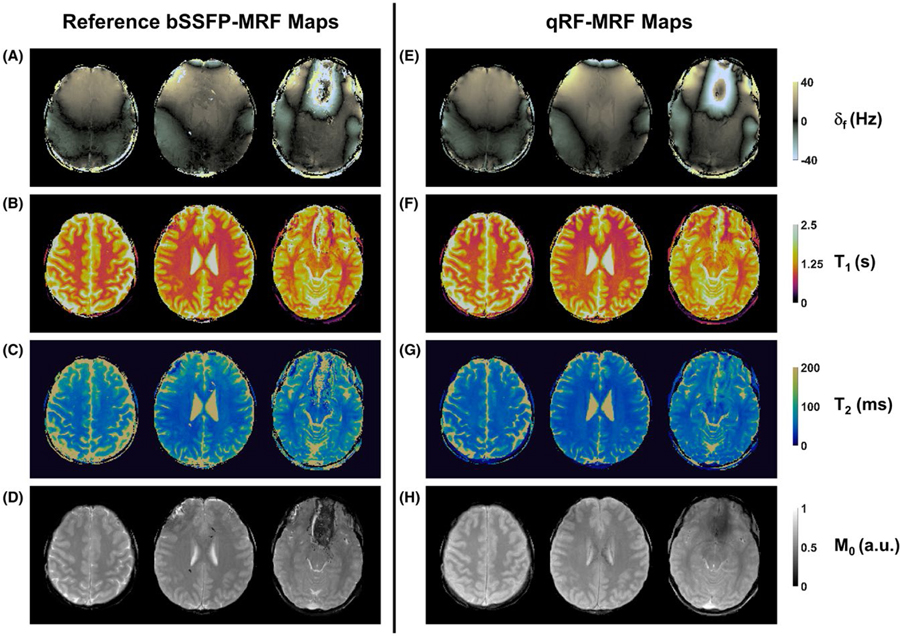
Figure 7 shows representative reference bSSFP-MRF and qRF-MRF maps acquired in vivo. Visually, the qRF-MRF quantitative maps agreed well with maps from comparison bSSFP-MRF. The δf maps obtained using both qRF-MRF and bSSFP-MRF showed similar macroscopic B0 field distributions. Vessels were visible in δf maps obtained by both bSSFP-MRF and qRF-MRF. Compared with bSSFP-MRF, the qRF-MRF δf map showed smoother matching results. Similar to phantom experiments, errors in T1 and T2 can be observed in pixels at ±40 Hz δf in both qRF-MRF and bSSFP-MRF methods. The CCCs between the shown bSSFP-MRF and qRF-MRF maps were 0.45 ± 0.11, 0.89 ± 0.03, and 0.60 ± 0.05 for δf, T1, and T2 properties, respectively. The CCC between all bSSFP-MRF and qRF-MRF maps was 0.35 ± 0.13, 0.83 ± 0.06, and 0.53 ± 0.11 for δf, T1 and T2 properties, respectively.
FIGURE 7.
Representative in vivo tissue property maps. Maps were acquired using both reference (left) and the qRF-MRF method (right) in healthy volunteers. Reference maps for δf (A), T1 (B), T2 (C), and relative M0 (D) were generated using the bSSFP-MRF method with the same number of time frames as the qRF-MRF method. The qRF-MRF method simultaneously generated δf (E), T1 (F), T2 (G), and relative M0 (H) maps are shown using the same scale as references maps. The total acquisition time for each scan was 38 seconds and 35 seconds per slice for each bSSFP-MRF and qRF-MRF scan, respectively
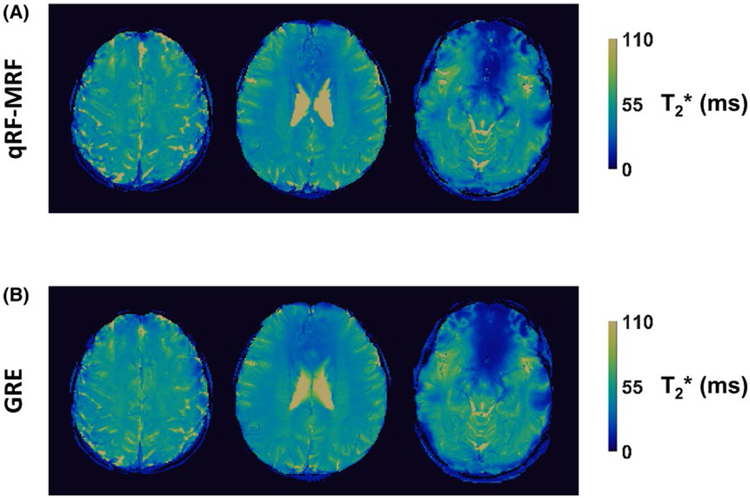
Figure 8 shows the qRF-MRF quantified T2* maps, corresponding to the same images as in Figure 7, above their respective GRE T2* maps. Vessels are visible in T2* maps obtained by both GRE and qRF-MRF, due to the paramagnetic properties of iron in blood. The CCCs between the qRF-MRF and GRE-estimated T2* maps was 0.82 ± 0.06 for the shown maps, and 0.77 ± 0.11 across all maps. The simultaneously acquired δf, T1, T2, relative M0, and T2* maps by qRF-MRF alongside the corresponding reference method acquired maps can be seen in Supporting Information Figure S1. Results of the region of interest analysis for in vivo δf, T1, T2, and T2* values are listed in Table 1.
FIGURE 8.
Representative in vivo T2* maps. The qRF-MRF T2* maps (A), generated simultaneously with other tissue property maps shown in Figure 7, are shown above their corresponding multi-echo GRE-measured reference T2* map (B). The GRE maps were acquired in 51 seconds each
TABLE 1.
Region of interest analysis for in vivo T1, T2, and T2* values
| qRF-MRF | Reference methoda | Literature10,13,45–48 | ||
|---|---|---|---|---|
| White matter (ms) | T1 | 988 ± 66 | 917 ± 60 | ~690–1100 |
| T2 | 44 ± 4 | 42 ± 5 | ~56–80 | |
| T2* | 43 ± 4 | 46 ± 7 | ~45–48 | |
| Gray matter (ms) | T1 | 1395 ± 227 | 1210 ± 351 | ~1286–1393 |
| T2 | 63 ± 10 | 76 ± 9 | ~78–117 | |
| T2* | 51 ± 9 | 49 ± 10 | ~42–52 | |
| Substantia nigra (ms) | T1 | 1081 ± 69 | 978 ± 130 | 1147 |
| T2 | 34 ± 2 | 38 ± 7 | ~42–47 | |
| T2* | 25 ± 5 | 26 ± 6 | ~22–28 | |
| Red nucleus (ms) | T1 | 1057 ± 97 | 958 ± 156 | |
| T2 | 39 ± 6 | 42 ± 8 | ~46–48 | |
| T2* | 32 ± 6 | 31 ± 6 | ~24–31 |
Measured using bSSFP-MRF for T1 and T2 multi-echo GRE for T2*.
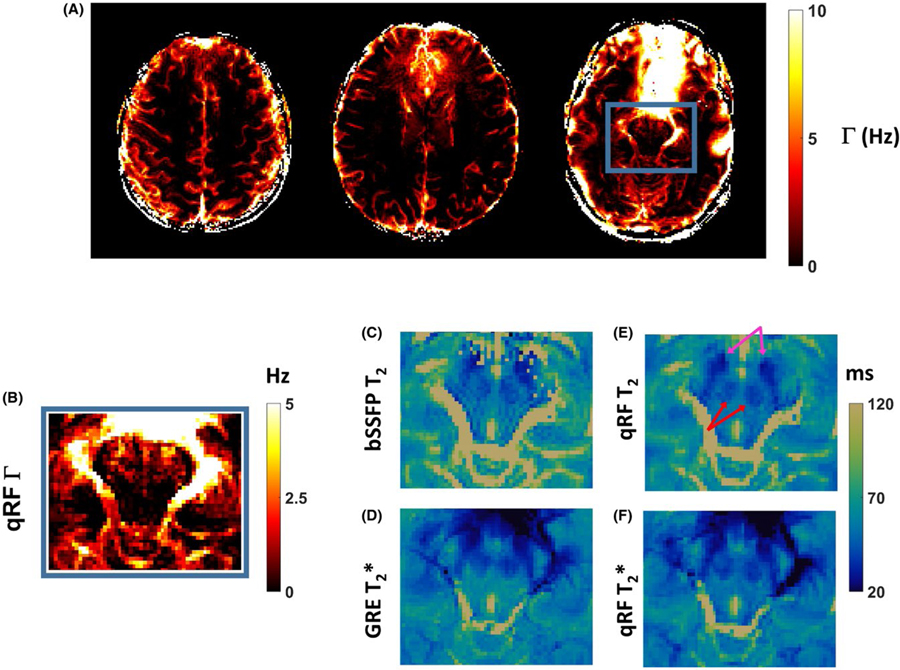
Quantitative Γ maps are shown in Figure 9A. Anatomical regions near air–tissue interfaces exhibited large Γ values. Blood vessels exhibited moderate Γ values. A zoomed-in Γ map of axial slice through midbrain structures is shown in Figure 9B. The corresponding T2 and T2* maps are reproduced in Figure 9C–F using a shared scale and color map. Higher Γ values and decreased T2 and T2* values within substantia nigra and red nucleus can be observed, due to higher tissue iron content within these tissues. The contrast of fine structures was preserved between qRF-MRF and reference maps.
FIGURE 9.
A, The Γ maps acquired using the qRF-MRF method from the same experiments shown in Figures 7 and 8. B, Zoomed-in FOV of the Γ map to the midbrain structures. C,D, Corresponding zoomed maps from reference T2 (C) and T2* (D) maps. E-F, Corresponding zoomed maps from qRF-MRF-acquired T2 (E) and T2* (F) methods. The same scale and color map used for the T2 and T2* maps are shown. The lower T2 value associated with substantia nigra (pink arrows) and red nucleus (red arrows) can be observed across all methods for both T2 and T2* values
5 |. DISCUSSION
In this work, the proposed qRF-MRF method allowed the simultaneous quantification of δf, T1, and T2* tissue properties in 35 seconds per slice. The accuracy of the method was demonstrated in a phantom and in healthy volunteers. The ability to rapidly, robustly, and simultaneously quantify δf, T1, T2, relative M0, and T2* properties has many potential applications. For instance, through the knowledge of δf, T1, T2* and relative M0 properties, synthetic SWI30 may be possible, alongside synthetic T1-weighted and T2-weighted images that require knowledge of T1, T2, and relative M0 properties. Another application lies in improving contrast agent sensitivity. Because MR contrast agents typically induce changes in multiple tissue T1, T2 and T′2 properties, simultaneous detection of these properties may be able improve accuracy in contrast agents’ detection and quantification.31 Mapping of T2 and T2* tissue properties within midbrain structures may also enhance tissue iron quantification. This may lead to the increased capacity to diagnose and monitor the diseases that are known to accumulate iron in these structures. However, the potential of the proposed qRF-MRF method for each of these applications must still be demonstrated.
The unique signal evolution that develops during qRF acquisition blocks has several beneficial properties for tissue property quantification. With respect to the components of T2* quantification, the imaging frames with highest SNR also have the highest T2 and Γ sensitivity. Additionally, qRF-MRF appeared to quantify δf more robustly as compared with bSSFP-MRF. Both in the current and previous32 works, bSSFP-MRF, using direct pattern matching, was observed to be susceptible to locally discontinuous δf quantification errors. These errors had the potential to propagate to errors in T1 and T2 quantification. The qRF-MRF method appears to be more robust to this type of error.
Previously, a Cartesian EPI readout-based MRF method (MRF-EPI) was proposed for simultaneous measurement of T1 and T2* tissue properties.33 The MRF-EPI method differed substantially from the current method in the use of a series of parallel imaging-based single-shot readouts with spoiled GRE acquisitions using variable FA, TE, and TR to generate image series that were sensitive to T1 and T2* values. Although the MRF-EPI method quantified relatively fewer tissue properties using a lower resolution and matrix size, MRF-EPI only required 10 seconds per slice. Future studies may seek to combine the approach of MRF-EPI with the current proposed method to further enhance robustness and speed of T2* quantification.
Currently, the underlying frequency dispersion distribution during the dictionary-generation process was limited to Lorentzian shapes. This choice was made because simulation of a multi-echo GRE experiment would produce the consistent mono-exponential decay signal behavior assumed during GRE quantification. This assumption may not be accurate or appropriate in various situations. For instance, white matter has been shown to have a myelin signal component with both distinct rapid T2* relaxation and substantial frequency shift.34 Incorporation of the underlying causes of tissue-susceptibility differences due to vessel geometry or myelin into the signal model has previously been shown to enable potential quantification of these properties.16,17,35 The qRF-MRF method may be sensitive to these properties as well. Although modeling these additional properties would result in an exponentially larger dictionary size, compression methods have been developed that may enable exploring this potential in the future.36–39
Several limitations remain in the proposed method. The first 900 frames of bSSFP-MRF were maintained at the beginning of the qRF-MRF acquisition. This was done because simulations showed decreased signal-shape differences with respect to changes in T1 during qRF blocks as compared with bSSFP blocks. However, as a result of these high FA bSSFP blocks, the current qRF-MRF method was still susceptible to banding artifacts near ±40 Hz, coinciding with the off-resonance position of the bands during the first 900 frames, as shown in Figure 2D. Examples of these artifacts can clearly be seen in the phantom results (Figure 4B–D) corresponding to pixels with off-resonance value near 40 Hz (Figure 4A). Alternative banding-free schemes with sensitivity for T1, such as FISP-MRF,13 will be investigated in the future.
Another limitation of qRF blocks was the relative temporal sparseness of qRF-MRF signals as compared with bSSFP-MRF signals. The choices used in the current method were selected to increase incoherence of aliasing artifacts with respect to the signal evolution. The assessment of the number of frames necessary for accurate tissue-property measurements suggested that after approximately 2000 frames, accuracy of T1, T2, and T2* quantification largely stabilized. However, matching precision improved up through the complete 3000 frames. Further improvements to accuracy and robustness may be made by optimizations to the acquisition parameters (FA, TR, and PH choices) or property estimation method, such as by adopting an iterative reconstruction method,32,40–42 which may improve robustness to aliasing artifacts. These kinds of improvements would enable further reduction in acquisition time, by reducing the number of frames necessary for robust quantification.
Like all quantitative methods, property estimation depends on the accuracy of the underlying signal model. Although qRF-MRF quantification of T1, T2, and T2* properties in phantom was shown to be accurate, several discrepancies appeared during in vivo experiments. Gray and white matter T2 was consistently lower, as measured through qRF-MRF, as compared with both reference bSSFP and literature values. However, T2* measurements in the same regions agreed well with the reference and literature values. Because T2* is directly derived from quantified T2 and Γ values, this suggests a corresponding underestimation of Γ values in gray and white matter. In one literature study, reports for R2′ values (theoretically related to Γ by scaled factor of π) varied from 2.7 s–1 to 3.5 s–1 for gray matter, and 2.8 s–1 to 4.3 s–1 for white matter, depending on the quantification method used.43 Although none of the literature quantification methods can be considered a gold standard, the reported values appear to be consistent with an underestimation of Γ in gray and white matter in the current work. Several reasons may explain the accurate T2* measurement yet biased T2 and Γ measurements in vivo, which are not present in phantom experiments such as magnetization transfer effects.44 Flow is another possible explanation, as none of the gradients used in the current method were flow compensated. Fresh spins flowing into the imaging plane likely have an additional effect on measured signal evolutions. Given that T2 and Γ represent the irreversible and reversible components of signal decay, respectively, it is also likely that many other “irreversible” effects in vivo that are not currently in the signal model, including diffusion, motion, magnetization transfer, or eddy current effects, may manifest preferentially as an apparent shortening in T2 value. These considerations are topics of careful future evaluation.
6 |. CONCLUSIONS
In this work, we proposed a novel MR method, developed within the MRF framework, that can be used to simultaneously quantify δf, T1, T2, and T2* properties. Using the flexibility of MRF experiment design, a quadratic RF phase was incorporated in a novel scheme to develop transient signals with high amplitude and a frequency-dependent phase. As a result, signals become uniquely sensitive to intravoxel susceptibility-induced field variation. Combined with Bloch equation-based template-matching approaches, intravoxel field variation can be estimated from measured signals, alongside other tissue properties. Accurate quantification of T1, T2, and T2* tissue properties was achieved in phantom experiments at the current pixel sizes in 35 seconds per slice. In vivo experiments showed robust and artifact-free property maps, with good agreement in T2* quantification with the gold-standard multi-echo GRE method.
Supplementary Material
FIGURE S1 Representative in vivo tissue property maps. Tissue property maps shown in figures 7 and 8 are shown together here for ease of visualization and comparison. Reference bSSFP-MRF maps (a-d) and GRE method (e) show good visual agreement with acquired qRF-MRF maps (f-j) in volunteers. Total acquisition time per 2D slice for each scan was 38, 51 and 35 sec per slice for each bSSFP-MRF, GRE, and qRF-MRF scan, respectively.
ACKNOWLEDGMENTS
This work made use of the High-Performance Computing Resource in the Core Facility for Advanced Research Computing at Case Western Reserve University.
Funding information
National Institute of Health (F30-HL124894, R01-EB017219, R01-DK098503, R01-EB016728, R01-EB023704, R01-HL073315, R01-HL094557, R21-HL126215, TL1-TR000441, and T32-EB007509) and Siemens Healthineers
Footnotes
CONFLICT OF INTEREST
The authors receive research support from Siemens Healthineers.
REFERENCES
- 1.Gerlach M, Ben-Shachar D, Riederer P, Youdim M. Altered brain metabolism of iron as a cause of neurodegenerative diseases? J Neurochem. 2002;63:793–807. [DOI] [PubMed] [Google Scholar]
- 2.Riederer P, Sofic E, Rausch WD, et al. Transition metals, ferritin, glutathione, and ascorbic acid in parkinsonian brains. J Neurochem. 1989;52:515–520. [DOI] [PubMed] [Google Scholar]
- 3.Chen JC, Hardy PA, Kucharczyk W, et al. MR of human postmortem brain tissue: correlative study between T2 and assays of iron and ferritin in Parkinson and Huntington disease. AJNR Am J Neuroradiol. 1993;14:275–281. [PMC free article] [PubMed] [Google Scholar]
- 4.Dexter DT, Carayon A, Javoy-Agid F, et al. Alterations in the levels of iron, ferritin and other trace metals in Parkinson’s disease and other neurodegenerative diseases affecting the basal ganglia. Brain. 1991;114(Pt 4):1953–1975. [DOI] [PubMed] [Google Scholar]
- 5.Connor JR, Snyder BS, Beard JL, Fine RE, Mufson EJ. Regional distribution of iron and iron-regulatory proteins in the brain in aging and Alzheimer’s disease. J Neurosci Res. 1992;31:327–335. [DOI] [PubMed] [Google Scholar]
- 6.Cornett CR, Markesbery WR, Ehmann WD. Imbalances of trace elements related to oxidative damage in Alzheimer’s disease brain. Neurotoxicology. 1998;19:339–345. [PubMed] [Google Scholar]
- 7.Kirk P, He T, Anderson LJ, et al. International reproducibility of single breathhold T2* MR for cardiac and liver iron assessment among five thalassemia centers. J Magn Reson Imaging. 2010;32:315–319. [DOI] [PMC free article] [PubMed] [Google Scholar]
- 8.Lota AS, Gatehouse PD, Mohiaddin RH. T2 mapping and T2* imaging in heart failure. Heart Fail Rev. 2017;22:431–440. [DOI] [PMC free article] [PubMed] [Google Scholar]
- 9.Bin NH, Song IC, Hyeon T. Inorganic nanoparticles for MRI contrast agents. Adv Mater. 2009;21:2133–2148. [Google Scholar]
- 10.Gelman N, Gorell JM, Barker PB, et al. MR imaging of human brain at 3.0 T: preliminary report on transverse relaxation rates and relation to estimated iron content. Radiology. 1999;210:759–767. [DOI] [PubMed] [Google Scholar]
- 11.Ma J, Wehrli FW. Method for image-based measurement of the reversible and irreversible contribution to the transverse-relaxation rate. J Magn Reson B. 1996;111:61–69. [DOI] [PubMed] [Google Scholar]
- 12.Ma D, Gulani V, Seiberlich N, et al. Magnetic resonance fingerprinting. Nature. 2013;495:187–192. [DOI] [PMC free article] [PubMed] [Google Scholar]
- 13.Jiang Y, Ma D, Seiberlich N, Gulani V, Griswold MA. MR fingerprinting using fast imaging with steady state precession (FISP) with spiral readout. Magn Reson Med. 2015;74:1621–1631. [DOI] [PMC free article] [PubMed] [Google Scholar]
- 14.Hamilton JI, Jiang Y, Chen Y, et al. MR fingerprinting for rapid quantification of myocardial T1, T2, and proton spin density. Magn Reson Med. 2017;77:1446–1458. [DOI] [PMC free article] [PubMed] [Google Scholar]
- 15.Chen Y, Jiang Y, Pahwa S, et al. MR fingerprinting for rapid quantitative abdominal imaging. Radiology. 2016;279:278–286. [DOI] [PMC free article] [PubMed] [Google Scholar]
- 16.Christen T, Pannetier NA, Ni WW, et al. MR vascular fingerprinting: a new approach to compute cerebral blood volume, mean vessel radius, and oxygenation maps in the human brain. NeuroImage. 2014;89:262–270. [DOI] [PMC free article] [PubMed] [Google Scholar]
- 17.Lemasson B, Pannetier N, Coquery N, et al. MR vascular fingerprinting in stroke and brain tumors models. Sci Rep. 2016;6:37071. [DOI] [PMC free article] [PubMed] [Google Scholar]
- 18.Assländer J, Glaser SJ, Hennig J. Pseudo steady-state free precession for MR-fingerprinting. Magn Reson Med. 2017;77:1151–1161. [DOI] [PubMed] [Google Scholar]
- 19.Scheffler K, Hennig J. Is TrueFISP a gradient-echo or a spin-echo sequence? Magn Reson Med. 2003;49:395–397. [DOI] [PubMed] [Google Scholar]
- 20.Gloor M, Scheffler K, Bieri O. Balanced SSFP. 2008;700:691–700. [DOI] [PubMed] [Google Scholar]
- 21.Miller KL, Hargreaves BA, Lee J, Ress D, DeCharms RC, Pauly JM. Functional brain imaging using a blood oxygenation sensitive steady state. Magn Reson Med. 2003;50:675–683. [DOI] [PubMed] [Google Scholar]
- 22.Lee JH, Hargreaves BA, Hu BS, Nishimura DG. Fast 3D imaging using variable-density spiral trajectories with applications to limb perfusion. Magn Reson Med. 2003;50:1276–1285. [DOI] [PubMed] [Google Scholar]
- 23.Ma D, Coppo S, Chen Y, et al. Slice profile and B1 corrections in 2D magnetic resonance fingerprinting. Magn Reson Med. 2017;78:1781–1789. [DOI] [PMC free article] [PubMed] [Google Scholar]
- 24.Lin LI. A concordance correlation coefficient to evaluate reproducibility. Biometrics. 1989;45:255–268. [PubMed] [Google Scholar]
- 25.Badve C, Yu A, Rogers M, et al. Simultaneous T1 and T2 brain relaxometry in asymptomatic volunteers using magnetic resonance fingerprinting. Tomogr J Imaging Res. 2015;1:136–144. [DOI] [PMC free article] [PubMed] [Google Scholar]
- 26.Fessler JA, Sutton BP. Nonuniform fast fourier transforms using min-max interpolation. IEEE Trans Signal Process. 2003;51:560–574. [Google Scholar]
- 27.Duyn JH, Yang Y, Frank JA, van der Veen JW. Simple correction method for k-space trajectory deviations in MRI. J Magn Reson. 1998;132:150–153. [DOI] [PubMed] [Google Scholar]
- 28.Walsh DO, Gmitro AF, Marcellin MW. Adaptive reconstruction of phased array MR imagery. Magn Reson Med. 2000;43:682–690. [DOI] [PubMed] [Google Scholar]
- 29.Griswold M, Walsh D, Heidemann RM, Haase A, Jakob P. The use of an adaptive reconstruction for array coil sensitivity mapping and intensity normalization. In: Proceedings from the 10th Annual Meeting of ISMRM, Denver, CO; 2002: 2410. [Google Scholar]
- 30.Haacke EM, Mittal S, Wu Z, Neelavalli J, Cheng Y-CN. Susceptibility-weighted imaging: technical aspects and clinical applications, part 1. AJNR Am J Neuroradiol. 2009;30:19–30. [DOI] [PMC free article] [PubMed] [Google Scholar]
- 31.Anderson CE, Donnola SB, Jiang Y, et al. Dual contrast-magnetic resonance fingerprinting (DC-MRF): a platform for simultaneous quantification of multiple MRI contrast agents. Sci Rep. 2017;7:8431. [DOI] [PMC free article] [PubMed] [Google Scholar]
- 32.Pierre EY, Ma D, Chen Y, Badve C, Griswold MA. Multiscale reconstruction for MR fingerprinting. Magn Reson Med. 2016;75:2481–2492. [DOI] [PMC free article] [PubMed] [Google Scholar]
- 33.Rieger B, Zimmer F, Zapp J, Weingärtner S, Schad LR. Magnetic resonance fingerprinting using echo-planar imaging: joint quantification of T1 and T2* relaxation times. Magn Reson Med. 2017;78:1724–1733. [DOI] [PubMed] [Google Scholar]
- 34.van Gelderen P, de Zwart JA, Lee J, Sati P, Reich DS, Duyn JH. Nonexponential T2* decay in white matter. Magn Reson Med. 2012;67:110–117. [DOI] [PMC free article] [PubMed] [Google Scholar]
- 35.Miller KL, Smith SM, Jezzard P. Asymmetries of the balanced SSFP profile. Part II: White matter. Magn Reson Med. 2010;63:396–406. [DOI] [PubMed] [Google Scholar]
- 36.Cauley SF, Setsompop K, Ma D, et al. Fast group matching for MR fingerprinting reconstruction. Magn Reson Med. 2015;74:523–528. [DOI] [PMC free article] [PubMed] [Google Scholar]
- 37.Ma D, Jiang Y, Chen Y, et al. Fast 3D magnetic resonance fingerprinting for a whole-brain coverage. Magn Reson Med. 2018;79:2190–2197. [DOI] [PMC free article] [PubMed] [Google Scholar]
- 38.McGivney DF, Pierre E, Ma D, et al. SVD compression for magnetic resonance fingerprinting in the time domain. IEEE Trans Med Imaging. 2014;33:2311–2322. [DOI] [PMC free article] [PubMed] [Google Scholar]
- 39.Yang M, Ma D, Jiang Y, et al. Low rank approximation methods for MR fingerprinting with large scale dictionaries. Magn Reson Med. 2018;79:2392–2400. [DOI] [PMC free article] [PubMed] [Google Scholar]
- 40.Mazor G, Weizman L, Tal A, Eldar YC. Low rank magnetic resonance fingerprinting. In: Proceedings from the 38th Annual International Conference of the IEEE Engineering in Medicine and Biology Society, Orlando, FL; 2016: 439–442. [DOI] [PubMed] [Google Scholar]
- 41.Doneva M, Amthor T, Koken P, Sommer K, Börnert P. Matrix completion-based reconstruction for undersampled magnetic resonance fingerprinting data. Magn Reson Imaging. 2017;41:41–52. [DOI] [PubMed] [Google Scholar]
- 42.Cline CC, Chen X, Mailhe B, et al. AIR-MRF: accelerated iterative reconstruction for magnetic resonance fingerprinting. Magn Reson Imaging. 2017;41:29–40. [DOI] [PubMed] [Google Scholar]
- 43.Ni W, Christen T, Zun Z, Zaharchuk G. Comparison of R2’ measurement methods in the normal brain at 3 Tesla. Magn Reson Med. 2015;73:1228–1236. [DOI] [PMC free article] [PubMed] [Google Scholar]
- 44.Bieri O, Scheffler K. On the origin of apparent low tissue signals in balanced SSFP. Magn Reson Med. 2006;56:1067–1074. [DOI] [PubMed] [Google Scholar]
- 45.Hasan KM, Walimuni IS, Kramer LA, Narayana PA. Human brain iron mapping using atlas-based T2 relaxometry. Magn Reson Med. 2012;67:731–739. [DOI] [PMC free article] [PubMed] [Google Scholar]
- 46.Wansapura JP, Holland SK, Dunn RS, Ball WS. NMR relaxation times in the human brain at 3.0 tesla. J Magn Reson Imaging. 1999;9:531–538. [DOI] [PubMed] [Google Scholar]
- 47.Gelman N, Ewing JR, Gorell JM, Spickler EM, Solomon EG. Interregional variation of longitudinal relaxation rates in human brain at 3.0 T: relation to estimated iron and water contents. Magn Reson Med. 2001;45:71–79. [DOI] [PubMed] [Google Scholar]
- 48.Stikov N, Boudreau M, Levesque IR, Tardif CL, Barral JK, Pike GB. On the accuracy of T 1 mapping: searching for common ground. Magn Reson Med. 2015;73:514–522. [DOI] [PubMed] [Google Scholar]
Associated Data
This section collects any data citations, data availability statements, or supplementary materials included in this article.
Supplementary Materials
FIGURE S1 Representative in vivo tissue property maps. Tissue property maps shown in figures 7 and 8 are shown together here for ease of visualization and comparison. Reference bSSFP-MRF maps (a-d) and GRE method (e) show good visual agreement with acquired qRF-MRF maps (f-j) in volunteers. Total acquisition time per 2D slice for each scan was 38, 51 and 35 sec per slice for each bSSFP-MRF, GRE, and qRF-MRF scan, respectively.


