

Abstract
The current research was undertaken to determine the existence and magnitude of P-glycoprotein (P-gp) expression on the blood ocular barriers by studying the ocular penetration of loperamide, a specific P-gp substrate, in P-gp (Mdr1a) knock-out (KO) and wild type (WT) Sprague Dawley rats. A clear, stable, sterile solution of loperamide (1 mg/mL), for intravenous administration, was formulated and evaluated. Ocular distribution was studied in P-gp KO and WT rats following intravenous administration of loperamide (at two doses). The drug levels in plasma, aqueous humor (AH) and vitreous humor (VH) samples were determined with the aid of UHPLC- Q-TOF-MS/MS and the AH/plasma (DAH) and VH/plasma (DVH) distribution ratios were estimated. Electroretinography (ERG), ultrastructural analyses and histology studies were carried out, in both KO and WT rats, to detect any drug induced functional and/or structural alterations in the retina. Dose-related loperamide levels were observed in the plasma of both WT and KO rats. The loperamide concentrations in the AH and VH of KO rats were significantly higher compared to that observed in the WT rats, at the lower dose. However, a marked increase in the DAH and DVH was noted in the KO rats. ERG, ultrastructure and histology studies did not indicate any drug induced toxic effects in the retina under the test conditions. The results from these studies demonstrate that P-gp blocks the penetration of loperamide into the ocular tissues from the systemic circulation and that the effect is more pronounced at lower plasma loperamide concentrations.
Keywords: Ocular distribution, Blood-ocular-barriers, P-glycoprotein, Electroretinography, Retinal pigmented epithelium
Introduction
The delivery of therapeutics into the deep ocular tissues via systemic route remains a challenge due to the presence of complex blood ocular barriers (BOB). The BOB comprises; blood-aqueous barrier (BAB), formed by the epithelial cells of the iris-ciliary bodies, and the blood-retinal barrier (BRB), made up of the endothelial cells of the retinal blood vessels and the retinal pigmented epithelium (RPE) (1–5). The tight-junction proteins and the efflux proteins present in the BAB and BRB protect the anterior and posterior segment ocular tissues by preventing the paracellular and/or transcellular transportation of endobiotics and xenobiotics (4–7).
In the recent past, numerous researchers have investigated the impact of efflux transporters on the permeability of hydrophobic drugs across various blood-organ barriers (1–3). In this regard, one of the most common efflux proteins often discussed is P-glycoprotein (P-gp), the major efflux protein of the ATP-binding cassette (ABC) transporters sub-family, that is widely expressed in many vital organs such as the brain, liver, lung and kidney, ensuring their safety through the efflux of chemical and biological toxic substances. The broad substrate specificity of P-gp accounts for a severe reduction in the blood to brain penetration of many lipophilic molecules (8–11).
Several investigators have reported the expression of P-gp on the ciliary epithelial cells at the BAB, and on the endothelial cells of the retinal blood vessels and the RPE of the BRB, in humans and various animal models (12–16). However, the specific involvement of P-gp in the blood-organ penetration of lipophilic agents remains ambiguous due to the presence of many influx transporters as well as efflux proteins in the blood-organ membrane barriers (12,17). The co-existence of several influx transporters, like organic cation/carnitine transporters, organic anionic transporters, organic cationic transporters, organic anionic transporter polypeptides and multidrug resistance associated efflux proteins in the BOB confounds delineation of the contribution of P-gp in hindering the blood-ocular transport of drugs (12,18–20).
The application of multidrug resistance Mdr1a gene, responsible for P-gp expression, knock-out (KO) mice, and recently rat models, have gained importance in delineating the P-gp mediated efflux, and its effect on pharmacokinetics of drug substrates (21,22). Numerous literature reports have discussed the use of transgenic mice models lacking the Mdr1a gene (P-gp KO) as a powerful tool in unlocking the complexity and the role of P-gp at the blood brain barrier (BBB), protecting the brain through the efflux of various exogenous and endogenous agents (21,23). The utilization of Mdr1a gene KO mice and/or rats, to determine the impact of P-gp at BOB, however, has remained largely unexplored.
Previously, using New Zealand albino rabbits, we reported the contribution of topically administered P-gp inhibitors in improving the blood-ocular penetration, and/or pharmacokinetics, of systemically and intravitreally administered substrates, confirming the role of P-gp in the distribution of drugs across the BOB (24,25). The goal of the current study was to determine the extent of the impact of P-gp’s barrier properties by studying the transport of loperamide, an established P-gp substrate, across the BOB of Mdr1a KO and wild type (WT) rats. It is necessary to rule out drug toxicity induced modifications in the retinal ultrastructure, which could affect the pharmacokinetic observations. Thus, electroretinography, histology and ultrastructural analyses of the retina were undertaken to unveil the toxic effects of loperamide in the eye, if any, by examining the retina for functional and structural alterations.
Materials and Methods
Animals.
Six to eight-week-old male WT and Mdr1a gene KO Sprague-Dawley (SD) rats were purchased from Horizon Discovery (Saint Louis, MO). The animals had free access to food and water. All animal experiments were performed according to the approved protocols of the University of Mississippi Institutional Animal Care and Use committee, the University of Tennessee Health Science Center Institutional Animal Care and Use committee and the Association for Research in Vision and Ophthalmology statement for the Use of Animals in Ophthalmic and Vision Research.
Chemical Reagents
Loperamide hydrochloride was procured from Sigma Aldrich (St. Louis, MO, USA). Propylene glycol (1,2-Propanediol) was purchased from Fisher Scientific (St. Louis, MO, USA). All other high purity chemicals and HPLC grade solvents were obtained from Fisher Scientific (St. Louis, MO, USA).
Drug solution preparation and evaluation.
A clear solution of 1mg /mL loperamide was prepared - an appropriate quantity of drug was added to a mixture of propylene glycol and saline (1:1 v/v) and then vortexed and sonicated until a clear solution was obtained. The formulation was evaluated for pH, assay, drug precipitation in phosphate buffer saline (pH 7.4), stability at room temperature and for loss during filtration across 0.22μm nylon filter (Millipore. USA).
Instrumentation and experimental conditions
Ultra-High Performance Liquid Chromatography-Mass Spectrometry (UHPLC/Q-TOF-MS):
The liquid chromatographic system was an Agilent Series 1290 comprising of the following modular components: binary pump, a vacuum solvent microdegasser, an autosampler with 100-well tray and a thermostatically controlled column compartment. Separation was achieved on an Agilent Zorbax SB C8 (2.1×100 mm, 1.8μ) column. The mobile phase consisted of water with 0.1 % formic acid (A) and acetonitrile with 0.1 % formic acid (B) at a flow rate of 0.23 mL/min, which were applied in the following gradient elution: 0 min, 80 % A: 20% B, in next 7 min to 100% B. Each run was followed by a 3 min wash with 100 % acetonitrile, and an equilibration period of 5 min. Two microliters of sample was injected. The column temperature was set at 35 °C.
The mass spectrometric analysis was performed with a Q-TOF-MS/MS (Model #G6530A, Agilent Technologies, Palo Alto, CA, USA) equipped with an ESI source with Jet Stream technology using the following parameters: drying gas (N2) flow rate, 10.0 L/min; drying gas temperature, 250 °C; nebulizer, 30 psig, sheath gas temperature, 350 °C; sheath gas flow, 9 L/min; capillary, 3000 V; skimmer, 65V; Oct RF V, 750V; fragmentor voltage, 125V. All the operations, acquisition and data analysis were controlled by Agilent MassHunter Acquisition Software Ver. A.05.00 and processed with MassHunter Qualitative Analysis Software Ver. B.07.00. Each sample was analyzed in positive mode in the range of m/z = 100–1000. Accurate mass measurements were obtained by means of reference ion correction using reference masses at m/z 121.0509 (protonated purine) and 922.0098 [protonated hexakis (1H, 1H, 3H-tetrafluoropropoxy) phosphazine or HP-921] in positive ion mode. The compounds were confirmed in each spectrum. For this purpose, the reference solution was introduced into the ESI source via a T-junction using an Agilent Series 1200 isocratic pump (Agilent Technologies, Santa Clara, CA, USA) using a 100:1 splitter set at a flow rate of 20 μL/min. In the positive ion mode, the protonated species [M+H]+ at m/z 477.2317 (calculated m/z 477.2303) for compound loperamide and m/z 531.1574 (calculated m/z 531.156) for internal standard (ketoconazole) were observed.
Sample Preparation
A suitable volume of 1 μg/mL ketoconazole solution was added to each tissue sample followed by the introduction of ice cold acetonitrile to extract drug and internal standard from the biological matrixes by complete precipitation of proteins. The samples were then vortexed and centrifuged at 13000 rpm for 15 min to collect the clear supernatant solution. The eluents in the supernatant solution (2 μL) were quantified using the analytical method described in the earlier section. The extraction efficiency (EE), limit of detection (LOD) and linearity of loperamide in plasma (10–160 ng/mL), AH (0.5–40 ng/mL) and VH (0.5–20 ng/mL) were assessed.
Ocular distribution
The impact of P-gp, at the BOB, on the ocular penetration of loperamide was estimated through ocular distribution studies in WT and KO rats. Since there was no indication in the literature that the expression of the transporters on the ocular tissues was gender dependent, male SD rats were selected for the study. A total of 48 rats were used in these studies (24 WT and 24 KO). Twelve of the WT and 12 of the KO rats were administered 0.5 mg/kg loperamide, while the other 24 (12 WT and 12 KO) were injected with a 1 mg/kg dose, through the tail vein. At the end of 60 and 120 min post dosing, six of the WT and/or KO rats from each group (n=6 at each time point) were anesthetized by an intraperitoneal (I.P.) administration of a combination of ketamine (35 mg/kg) and xylazine (3.5 mg/kg). Blood was collected via cardiac puncture. The animals were then euthanized using an excess combination dose of ketamine and xylazine through the I.P. route and the eyes were enucleated immediately, followed by the extraction of aqueous humor (AH) and vitreous humor (VH). The AH and VH collected from both eyes of each rat was pooled. The blood samples collected were immediately centrifuged at 10,000 rpm for 5 min and the plasma was separated. Plasma, AH and VH samples were stored at −80 °C until analysis.
Data Interpretation
Drug distribution into the AH and VH from plasma was calculated according to equations 1 & 2 respectively,
| (Eq. 1) |
| (Eq. 2) |
Where, DAH and DVH represents the distribution ratios delineating the penetration of loperamide from plasma into AH and VH, respectively.
The percentage contribution of P-gp in restricting the permeation of loperamide from blood into the ocular tissues was determined with the following equation (Eq. 3) (12).
| (Eq. 3) |
Wherein, the percentage contribution of P-gp is represented as % P-gp.
Electroretinography
The evaluation of drug incompatibility with the retinal tissues was investigated by employing electroretinography (ERG) recordings. The analysis was performed on 3 WT and KO SD rats from the same cohort. The ERG recording was collected before the administration of 0.5 mg/kg loperamide as well as at the end of 2 h, 1 day and 3 days, post-drug administration. Briefly, dark-adapted rats (overnight prior to commencement) were anesthetized with an I.P. injection of ketamine and xylazine combination. Gold ring electrodes of 2–3 mm diameter (Roland Consult, Stasche & Finger GmbH), were positioned on both corneas after anesthetizing them with topical 0.5% proparacaine hydrochloride followed by topical application of 1% tropicamide for pupil dilation. The stainless steel surgical needles were inserted subcutaneously into the forehead and back leg to serve as reference and ground electrodes respectively. The dark-adapted ERG responses were recorded from both the eyes simultaneously, exposing them to flashes of various intensities (from −4.0 Log units to 2.88 Log units) delivered by a Ganzfeld light source. The amplitudes of a- wave (relevant to photoreceptor functioning by light accommodation) and b-wave (relevant to bipolar and/or Müller cell functioning) of WT and KO rats obtained before dosing were considered as baseline to compare and find the differences in the amplitudes of a- and b- waves recorded by the end of 2 h, 1 day and 3 days after dosing. The deviations in the intensities of the amplitudes were reported as percentage changes of amplitude.
Morphological and Ultrastructural analyses
Morphological and ultrastructural analyses of the retina was performed, using standard protocols (26,27) in WT and KO SD rats, post drug administration, to assess the toxic effects of the drug on the structure of the retina. Briefly, after enucleation at the 120 min time-point, post-dosing, both eyes were fixed with a mixture of 2% paraformaldehyde and 2% glutaraldehyde in 0.1 M phosphate buffer for about 24h followed by embedding in Araldite/Embed812 (Electron Microscopy Sciences). One-micron sections were cut through the posterior pole of each eye, after aligning the anterior-posterior axis of the eye parallel to the cutting surface of the block. All tissue sections were stained with Toluidine Blue O and viewed on a Nikon Eclipse 800 microscope for the gross morphological changes in the retina, retinal epithelium (RPE) or choroid including changes in thickness of cell layers, chromatin condensation, etc., to select the areas of the RPE and/or around retinal blood vessels for ultrastructural analyses. The ultrathin sections of selected areas were examined for any structural changes in basolateral infoldings of the RPE or the lumen of retinal vasculature under JEOL JEM1200EX II electron microscope at high magnification.
Statistical analysis
The data obtained from ocular distribution and ERG studies were subjected to one-way analysis of variance (ANOVA) and Tukey’s post hoc HSD (GraphPad Software, San Diego California, USA), to estimate the statistical significance (p < 0.05) of the difference in the data between WT and KO rats.
Results
The drug solution (pH 7.0 ± 0.1), prepared in equal volumes of saline and propylene glycol, was clear, without any precipitation on standing, and showed 99.7% assay (drug content) due to the superior cosolvent properties of propylene glycol (28). The proportion of propylene glycol incorporated in the drug solution was within the limits mentioned in the inactive ingredients (IIG) database provided by US Food and Drug Administration (US-FDA), indicating the safety and biocompatibility of the formulation (29). A < 0.1% loss of drug was noted while passing the formulation through 0.22 μm nylon filter demonstrating the suitability of sterile filtration technique for the product. Moreover, precipitation was not observed upon addition of the drug solution to phosphate buffer saline (pH 7.4), ruling out the possibility of drug precipitation at the site of injection. The drug solution was observed to be stable, with ≤ 1% change in the assay, over a period of 60 days, at room temperature.
The bioanalytical method established for the quantification of loperamide was precise, accurate, sensitive enough with a limit of detection (LOD) of 0.1 ng/mL, and a limit of quantitation (LOQ) of 0.5 ng/mL in all the ocular tissues and showed good linearity, for the range of concentrations tested, with r2 values of 0.9942, 0.9903 and 0.9935 in plasma, AH and VH, respectively. Loperamide was extracted from all tissues using the protein precipitation technique, as reported earlier (30). Briefly, two parts of ice-cold acetonitrile was added to one part of plasma, AH or VH to precipitate the proteins efficiently, allowing good recovery (≥98%) from the tissue matrix. No interfering peaks were observed, demonstrating the specificity of the bioanalytical method. Significant variation in loperamide content was not seen in the samples stored at 4°C (98.4% recovery) versus freshly obtained samples (99.6% recovery), suggesting no drug loss on storage of samples under the refrigerated conditions.
Ocular distribution
Freshly prepared drug solution was utilized for the ocular distribution studies. The loperamide concentration determined in the plasma, AH and VH is represented in figures 1, 2 and 3, respectively. A dose related increase in the plasma drug levels was observed in both WT and KO rats. As the dose of loperamide was increased from 0.5 mg/kg to 1 mg/kg, 1.5 – 2.0-fold increase in the plasma drug concentrations was observed in both WT and KO rats, at the end of both 60 and 120 min (Fig. 1). The plasma drug concentrations were significantly different within the WT (only at 60 min) or KO (at 60 min or 120 min) models, administered with different doses of loperamide (p<0.05) (Fig. 1). Between the two models, although the plasma loperamide concentration in the KO rats was slightly higher compared to the WT rats, at the same dose and time-point, the difference was not statistically significant (Fig. 1) (p=0.067).
Fig. 1.
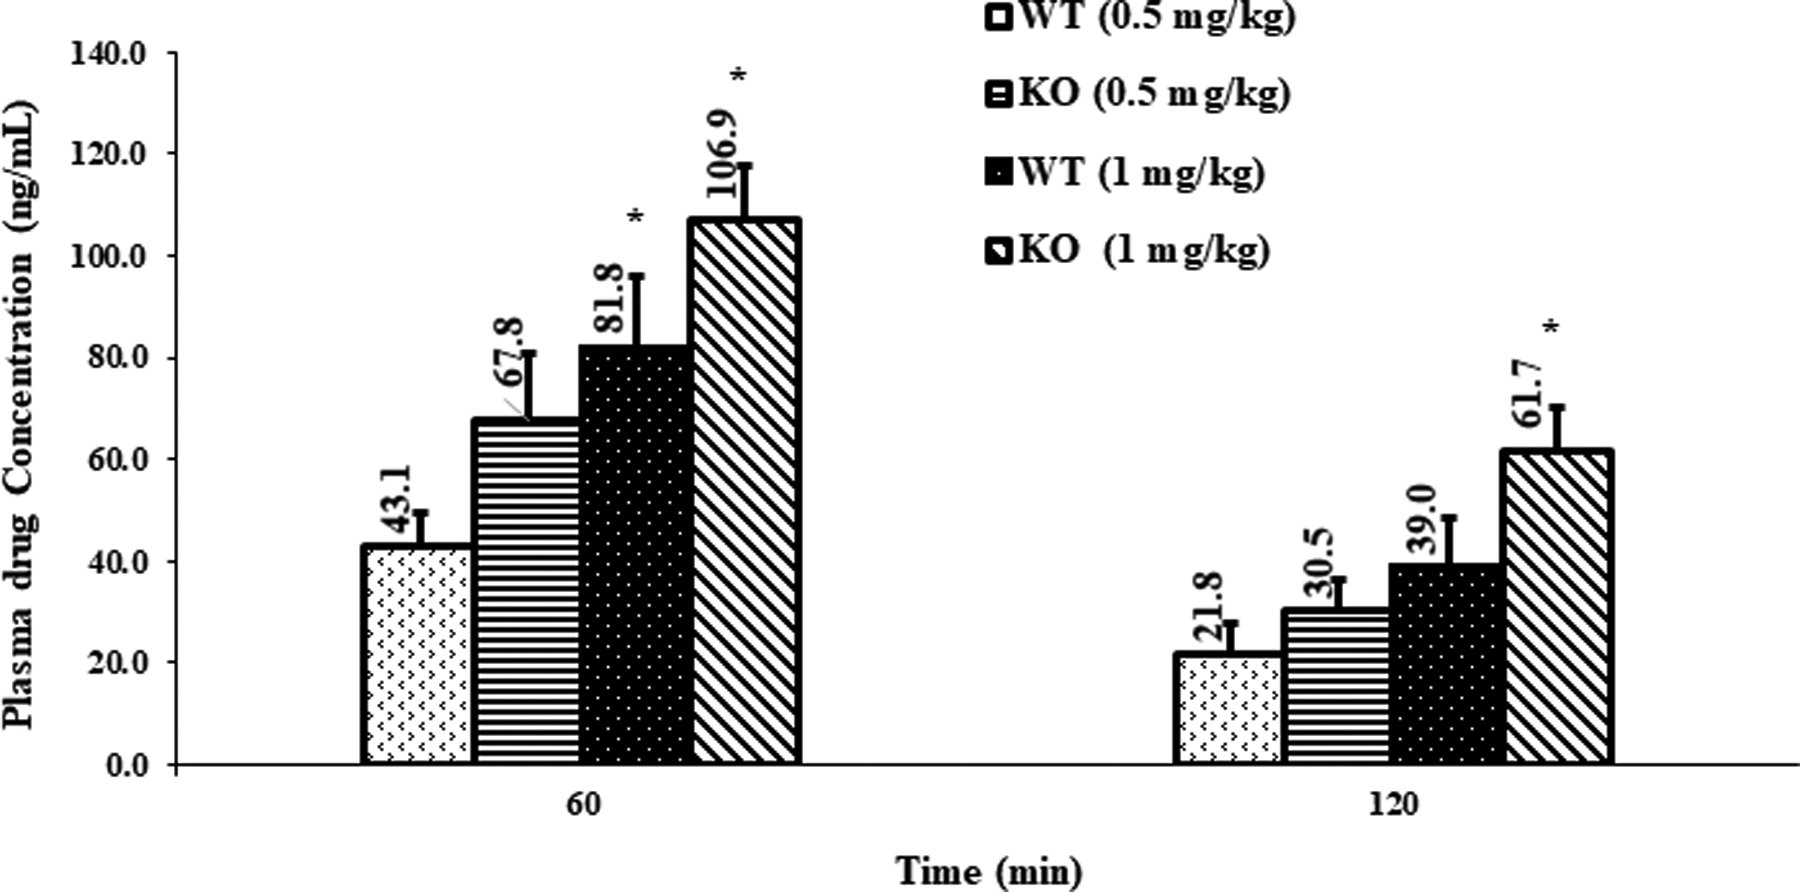
Plasma concentration of loperamide in WT and P-gp KO rats, (mean ± SEM; n=6 rats). *-indicates a significant difference (p<0.05) in plasma concentrations between WT 0.5 mg/kg and WT 1 mg/kg, or between KO 0.5 mg/kg and KO 1 mg/kg, at the same time point.
Fig. 2.
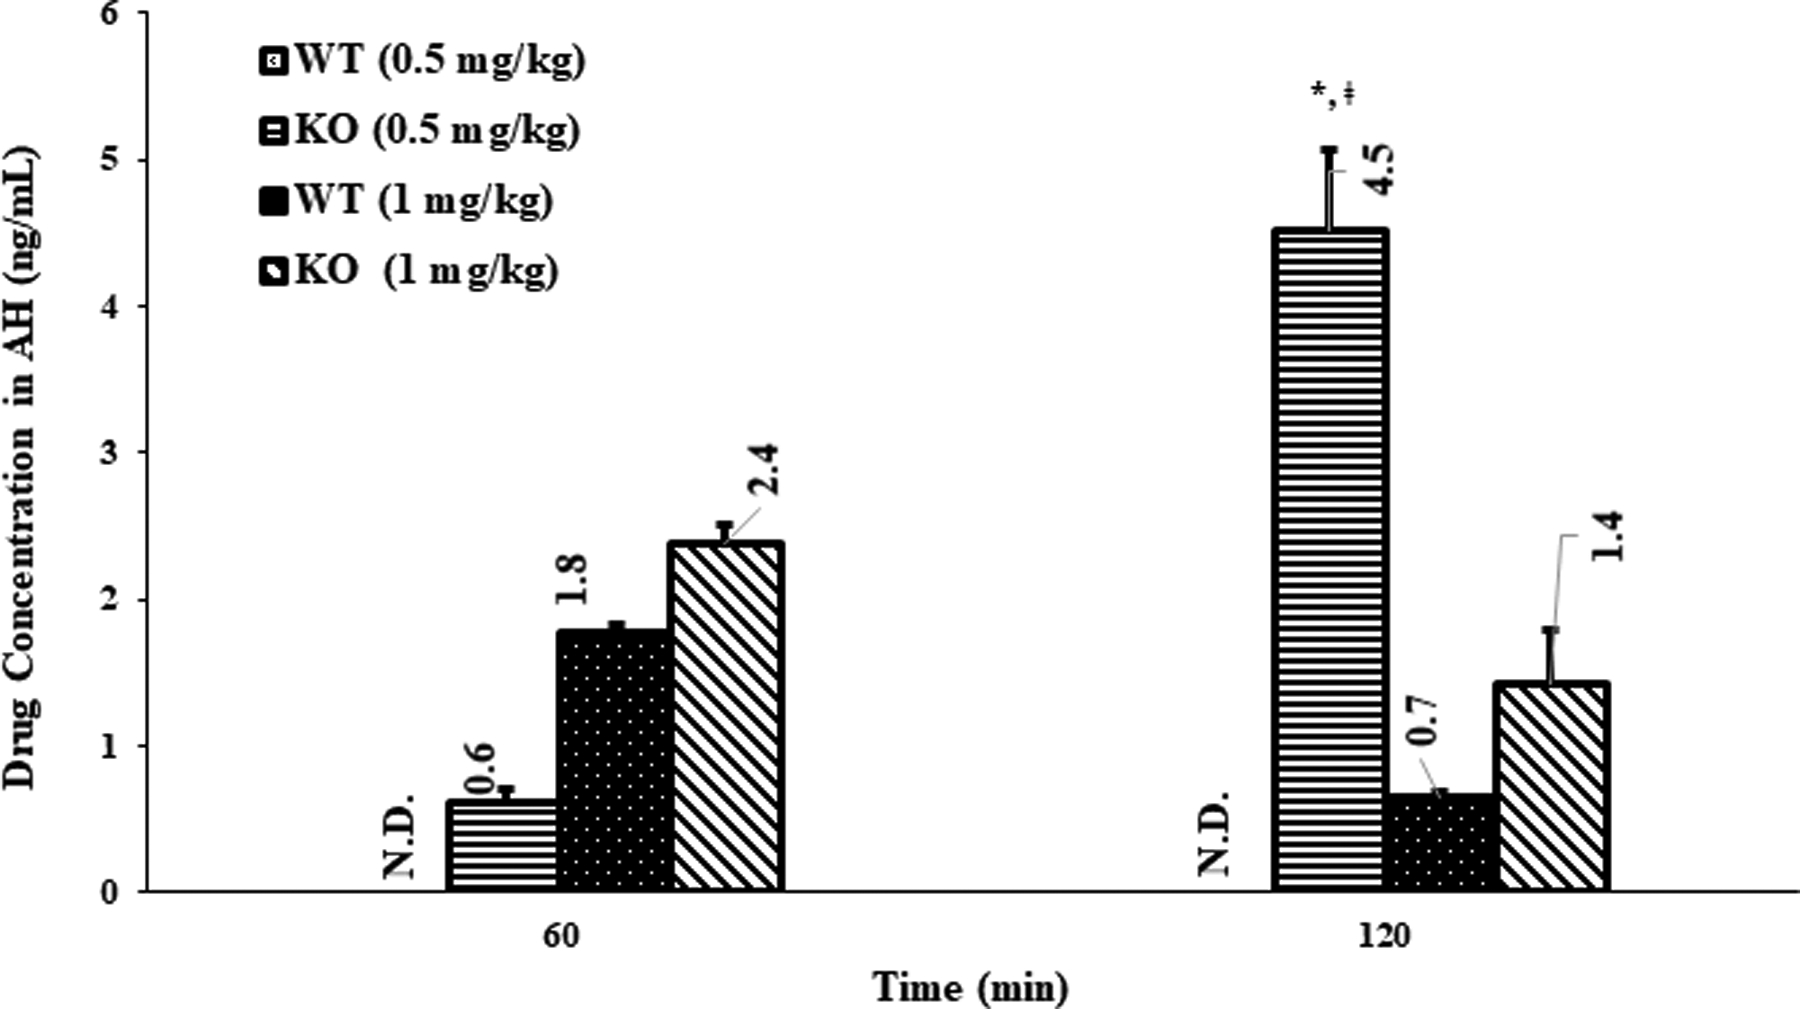
Aqueous humor (AH) concentration of loperamide in WT and P-gp KO rats, (mean ± SEM; n=6 rats). N.D.- not detected; *- indicates a significant difference (p<0.05) in AH concentrations between WT 0.5 mg/kg and KO 0.5 mg/kg, at the 120 min point; ǂ - indicates a significant difference (p<0.05) in AH concentrations between KO 0.5 mg/kg at 120 min and KO 0.5 mg/kg, at 60 min point or between KO 0.5 mg/kg at 120 min and KO 1 mg/kg, at 60 or 120 min.
Figure 3.
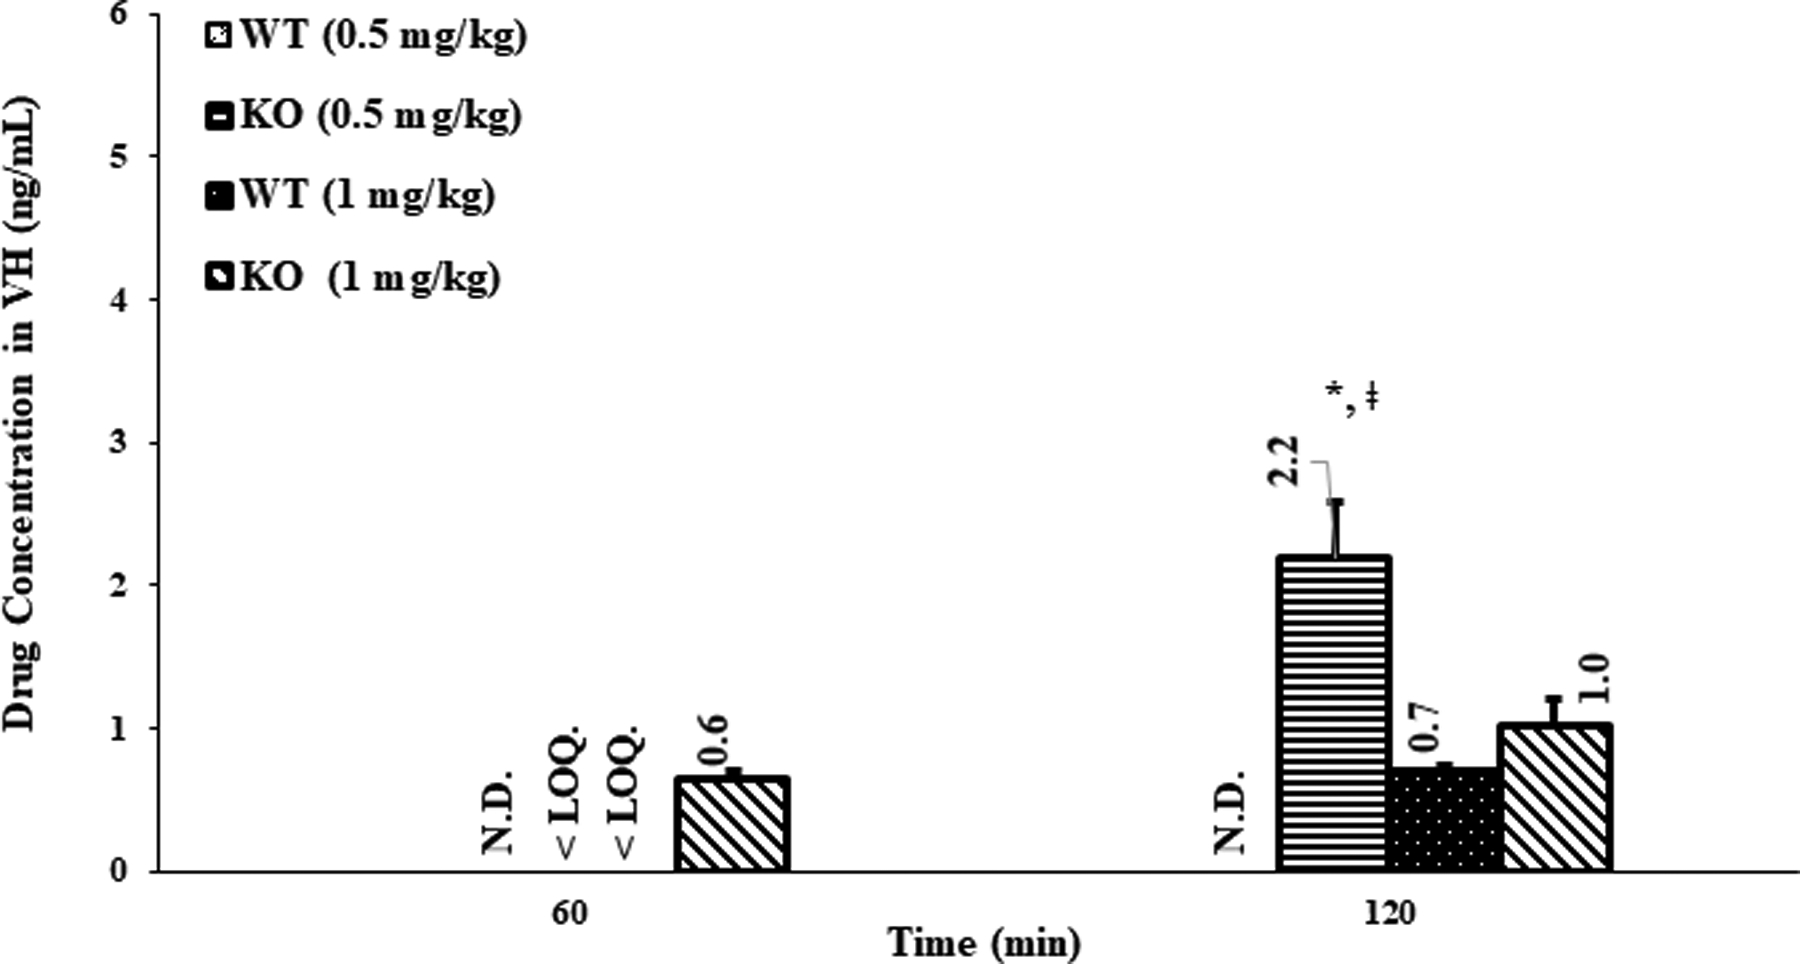
Vitreous humor (VH) concentration of loperamide in WT and P-gp KO rats, (mean ± SEM; n=6 rats). N.D.-not detected; < LOQ – below the LOQ; *- indicates a significant difference (p<0.05) between the KO 0.5 mg/kg vs WT 0.5 mg/kg, at 120 min time point. ǂ - indicates a significant difference (p<0.05) between the KO 0.5 mg/kg (120 min) vs KO 0.5 mg/kg (60 min), or between the KO 0.5 mg/kg (120 min) vs KO 1 mg/kg (60 min or 120 min).
At the lower dose (0.5 mg/kg), loperamide concentrations were below LOD in the AH of the WT rats at both time-points (Fig. 2). On the other hand, at the same dose, significant loperamide levels were obtained in the AH of KO rats, at the end of 60 and 120 min (p<0.05) (Fig. 2). The penetration of loperamide from blood into AH was determined as the AH to plasma drug concentration ratio (Table I). The distribution ratio of drug in aqueous humor (DAH) of WT rats treated with the low dose was zero for both the time-points since no drug levels were detected in the AH (Table I). The DAH of KO rats injected with low dose (0.5 mg/kg), was 0.012 ± 0.003 and 0.118 ± 0.008 at 60 and 120 min, respectively, which were significantly better compared to that of the WT rats (at low dose and at both time-points) (p<0.05) (Table I). At the higher dose, loperamide was detected in the AH of both WT and KO rats at the 60 and 120 min time-points (Fig. 2). The average concentrations in the AH obtained in the KO rats with the higher dose, at both time-points, were greater than that of the WT rats; however, the difference was not statistically significant (p=0.06). The DAH of WT rats at 60 min and 120 min time-points were almost similar (0.022 ± 0.002 and 0.020 ± 0.003) (Table I). Similarly, the DAH of KO rats at 60 and 120 min was also not different (0.023 ± 0.002 and 0.025 ± 0.007) (Table I). Moreover, the DAH of WT rats and DAH of KO rats were also not statistically significantly different from each other (Table I) at the higher dose (p=0.925).
Table I.
The plasma to aqueous humor (DAH) and plasma to vitreous humor (DVH) distribution ratio of loperamide in wild type (WT) and P-gp knock-out rats (KO), (mean ± SEM; n=6).
| Rat type | Dose (mg/kg) | Time (min) | DAH | DVH | Contribution of P-gp (%) | |
|---|---|---|---|---|---|---|
| AH | VH | |||||
| Wild type | 0.5 | 60 | 0 | 0 | 100 | N.C. |
| 120 | 0 | 0 | 100 | 100 | ||
| 1 | 60 | 0.022 ± 0.002 | N.C. | 4.5 | N.C. | |
| 120 | 0.020 ± 0.003 | 0.017 ± 0.004 | 25 | 44.2 | ||
| P-gp knock-out | 0.5 | 60 | 0.012 ± 0.003* | N.C. | N.A. | N.A. |
| 120 | 0.118 ± 0.008* | 0.066 ± 0.011*, # | N.A. | N.A. | ||
| 1 | 60 | 0.023 ± 0.002 | 0.006 ± 0.001 | N.A. | N.A. | |
| 120 | 0.025 ± 0.007 | 0.017 ± 0.003 | N.A. | N.A. | ||
P-gp = P-glycoprotein; N.C. = not calculated as the drug levels were below the quantification limit; N.A. – not applicable.
indicates significant difference at p<0.05, between the KO 0.5 mg/kg vs WT 0.5 mg/kg, at same time point.
indicates significant difference at p<0.05, between the KO 0.5 mg/kg (120 min) vs KO 0.5 mg/kg (60 min).
In the VH of WT rats, at the lower dose, loperamide concentrations were below LOD at both time-points whereas, in the VH of KO rats, the loperamide levels (0.26 ± 0.08 ng/mL) were below the LOQ at the 60 min time-point, but significant levels were observed at the 120 min time-point (Fig 3). Hence, the plasma to VH loperamide distribution ratio (DVH) in KO rats receiving the lower dose, at 120 min, was significantly higher compared to that of the WT rats (p<0.05) (Table I). With the higher dose in the WT rats, loperamide was quantifiable in the VH at the end of 120 min, but were below the LOQ at the 60 min point (0.39 ± 0.10 ng/mL). The VH concentrations in the WT and KO rats, however, were not statistically different from each other at the higher dose (p=0.176). Thus, the DVH of drug in WT and KO rats did not exhibit any significant difference at both time intervals post higher dose treatment (Table I). Interestingly, at lower dose, the drug levels in the VH and DVH of drug in KO rats at 120 min point was significantly higher compared to those observed in KO rats at 60 min post low dose treatment, in KO rats administered with higher dose (at both time-points) and in WT rats at both the doses (at two time-points) (Table I and Fig. 3). The relevant DVH values are presented in Table I.
Electroretinography (ERG) and Morphology and Ultrastructure analysis
Electroretinography (ERG) was employed to detect loperamide-induced alterations, if any, in the functioning of photoreceptors cells and inner retinal cells. The a-wave of the ERG measures the function of photoreceptor cells after a stimulus of light. Changes in the functioning of photoreceptors cells, light or chemical induced, in the outer segment of the retina can be identified by the change in the a-wave recording (27). The b-wave represents the functioning of bipolar and Müller cells. Therefore, altered b-wave recordings suggest damage to the inner retina (26,27). Hence, the percentage changes in a- and b-wave amplitudes were investigated to identify drug induced functional alterations in the retina of WT and KO rats, if any.
The percentage changes of a- and b- wave amplitudes obtained from the ERG studies in WT and KO rats, pre- and post-dosing, is presented in figure 4. The a-wave amplitude in KO rats, 2h post treatment with 0.5 mg/kg of loperamide, changed significantly with respect to baseline (p<0.05) (Fig. 4). However, no change was observed in the b-wave amplitude confirming the lack of changes in the functioning of the bipolar cells. Furthermore, a significant change from baseline in the a- and b-wave amplitudes was not seen in both WT and KO rats at days 1 and 3 post-dosing (Fig. 4). The histology of retinal sections in WT and KO rats showed intact layers of choriocapillaris (Ch), retinal pigmented epithelium (RPE) nucleus, outer segment (OS), inner segment (IS), outer nuclear layer (ONL) and inner nuclear layer (INL) without any separation or detachment between different layers (Fig. 5A & Fig 5B). Further, the TEM images of the RPE ultrastructure in WT and KO rats did not exhibit any morphological alterations in the choriocapillaris (Ch), Bruch’s membrane (BM), basolateral infoldings of the retinal pigment epithelium (RPE) or the pigmented granules (Fig. 5C & Fig. 5D).
Figure 4.
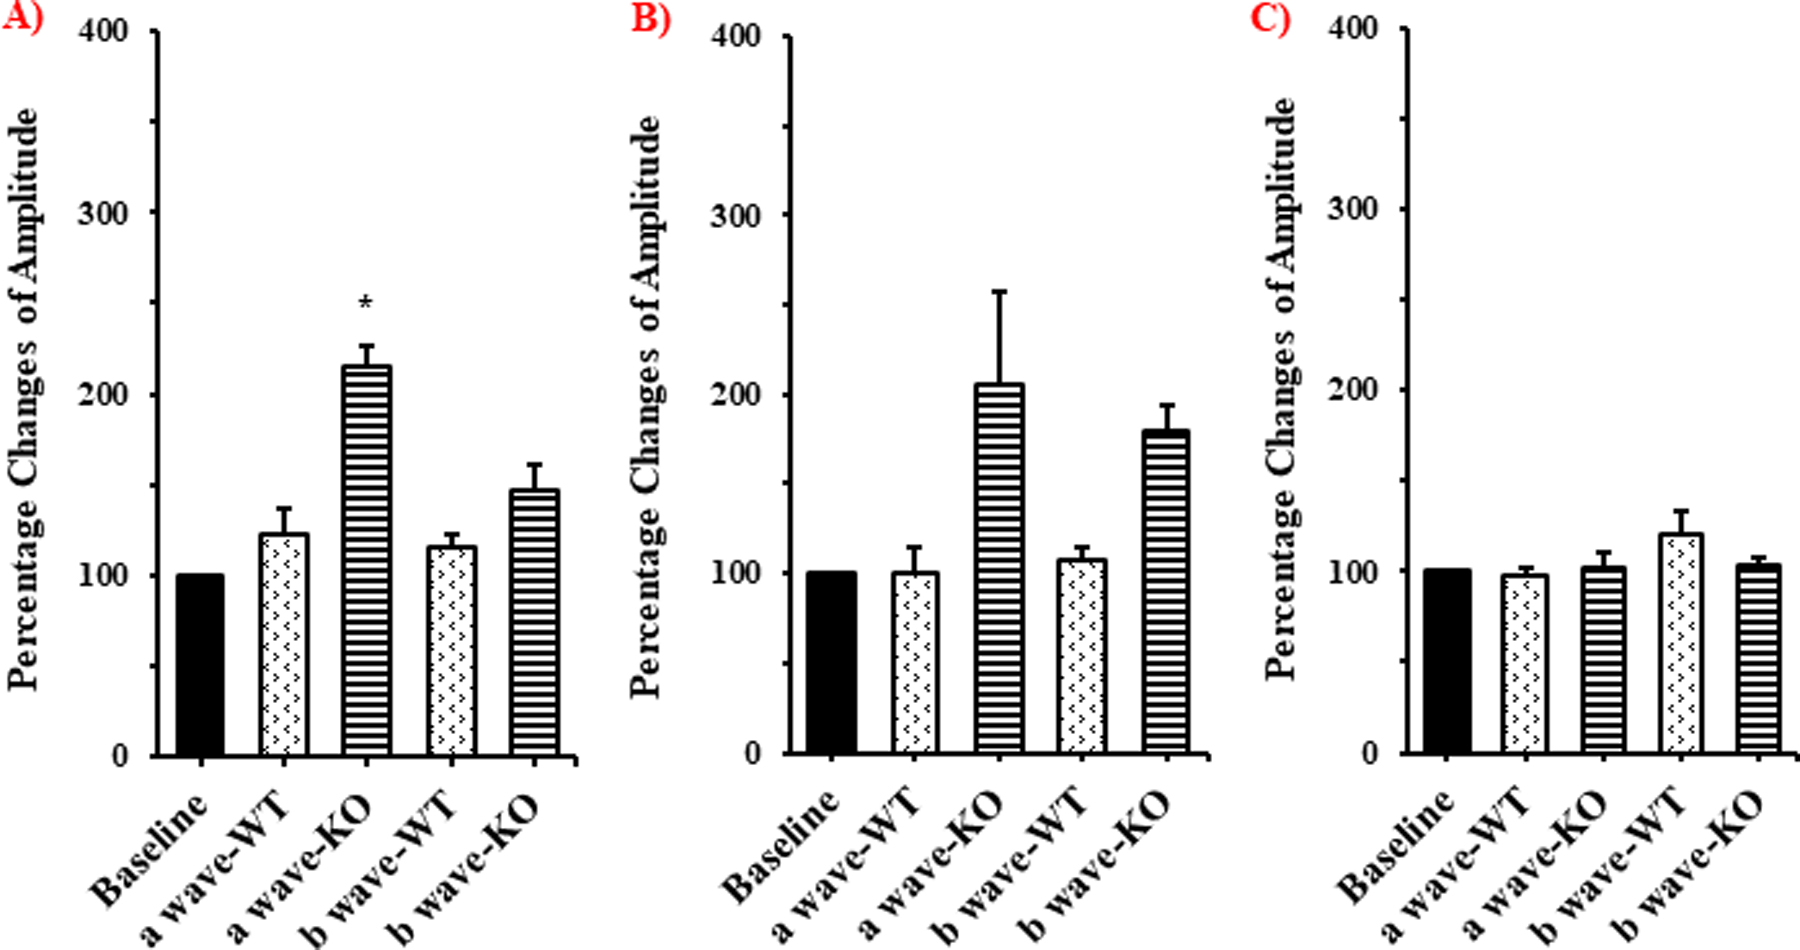
Electroretinography (ERG) data showing percentage changes of a- and b-wave amplitudes, from baseline, in WT and P-gp KO rats at A) 2h, B) 1day and C) 3days after intravenous administration of loperamide (low dose), (mean ± SEM; n=3). * - indicates significantly different from baseline (p<0.05).
Figure 5.
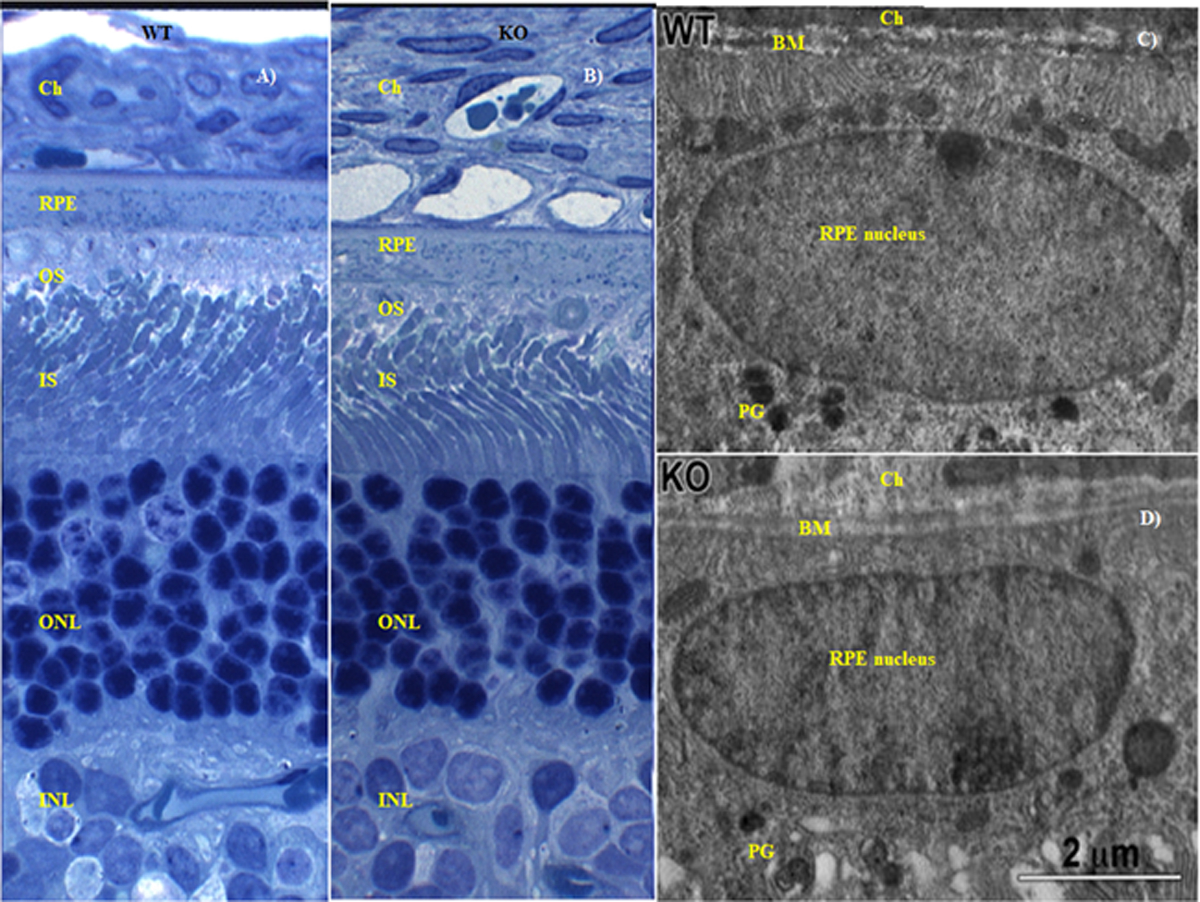
Retinal morphology of WT and P-gp KO rats 2h post intravenous administration of 0.5 mg/kg loperamide. A) and B) are the histology images illustrating a transverse section of retina from WT and KO rats, respectively. C) and D) are the TEM images of the RPE in WT and KO rats, respectively. Ch-choriocapillaris; RPE-retinal pigmented epithelium; OS-outer segment; IS-inner segment; ONL-outer nuclear layer; INL-inner nuclear layer; BM-Bruch’s membrane; PG-pigmented granules.
Due to the predominant central opiate effects of loperamide at the higher dose in the KO rats (1 mg/kg), the ERG, histology and ultrastructural analyses of retina in WT and KO rats could not be undertaken at this exposure level since the P-gp KO rats were not able to survive the second dose of anesthesia, as per the ERG study protocol, at the end of 2h post higher dose administration.
Discussion
Previously, the Mdr1a gene KO rat and mice models have been successfully used in delineating the role of P-gp in the penetration of lipophilic compounds from the blood into the vital organs like liver, kidney, lungs and brain (31–33). The current investigations with the Mdr1a KO rats were undertaken to delineate the magnitude of the impact of P-gp on the penetration of substrates across the BOBs. Loperamide was used as the model P-gp substrate in this study.
The two doses of drug tested in this investigation were selected from literature reports which studied the impact of P-gp in the BBB of WT and P-gp KO rats/mice administered with 0.5 mg/kg and/or 1 mg/kg dose of loperamide (8,21,22,31). Characteristic central opiate effects of loperamide, like restricted movements, erected tail, respiratory depression, eye protrusion, pupil constriction and lacrimation was seen in the Mdr1a KO rats during the study, consistent with the increased CNS partitioning of loperamide (34,35). These effects were prominent at the higher dose throughout the study period, but decreased significantly within 2h in the lower dose study group. The central opiate effects were not seen in the WT rats at the doses used, confirming the efflux of loperamide by the Mdr1a protein in the WT rats.
Consistent with previous reports, the mean plasma loperamide concentration in the KO rats was slightly higher (not statistically significant (p=0.06)) compared to the WT rats, at both doses and time-points (Fig. 1) confirming the absence of P-gp which plays a fundamental role in renal clearance of substrate molecules like loperamide (21).
With the low dose treatment, at both time-points, the influence of P-gp on the transport of loperamide across the BAB was evident in the WT rats with no drug levels being detected in the AH. This was in sharp contrast to the P-gp KO rats which showed significant drug levels in the AH (p<0.05) (Fig. 2). Furthermore, the DAH of the KO rats was significantly higher in comparison to the WT rats suggesting 100% contribution of P-gp in the active efflux of loperamide at the BAB, at this dose (p<0.05) (Table I). These findings agree with previous reports on the expression of P-gp at BAB (4,13).
Interestingly, the drug levels in the AH, as well as the DAH, of the KO rats at the 60 min time point was significantly lower compared to that observed at the 120 min post dosing (p<0.05) (Table I & Fig. 2), which could be due to the strong opioid agonist behavior of loperamide. Literature suggests that the μ-opioid agonists modulate the iris-ciliary function by increasing AH outflow (36). Dortch-Carnes and Russell, (2006) demontsrated that morphine, a μ-opioid agonist, binds to the μ-opioid receptors present in the iris and ciliary bodies and reduces intraocular pressure by increasing AH outflow through the dialated trabecular meshwork and Sclemm’s canal (37). Loperamide, also an opioid agonist, besides inducing central opioid mediated ocular effects, could also enhance AH outflow through local morphine-like action, resulting in rapid clearance of loperamide from the AH. The increase in outflow would overshadow the increased penetration of loperamide into the AH in the KO rats, resulting in lower AH concentrations and DAH at the 60 min time-point. Hence, at the 120 min time-point, the higher drug concentrations in the AH of KO rats, taken together with the observation that the central opioid effects wore-off by the 2h time-point for the low dose, strongly supports improved penetration of loperamide across the BAB in the absence of P-gp (p<0.05) (Fig. 2). Furthermore, the DAH of the KO rats, at lower dose and at 120 min point, was significantly higher compared to that of WT rats suggesting 100 % contribution of P-gp on the drug penetration across the BAB in WT rats (p<0.05) (Table I). However, further investigations, e.g. demonstrating reduction in intraocular pressure (IOP), are needed to confirm the increased outflow of AH produced by the interaction of systemically administered loperamide with the μ-opioid pathway.
Loperamide concentrations in the VH of KO rats, low dose study, were significantly higher compared to that of the WT rats (no drug levels noticed, at both the time-points), particularly at the 120 min time-point, demonstrating the role of P-gp in the active efflux of loperamide at the BRB (p<0.05) (Fig. 3). Moreover, the significantly higher DVH of KO rats at 120 min, compared to that of the WT rats, demonstrates the superior penetration of loperamide from blood to VH through the BRB of subjects lacking P-gp. The data also suggests 100 % influence of P-gp, at the lower dose, at the blood-VH interface of WT rats on the penetration of loperamide across the BRB (Table I). These results are in agreement with the previous literature reports on the barrier properties of P-gp in the BRB (5,12).
At the higher dose (at both the time points), the contribution of P-gp in the blood-ocular penetration of loperamide was not as marked as at the lower dose. Although the mean drug concentrations in the AH and the VH of KO rats, at 60 and 120 min, were slightly higher than that of the WT rats, the difference was not statistically significant (Fig. 3) (p>0.05). Moreover, at any given time point, the DAH in the WT rats and the KO rats were almost the same (Table I). Furthermore, the DAH in WT rats at the 60 and 120 min time points were similar (Table I). These results could be attributed to either elimination of drug from the AH of KO rats through increased AH outflow due to the μ-opioid agonistic activity of loperamide (36) or a predominant passive diffusion of loperamide into the AH of WT rats maybe due to the saturation of P-gp mediated efflux in the BAB. Similarly, at the 120 min point, DVH in WT rats and the KO rats was not significantly different which could be either due to the rapid clearance of the drug from VH of KO rats as a result of increased retinal blood flow due to the μ-opioid receptor induced dilation of retinal vasculature by μ-opioid agonists (loperamide) (40) or the passive diffusion of drug into VH of WT rats due to the saturation of P-gp activity in BRB at the higher loperamide (P-gp substrate) concentrations (Table I) (24,25). Other literature reports also suggest diffusion as the predominant mechanism of influx of molecules into the organs from the systemic circulation, due to the saturation of P-gp expression at the blood-organ interface, at higher substrate doses (24,25,38,39).
Interestingly, the lower loperamide dose produced higher VH concentration and DVH in KO rats at the 120 min time-point compared to that in KO rats treated with higher dose at both time points (Table I & Fig. 3). This could be due to the μ-opioid receptor induced dilation of retinal blood vessels through the neuronal nitric oxide synthase pathway, at higher dose/plasma concentrations (40), which would lead to increased blood flow to the retina and rapid clearence of drug from the VH.
The retinal histology of the KO rats, at 2h, did not demonstrate any significant alteration from that of the WT rats (Fig. 5) confirming the absence of loperamide triggered damage to the retinal structure (Fig. 5A & Fig. 5B) (26,27). Compromise in retinal structural integrity would have been evident through observations of reduced thickness of Bruch’s membrane, low or no basal membrane of RPE, and the disappearance of pigmented granules accompanied by numerous vacuole formation in the RPE (41), however, none of these aberrant phenotypes were present. Ultrastructural TEM images of the RPE in KO rat illustrated the pigmented granules, basal of the RPE and a thick Bruch’s membrane separating choroid plexus from the RPE in KO rats (also in WT rats), establishing the safety of loperamide with respect to the retinal morphology at the doses tested (Fig. 5C & Fig. 5D). The ERG wave forms (a-wave and b-wave) in the KO and the WT rats also did not show any significant difference, with respect to % change from baseline readings, except for the a-wave in KO rats at the 2h time point. The change in the a-wave amplitude is possibly due to the fluctuations in the photoreceptor function due to the opioid agonist behavior of loperamide (p<0.05) (Fig. 4) (36,37). The electroretinography, histology and ultrastructural analyses of retina thus confirm that the differences observed in VH penetration of loperamide in the WT ad KO rats were not due to any damage to the retinal ultra-structure.
Conclusion
The ocular distribution studies in WT and Mdr1a KO rats delineated the importance of P-gp efflux transporter on the ocular penetration of loperamide from the systemic circulation. A dose related effect of loperamide was noticed on the expression of P-gp in the BOBs. The impact of Mdr1a efflux transporter on the blood-ocular penetration of loperamide was more evident in the low dose. The improved distribution of loperamide into the AH and VH from the systemic circulation in the P-gp KO rats, illustrated the existence and magnitude of P-gp’s barrier characteristics at the BAB and the BRB. Further studies investigating the μ-opioid agonist activity loperamide on the AH dynamics are warranted.
Acknowledgments:
This project was supported by the grant from the National Eye Institute, National Institutes of Health [Grant-1R01EY022120-03]. The content is solely the responsibility of the authors and does not necessarily represent the official views of the National Institutes of Health.
Non-Standard Abbreviations:
- ABC
ATP binding cassette
- AH
Aqueous humor
- BAB
Blood aqueous barrier
- BM
Bruch’s membrane
- BOB
Blood ocular barrier
- BQ
Below quantification
- BRB
Blood retinal barrier
- Ch
Choriocapillaris
- DAH
Distribution ratio of loperamide from plasma to aqueous humor
- DVH
Distribution ratio of loperamide from plasma to vitreous humor
- EE
Extraction efficiency
- ERG
Electroretinography
- I.P.
Intraperitoneal
- IIG
Inactive ingredients
- INL
Inner nuclear layer
- IS
Inner segment
- IV
intravenous
- KO
Knock-out
- LOD
Limit of detection
- LOQ
Limit of quantification
- Mdr1a
Multidrug resistance 1a gene
- ONL
Outer nuclear layer
- OS
Outer segment
- P-gp
P-glycoprotein
- PG
pigmented granules
- Q-TOF
Quadrupole time of flight
- RPE
Retinal pigmented epithelium
- SD
Sprague Dawley
- UHPLC
Ultra high performance liquid chromatography
- VH
Vitreous humor
- WT
Wild-type
Footnotes
Conflict of interest
The authors declare no conflicts of interest in this research.
References
- 1.Aukunuru JV, Sunkara G, Bandi N, Thoreson WB, Kompella UB. Expression of Multidrug Resistance-Associated Protein (MRP) in Human Retinal Pigment Epithelial Cells and Its Interaction with BAPSG, a Novel Aldose Reductase Inhibitor. Pharm Res. 2001. May 1;18(5):565–572. [DOI] [PubMed] [Google Scholar]
- 2.Kennedy BG, Mangini NJ. P-glycoprotein expression in human retinal pigment epithelium. Mol Vis. 2002. November 11;8:422–430. [PubMed] [Google Scholar]
- 3.Steuer H, Jaworski A, Elger B, Kaussmann M, Keldenich J, Schneider H, et al. Functional characterization and comparison of the outer blood-retina barrier and the blood-brain barrier. Invest Ophthalmol Vis Sci. 2005. March;46(3):1047–1053. [DOI] [PubMed] [Google Scholar]
- 4.Cunha-Vaz JG. The blood-ocular barriers: past, present, and future. Doc Ophthalmol Adv Ophthalmol. 1997;93(1–2):149–157. [DOI] [PubMed] [Google Scholar]
- 5.Cunha-Vaz JG. The blood–retinal barriers system. Basic concepts and clinical evaluation. Exp Eye Res. 2004. March 1;78(3):715–721. [DOI] [PubMed] [Google Scholar]
- 6.Kuno N, Fujii S. Dry age-related macular degeneration: recent progress of therapeutic approaches. Curr Mol Pharmacol. 2011. November;4(3):196–232. [DOI] [PubMed] [Google Scholar]
- 7.van Soest S, Westerveld A, de Jong PT, Bleeker-Wagemakers EM, Bergen AA. Retinitis pigmentosa: defined from a molecular point of view. Surv Ophthalmol. 1999. February;43(4):321–334. [DOI] [PubMed] [Google Scholar]
- 8.Nieto Montesinos R, Béduneau A, Lamprecht A, Pellequer Y. Liposomes Coloaded with Elacridar and Tariquidar To Modulate the P-Glycoprotein at the Blood–Brain Barrier. Mol Pharm. 2015. November 2;12(11):3829–3838. [DOI] [PubMed] [Google Scholar]
- 9.Gant TW, O’Connor CK, Corbitt R, Thorgeirsson U, Thorgeirsson SS. In vivo induction of liver P-glycoprotein expression by xenobiotics in monkeys. Toxicol Appl Pharmacol. 1995. August;133(2):269–276. [DOI] [PubMed] [Google Scholar]
- 10.Brillault J, De Castro WV, Harnois T, Kitzis A, Olivier J-C, Couet W. P-glycoprotein-mediated transport of moxifloxacin in a Calu-3 lung epithelial cell model. Antimicrob Agents Chemother. 2009. April;53(4):1457–1462. [DOI] [PMC free article] [PubMed] [Google Scholar]
- 11.Karyekar CS, Eddington ND, Garimella TS, Gubbins PO, Dowling TC. Evaluation of P-glycoprotein-mediated renal drug interactions in an MDR1-MDCK model. Pharmacotherapy. 2003. April;23(4):436–442. [DOI] [PubMed] [Google Scholar]
- 12.Fujii S, Setoguchi C, Kawazu K, Hosoya K. Impact of P-glycoprotein on blood-retinal barrier permeability: comparison of blood-aqueous humor and blood-brain barrier using mdr1a knockout rats. Invest Ophthalmol Vis Sci. 2014. July 1;55(7):4650–4658. [DOI] [PubMed] [Google Scholar]
- 13.Kajikawa T, Mishima HK, Murakami T, Takano M. Role of P-glycoprotein in distribution of rhodamine 123 into aqueous humor in rabbits. Curr Eye Res. 1999. March;18(3):240–246. [DOI] [PubMed] [Google Scholar]
- 14.Duvvuri S, Gandhi MD, Mitra AK. Effect of P-glycoprotein on the ocular disposition of a model substrate, quinidine. Curr Eye Res. 2003. December;27(6):345–353. [DOI] [PubMed] [Google Scholar]
- 15.Barar J, Javadzadeh AR, Omidi Y. Ocular novel drug delivery: impacts of membranes and barriers. Expert Opin Drug Deliv. 2008. May;5(5):567–581. [DOI] [PubMed] [Google Scholar]
- 16.Hosoya KI, Tomi M. Advances in the cell biology of transport via the inner blood-retinal barrier: Establishment of cell lines and transport functions. Biol Pharm Bull. 2005. January;28(1):1–8. [DOI] [PubMed] [Google Scholar]
- 17.Sugiyama D, Kusuhara H, Taniguchi H, Ishikawa S, Nozaki Y, Aburatani H, et al. Functional characterization of rat brain-specific organic anion transporter (Oatp14) at the blood-brain barrier: high affinity transporter for thyroxine. J Biol Chem. 2003. October 31;278(44):43489–43495. [DOI] [PubMed] [Google Scholar]
- 18.Akanuma S, Hirose S, Tachikawa M, Hosoya K. Localization of organic anion transporting polypeptide (Oatp) 1a4 and Oatp1c1 at the rat blood-retinal barrier. Fluids Barriers CNS. 2013. October 2;10–29. [DOI] [PMC free article] [PubMed] [Google Scholar]
- 19.Kubo Y, Kusagawa Y, Tachikawa M, Akanuma S-I, Hosoya K-I. Involvement of a novel organic cation transporter in verapamil transport across the inner blood-retinal barrier. Pharm Res. 2013. March;30(3):847–856. [DOI] [PubMed] [Google Scholar]
- 20.Gao B, Huber RD, Wenzel A, Vavricka SR, Ismair MG, Remé C, et al. Localization of organic anion transporting polypeptides in the rat and human ciliary body epithelium. Exp Eye Res. 2005. January;80(1):61–72. [DOI] [PubMed] [Google Scholar]
- 21.Zamek-Gliszczynski MJ, Bedwell DW, Bao JQ, Higgins JW. Characterization of SAGE Mdr1a (P-gp), Bcrp, and Mrp2 knockout rats using loperamide, paclitaxel, sulfasalazine, and carboxydichlorofluorescein pharmacokinetics. Drug Metab Dispos Biol Fate Chem. 2012. September;40(9):1825–1833. [DOI] [PubMed] [Google Scholar]
- 22.Zamek-Gliszczynski MJ, Goldstein KM, Paulman A, Baker TK, Ryan TP. Minor compensatory changes in SAGE Mdr1a (P-gp), Bcrp, and Mrp2 knockout rats do not detract from their utility in the study of transporter-mediated pharmacokinetics. Drug Metab Dispos Biol Fate Chem. 2013. June;41(6):1174–1178. [DOI] [PubMed] [Google Scholar]
- 23.Chu X, Zhang Z, Yabut J, Horwitz S, Levorse J, Li X, et al. Characterization of multidrug resistance 1a/P-glycoprotein knockout rats generated by zinc finger nucleases. Mol Pharmacol. 2012. February;81(2):220–227. [DOI] [PubMed] [Google Scholar]
- 24.Hippalgaonkar K, Srirangam R, Avula B, Khan IA, Majumdar S. Interaction between Topically and Systemically Coadministered P-Glycoprotein Substrates/Inhibitors: Effect on Vitreal Kinetics. Drug Metab Dispos. 2010. October;38(10):1790–1797. [DOI] [PMC free article] [PubMed] [Google Scholar]
- 25.Majumdar S, Hippalgaonkar K, Srirangam R. Vitreal Kinetics of Quinidine in Rabbits in the Presence of Topically Coadministered P-Glycoprotein Substrates/Modulators. Drug Metab Dispos. 2009. August 1;37(8):1718–1725. [DOI] [PMC free article] [PubMed] [Google Scholar]
- 26.Vasireddy V, Jablonski MM, Khan NW, Wang XF, Sahu P, Sparrow JR, et al. Elovl4 5-bp deletion knock-in mouse model for Stargardt-like macular degeneration demonstrates accumulation of ELOVL4 and lipofuscin. Exp Eye Res. 2009. December;89(6):905–912. [DOI] [PMC free article] [PubMed] [Google Scholar]
- 27.Vasireddy V, Jablonski MM, Mandal MNA, Raz-Prag D, Wang XF, Nizol L, et al. Elovl4 5-bp-deletion knock-in mice develop progressive photoreceptor degeneration. Invest Ophthalmol Vis Sci. 2006. October;47(10):4558–4568. [DOI] [PubMed] [Google Scholar]
- 28.Yalkowsky SH, Rubino JT. Solubilization by cosolvents I: organic solutes in propylene glycol-water mixtures. J Pharm Sci. 1985. April;74(4):416–421. [DOI] [PubMed] [Google Scholar]
- 29.Inactive Ingredient Search for Approved Drug Products. Fedral Drug Administration IIG database- 2016. Available from: https://www.accessdata.fda.gov/scripts/cder/iig/index.cfm [Google Scholar]
- 30.Polson C, Sarkar P, Incledon B, Raguvaran V, Grant R. Optimization of protein precipitation based upon effectiveness of protein removal and ionization effect in liquid chromatography-tandem mass spectrometry. J Chromatogr B Analyt Technol Biomed Life Sci. 2003. March 5;785(2):263–275. [DOI] [PubMed] [Google Scholar]
- 31.Bundgaard C, Jensen CJN, Garmer M. Species Comparison of In Vivo P-Glycoprotein-Mediated Brain Efflux Using mdr1a-Deficient Rats and Mice. Drug Metab Dispos. 2012. March 1;40(3):461–466. [DOI] [PubMed] [Google Scholar]
- 32.Toda R, Kawazu K, Oyabu M, Miyazaki T, Kiuchi Y. Comparison of drug permeabilities across the blood-retinal barrier, blood-aqueous humor barrier, and blood-brain barrier. J Pharm Sci. 2011. September;100(9):3904–3911. [DOI] [PubMed] [Google Scholar]
- 33.Hosoya K, Yamamoto A, Akanuma S, Tachikawa M. Lipophilicity and Transporter Influence on Blood-Retinal Barrier Permeability: A Comparison with Blood-Brain Barrier Permeability. Pharm Res. 2010. December 1;27(12):2715–2724. [DOI] [PubMed] [Google Scholar]
- 34.Hsiao P, Unadkat JD. P-Glycoprotein-Based Loperamide–Cyclosporine Drug Interaction at the Rat Blood–Brain Barrier: Prediction from In Vitro Studies and Extrapolation to Humans. Mol Pharm. 2012. March 5;9(3):629–633. [DOI] [PMC free article] [PubMed] [Google Scholar]
- 35.Elkiweri IA, Zhang YL, Christians U, Ng K-Y, Tissot van Patot MC, Henthorn TK. Competitive Substrates for P-Glycoprotein and Organic Anion Protein Transporters Differentially Reduce Blood Organ Transport of Fentanyl and Loperamide: Pharmacokinetics and Pharmacodynamics in Sprague Dawley Rats. Anesth Analg. 2009. January;108(1):149–159. [DOI] [PMC free article] [PubMed] [Google Scholar]
- 36.Husain S Opioid Receptors: Methods for Detection and Their Modes of Actions in the Eye In: Opioid Receptors. Humana Press, New York, NY; 2015. p. 243–251. [DOI] [PubMed] [Google Scholar]
- 37.Dortch-Carnes J, Russell KRM. Morphine-induced reduction of intraocular pressure and pupil diameter: role of nitric oxide. Pharmacology. 2006;77(1):17–24. [DOI] [PubMed] [Google Scholar]
- 38.Lin JH, Yamazaki M. Role of P-glycoprotein in pharmacokinetics: clinical implications. Clin Pharmacokinet. 2003;42(1):59–98. [DOI] [PubMed] [Google Scholar]
- 39.Dey S, Mitra AK. Transporters and receptors in ocular drug delivery: opportunities and challenges. Expert Opin Drug Deliv. 2005. March 1;2(2):201–204. [DOI] [PubMed] [Google Scholar]
- 40.Someya E, Mori A, Sakamoto K, Ishii K, Nakahara T. Stimulation of μ-opioid receptors dilates retinal arterioles by neuronal nitric oxide synthase-derived nitric oxide in rats. Eur J Pharmacol. 2017. May 15;803:124–129. [DOI] [PubMed] [Google Scholar]
- 41.Guymer R, Luthert P, Bird A. Changes in Bruch’s membrane and related structures with age. Prog Retin Eye Res. 1999. January;18(1):59–90. [DOI] [PubMed] [Google Scholar]