

Abstract
Objective
Our aims were to assess the association of dairy intake with prevalence of metabolic syndrome (MetS) (cross-sectionally) and with incident hypertension and incident diabetes (prospectively) in a large multinational cohort study.
Methods
The Prospective Urban Rural Epidemiology (PURE) study is a prospective epidemiological study of individuals aged 35 and 70 years from 21 countries on five continents, with a median follow-up of 9.1 years. In the cross-sectional analyses, we assessed the association of dairy intake with prevalent MetS and its components among individuals with information on the five MetS components (n=112 922). For the prospective analyses, we examined the association of dairy with incident hypertension (in 57 547 individuals free of hypertension) and diabetes (in 131 481 individuals free of diabetes).
Results
In cross-sectional analysis, higher intake of total dairy (at least two servings/day compared with zero intake; OR 0.76, 95% CI 0.71 to 0.80, p-trend<0.0001) was associated with a lower prevalence of MetS after multivariable adjustment. Higher intakes of whole fat dairy consumed alone (OR 0.72, 95% CI 0.66 to 0.78, p-trend<0.0001), or consumed jointly with low fat dairy (OR 0.89, 95% CI 0.80 to 0.98, p-trend=0.0005), were associated with a lower MetS prevalence. Low fat dairy consumed alone was not associated with MetS (OR 1.03, 95% CI 0.77 to 1.38, p-trend=0.13). In prospective analysis, 13 640 people with incident hypertension and 5351 people with incident diabetes were recorded. Higher intake of total dairy (at least two servings/day vs zero serving/day) was associated with a lower incidence of hypertension (HR 0.89, 95% CI 0.82 to 0.97, p-trend=0.02) and diabetes (HR 0.88, 95% CI 0.76 to 1.02, p-trend=0.01). Directionally similar associations were found for whole fat dairy versus each outcome.
Conclusions
Higher intake of whole fat (but not low fat) dairy was associated with a lower prevalence of MetS and most of its component factors, and with a lower incidence of hypertension and diabetes. Our findings should be evaluated in large randomized trials of the effects of whole fat dairy on the risks of MetS, hypertension, and diabetes.
Keywords: nutrition, hypertension, endocrinology, adult diabetes
Significance of this study.
What is already known about this subject?
Several cohort studies found that higher dairy intake is associated with lower risk of metabolic syndrome (MetS), diabetes, and hypertension. To date, most studies were conducted in North America and Europe, with limited information from other world regions (eg, China, India, South America, and Africa).
What are the new findings?
Higher intake of whole fat (but not low fat) dairy was associated with a lower prevalence of MetS and most of its component factors, and with a lower incidence of hypertension and diabetes.
How might these results change the focus of research or clinical practice?
Our findings should be evaluated in large randomized trials of the effects of whole fat dairy on the risks of MetS, hypertension, and diabetes.
Introduction
Metabolic syndrome (MetS) is characterized by the common clustering of five metabolic abnormalities, including elevated blood pressure, abdominal obesity, elevated triglycerides, low high density lipoprotein (HDL) cholesterol, and elevated blood glucose. The presence of MetS is associated with an increased risk of cardiovascular disease, type 2 diabetes, and mortality.1 Diet may play an important role in the development of MetS and diabetes.2–4 Dairy products in particular have been studied in relation to blood lipids, blood pressure, and cardiovascular disease.5 In several short-term trials, dairy intake was found to lower blood pressure,6 7 but less is known about its influence on blood glucose.8 9 Emerging evidence suggests that dairy foods, particularly whole fat dairy and fermented dairy (eg, cheese or yogurt), may influence diverse pathways and have favorable metabolic effects.10 Additionally, several cohort studies have shown that higher dairy consumption is associated with lower risk of MetS, diabetes, and hypertension.5 11 12 To date, most cohort studies have been conducted in North America and Europe, with limited information from other world regions (eg, China, India, South America, and Africa), which have substantially different diets and different amounts and types of dairy intake than in high income countries and may limit the generalizability of previous findings.
The primary aim of this analysis from the Prospective Urban Rural Epidemiology (PURE) study was to assess the association of dairy intake with prevalence of MetS (cross -sectional analysis) and to examine the association of dairy intake with incident hypertension and incident diabetes after 9.1 years of follow-up (prospective analyses).
Methods
Study design and participants
The design and methods of the PURE study have been described previously.13 14 Briefly, PURE is a large-scale cohort study of participants aged 35 and 70 years using an unbiased approach of sampling individuals from 664 communities in 21 countries (Argentina, Bangladesh, Brazil, Canada, Chile, China, Colombia, India, Iran, Malaysia, occupied Palestine territory, Pakistan, Philippines, Poland, South Africa, Saudi Arabia, Sweden, Tanzania, Turkey, United Arab Emirates, and Zimbabwe). Details of study design and sampling are described in online supplementary appendix (page 10). The protocol was approved by the ethics committee at each participating center and all participants provided written informed consent.
bmjdrc-2019-000826supp001.pdf (866.1KB, pdf)
Procedures
Participants’ habitual food intake was recorded using country-specific (region-specific in India) validated food frequency questionnaires (FFQs; online appendix table S1). For almost all countries where a validated FFQ was not available, we developed and validated FFQs using a standard method. The FFQ was undertaken by interview together with other questionnaires at the PURE study baseline. The FFQ recorded the number of times participants had consumed any specific items from a list of foods in the past year. The FFQs had the same format for all countries. Total dairy included milk, yogurt, yogurt drink, cheese, and mixed dishes prepared with dairy. Mixed dishes prepared with dairy were disaggregated into their constituents and a proportional weight was assigned to each component. We further grouped these foods into whole fat dairy (whole milk, whole fat yogurt, whole fat cheese, whole fat yogurt drinks, and mixed dishes prepared with whole f at dairy products) and low fat dairy (low fat (1–2%) milk, skimmed milk, low fat yogurt, low fat cheese, and low fat yogurt drink). To ensure that measurements were consistent across countries we used daily standard serving intake of each dairy product. Butter and cream were not included in the total dairy and whole fat dairy groups and their associations are reported separately. Butter intake was not recorded as an item on the FFQ in China, Malaysia, Sweden, and occupied Palestine territory, and therefore, the association between butter and outcomes was assessed only in those countries where butter intake was recorded.
Information on personal medical history, use of prescription medications, education level, and smoking status was recorded using a standardized questionnaire.13 14 Physical measurements included weight, height, waist and hip circumferences, and two recordings of resting blood pressure with the use of an Omron HEM-757 automatic digital monitor (Omron Corp, Tokyo, Japan) were recorded in all participants. A fasting blood sample was collected and frozen at between –20 and –70°C. All blood samples were shipped in ambient packaging with the use of STP-250 shipping boxes (Saf-T-Pak, AnInmark Company, Edmonton, AB, Canada) to the Clinical Research and Clinical Trials Laboratory at Hamilton General Hospital (Hamilton, ON, Canada) or the regional laboratories in Beijing (China), Bangalore (India), or Kocaeli (Turkey), for analyses with the use of validated and standardized methods.15 Fasting blood samples were analyzed for total cholesterol, low density lipoprotein cholesterol (LDL-C), HDL cholesterol (HDL-C), triglycerides, apolipoprotein A1, and apolipoprotein B at the Population Health Research Institute.16
During follow-up, participants were contacted at least once every three years either by telephone or in person visits by the local research team. Case-report forms recorded details about events and these were obtained either from medical records or by interviewing participants. During the follow-up, participants were asked if they had been diagnosed with hypertension or were on antihypertensive medications. Participants were also asked if they had developed diabetes since the last follow-up (self-reported diabetes, or on oral hypoglycemic agents). We did not record lipids or waist circumference routinely during follow-up in all individuals and so we are not able to report on incident MetS.
A total of 153 220 participants from 21 countries completed the FFQ at baseline, of whom 147 812 had plausible energy intake (500–5000 kcal/day).17–19 For the cross-sectional analysis, among individuals with information on the five MetS components (n=112 922), we assessed the association of dairy intake with prevalent MetS and its components. For the prospective analysis, we examined the association of dairy with incident hypertension (n=57 547 individuals free of hypertension) and diabetes (n=131 481 individuals free of diabetes) after 9.1 years of follow-up. The analysis of incident hypertension included fewer individuals because 64 978 individuals or 44% who had hypertension at baseline were no longer at risk for incident hypertension during follow-up. Of the 82 834 participants without baseline hypertension, 25 287 (30%) were excluded because blood pressure was not recorded in all participants during follow-up. The blood pressure measures during follow-up were carried out systematically in all participants in 16 countries or in a random 20% of participants in five countries. In the latter group of countries, the individuals without blood pressure measures during follow-up did not differ from individuals with blood pressure measures during follow-up (online appendix table S2).
Outcome definitions
The MetS was determined based on five component factors: (1) elevated blood pressure, (2) elevated waist circumference, (3) low HDL-C), (4) elevated blood triglycerides, and (5) elevated fasting blood glucose. Participants with at least three of the following five component factors were classified as having MetS at baseline.1
Elevated blood pressure: blood pressure lowering medication or systolic blood pressure (SBP)≥130 mm Hg, or diastolic blood pressure (DBP)≥85 mm Hg.
Elevated waist circumference: waist greater than 80 cm in women, and at least 94 cm in men (except among Asians or South Americans in whom a waist circumference of ≥90 cm was used).
Reduced HDL-C: HDL-C<1 mmol/dL (40 mg/dL) among men or HDL-C<1.3 mmol/L (50 mg/dL) among women.
Elevated triglycerides: triglycerides>1.7 mmmol/dL (150 mg/dL).
-
Elevated fasting blood glucose: fasting glucose≥5.5 mmol/L (100 mg/dL) or those on oral hypoglycemic agents.
Metabolic syndrome was defined as the presence of any three of the above five components.1
During follow-up, incident hypertension was defined as self-reported diagnosis of hypertension or prescribed antihypertensive medications, or having a SBP>140 mm Hg or a DBP>90 mm Hg.20 Incident diabetes was defined as self-reported diabetes, or prescribed an oral hypoglycemic agents, or having a fasting glucose of ≥7.0 mmol/L).21
Statistical analysis
Continuous variables were expressed as means (SD) and categorical variables as percentages. Education was categorized as none or primary school (first 6 years of age), secondary school (7–11 years of age), and college, trade school, or university (>11 years of age). Smoking status was categorized as never, former, or current. Physical activity was categorized based on the metabolic equivalent of task (MET) per min per week into low (<600 MET min per week), moderate (600–3000 MET min per week), and high (>3000 MET min per week) activity. The mean and median intakes of total dairy were calculated, overall and by geographical region. Participants were categorized into intake groups based on total dairy intakes of zero, less than one serving/day, one to two servings/day, and more than two servings/day (with the lowest intake group used as the reference). Categories for milk, yogurt, cheese, and butter consumption were zero, less than half a serving/day, half to one serving/day, and more than one serving/day. We used standard serving sizes for each dairy product. For example, a glass of milk or a cup of yogurt was 244 g, one slice of cheese was 15 g, and a teaspoon of butter was 5 g.19 In the cross-sectional analyses, we used multilevel mixed-effects linear regression models to calculate the adjusted mean SBP and DBP, waist circumference, blood lipids (LDL-C, HDL-C, triglycerides, apolipoprotein A, apolipoprotein B, ratio of apolipoprotein B to apolipoprotein A), and fasting glucose at baseline by category of dairy intake using multilevel mixed-effects linear regression models. Odds ratios were calculated to evaluate the associations between dairy intake and MetS, and each component of MetS (elevated blood pressure, low HDL-C, elevated waist circumference, elevated triglycerides, and elevated blood glucose) using logistic regression models. For models of each individual component of MetS except for waist circumference, we adjusted for age (continuous variable), sex, body mass index (continuous variable), smoking status, urban or rural residence, education, physical activity, energy intake, quintiles of fruits, vegetables, and percent energy from carbohydrate consumption, and study center (as a random intercept). The use of center as a random intercept takes into account clustering by country (which automatically adjusts for country, and more specifically, centers within each country). For waist circumference and MetS, we ran the same model but excluded body mass index, to avoid collinearity. When we evaluated intakes of starchy foods as a covariate in place of percent energy from carbohydrates, findings were not materially altered (online appendix table S3).
For the prospective data, we calculated hazard ratios using multivariable Cox frailty model with random intercepts to account for center clustering (which also adjusts for country) to evaluate the association of dairy intake with incident hypertension and incident diabetes. Multivariable models for incident hypertension and incident diabetes were adjusted for age (continuous variable), sex, body mass index (continuous variable), education, smoking status, urban or rural residence (location), physical activity, energy intake, quintiles of percent energy from carbohydrates, vegetable and fruit intake, and study center as random intercept. For incident diabetes, we additionally adjusted for family history of diabetes. The proportional hazards assumption was checked by visual inspection of log–log plots. We used restricted cubic-spline analyses to test for non-linearity of the association between dairy intake and incident diabetes. For significant non-linear associations, the p values for overall significance of the association is reported, whereas associations with no evidence of non-linearity were characterized by tests for linear trend.
Since the amount and types of dairy foods differ across world regions (eg, intake of dairy is highest in Europe and North America, South America and the Middle East, and lowest in China, South Asia, Southeast Asia, and Africa), we conducted subgroup analyses to examine associations between dairy and outcome events according to low versus high dairy intake regions. Additionally, we examined whether the associations were similar across seven geographical regions, among those consuming higher or lower levels of sodium or potassium and those consuming higher or lower servings of fruits and vegetables, as these factors may influence associations with MetS, hypertension, and diabetes. The likelihood ratio test was used to test for heterogeneity of associations across subgroups.
In sensitivity analyses, to assess the association between whole fat and low fat dairy intake with outcomes, participants were stratified based on the predominant type of dairy intake and four mutually exclusive groups were created. In our FFQs, the frequency of consumption as never or less than once per month was used as an indicator for food items never or rarely consumed. Therefore, whole fat dairy intake was defined as an intake of whole fat dairy of one serving or more per month and an intake of low fat dairy of less than one serving per month. Intake of more than one serving of low fat dairy per month and less than one serving of whole fat dairy per month was defined as low fat dairy intake. However, our study was underpowered to detect an association separately in this subgroup owing to a low number of participants in this particular group. Both low fat and whole fat dairy intakes were defined as intake of at least one serving of whole fat dairy and one serving of low fat dairy per month. Individuals whose intake of dairy was reported to be less than once per month or never were considered as having no intake. In each group, the lowest intake was used as the reference group. Models for whole dairy intake are adjusted for low fat dairy intake and vice versa.
For risk estimates showing relative risk decrease or increase of more than 10% (eg, HR<0.90 or >1.10) but with a non-significant p-value for trend, we considered estimates to be directionally associated with health outcomes. This magnitude threshold was used to reflect the strength of association expected for dietary exposures versus metabolic risk markers or outcomes, and would be of importance for population health. In tests for trend, we used the median dairy intake value in each of the categories of dairy intake and included the variable as a quantitative predictor.
Role of the funding source
The external funders of the study had no role in study design, data collection, analysis, interpretation, or writing of the report. The corresponding and senior authors had full access to all the data in the study and had final responsibility for the decision to submit for publication.
Results
Mean (±SD) total dairy intake was 179.0 (224.1) g/day, with whole fat dairy consumption almost twice as high as low fat dairy intake (124.6 vs 65.0 g/day) (table 1). Highest intakes of total dairy were found in Europe/North America, Middle East, and South America, while the lowest intakes were in South Asia, China, Africa, and Southeast Asia. Low fat dairy consumption was higher than whole fat dairy in North America and Europe, while other regions of the world consumed markedly higher whole fat than low fat dairy (table 1; online appendix table S4). There were also marked differences in body mass index, physical activity, and education among participants across regions, with body mass index being highest in the Middle East and South America, physical activity highest in South America, North America, and Europe, and a college education most common in North America and Europe.
Table 1.
Characteristics of the study participants at enrollment overall and by regions (n=147 812)*
| Overall (n=147 812) |
North America /Europe (n=19 712) | South America (n=23 717) | Africa (n=6187) |
Middle East (n=10 410) | South Asia (n=30 594) | Southeast Asia (n=11 713) | China (n=45 479) |
|
| Age (years), mean (SD) | 50.6 (9.9) | 52.8 (9.3) | 51.4 (9.7) | 49.9 (10.6) | 48.2 (9.4) | 48.4 (10.3) | 51.9 (9.9) | 51.0 (9.8) |
| Male (%) | 62 005 (41.9) | 8631 (43.8) | 9163 (38.6) | 1863 (30.1) | 4992 (47.9) | 13 439 (43.9) | 4886 (41.7) | 19 031 (41.8) |
| Urban (%) | 78 742 (53.20 | 13 614 (69.0) | 13 590 (57.3) | 3001 (48.5) | 5974 (57.4) | 14 815 (48.4) | 5685 (48.6) | 22 063 (48.5) |
| Body mass index (kg/m2), mean (SD) | 25.8 (5.3) | 28.0 (5.4) | 28.2 (5.5) | 26.3 (7.3) | 28.7 (5.5) | 23.0 (4.9) | 26.0 (5.0) | 24.6 (3.7) |
| Systolic blood pressure (mm Hg), mean (SD) | 131.3 (22.4) | 131.6 (20.9) | 132.1 (22.8) | 138.0 (27.0) | 125.6 (19.4) | 126.1 (21.3) | 136.5 (23.8) | 133.5 (22.4) |
| Diastolic blood pressure (mm Hg), mean (SD) | 81.9 (15.3) | 81.9 (12.5) | 83.1 (23.3) | 86.8 (15.7) | 78.4 (11.4) | 80.2 (12.9) | 81.4 (14.7) | 82.8 (13.2) |
| Waist circumference (cm), mean (SD) | 84.8 (13.7) | 90.6 (14.1) | 92.1 (13.3) | 83.5 (15.6) | 91.8 (13.1) | 78.4 (13.4) | 86.2 (12.3) | 81.1 (10.6) |
| HDL-C (mmol/L), mean (SD) | 1.20 (0.34) | 1.36 (0.37) | 1.19 (0.29) | 1.22 (0.42) | 1.09 (0.28) | 1.16 (0.35) | 1.19 (0.31) | 1.18 (0.31) |
| Triglycerides (mmol/L), mean (SD) | 1.54 (1.06) | 1.41 (0.86) | 1.89 (1.32) | 1.20 (0.78) | 1.70 (1.09) | 1.44 (0.93) | 1.73 (1.04) | 1.46 (1.03) |
| Blood glucose (mmol/L), mean (SD) | 5.34 (1.91) | 5.35 (1.35) | 5.19 (1.75) | 4.89 (2.61) | 5.72 (2.37) | 5.43 (2.64) | 5.37 (2.32) | 5.32 (1.51) |
| High physical activity (MET)† | 60,559/137,804 (43.9) | 9,802/18,328 (53.5) | 12,247/22,650 (54.1) | 1,541/3,685 (41.8) | 2,565/10,311 (24.9) | 11,777/26,926 (43.7) | 3,689/11,070 (33.3) | 18,938/44,834 (42.2) |
| Education status (%) | ||||||||
| Primary school | 42.8 | 22.0 | 59.1 | 63.9 | 49.3 | 51.2 | 40.4 | 34.1 |
| Secondary school | 37.8 | 27.9 | 24.0 | 34.0 | 31.3 | 35.0 | 45.8 | 51.1 |
| College | 19.4 | 50.2 | 16.9 | 2.1 | 19.4 | 13.9 | 13.8 | 14.8 |
| Energy intake (Kcal), mean (SD) | 2143 (816) | 2266 (833) | 2209 (797) | 2033 (950) | 2319 (829) | 2106 (826) | 2499 (1016) | 1964 (667) |
| Dairy intake (g/day), mean (SD) | ||||||||
| Total dairy | 179.0 (224.1) | 351.1 (272.9) | 264.4 (283.3) | 90.5 (114.5) | 296.5 (208.6) | 146.6 (187.7) | 35.6 (74.5) | 103.9 (140.1) |
| Whole fat dairy | 124.6 (174.7) | 156.8 (168.3) | 188.0 (248.3) | 85.7 (109.9) | 140.6 (140.9) | 138.6 (183.3) | 34.9 (73.9) | 92.8 (136.0) |
| Low fat dairy‡ | 65.0 (153.6) | 194.3 (240.5) | 76.4 (169.9) | 11.8 (32.2) | 94.9 (137.1) | 31.0 (74.7) | 1.5 (4.1) | 11.0 (48.0) |
| Milk | 105.7 (169.1) | 192.9 (232.3) | 196.3 (248.6) | 86.9 (111.3) | 87.3 (113.7) | 52.3 (96.1) | 35.0 (74.5) | 81.5 (16.5) |
| Yogurt | 66.2 (122.3) | 111.5 (145.3) | 48.5 (99.4) | 3.7 (13.6) | 185.2 (171.6) | 89.8 (139.2) | 0.24 (6.7) | 21.2 (58.8) |
| Cheese | 12.3 (25.5) | 42.1 (41.1) | 16.8 (24.1) | 0.7 (3.7) | 16.1 (13.3) | 2.7 (10.1) | 5.2 (7.6) | 1.1 (7.3) |
| Butter§ | 3.3 (25.4) | 3.4 (7.5) | 4.9 (42.1) | 0.3 (1.6) | 2.7 (5.7) | 2.3 (17.2) | 0.6 (1.1) | NA |
*We categorized countries into seven regions based on similarities in dietary patterns: China, South Asia (India, Bangladesh, and Pakistan), North America and Europe (Canada, Poland, and Sweden), South America (Argentina, Brazil, Chile, and Colombia), Middle East (Iran, occupied Palestine territory, Turkey, Saudi Arabia, and United Arab Emirates), South East Asia (Philippines and Malaysia), and Africa (Tanzania, South Africa, and Zimbabwe).
†High (>3000 MET per min per week); MET=metabolic equivalents.
‡Low fat dairy was not recorded in two centers in India (Trivandrum and Jaipur), Malaysia, and South Africa.
§Butter intake was not recorded in China, Malaysia, the occupied Palestinian territory, and Sweden.
HDL-C, high density lipoprotein cholesterol; NA, not available.
At baseline, 78 533 (56%) individuals had elevated blood pressure, 67 897 (48%) had elevated waist circumference, 63 415 (53%) had low HDL-C, 35 595 (30.2%) had elevated triglycerides, and 33 082 (27.8%) had elevated blood glucose. A total of 46 667 (41.3%) were classified as having MetS (table 1).
Dairy intake and prevalence of metabolic syndrome
Higher dairy intake (at least two servings/day vs zero intake) was associated with lower mean SBP and DBP, waist circumference, body mass index, triglycerides, ratio of triglycerides to HDL-C, and blood glucose, adjusting for covariates (table 2). No significant association between dairy intake and HDL-C levels was found, while LDL cholesterol (LDL-C) levels were higher. There was no significant association between dairy intake and other cardiovascular risk markers (table 2).
Table 2.
Mean (SE) blood pressure, blood lipid and glucose concentrations by total dairy intake (n=147 812)
| Outcome | Adjusted means (SE) | p-trend | |||
| 0 serving/day | 0.01–1 serving/day | 1.01–2 serving/day | >2 serving/day | ||
| Total dairy intake | |||||
| Systolic blood pressure (mm Hg) | 133.2 (0.74) | 131.8 (0.73) | 130.9 (0.74) | 130.3 (0.74) | <0.0001 |
| Diastolic blood pressure (mm Hg) | 83.8 (0.57) | 82.7 (0.56) | 82.2 (0.57) | 81.8 (0.57) | <0.0001 |
| Waist circumference (cm) | 85.8 (0.37) | 85.7 (0.36) | 85.5 (0.36) | 85.2 (0.37) | <0.0001 |
| Body mass index (kg/m2) | 26.8 (0.33) | 26.6 (0.32) | 26.6 (0.32) | 26.3 (0.33) | <0.0001 |
| HDL-C (mmol/L) | 1.21 (0.016) | 1.21 (0.016) | 1.21 (0.016) | 1.21 (0.016) | 0.133 |
| Triglyceride (mmol/L) | 1.55 (0.04) | 1.55 (0.03) | 1.53 (0.03) | 1.49 (0.04) | <0.0001 |
| Fasting glucose (mmol/L) | 5.33 (0.07) | 5.34 (0.07) | 5.30 (0.07) | 5.26 (0.07) | 0.001 |
| Total cholesterol (mmol/L) | 4.87 (0.05) | 4.91 (0.05) | 4.91 (0.05) | 4.89 (0.05) | 0.170 |
| LDL-C (mmol/L) | 3.03 (0.05) | 3.08 (0.05) | 3.08 (0.05) | 3.06 (0.05) | 0.03 |
| Total cholesterol to HDL-C ratio | 4.22 (0.06) | 4.25 (0.06) | 4.26 (0.06) | 4.24 (0.06) | 0.16 |
| Triglyceride to HDL-C ratio | 1.45 (0.04) | 1.44 (0.04) | 1.44 (0.04) | 1.40 (0.04) | 0.02 |
| ApoA1 (µmol/L) | 1.50 (0.02) | 1.50 (0.02) | 1.49 (0.02) | 1.49 (0.02) | 0.06 |
| ApoB (µmol/L) | 1.00 (0.01) | 1.02 (0.01) | 1.02 (0.01) | 1.00 (0.01) | 0.03 |
| ApoA to ApoB ratio | 0.70 (0.02) | 0.71 (0.01) | 0.71 (0.01) | 0.70 (0.01) | 0.59 |
Mean systolic and diastolic blood pressure were adjusted for age, sex, body mass index, blood pressure medication, smoking, location (urban/rural), education, physical activity, fruit and vegetable intake, percent energy from carbohydrates, energy and study center as random effect.
Mean waist circumferences was adjusted for age (continuous), sex, BMI (continuous), smoking, location (urban/rural), education, physical activity, energy intake, quintiles of fruits and vegetables, percent energy from carbohydrates consumption, and study center as random effect.
Mean body mass index was adjusted for age (continuous), sex, smoking, location (urban/rural), education, physical activity, energy intake, quintiles of fruits and vegetables, percent energy from carbohydrates consumption, and study center as random effect.
Mean HDL-C was adjusted for age (continuous), sex, body mass index (continuous), smoking, cholesterol and statin medication, location (urban/rural), education, physical activity, energy intake, quintiles of fruits and vegetables, percent energy from carbohydrates consumption, and study center as random effect.
Mean triglyceride was adjusted for age (continuous), sex, body mass index (continuous), smoking, statin medication, location (urban/rural), education, physical activity, energy intake, quintiles of fruits and vegetables, percent energy from carbohydrates consumption, and study center as random effect.
Mean fasting blood glucose was adjusted for age (continuous), sex, body mass index (continuous), smoking, diabetes medication, location (urban/rural), education, physical activity, energy intake, quintiles of fruits and vegetables, percent energy from carbohydrates consumption, and study center as random effect.
Mean total cholesterol, LDL-C, total cholesterol to HDL-C ratio, ApoA, ApoB, ApoA to ApoB ratio were adjusted for age, sex, body mass index, cholesterol medication, education, location (urban/rural), physical activity, energy intake, quintiles of fruits and vegetables, percent energy from carbohydrates consumption, and study center as random effect.
Apo, apolipoprotein; HDL-C, high density lipoprotein cholesterol; LDL-C, low density lipoprotein cholesterol.
Higher intakes of total dairy (OR 0.76, 95% CI 0.71 to 0.80, p-trend<0.0001), whole fat dairy alone (OR 0.72, 95% CI 0.66 to 0.78, p-trend<0.0001), and whole fat and low fat dairy consumed jointly (OR 0.89, 95% CI 0.80 to 0.98, p-trend=0.0005) were each associated with a lower prevalence of MetS, adjusting for covariates (figure 1). No association between low fat dairy and prevalence of MetS was found (OR 1.03, 95% CI 0.77 to 1.38).
Figure 1.
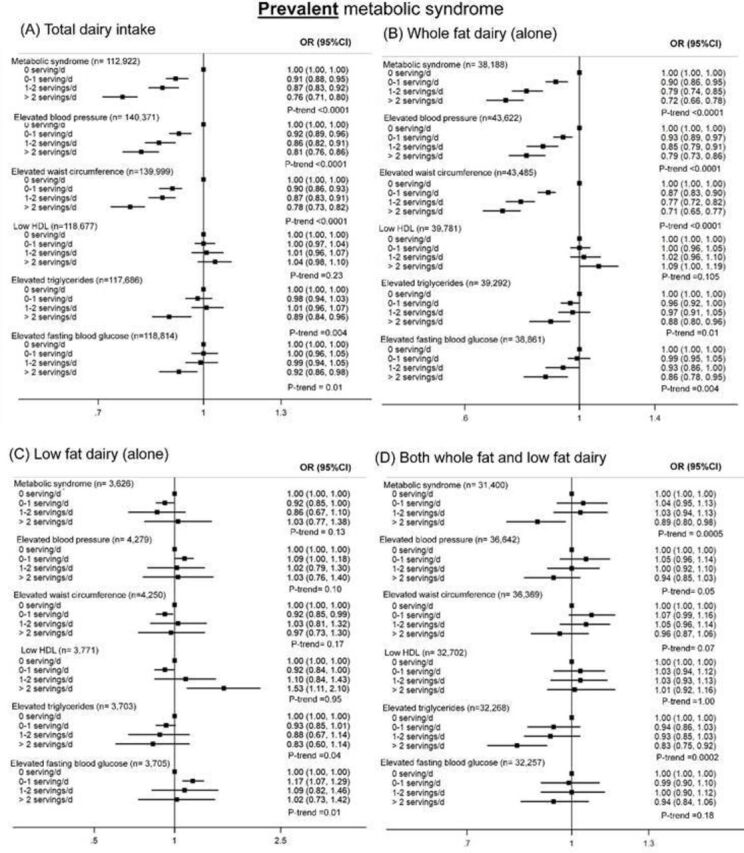
Association of (A) total dairy, (B) whole fat dairy alone, (C) low fat dairy alone and (D) among those who consumed both whole fat and low fat dairy with prevalent metabolic syndrome and its component (OR, 95% CI). Metabolic syndrome: defined as presence of any three of the four components: elevated blood pressure (defined as those on blood pressure lowering medication, or systolic blood pressure) ≥130 mm Hg or diastolic blood pressure (DBP) ≥85 mm Hg); elevated waist circumference (defined as women with waist >80 cm, men with waist ≥94 cm, except among Asians or South Americans in whom waist was ≥90 cm), reduced high density lipoprotein cholesterol (HDL-C) (defined as men on cholesterol lowering medications or with HDL-C<1 mmol/dL (40 mg/dL), or women with HDL-C<1.3 mmol/L (50 mg/dL)); elevated triglycerides (defined as triglyceride levels>1.7 mmmol/dL (150 mg/dL)); and elevated fasting blood glucose (defined as as those on glucose lowering medications or with a fasting glucose value ≥5.5 mmol/L). OR models for metabolic syndrome and waist circumference are adjusted for age (continuous), sex, smoking status, education, location, physical activity, energy intake, percent energy from carbohydrate, fruit and vegetable intake, and study center as random effect. Models for whole dairy intake are adjusted for low fat dairy intake and vice versa. OR model for elevated blood pressure, low HDL-C, elevated triglycerides and elevated fasting blood glucose are adjusted for age (continuous), sex, body mass index (continuous), smoking status, location, education, physical activity, energy intake, quintiles of percent energy from carbohydrate, fruit and vegetable intake, and study center as random effect. Models for whole dairy intake are adjusted for low fat dairy intake and vice versa. Panel (A) shows a significant inverse association between total dairy intake and metabolic syndrome and each of its components, except low HDL-C (no association); (B) shows a significant inverse association between whole fat dairy (alone) intake and metabolic syndrome, elevated blood pressure, elevated waist circumference, elevated triglycerides, and elevated fasting blood glucose. No association was observed between whole fat dairy and low HDL-C; (C) shows no association between low fat dairy (alone) intake and metabolic syndrome and its components, except elevated triglycerides and elevated fasting blood glucose (a trend towards lower prevalence); and (D) shows a significant inverse association between consumption of both whole fat and low fat dairy and metabolic syndrome, elevated blood pressure and elevated triglycerides, and no association with elevated waist circumference or HDL-C or elevated fasting blood glucose.
Total dairy and whole fat dairy, but not low fat dairy, were also associated with a lower prevalence of most MetS components, including elevated blood pressure, elevated waist circumference, elevated triglycerides, and elevated blood glucose. No significant association was found for low HDL-C with total, whole fat or low fat dairy (figure 1).
With mutual adjustment of whole fat dairy and low fat dairy, higher whole fat dairy intake was associated with lower prevalence of MetS. By contrast, higher intake of low fat dairy was associated with a modestly higher prevalence of MetS (p-trend=0.05) and low HDL-C (p-trend=0.001), but also with a marginally lower prevalence of elevated triglycerides (p-trend=0.04) (online appendix table S5). Types of dairy foods (milk, yogurt, cheese, and butter) showed similar associations with lower MetS prevalence (online appendix figure S1).
The associations between dairy intake and MetS were consistent in regions with low dairy intake (China, South Asia, Southeast Asia, and Africa) and high dairy intake (North America/Europe, Middle East, and South America), but the magnitude of the association was stronger in the low dairy regions (p for heterogeneity=0.017) (online appendix figure S2). The association between dairy intake and MetS was independent of sodium and potassium intake (online appendix figure S3).
Dairy intake and risk of incident hypertension and diabetes
Of the 57 547 individuals without hypertension at baseline, a total of 13 640 (23.7%) people with incident hypertension were identified during follow-up. A total of 5351 (4.1%) people with incident diabetes were identified during follow-up among the 131 481 individuals without diabetes.
Higher dairy intake (at least two servings/day vs zero intake) was associated with a lower incidence of hypertension (HR 0.89, 95% CI 0.82 to 0.97, Pp-trend=0.02) (figure 2) with directionally similar estimates found for whole fat and low fat dairy.
Figure 2.

Associations of (A) total dairy, (B) whole fat dairy alone, (C) low fat dairy alone, and (D) both whole fat and low fat dairy with incident hypertension and incident diabetes (HR, 95% CI). Incident hypertension was defined as self-reported hypertension, with or without use of antihypertensive medications or a systolic blood pressure of >140 mm Hg, or a diastolic blood pressure of >90 mm Hg.10 Incident diabetes was defined as self-reported diabetes, with or without use of oral hypoglycemic agents or insulin, or having a documented fasting glucose level of ≥7.0 mmol/L.11 Hypertension model adjusted for age (continuous), sex, body mass index (continuous), education, smoking status, location, physical activity, energy, quintiles of percent energy from carbohydrates, fruit and vegetable intake and study center as random effect. Models for whole dairy intake adjusted for low fat dairy intake and vice versa. Diabetesmodel adjusted for age (continuous), sex, body mass index (continuous), education, smoking status, location, family history of diabetes, physical activity, energy, quintiles of percent energy from carbohydrates, fruit and vegetable intake, and study center as random effect. Models for whole dairy intake are adjusted for low fat dairy intake and vice versa. Panel (A) shows a significant inverse association between total dairy and incident hypertension and a trend towards lower incidence of diabetes; (B) shows a trend towards lower incidence of hypertension and diabetes with higher intake of whole fat dairy (alone); (C) shows no association between low fat dairy intake (alone) and incident hypertension and incident diabetes; and (D) shows a trend towards lower incidence of hypertension and diabetes with higher intake of both whole fat and low fat dairy.
For diabetes, higher dairy intake (at least two servings/day vs zero intake) was associated with a lower diabetes incidence (HR 0.88, 95% CI 0.76 to 1.02, p-trend=0.01) (figure 2) with directionally similar estimates with whole fat dairy (alone or with low fat) but not with low fat dairy alone.
When we used more than three servings/day as the highest intake category (instead of more than two servings/day), we found similar estimates of association (for hypertension, HR 0.87,; 95% CI 0.79 to 0.96, p-trend=0.02; and for diabetes, HR 0.86, 95% CI 0.73 to 1.02;, p-trend=0.01).
When we evaluated whole fat dairy intake and low fat dairy intake jointly adjusted for each other, higher whole fat dairy intake was significantly associated with a lower incidence of hypertension and diabetes. In contrast, no significant associations were found for low fat dairy versus hypertension or diabetes (online appendix table S5).
The associations between types of dairy (milk, yogurt, cheese, and butter) showed directionally similar results with incident hypertension and incident diabetes (online appendix figure S4).
Discussion
In this large multinational prospective cohort study from 21 countries located in five continents, higher dairy consumption was associated with lower mean blood pressure, waist circumference, triglycerides, and blood glucose. Additionally, total dairy and whole fat dairy intakes were associated with lower risk of MetS and its components. A similar pattern of results was found in those consuming diets that may influence blood pressure, such as those with higher or lower levels of sodium and potassium, or varying levels of fruit and vegetable intake. During follow-up of nine years, higher consumption of dairy was associated with lower risk of incident hypertension and incident diabetes. These results were clearer in those who consumed whole fat dairy than in those who consumed low fat dairy.
Short-term feeding trials showed a reduction in blood pressure with both low and whole fat dairy, and a reduction in triglycerides with whole fat,6 7 22 but the evidence for fasting blood glucose in these trials is inconsistent or inconclusive.8 9 Our results showed directionally consistent inverse associations between consumption of various types of dairy foods (milk, yogurt, cheese, or butter) and MetS, especially for intake of whole fat dairy. Our findings are consistent with recent meta-analyses of cohort studies of mostly Western and higher-income Asian populations (~10% lower risk of MetS per one serving increase in dairy).11 23–25 Further, in these meta-analyses the associations were clearer for whole fat dairy (RR 0.78, 95% CI 0.61 to 0.96), while no association was observed for low fat dairy and MetS,11 which is consistent with our findings. In addition, a recent cohort study in Brazil found similar results.26
Our finding of a favorable association between butter and prevalence of MetS should be interpreted with caution, given that butter intake was very low (mean 3.3 g/day). It is also noteworthy that butter was not included as one of the dairy products in the total dairy definition in our analyses, and so even if the association of butter with lower MetS is due to chance, the results on total dairy are robust.
In prospective analyses, we identified a significant inverse association between dairy intake and incident hypertension, which is consistent with a recent meta-analysis of cohort studies in mostly Western and some Asian populations,5 12 23 27 two short-term controlled feeding trials of dairy intake and blood pressure,6 7 and our prior report of lower risk of stroke with higher dairy consumption.28 Cohort studies in the US and Europe have found an association with lower risk of hypertension with higher dairy intake, especially yogurt.29 30 On the other hand, recent Mendelian randomization studies did not show that dairy intake is associated with lower hypertension.31 Taken together, dairy foods should be evaluated in large randomized trials of dairy intake and longer term blood pressure change or risk of hypertension.
Our findings of an inverse association of total dairy and different types of dairy products with incident diabetes are consistent with most32–34 but not all35 previous meta-analyses. The meta-analysis by Chen et al35 represented mostly high-income countries and more homogeneous populations, whereas PURE covers substantially more diverse populations and broad patterns of diet globally. Further, high income countries consume higher amounts of dairy (mainly low fat) than other parts of the world. The background diet also varies across countries, whereby in high income countries the major problem is over nutrition, while in low income countries, there is more under nutrition and people consume low amounts of dairy and a higher amount of refined carbohydrates. Therefore, the findings from a previous meta-analysis may not be applicable to other parts of the world, although our findings were robust in different populations with varying levels of dairy intake. In a recent meta-analysis, blood fatty acids commonly found in dairy foods were associated with lower diabetes risk.36 However, a recent Mendelian randomization study did not find support for an association of milk intake with diabetes risk.37 Collectively, the evidence suggests a need for large randomized trials of dairy intake, including an evaluation of different types of dairy (fermented vs non-fermented) and fat content (whole fat vs low fat) in relation to incident diabetes.
Possible pathways for metabolic benefits of dairy include angiotensin converting enzyme, peroxisome proliferator activated receptors, hepatic de novo lipogenesis, hepatic and adipose fatty acid oxidation, and inflammation.10 Further, bioactive peptides or amino acids produced through yogurt or cheese fermentation improves insulin sensitivity, while branched chain amino acids in whey has been shown to improve postprandial insulin response.38
Our study is among the first large multinational cohort studies to examine the association of dairy intake with prevalence of MetS and risk of diabetes and hypertension. We used standardized methods to measure diet using country specific validated FFQs and standardized methods to obtain information on health measures and record new cases of hypertension and diabetes during follow-up.
There are some potential limitations. First, diet was self-reported and variations in reporting might lead to random errors that could dilute real associations between dairy intake and health outcomes. Further, misclassification of dairy intake cannot be ruled out as we did not have repeat measures of diet. However, we found that the association between milk intake, recorded at three years of follow-up, and cardiovascular disease was similar to the analyses using the baseline information,19 indicating that repeat dietary measures are unlikely to alter our findings. Second, we could not assess incident MetS as several of its components (waist circumference, blood glucose, and blood lipids) were assessed in only a random 20% of the study population during follow-up. For the analyses of dairy versus incident hypertension, 25 287 individuals were excluded because blood pressure was not recorded in all participants during follow-up. The blood pressure measures during follow-up were carried out systematically in all participants in 16 countries or in a random 20% of participants in five countries. The characteristics of individuals without blood pressure measures during follow-up compared with individuals with blood pressure measures during follow-up were similar (online appendix table S2). Third, the possibility of residual confounding cannot be completely ruled out in observational studies (eg, dairy intake might be a proxy for poverty or access to healthcare). However, our results persisted despite extensive adjustments for all known confounders, including the use of five markers of socioeconomic status (education, wealth, occupation, urban/rural location, and geographical location). Additionally, we adjusted for study center as a random effect, which takes into account socioeconomic factors and clustering by community, leading to comparisons within countries (see supplemental methods in the online supplementary appendix). Lastly, the impact of higher dairy intake may be influenced by the overall diet, even though analyses are adjusted for multiple dietary confounders and conducted within different strata. However, the consistency of results across regions with markedly different levels of dairy intake makes it less likely that confounders including the background diet, which are expected to vary in different regions, explain our observations.
In conclusion, we report that intake of dairy products, especially whole fat products, is associated with lower prevalence of MetS and its individual components at baseline, and a lower risk of hypertension and diabetes during follow-up. If our findings are confirmed in sufficiently large and long term trials, then increasing dairy consumption may represent a feasible and low cost approach to reducing MetS, hypertension, diabetes, and ultimately cardiovascular disease events worldwide.
Acknowledgments
PURE Project Office Staff, National Coordinators, Investigators, and Key Staff. Project office (Population Health Research Institute, Hamilton Health Sciences and McMaster University, Hamilton, Canada): S Yusuf* (Principal Investigator). S Rangarajan (Program Manager); K K Teo, S S Anand, C K Chow, M O’Donnell, A Mente, D Leong, A Smyth, P Joseph, M Duong, O Kurmi, R D’Souza, M Walli-Attaei, B Balaji, R Naito, S Islam (Statistician), W Hu (Statistician), C Ramasundarahettige (Statistician), P Sheridan (Statistician), S Bangdiwala, L Dyal, M Dehghan (Nutrition Epidemiologist), A Aliberti, A Reyes, A Zaki, B Connolly, B Zhang, D Agapay, D Krol, E McNeice, E Ramezani, F Shifaly, G McAlpine, I Kay, J Rimac, J Swallow, M Di Marino, M Jakymyshyn, M(a) Mushtaha, M(o) Mushtaha, M Trottier, N Aoucheva, N Kandy, P Mackie, R Buthool, R Patel, R Solano, S Gopal, S Ramacham, S Trottier. Core Laboratories: G Pare, M McQueen, S Lamers, J Keys (Hamilton), X Wang (Beijing, China), A Devanath (Bangalore, India). Argentina: R Diaz*, A Orlandini, P Lamelas, M L Diaz, A Pascual, M Salvador, C Chacon; Bangladesh: O Rahman*, R Yusuf*, S A K S Ahmed, T Choudhury, M Sintaha, A Khan, O Alam, N, Nayeem, S N Mitra, S Islam, F Pasha; Brazil: A Avezum*, C S Marcilio, A C Mattos, G B Oliveira; Canada: K Teo*, S Yusuf*, Sumathy Rangarajan, A Arshad, B Bideri, I Kay, J Rimac, R Buthool, S Trottier, G Dagenais, P Poirier, G Turbide, A S Bourlaud, A LeBlanc De Bluts, M Cayer, I Tardif, M Pettigrew, S Lear, V de Jong, A N Saidy, V Kandola, E Corber, I Vukmirovich, D Gasevic, A Wielgosz, A Pipe, A Lefebvre, A Pepe, A Auclair, A Prémont, A S Bourlaud; Chile: F Lanas*, P Serón, M J Oliveros, F Cazor, Y Palacios; China: Li Wei*, Liu Lisheng*, Bo Jian, Hu Bo, Yin Lu, Zhao Wenhua, Zhang Hongye, Jia Xuan, Sun Yi, Wang Xingyu, Zhao Xiuwen, He Xinye, Chen Tao, Chen Hui, Chang Xiaohong, Deng Qing, Cheng Xiaoru, Deng Qing, Xie Liya, Liu Zhiguang, Li Juan, Li Jian, Liu Xu, Ren Bing, Sun Yi, Wang Wei, Wang Yang, Yang Jun, Zhai Yi, Zhang Hongye, Zhao Xiuwen, Zhu Manlu, Lu Fanghong, Wu Jianfang, Li Yindong, Hou Yan, Zhang Liangqing, Guo Baoxia, Liao Xiaoyang, Zhang Shiying, BianRongwen, TianXiuzhen, Li Dong, Chen Di, Wu Jianguo, Xiao Yize, Liu Tianlu, Zhang Peng, Dong Changlin, Li Ning, Ma Xiaolan, Yang Yuqing, Lei Rensheng, Fu Minfan, He Jing, Liu Yu, Xing Xiaojie, Zhou Qiang; Colombia: P Lopez-Jaramillo*, P A Camacho-Lopez, M Perez, J Otero-Wandurraga, D I Molina, C Cure-Cure, J L Accini, E Hernandez, E Arcos, C Narvaez, A Sotomayor, F Manzur, H Garcia, G Sanchez, F Cotes, A Rico, M Duran, C Torres; India: Bangalore - P Mony *, M Vaz*, S Swaminathan, A V Bharathi, K Shankar, A V Kurpad, K G Jayachitra, H A L Hospital, A R Raju, S Niramala, V Hemalatha, K Murali, C Balaji, A Janaki, K Amaranadh, P Vijayalakshmi, Chennai - V Mohan*, R M Anjana, M Deepa, K Parthiban, L Dhanasekaran, S K Sundaram, M Rajalakshmi, P Rajaneesh, K Munusamy, M Anitha, S Hemavathy, T Rahulashankiruthiyayan, D Anitha, R Dhanasekar, S Sureshkumar, D Anitha, K Sridevi, Jaipur - R Gupta, R B Panwar, I Mohan, P Rastogi, S Rastogi, R Bhargava, M Sharma, D Sharma, Trivandrum - V Raman Kutty, K Vijayakumar, V Ambili, Arunlal A R Nair, K Ajayan, G Rajasree, A R Renjini, A Deepu, B Sandhya, S Asha, H S Soumya, Chandigarh- R Kumar, M Kaur, P V M Lakshmi, V Sagar J S Thakur, B Patro, R Mahajan, A Josh, G Singh, K Sharma, P Chaudary, Iran: R Kelishadi*, A Bahonar, N Mohammadifard, H Heidari, Kazakhstan: K Davletov*, B Assembekov, B Amirov; Kyrgyzstan: E Mirrakhimov*, S Abilova, U Zakirov, U Toktomamatov; Malaysia: UiTM - K Yusoff*, T S Ismail, K Ng, A Devi, N Mat-Nasir, A S Ramli, M N K Nor-Ashikin, R Dasiman, M Y Mazaouspavina, F Ariffin, M Miskan, H Abul-Hamid, S Abdul-Razak, N Baharudin, N M N Mohd-Nasir, S F Badlishah-Sham, M Kaur, M Koshy, F A Majid, N A Bakar, N Zainon, R Salleh, SR Norlizan, N M Ghazali, M Baharom, H Zulkifli, R Razali, S Ali, C W J C W Hafar, F Basir; UKM - Noorhassim Ismail, M J Hasni, M T Azmi, M I Zaleha, R Ismail, K Y Hazdi, N Saian, A Jusoh, N Nasir, A Ayub, N Mohamed, A Jamaludin, Z Rahim; Occupied Palestinian Territory: R Khatib*, U Khammash, R Giacaman; Pakistan: R Iqbal*, R Khawaja, I Azam, K Kazmi; Peru: J Miranda*, A Bernabe Ortiz, W Checkley, R H Gilman, L Smeeth, R M Carrillo, M de los Angeles, C Tarazona Meza; Philippines: A Dans*, H U Co, J T Sanchez, L Pudol, C Zamora-Pudol, L A M Palileo-Villanueva, M R Aquino, C Abaquin, S L Pudol, K Manguiat, S Malayang; Poland: W Zatonski*, A Szuba, K Zatonska, R Ilow#, M Ferus, B Regulska-Ilow, D Różańska, M Wolyniec; Saudi Arabia: K F AlHabib*, M Alshamiri, H B Altaradi, O Alnobani, N Alkamel, M Ali, M Abdulrahman, R Nouri; South Africa: L Kruger*, A Kruger#, P Bestra, H Voster, A E Schutte, E Wentzel-Viljoen, F C Eloff, H de Ridder, H Moss, J Potgieter, A Roux, M Watson, G de Wet, A Olckers, J C Jerling, M Pieters, T Hoekstra, T Puoane, R Swart*, E Igumbor, L Tsolekile, K Ndayi, D Sanders, P Naidoo, N Steyn, N Peer, B Mayosi#, B Rayner, V Lambert, N Levitt, T Kolbe-Alexander, L Ntyintyane, G Hughes, J Fourie, M Muzigaba, S Xapa, N Gobile, K Ndayi, B Jwili, K Ndibaza, B Egbujie; Sweden A Rosengren*, K Bengtsson Boström, A Rawshani, A Gustavsson, M Andreasson, L Wirdemann; Tanzania: K Yeates*, M Oresto, N West Turkey: A Oguz*, N Imeryuz, Y Altuntas, S Gulec, A Temizhan, K Karsidag, K B T Calik, A K Akalin, O T Caklili, M V Keskinler, K Yildiz; United Arab Emirates: A H Yusufali, F Hussain, M H S Abdelmotagali, D F Youssef, O Z S Ahmad, F H M Hashem, T M Mamdouh, F M AbdRabbou, S H Ahmed, M A AlOmairi, H M Swidan, M Omran, N A Monsef; Zimbabwe: J Chifamba*, T Ncube, B Ncube, C Chimhete, G K Neya, T Manenji, L Gwaunza, V Mapara, G Terera, C Mahachi, P Murambiwa, R Mapanga, A Chinhara (*National coordinator, #deceased).
Footnotes
Contributors: BB and MD designed the present study. BB performed its statistical analysis, and wrote the first draft of the manuscript. SY designed the present study, conceived and initiated the overall Prospective Urban Rural Epidemiology (PURE) study, supervised its conduct and data analysis, and provided critical comments on all drafts of the manuscript. MD and AM reviewed and provided critical comments on drafts. SR coordinated the worldwide PURE study and reviewed and commented on drafts. All other authors coordinated the study and collected the data in their respective countries and provided comments on drafts of the manuscript.
Funding: The study was mainly funded by the Population Health Research Institute (PHRI). SY is supported by the Mary W Burke endowed chair of the Heart and Stroke Foundation of Ontario. The PURE study is an investigator-initiated study that is funded by the Population Health Research Institute, Hamilton Health Sciences Research Institute (HHSRI), the Canadian Institutes of Health Research, Heart and Stroke Foundation of Ontario, Support from Canadian Institutes of Health Research’s Strategy for Patient Oriented Research, through the Ontario SPOR Support Unit, as well as the Ontario Ministry of Health and Long-Term Care and through unrestricted grants from several pharmaceutical companies (with major contributions from AstraZeneca (Canada), Sanofi-Aventis (France and Canada), Boehringer Ingelheim (Germany and Canada), Servier, and GlaxoSmithKline), and additional contributions from Novartis and King Pharma and from various national or local organizations in participating countries. These include: Argentina: Fundacion ECLA (Estudios Clínicos Latino America); Bangladesh: Independent University, Bangladesh and Mitra and Associates; Brazil: Unilever Health Institute, Brazil; Canada: this study was supported by an unrestricted grant from Dairy Farmers of Canada and the National Dairy Council (US), Public Health Agency of Canada and Champlain Cardiovascular Disease Prevention Network; Chile: Universidad de la Frontera; China: National Center for Cardiovascular Diseases and ThinkTank Research Center for Health Development; Colombia: Colciencias (grant 6566-04-18062 and grant 6517-777-58228); India: Indian Council of Medical Research; Malaysia: Ministry of Science, Technology and Innovation of Malaysia (grant number: 100-IRDC/BIOTEK 16/6/21 (13/2007), and 07–05-IFN-BPH 010), Ministry of Higher Education of Malaysia (grant number: 600-RMI/LRGS/5/3 (2/2011)), Universiti Teknologi MARA, Universiti Kebangsaan Malaysia (UKM-Hejim-Komuniti-15–2010); occupied Palestinian territory: the United Nations Relief and Works Agency for Palestine Refugees in the Near East, occupied Palestinian territory; International Development Research Centre, Canada; Philippines: Philippine Council for Health Research and Development; Poland: Polish Ministry of Science and Higher Education (grant number: 290/W-PURE/2008/0), Wroclaw Medical University; Saudi Arabia: Saudi Heart Association, Saudi Gastroenterology Association, Dr. Mohammad Alfagih Hospital, The Deanship of Scientific Research at King Saud University, Riyadh, Saudi Arabia (Research group number: RG −1436–013); South Africa: The North-West University, SA and Netherlands Programme for Alternative Development, National Research Foundation, Medical Research Council of South Africa, The South Africa Sugar Association, Faculty of Community and Health Sciences; Sweden: grants from the Swedish state under the Agreement concerning research and education of doctors; the Swedish Heart and Lung Foundation; the Swedish Research Council; the Swedish Council for Health, Working Life and Welfare, King Gustaf V:s and Queen Victoria Freemason’s Foundation, AFA Insurance; Turkey: Metabolic Syndrome Society, AstraZeneca, Sanofi Aventis; United Arab Emirates: Sheikh Hamdan Bin Rashid Al Maktoum Award For Medical Sciences and Dubai Health Authority, Dubai.
Disclaimer: The external funders and sponsors had no role in the design and conduct of the study; in the collection, analysis, and interpretation of the data; in the preparation, review, or approval of the manuscript; or in the decision to submit the manuscript for publication.
Competing interests: None declared.
Patient consent for publication: Not required.
Provenance and peer review: Not commissioned; externally peer reviewed.
Data availability statement: No data are available. The PURE study is a large international prospective cohort study that is still ongoing. Data are not publicly available at this time.
References
- 1.Alberti KGMM, Eckel RH, Grundy SM, et al. Harmonizing the metabolic syndrome: a joint interim statement of the International diabetes Federation Task force on epidemiology and prevention; National heart, lung, and blood Institute; American heart association; world heart Federation; international atherosclerosis Society; and international association for the study of obesity. Circulation 2009;120:1640–5. 10.1161/CIRCULATIONAHA.109.192644 [DOI] [PubMed] [Google Scholar]
- 2.Hu FB. Globalization of diabetes: the role of diet, lifestyle, and genes. Diabetes Care 2011;34:1249–57. 10.2337/dc11-0442 [DOI] [PMC free article] [PubMed] [Google Scholar]
- 3.Hu FB, Manson JE, Stampfer MJ, et al. Diet, lifestyle, and the risk of type 2 diabetes mellitus in women. N Engl J Med 2001;345:790–7. 10.1056/NEJMoa010492 [DOI] [PubMed] [Google Scholar]
- 4.Willett W, Manson J, Liu S. Glycemic index, glycemic load, and risk of type 2 diabetes. Am J Clin Nutr 2002;76:274S–80. 10.1093/ajcn/76.1.274S [DOI] [PubMed] [Google Scholar]
- 5.Drouin-Chartier J-P, Brassard D, Tessier-Grenier M, et al. Systematic review of the association between dairy product consumption and risk of Cardiovascular-Related clinical outcomes. Adv Nutr 2016;7:1026–40. 10.3945/an.115.011403 [DOI] [PMC free article] [PubMed] [Google Scholar]
- 6.Appel LJ, Moore TJ, Obarzanek E, et al. A clinical trial of the effects of dietary patterns on blood pressure. N Engl J Med Overseas Ed 1997;336:1117–24. 10.1056/NEJM199704173361601 [DOI] [PubMed] [Google Scholar]
- 7.Chiu S, Bergeron N, Williams PT, et al. Comparison of the DASH (dietary approaches to stop hypertension) diet and a higher-fat DASH diet on blood pressure and lipids and lipoproteins: a randomized controlled trial. Am J Clin Nutr 2016;103:341–7. 10.3945/ajcn.115.123281 [DOI] [PMC free article] [PubMed] [Google Scholar]
- 8.Struijk EA, Heraclides A, Witte DR, et al. Dairy product intake in relation to glucose regulation indices and risk of type 2 diabetes. Nutr Metab Cardiovasc Dis 2013;23:822–8. 10.1016/j.numecd.2012.05.011 [DOI] [PubMed] [Google Scholar]
- 9.Kalergis M, Yinko S, Nedelcu R. Dairy products and prevention of type 2 diabetes: implications for research and practice. Front Endocrinol (Lausanne), 2013. [DOI] [PMC free article] [PubMed] [Google Scholar]
- 10.Mozaffarian D, Wu JHY. Flavonoids, dairy foods, and cardiovascular and metabolic health. Circ Res 2018;122:369–84. 10.1161/CIRCRESAHA.117.309008 [DOI] [PMC free article] [PubMed] [Google Scholar]
- 11.Lee M, Lee H, Kim J. Dairy food consumption is associated with a lower risk of the metabolic syndrome and its components : a systematic review and meta-analysis. Br J Nutr 2016;2018:1–12. [DOI] [PubMed] [Google Scholar]
- 12.Soedamah-Muthu SS, Verberne LDM, Ding EL, et al. Dairy consumption and incidence of hypertension. Hypertension 2012;60:1131–7. 10.1161/HYPERTENSIONAHA.112.195206 [DOI] [PubMed] [Google Scholar]
- 13.Yusuf S, Islam S, Chow CK, et al. Use of secondary prevention drugs for cardiovascular disease in the community in high-income, middle-income, and low-income countries (the pure study): a prospective epidemiological survey. Lancet 2011;378:1231–43. 10.1016/S0140-6736(11)61215-4 [DOI] [PubMed] [Google Scholar]
- 14.Teo K, Lear S, Islam S, et al. Prevalence of a healthy lifestyle among individuals with cardiovascular disease in high-, middle- and low-income countries: the prospective urban rural epidemiology (pure) study. JAMA 2013;309:1613. 10.1001/jama.2013.3519 [DOI] [PubMed] [Google Scholar]
- 15.Mente A, O'Donnell MJ, Rangarajan S, et al. Association of urinary sodium and potassium excretion with blood pressure. N Engl J Med 2014;371:601–11. 10.1056/NEJMoa1311989 [DOI] [PubMed] [Google Scholar]
- 16.Mente A, Dehghan M, Rangarajan S, et al. Prospective urban rural epidemiology (pure) study Investigators. Association of dietary nutrients with blood lipids and blood pressure in 18 countries: a cross-sectional analysis from the pure study. Lancet Diabetes Endocrinol 2017;5:774–87. [DOI] [PubMed] [Google Scholar]
- 17.Dehghan M, Mente A, Zhang X, et al. Associations of fats and carbohydrate intake with cardiovascular disease and mortality in 18 countries from five continents (pure): a prospective cohort study. Lancet 2017;390:2050–62. 10.1016/S0140-6736(17)32252-3 [DOI] [PubMed] [Google Scholar]
- 18.Miller V, Mente A, Dehghan M, et al. Fruit, vegetable, and legume intake, and cardiovascular disease and deaths in 18 countries (pure): a prospective cohort study. Lancet 2017;390:2037–49. 10.1016/S0140-6736(17)32253-5 [DOI] [PubMed] [Google Scholar]
- 19.Dehghan M, Mente A, Rangarajan S, et al. Association of dairy intake with cardiovascular disease and mortality in 21 countries from five continents (pure): a prospective cohort study. Lancet 2018;392:2288–97. 10.1016/S0140-6736(18)31812-9 [DOI] [PubMed] [Google Scholar]
- 20.Chobanian AV, Bakris GL, Black HR, et al. The seventh report of the joint National Committee on prevention, detection, evaluation, and treatment of high blood pressure: the JNC 7 report. JAMA 2003;289:2560. 10.1001/jama.289.19.2560 [DOI] [PubMed] [Google Scholar]
- 21.American Diabetes Association Standards of medical care in diabetes. Diabetes Care 2018;41:S137–43. [DOI] [PubMed] [Google Scholar]
- 22.Turner KM, Keogh JB, Clifton PM. Red meat, dairy, and insulin sensitivity: a randomized crossover intervention study. Am J Clin Nutr 2015;101:1173–9. 10.3945/ajcn.114.104976 [DOI] [PubMed] [Google Scholar]
- 23.Ralston RA, Lee JH, Truby H, et al. A systematic review and meta-analysis of elevated blood pressure and consumption of dairy foods. J Hum Hypertens 2012;26:3–13. 10.1038/jhh.2011.3 [DOI] [PubMed] [Google Scholar]
- 24.Chen G-C, Szeto IMY, Chen L-H, et al. Dairy products consumption and metabolic syndrome in adults: systematic review and meta-analysis of observational studies. Sci Rep 2015;5:14606 10.1038/srep14606 [DOI] [PMC free article] [PubMed] [Google Scholar]
- 25.Kim Y, Je Y. Dairy consumption and risk of metabolic syndrome: a meta-analysis. Diabet Med 2016;33:428–40. 10.1111/dme.12970 [DOI] [PubMed] [Google Scholar]
- 26.Drehmer M, Pereira MA, Schmidt MI, et al. Total and full-fat, but not low-fat, dairy product intakes are inversely associated with metabolic syndrome in adults. J Nutr 2016;146:81–9. 10.3945/jn.115.220699 [DOI] [PubMed] [Google Scholar]
- 27.Talaei M, Pan A, Yuan J-M, et al. Dairy food intake is inversely associated with risk of hypertension: the Singapore Chinese Health study. J Nutr 2017;147:235–41. 10.3945/jn.116.238485 [DOI] [PMC free article] [PubMed] [Google Scholar]
- 28.Dehghan M, Mente A, Rangarajan S, et al. Association of dairy intake with cardiovascular disease and mortality in 21 countries from five continents (pure): a prospective cohort study. Lancet 2018;392:2288–97. 10.1016/S0140-6736(18)31812-9 [DOI] [PubMed] [Google Scholar]
- 29.Buendia JR, Li Y, Hu FB, et al. Long-Term yogurt consumption and risk of incident hypertension in adults. J Hypertens 2018;36:1 10.1097/HJH.0000000000001737 [DOI] [PMC free article] [PubMed] [Google Scholar]
- 30.Engberink MF, Hendriksen MAH, Schouten EG, et al. Inverse association between dairy intake and hypertension: the Rotterdam study. Am J Clin Nutr 2009;89:1877–83. 10.3945/ajcn.2008.27064 [DOI] [PubMed] [Google Scholar]
- 31.Ding M, Huang T, Bergholdt HKM, et al. Dairy consumption, systolic blood pressure, and risk of hypertension: Mendelian randomization study. BMJ 2017;356:j1000. 10.1136/bmj.j1000 [DOI] [PMC free article] [PubMed] [Google Scholar]
- 32.Sluijs I, Forouhi NG, Beulens JWJ, et al. The amount and type of dairy product intake and incident type 2 diabetes : results from the EPIC-InterAct Study 1 – 3. Am J Clin Nutr 2012;96:1–9. [DOI] [PubMed] [Google Scholar]
- 33.Gijsbers L, Ding EL, Malik VS, et al. Consumption of dairy foods and diabetes incidence: a dose-response meta-analysis of observational studies. Am J Clin Nutr 2016;103:1111–24. 10.3945/ajcn.115.123216 [DOI] [PubMed] [Google Scholar]
- 34.Talaei M, Pan A, Yuan J-M, et al. Dairy intake and risk of type 2 diabetes. Clin Nutr 2018;37:712–8. 10.1016/j.clnu.2017.02.022 [DOI] [PMC free article] [PubMed] [Google Scholar]
- 35.Chen M, Sun Q, Giovannucci E, et al. Dairy consumption and risk of type 2 diabetes: 3 cohorts of US adults and an updated meta-analysis. BMC Med 2014;12:1–14. 10.1186/s12916-014-0215-1 [DOI] [PMC free article] [PubMed] [Google Scholar]
- 36.Imamura F, Fretts A, Marklund M, et al. Fatty acid biomarkers of dairy fat consumption and incidence of type 2 diabetes: a pooled analysis of prospective cohort studies. PLoS Med 2018;15:e1002670 10.1371/journal.pmed.1002670 [DOI] [PMC free article] [PubMed] [Google Scholar]
- 37.Bergholdt HKM, Nordestgaard BG, Ellervik C. Milk intake is not associated with low risk of diabetes or overweight-obesity: a Mendelian randomization study in 97,811 Danish individuals. Am J Clin Nutr 2015;102:487–96. 10.3945/ajcn.114.105049 [DOI] [PubMed] [Google Scholar]
- 38.Thorning TK, Bertram HC, Bonjour J-P, et al. Whole dairy matrix or single nutrients in assessment of health effects: current evidence and knowledge gaps. Am J Clin Nutr 2017;105:1033–45. 10.3945/ajcn.116.151548 [DOI] [PubMed] [Google Scholar]
Associated Data
This section collects any data citations, data availability statements, or supplementary materials included in this article.
Supplementary Materials
bmjdrc-2019-000826supp001.pdf (866.1KB, pdf)