Abstract
Aims:
First, the aim of the study was to determine whether irreversible electroporation (IRE) is associated with heat generation in the liver and pancreas at clinical (≤1,500 V/cm) and supraclinical (>1,500 V/cm) electroporation settings; second, to assess the risk of thermal tissue damage in and adjacent to the treated volume in highly perfused versus moderately perfused parts of both organs; third, to investigate the influence of perfusion and of the presence and the orientation of a metal stent on the maximal thermal elevation (ΔTSession,max) in the tissue during an IRE session at fixed IRE settings, and finally, to determine whether the maximum temperature elevation within the IRE-subjected organ during an IRE treatment (single or multiple sessions) is reflected in the organ’s surface temperature.
Methods:
The aims were investigated in 12 case studies conducted in five female Landrace pigs. Several IRE settings were applied for lateral (2), triangular (3), and rectangular (4) electrode configurations in the liver hilum, liver periphery, pancreas head, and pancreas tail. IRE series of 10-90 pulses were applied with pulse durations that varied from 70 μs to 90 μs and electric field strengths between 1,200 V/cm and 3,000 V/cm. In select cases, a metal stent was positioned in the bile duct at the level of the liver hilum. Temperatures were measured before, during, and after IRE in and adjacent to the treatment volumes using fiber optical temperature probes (temperature at the nucleation centers) and digital thermography (surface temperature). The occurrence of thermal damage was assumed to be at temperatures above 50 °C (ΔTSession,max ≥ 13 °C relative to body temperature of 37 °C). The temperature fluctuations at the organ surface (ΔTLocSurf) were compared to the maximum temperature elevation during an IRE treatment in the electroporation zone. In select cases, IRE was applied to tissue volumes encompassing the portal vein (PV) and a constricted and patent superior mesenteric vein (SMV) to determine the influence of the heatsink effect of PV and SMV on ΔTSession,max.
Results:
The median baseline temperature was 31.6 °C-36.3 °C. ΔTSession,max ranged from –1.7 °C to 25.5 °C in moderately perfused parts of the liver and pancreas, and from 0.0 °C to 5.8 °C in highly perfused parts. The median ΔTLocSurf of the liver and pancreas was 1.0 °C and 10.3 °C, respectively. Constricting the SMV in the pancreas head yielded a 0.8 °C higher ΔTSession,max. The presence of a metal stent in the liver hilum resulted in a ΔTSession,max of 19.8 °C. Stents parallel to the electrodes caused a ΔTSession,max difference of 4.2 °C relative to the perpendicular orientation.
Conclusions:
Depending on IRE settings and tissue type, IRE is capable of inducing considerable heating in the liver and pancreas that is sufficient to cause thermal tissue damage. More significant temperature elevations are positively correlated with increasing number of electrode pairs, electric field strength, and pulse number. Temperature elevations can be further exacerbated by the presence and orientation of metal stents. Temperature elevations at the nucleation centers are not always reflected in the organ’s surface temperature. Heat sink effects caused by large vessels were minimal in some instances, possibly due to reduced blood flow caused by anesthesia.
Relevance for patients:
Appropriate IRE settings must be chosen based on the tissue type and the presence of stents to avoid thermal damage in healthy peritumoral tissue and to protect anatomical structures
| Abbreviation and definitions | Unit | Description |
|---|---|---|
| IRE | Irreversible electroporation | |
| IRE session | Application of IRE with fixed IRE settings | |
| IRE treatment | A treatment that includes a single or multiple IRE sessions. In case of multiple sessions, IRE settings were varied | |
| NA | Not applicable | |
| TP | Fiber optical temperature probe | |
| T | [°C] | Temperature |
| TLocSurf,init | [°C] | Initial surface temperature obtained from a local area on the treated organ |
| TLocSurf,max | [°C] | Maximal surface temperature obtained from a local area on the treated organ |
| TSurf | [°C] | Surface temperature of the IRE-subjected organ measured by a digital thermography |
| TTP,init | [°C] | Initial temperature in or near the IRE-subjected volume measured by a single fiber optical temperature probe in the tissue before IRE |
| TTP,max | [°C] | Maximal temperature in or near the treated volume measured by a single fiber optical temperature probe in the tissue |
| ΔTSession,max | [°C] | Maximally measured thermal elevation during an IRE session (the maximal difference between the maximal temperature during and after IRE, and the initial temperature before the start of IRE in a single IRE session) |
| ΔTLocSurf | [°C] | The difference between the maximal and the initial localized surface temperature measured by digital thermography |
| ΔTTP | [°C] | The difference between the maximal and the initial temperature measured by a single fiber optical temperature probe in the tissue in a single session |
| ΔTTreat,max | [°C] | The difference between the maximal and the minimal temperature measured by a single fiber optical temperature probe in the tissue during an IRE treatment |
Keywords: complications, experimental pig model, irreversible electroporation, microwave ablation, mild hyperthermia, numerical treatment planning, radiofrequency ablation, therapy, tissue ablation
1. Introduction
Irreversible electroporation (IRE) is an image-guided focal ablation technique that is currently investigated in clinical trials for the treatment of patients with unresectable tumors, including but not limited to a variety of pancreatic cancers, centrally located liver tumors, and urological cancers [1-5]. With IRE, high-voltage, sub-millisecond electrical pulses are applied across electrode pairs, which are placed in and around a tumor. The electrical pulses perturb the cell membrane potential [6], leading to the disruption of the lipid bilayer, after which the cell loses homeostatic control and dies by mainly apoptosis [7]. Cancer cells that undergo necrosis release damage-associated molecular patterns and tumor-associated antigens that mediate sterile inflammation and, depending on the downstream signaling cascades, an anti-tumor immune response, respectively [8,9].
Preclinical studies have shown that IRE only affects cells in the direct zone of ablation, sparing collagenous structures and thereby preserving the tissue scaffolding [10,11]. Preservation of the gross anatomic architecture allows safe ablation of tumors near vital structure such as blood vessels. Theoretically, the non-thermal mechanism of cell death implies that heat sink effects should not impede treatment efficacy [12]. For those reasons, IRE is becoming increasingly popular as an alternative to thermal ablation techniques for intervening at locations where thermal damage is of concern.
Although IRE was initially introduced as a non-thermal technique, the application of repetitive high-intensity electrical pulses in the liver, pancreas, and kidney inevitably leads to heating that may result in thermal damage when a thermal threshold (50 °C-60 °C) is reached [13-16]. In particular, this might be the case due to the presence of metal implants, such as metal clips, staples, and stents. Specifically, in the direct vicinity of the metal implants the electric field distribution can be distorted, and the deposition of thermal energy can increase due to the relative large thermal conductivity of metal with respect to the treated tissue, resulting in possible thermal damage [17,18]. Several studies in pigs have demonstrated that increased temperatures can occur in the liver, pancreas, and kidney during IRE, depending on the IRE parameters [17,19,20]. Still, a limited number of in vivo studies determined the extent of tissue heating during IRE, especially in the liver and the pancreas. In addition, to the best of our knowledge, no in vivo experiments have been performed in a single study regarding heat sink effects during IRE in the vicinity of large blood vessels such as the portal vein and the superior mesenteric vein, and at multiple less perfused locations. The influence of a metal stent in the bile duct on thermogenesis during IRE, including its orientation, also warranted closer examination.
To determine the extent of heating in the liver and pancreas during IRE, several IRE settings need to be explored in different in vivo setups while measuring the real-time temperature in the treatment zone. IRE treatments in these organs are performed in comparatively more highly perfused regions (i.e., in the vicinity of the portal vein in the liver hilum and the superior mesenteric vein in the pancreatic head) and in more moderately perfused regions (i.e., in the liver periphery and pancreatic tail). The organs are thus heterogeneously perfused and potentially prone to more effective cooling due to convection. Hemodynamic heat removal may have a favorable dampening effect on temperature evolution and consequently limit the degree of thermal damage. At the same time, differences may arise between locoregional temperatures and the surface temperature, which may lead to inaccurate temperature read-outs during perioperative thermal profiling and faulty clinical decision-making.
Accordingly, in this case series study, we addressed the following research questions: (1) Does the maximal temperature elevation (ΔTSession,max, the greatest difference between the maximal temperature during and after IRE, and the initial temperature before the start of IRE in a single IRE session) potentially cause thermal tissue damage in the liver and pancreas; (2) does the heat sink effect in the highly perfused parts of these organs significantly influence ΔTSession,max; (3) are temperature elevations within the IRE-subjected organ reflected in the organ’s surface temperature; and (4) does the presence and the orientation of a metal stent influence the ΔTSession,max? Periprocedural temperature measurements were used to gauge potential thermal tissue damage. Temperature readouts constitute a continuous parameter to quantitatively assess the risk of thermal injury compared to histological analysis, which is dichotomous, semi-quantitative at best, and non-paired.
2. Animals and Methods
Following approval by the institutional animal ethics committee (protocol BEX102047), consecutive IRE ablations were performed in the liver and pancreas of five female Landrace pigs (±50 kg) with and without a metal biliary stent.
2.1. Animal procedure
The animals were anesthetized with intramuscular ketamine (10-15 mg/kg), midazolam (1-1.5 mg/kg), and atropine (0.03 mg/kg and 1.5 mL/50 kg). After intubation, anesthesia was maintained through inhaled isoflurane (2%-4%) in air (20% oxygen) and intravenous ketamine (2 mg/kg/h), sufentanil (5-10 mg/kg/h), midazolam (1-2 mg/kg/h), and rocuronium bromide (2-2.5 mg/kg/h). Before IRE, intravenous bolus injections of rocuronium (1-1.5 mg/kg) were administered for complete muscle relaxation. The animals were placed in supine position and the liver and pancreas were mobilized following a medial laparotomy. During IRE the animals were kept in apnea to minimize ventilatory motion. The animals were euthanized by exsanguination within 30 min after the final ablation.
2.2. IRE procedure
The IRE procedures were conducted as case series (n = 1 per unique experiment), where multiple cases were performed in one animal in line with the Dutch guidelines for animal research (strive for reduction in the number of animals used). For optimal legibility and understandability, the experimental detail for each case study is presented in the Results section.
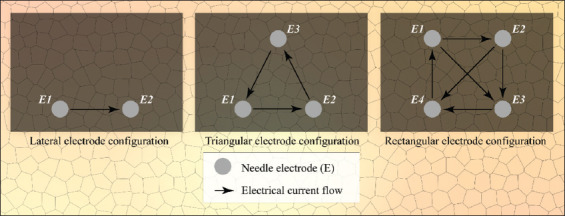
IRE was performed with a Nanoknife system (AngioDynamics, Latham, NY) in the liver hilum, liver periphery, pancreas head, and pancreas tail. Depending on the experiment, the number of applied electrode pairs varied from 2 to 6 with an active tip length of 1.5-2.0 cm, inter-electrode distance of 1.0-2.0 cm, and electrode configurations, as depicted in Figure 1. Furthermore, series of 10-90 pulses were applied in 1-5 sessions with pulse durations that varied from 70 μs to 90 μs, and electric field strengths between 1,200 V/cm and 3,000 V/cm. These parameters are used in the clinical setting for electric field strengths of 1,200 V/cm-1,500 V/cm. The reason for including supraclinical settings (>1,500 V/cm) was to obtain electrical currents of >20 A in a select number of cases, which is the minimum required current to ablate tissue according to the protocol of AngioDynamics and Martin [21]. When the electrical current exceeds the safety threshold of 50 A, the Nanoknife automatically aborts the IRE procedure.
Figure 1. Electrode configurations used in this study, including electrical current flow directions. Please note that during IRE treatment, the electrode pairs were used successively and not concurrently.
In case of the liver hilum, IRE experiments were performed with and without a nitinol stent (Boston Scientific, Marlborough, MA). The stents were placed under ultrasound guidance at a liver depth of approximately 1.0-1.5 cm parallel to the surface of the liver. The stents were expanded in situ to a diameter of 0.5 cm. Electrodes were positioned parallel and perpendicular to the stent without the use of ECHO guidance.
2.3. Temperature measurements
To measure the temperature (T) during IRE within the IRE-subjected organ, up to three fiber optical temperature probes (TP) were placed under ECHO guidance directly within and/or adjacent to the ablation zone at equal depth relative to the IRE electrode tips. The fiber optical temperature setup consisted of a rack-mounted Lumiterm X5 OEM temperature board connected to 3 LumitermX5-True fiber optical temperature probes with a diameter of 1 mm (IPITEK, Carlsbad, CA). The system is capable of registering temperature differences of 0.05 °C with an accuracy of 0.2 °C and is not affected by the presence of an electric field. The temperature-recording interval was standardized to 1 s. For every temperature probe in each session, the initial temperature (TTP,init[°C]) before the IRE procedure and the corresponding maximal temperature (TTP,max [°C]) during and after the IRE procedure were measured. The temperature difference (ΔTTP [°C]) was calculated from these values. Please note that ΔTTP represents temperature difference of each probe per session, while ΔTSession,max represents the maximal temperature difference in a single session.
In seven out of 12 experiments, the surface temperature (TSurf) of the liver and the pancreas was continuously measured during IRE using a Gobi-384 thermal camera (Xenics, Leuven, Belgium). This camera is calibrated to measure the temperature in a range of −20 °C-120 °C. Furthermore, the camera is capable of registering temperature differences of 0.05 °C at a resolution of 384 × 288 pixels (25-mm pitch). The temperature data were extracted from a case-depended local area using Xeneth Software (Xenics) to determine the initial local TSurf (TLocSurf,init [°C]) before the IRE procedure and the maximal local TSurf (TLocSurf,max [°C]) during and after IRE. The average temperature was determined at sites with the highest TLocSurf,max in the field of view based on the intensity values of 1-5 pixels. Using the option “Color Threshold” in ImageJ (National Institutes of Health, Bethesda, MD), we could determine the average temperature and calculate the difference (ΔTLocSurf [°C]). Furthermore, the ΔTLocSurf was reflected in the ΔTSession,max during an IRE treatment (ΔTTreat,max), measured by a single TP inside or outside the treated volume. The ΔTTreat,max was calculated as the maximal difference between the maximal and the minimal temperature per probe during the treatment. In case of multiple TPs inside the treated volume, the maximal value of ΔTTreat,max was selected. As an additional step, the linear regression was calculated to determine the relationship between ΔTLocSurf and ΔTTreat,max.
2.4. Assessment of thermally ablative temperatures
To estimate whether IRE induces temperature elevations sufficiently high to cause thermal damage, a temperature threshold of 50 °C (ΔTSession,max ≥ 13 °C assuming an initial body temperature of 37 °C) was selected inasmuch as damage to tissue increases significantly beyond this point [16]. Assessment of the risk of thermal damage was performed according to the temperature traces in and near the ablation zone and the thermal images generated with the infrared camera.
3. Results
3.1. Summated main findings of the case studies
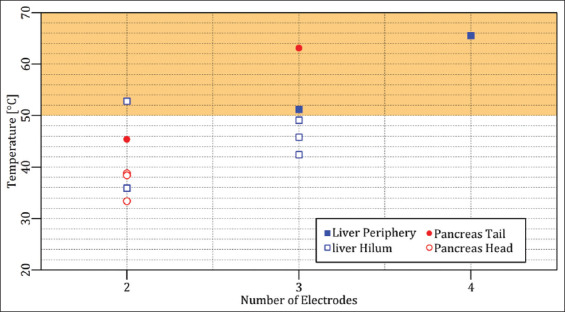
To provide an overview of the case studies, the results of each case are summarized in Table 1 and the maximally measured temperatures were plotted as a function of the selected number of electrodes in Figure 2. Furthermore, the accessibility of the Results section was preserved by moving the figures in cases 2-5 and 10-12 into the Appendix section. figures in the Appendix are indicated with a prefix ‘A’.
Table 1. Overview of the case studies. Readers should note that: (1) NA is defined as “Not applicable” and (2) the median baseline temperature was 31.6 °C-36.3 °C.
| Case number | Organ | Notes | Electrode number | Number of sessions | Pulse parameters | Maximally measured temperature within IRE-subjected organ [°C] (ΔTTreat,max) | Maximal surface temperature [°C] (ΔTLocSurf) | Was the thermal damage threshold reached? |
|---|---|---|---|---|---|---|---|---|
| 1 | Liver periphery | NA | 4 | 3 | 1,500 V/cm 90 μs 20-90 pulses | 65.5 °C (29.2 °C) | 30.7 °C (1 °C) | Yes |
| 2 | Liver periphery | NA | 3 | 1 | 1,500 V/cm 70 μs 90 pulses | 51.2 °C (16.7 °C) | 25 °C (0 °C) | Yes |
| 3 | Liver hilum | Electrodes parallel to portal vein | 3 | 3 | 1,500 V/cm 90 μs 20-90 pulses | 42.4 °C (6.1 °C) | 37 °C (6 °C) | No |
| 4 | Liver hilum | Electrodes parallel to bile duct containing a stent | 3 | 1 | 1,500 V/cm 70 μs 90 pulses | 49.1 °C (14.6 °C) | 29 °C (3 °C) | No |
| 5 | Liver hilum | Electrodes perpendicular to bile duct containing a stent | 3 | 1 | 1,500 V/cm 70 μs 90 pulses | 45.8 °C (10.4 °C) | 28.5 °C (0 °C) | No |
| 6 | Liver hilum | Electrodes parallel to bile duct, no stent | 2 | 2 | 1,200-1,500 V/cm 90 μs 50-90 pulses | 35.9 °C (0.2 °C) | NA | No |
| 7 | Liver hilum | Electrodes parallel to bile duct containing a stent | 2 | 2 | 1,500 V/cm 90 μs 20-70 pulses | 52.8 °C (21.1 °C) | NA | Yes |
| 8 | Pancreas tail | NA | 3 | 5 | 1,500-3,000 V/cm 90 μs 20-90 pulses | 63.1 °C (30.4 °C) | 37 °C (13 °C) | Yes |
| 9 | Pancreas tail | NA | 2 | 5 | 1,500-2200 V/cm 90 μs 20-90 pulses | 45.4 °C (13.6 °C) | 29 °C (7.5 °C) | No |
| 10 | Pancreas head | Electrodes in vicinity of the superior mesenteric vein | 2 | 3 | 1,500 V/cm 90 μs 20-90 pulses | 33.4 °C (0.3 °C) | NA | No |
| 11 | Pancreas head | Electrodes surrounding superior mesenteric vein | 2 | 2 | 1,350-1,500 V/cm 90 μs 10-90 pulses | 38.8 °C (3.4 °C) | NA | No |
| 12 | Pancreas head | Electrodes in vicinity of constricted superior mesenteric vein | 2 | 1 | 1,350 V/cm 90 μs 90 pulses | 38.4 °C (4.1 °C) | NA | No |
Figure 2. Maximally measured temperature of each case study as a function of the number of electrodes. The orange rectangle delineates the thermal damage zone.
3.2. Liver
3.2.1. Case 1: liver periphery – four electrodes
Four electrodes with an active tip length of 1.5 cm were inserted in rectangular configuration in the liver periphery (Figure 3A). Three consecutive IRE sessions were performed with an interval of 4 min between the start of sessions 1 and 2 and an interval of 10 min between the start of sessions 2 and 3. The pulse parameters are listed in Table 2.Figure 3B shows TLocSurf,max ≈ 30.7 °C and ΔTLocSurf ≈ 1 °C. The temperature evolution over time is presented in Figure 3C, provided here as an example and omitted in the rest of the experimental results. On the basis of these traces, the TTP,init, TTP,max, and ΔTTP of each probe were calculated for every session (Figure 3D). The TTP,max in the ablation zone ranged from 44.1 °C to 65.5 °C (TP1 and TP2), with ΔTTP ranging from 8.1 °C to 25.5 °C. The ΔTTreat,max was 29.2 °C. The maximal temperature exceeded 50 °C for almost 9 min and attests to the manifestation of thermal tissue damage in the IRE-subjected liver periphery. Outside the ablation zone, the TTP,max ranged from 39.2 °C to 44.4 °C (TP3), with ΔTTP ranging from 3.1 °C to 7.0 °C.
Figure 3. (A) Configuration of the electrodes and the temperature probes in the liver periphery (case 1). (B) Thermal camera images of the IRE site. The TLocSurf,init (upper panel) and the TLocSurf,max (lower panel) were calculated from pixels within the encircled areas. Electrodes are indicated by “υ” and temperature probes by “τ.” Two electrodes did not appear in these images due to their locations behind the temperature probes. On the color bar, the initial and maximal temperatures are indicated by “Init” and “Max.” (C) Tissue temperature profile as a function of time and IRE session. (D) TTP,init, TTP,max, and ΔTTP of each temperature probe in each session, with TP1 and TP2 inside the treated region and TP3 outside the treated region. The orange rectangles in (C) and (D) indicate the thermal damage zone.
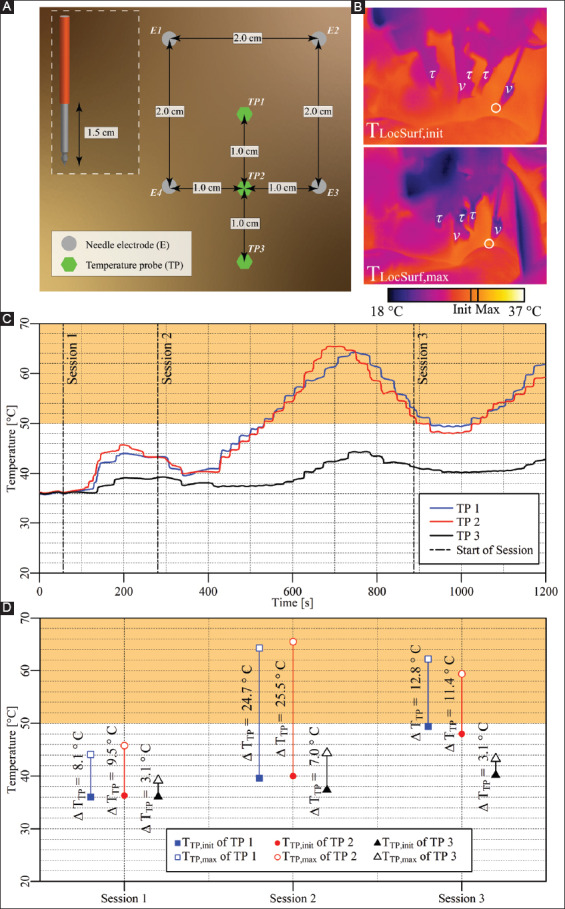
Table 2. Pulse parameters and electrode pairs (rectangular configuration) of the IRE sessions in the liver periphery (case 1).
| Session | Electric field strength [V/cm] | Pulse duration [μs] | Number of pulses | Electrode pair |
|---|---|---|---|---|
| Session 1 | 1,500 | 90 | 20 | 1-2 |
| 1-3 | ||||
| 2-3 | ||||
| 2-4 | ||||
| 3-4 | ||||
| 4-1 | ||||
| Session 2 | 1,500 | 90 | 70 | 1-2 |
| 1-3 | ||||
| 2-3 | ||||
| 2-4 | ||||
| 3-4 | ||||
| 4-1 | ||||
| Session 3 | 1,500 | 90 | 90 | 1-3 |
| 80* | 2-3 | |||
| 90 | 2-4 |
Due to high current (>50 A), 80 pulses were applied instead of the preprogrammed 90.
3.2.2. Case 2: liver periphery – three electrodes
Three electrodes with an active tip length of 2 cm were inserted in triangular configuration in the liver periphery (Figure A1A). A single IRE session was performed with pulse parameters as described in Table 3. The TTP,init, TTP,max, and ΔTTP of each probe are presented in Figure A1B. The TTP,max in the ablation zone ranged from 49.6 °C to 51.2 °C (TP1 and TP2), with ΔTTP ranging from 14.9 °C to 16.7 °C. The ΔTTreat,max was 16.7 °C. The maximal temperature exceeded 50 °C for 2.1 min. Outside the ablation zone, the TTP,max was 44.2 °C (TP3), with ΔTTP = 9.7 °C.Figure A1C shows TLocSurf,max ≈ 25 °C and ΔTLocSurf ≈ 0 °C.
Figure A1. (A) Configuration of the electrodes and temperature probes in the liver periphery. (B) TTP,init, TTP,max, and ΔTTP of each probe with TP1 and TP2 inside the treated region and TP3 outside the treated region. The orange rectangle indicates the thermal damage zone. (C) Thermal camera images of the IRE site. The TLocSurf,init (left panel) and the TLocSurf,max (right panel) were calculated from pixels within the encircled areas. Electrodes are indicated by “υ” and temperature probes by “τ.” On the color bar, the initial and maximal temperatures are indicated by “Init” and “Max”.
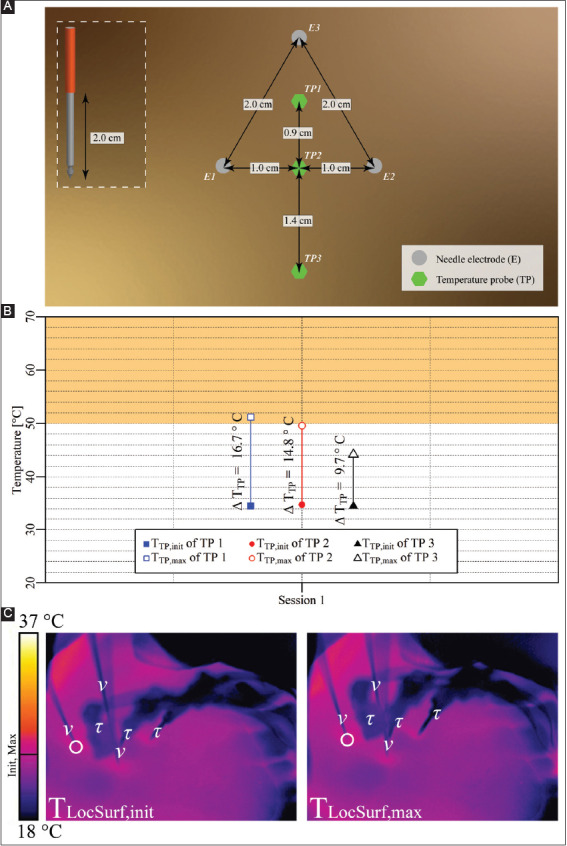
Table 3. Pulse parameters and the electrode pairs (triangular configuration) of the IRE session in the liver periphery (case 2).
| Session | Electric field strength [V/cm] | Pulse duration [μs] | Number of pulses | Electrode pair |
|---|---|---|---|---|
| Session 1 | 1,500 | 70 | 90 | 1-2 |
| 2-3 | ||||
| 3-1 |
3.2.3. Case 3: liver hilum – three electrodes parallel to portal vein
Three electrodes with an active tip length of 1.5 cm were inserted in triangular configuration in the liver hilum parallel to the portal vein (Figure A2A). Three consecutive IRE sessions were performed with an interval of 3 min between the start of sessions 1 and 2 and an interval of 7 min between the start of sessions 2 and 3. The pulse parameters are provided in Table 4. The TTP,init, TTP,max, and ΔTTP for each respective session are presented in Figure A2B. The TTP,max outside the ablation zone ranged from 37.9 °C to 42.4 °C, with ΔTTP ranging from 1.6 °C to 5.7 °C. The ΔTTreat,max was 6.1 °C. Figure A2C shows that TLocSurf,max = 37 °C and ΔTLocSurf ≈ 6 °C.
Figure A2. (A) Configuration of electrodes and the temperature probe in the liver hilum with electrodes perpendicular to bile duct not containing a stent. (B) Measured TTP,init, TTP,max, and ΔTTP of the temperature probe in each session with TP outside the treated region. The orange rectangle delineates the thermal damage zone. (C) Thermal camera images with the TLocSurf,init on the left side and the TLocSurf,max on the right side, extracted from within the white encircled areas. Electrodes are indicated by “υ.” The temperature probe did not appear in these images. On the color bar, the initial and maximal temperatures are indicated by “Init” and “Max”.
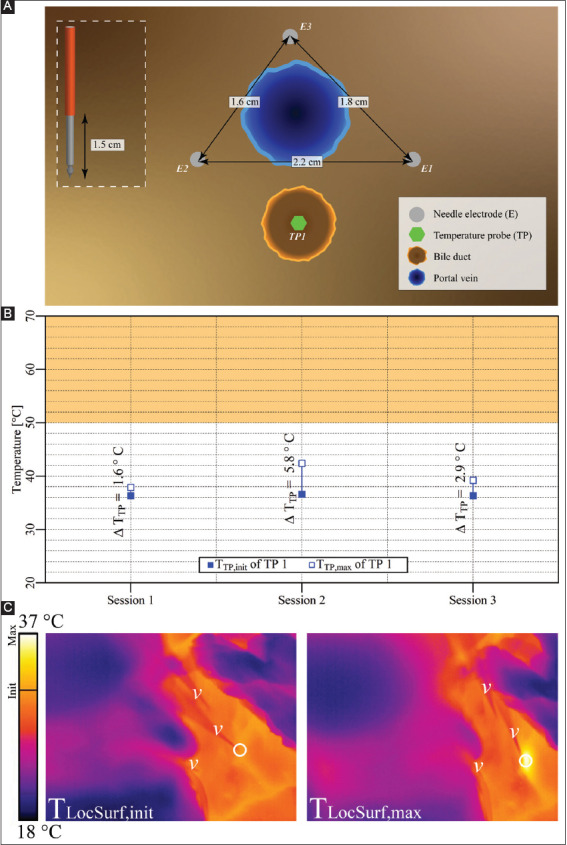
Table 4. Pulse parameters and electrode pairs (triangular configuration) of the IRE sessions in the liver hilum with the portal vein in the treatment region (case 3).
| Session | Electric field strength [V/cm] | Pulse duration [μs] | Number of pulses | Electrode pair |
|---|---|---|---|---|
| Session 1 | 1,500 | 90 | 20 | 1-2 |
| 3-1 | ||||
| 2-3 | ||||
| Session 2 | 1,500 | 90 | 70 | 1-2 |
| 3-1 | ||||
| 2-3 | ||||
| Session 3 | 1,500 | 90 | 90 | 1-2 |
| 3-1 | ||||
| 2-3 |
3.2.4. Case 4: liver hilum – three electrodes parallel to a bile duct containing a stent
Three electrodes with an active tip length of 2 cm were inserted in triangular configuration in the liver hilum parallel to the bile duct containing a stent, as shown in Figure A3A. A single IRE session was performed with the pulse parameters provided in Table 5. The TTP,init, TTP,max, and ΔTTP of each probe are shown in Figure A3B. This figure reveals that TTP,max in the ablation zone ranged from 44.4 °C to 49.1 °C (TP1 and TP2), with ΔTTP ranging from 12.4 °C to 14.6 °C. The ΔTTreat,max was 14.6 °C. Outside the ablation zone, TTP,max was 40 °C (TP3), with ΔTTP = 5.5 °C. Figure A3C shows TLocSurf,max ≈ 29 °C and ΔTLocSurf ≈ 3 °C, which considerably deviates from the fiber optic readouts.
Figure A3. (A) Configuration of electrodes and temperature probes in the liver hilum with electrodes parallel to the bile duct containing a stent. (B) Measured TTP,init, TTP,max, and ΔTTP of each probe with TP1 and TP2 inside the treated region, and TP3 outside the treated region. The orange rectangle indicates the thermal damage zone. (C) Thermal camera images with the TLocSurf,init on the left side and the TLocSurf,max on the right side, extracted from within the white encircled areas. Electrodes are indicated by “υ” and temperature probes by “τ.” One electrode in both images did not appear due to its location behind the temperature probes. On the color bar, the initial and maximal temperatures are indicated by “Init” and “Max”.
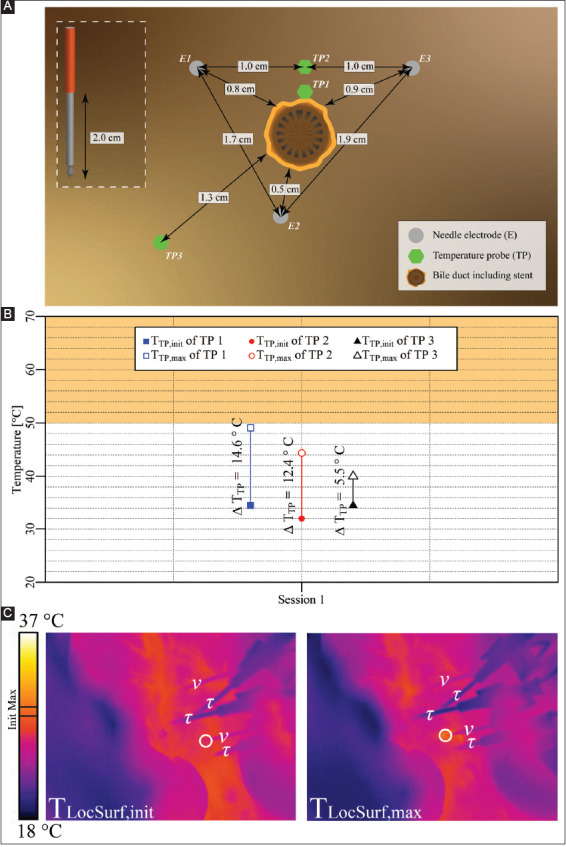
Table 5. Pulse parameters and electrode pairs (triangular configuration) of the IRE session in the liver hilum and bile duct encompassing a stent in the treatment region (case 4).
| Session | Electric field strength [V/cm] | Pulse duration [μs] | Number of pulses | Electrode pair |
|---|---|---|---|---|
| Session 1 | 1,500 | 70 | 90 | 2-3 |
| 3-1 | ||||
| 1-2 |
3.2.5. Case 5: liver hilum – three electrodes perpendicular to a bile duct containing a stent
Three electrodes with an active tip length of 2 cm were inserted in triangular configuration in the liver hilum perpendicular to a bile duct harboring a stent (Figure A4A). A single IRE session was performed with the pulse parameters provided in Table 6. The TTP,init, TTP,max, and ΔTTP of each probe are shown in Figure A4B. The figure reveals that TTP,max in the ablation zone ranged from 44.2 °C to 45.8 °C (TP1 and TP2), with ΔTTP ranging from 8.8 °C to 10.4 °C. The ΔTTreat,max was 10.4 °C. Outside the ablation zone, TTP,max was 35.5 °C (TP3), with ΔTTP = 0.1 °C. Figure A4C shows that TLocSurf,max ≈ 28.5 °C and ΔTLocSurf ≈ 0 °C.
Figure A4. (A) Configuration of electrodes and temperature probes in the liver hilum with electrodes perpendicular to bile duct that contained a stent. TP1 was placed on the top of the bile duct, while TP2 and TP3 were placed next to the bile duct. (B) Measured TTP,init, TTP,max, and ΔTTP of each probe in each session with TP1 and TP2 inside the treated region, and TP3 outside the treated region. The orange rectangle indicates the thermal damage zone. (C) Thermal camera images with the TLocSurf,init on the left side and the TLocSurf,max on the right side, extracted from within the white encircled areas. Electrodes are indicated by “υ” and temperature probes by “τ”. One electrode in both images and the TP in the left image are not visible due to their locations behind the visible electrodes and temperature probes. On the color bar, the initial and maximal temperatures are indicated by “Init” and “Max”.
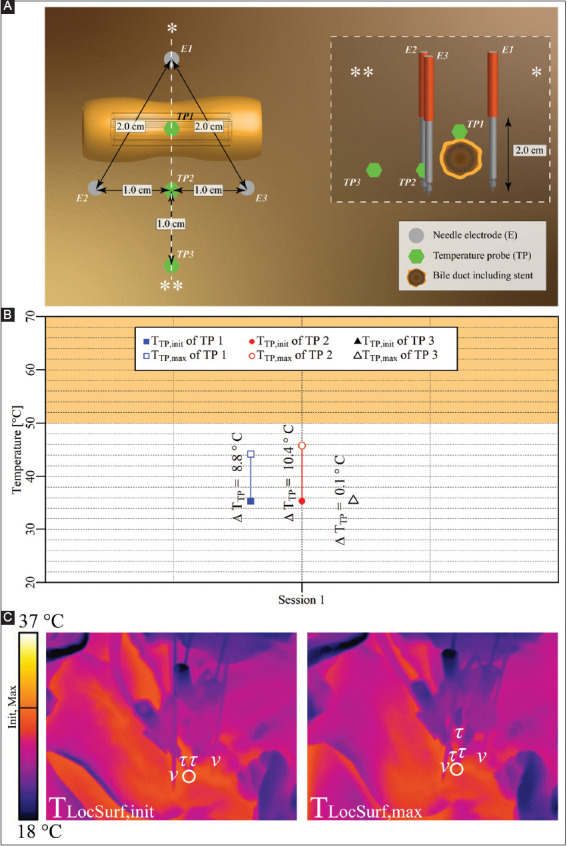
Table 6. Pulse parameters and electrode pairs (triangular configuration) of the IRE session in the liver hilum with a stent-containing bile duct in the treatment region (case 5).
| Session | Electric field strength [V/cm] | Pulse duration [μs] | Number of pulses | Electrode pair |
|---|---|---|---|---|
| Session 1 | 1,500 | 70 | 90 | 1-2 |
| 2-3 | ||||
| 3-1 |
3.2.6. Case 6: liver hilum – two electrodes parallel to a bile duct, no stent
Two electrodes with an active tip length of 1.5 cm were inserted in the liver hilum parallel to the bile duct, as shown in Figure 4A. Two consecutive IRE sessions were performed with an interval of 1 min. The pulse parameters are provided in Table 7. The TTP,init, TTP,max, and ΔTTP of each probe for each respective session are shown in Figure 4B. The figure reveals that TTP,max in the ablation zone ranged from 35.4 °C to 35.9 °C (TP1 and TP2), with ΔTTP ranging from 0.0 °C to 0.3 °C. The ΔTTreat,max was 0.3 °C. This case did not entail thermal camera measurements.
Figure 4. (A) Configuration of electrodes and temperature probes in the liver hilum with electrodes parallel to a bile duct not containing a stent (case 6). (B) Measured TTP,init, TTP,max, and ΔTTP of each probe in each session with TP1 and TP2 inside the treated region. The orange rectangle indicates the thermal damage zone.
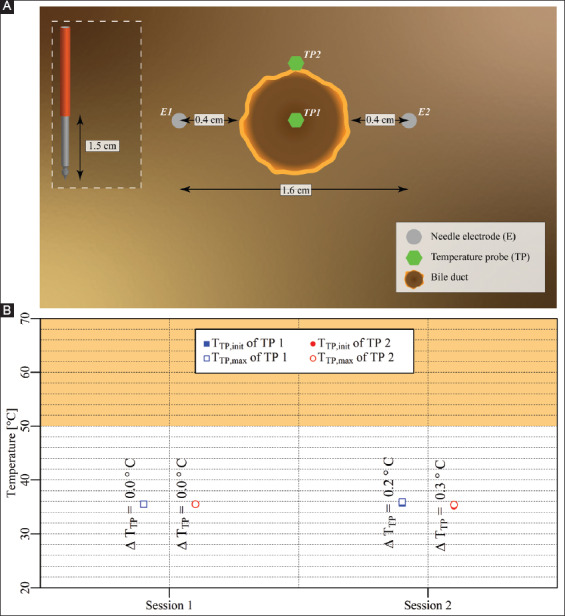
Table 7. Pulse parameters and electrode pair (lateral configuration) of the IRE sessions in the liver hilum with a bile duct but no stent in the treated region (case 6).
| Session | Electric field strength [V/cm] | Pulse duration [μs] | Number of pulses | Electrode pair |
|---|---|---|---|---|
| Session 1 | 1,500 | 90 | 90 | 1-2 |
| Session 2 | 1,200 | 90 | 40* | 1-2 |
Due to high current (>50 A), 40 pulses were applied instead of the preprogrammed 80.
3.2.7. Case 7: Liver hilum – two electrodes parallel to a bile duct containing a stent
Two electrodes with an active tip length of 1.5 cm were inserted in the liver hilum parallel to a stent-containing bile duct, as shown in Figure 5A. The interval between the start of the two IRE sessions was 1 min. The pulse parameters are provided in Table 8. The TTP,init, TTP,max, and ΔTTP of each probe for each respective session are shown in Figure 5B. This figure reveals that TTP,max in the ablation zone ranged from 31.8 °C to 52.8 °C (TP1 and TP2), with ΔTTP ranging from 0.2 °C to 20.1 °C. The ΔTTreat,max was 21.1 °C. This case did not include thermal camera recordings.
Figure 5. (A) Configuration of electrodes and temperature probes in the liver hilum with electrodes parallel to a stent-containing bile duct (case 7). (B) Measured TTP,init, TTP,max, and ΔTTP of each probe in each session with TP1 inside the treated region and TP2 outside the treated region. The orange rectangle designates the thermal damage zone.
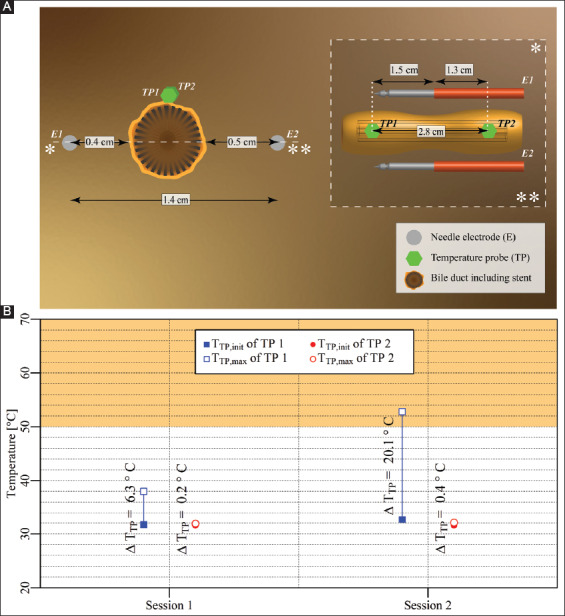
Table 8. Pulse parameters and electrode pair (lateral configuration) of the IRE sessions in the liver hilum with a bile duct containing a stent in the treated region (case 7).
| Session | Electric field strength [V/cm] | Pulse duration [μs] | Number of pulses | Electrode pair |
|---|---|---|---|---|
| Session 1 | 1,500 | 90 | 20 | 1-2 |
| Session 2 | 1,500 | 90 | 70 | 1-2 |
3.3. Pancreas
3.3.1. Case 8: Pancreas tail – three electrodes
Three electrodes with an active tip length of 1.5 cm were inserted in triangular configuration in the pancreas tail, as shown in Figure 6A. Five consecutive IRE sessions were performed with an interval of 2.5 min between the start of the first three sessions, and an interval of 11 min between the start of sessions 4 and 5. The pulse parameters are provided in Table 9. The TTP,init, TTP,max, and ΔTTP of each session are shown in Figure 6B. This figure reveals that TTP,max in the ablation zone ranged from 35.7 °C to 63.1 °C, with ΔTTP ranging from −1.6 °C to 23.7 °C. The ΔTTreat,max was 30.4 °C. The maximal temperature exceeded 50 °C for almost 4.5 min during session 4. Figure 6C shows TLocSurf,max ≈ 37 °C and ΔTLocSurf ≈ 13 °C.
Figure 6. (A) Configuration of electrodes and the temperature probe in the pancreas tail (case 8). (B) Measured TTP,init, TTP,max, and ΔTTP of the temperature probe in each session inside the treated region. The orange rectangle indicates the thermal damage zone. (C) Thermal camera images with the TLocSurf,init on the left side and the TLocSurf,max on the right side, extracted from within the white encircled areas. Electrodes are indicated by “υ” and temperature probes by “τ.” On the color bar, the initial and maximal temperatures are indicated by “Init” and “Max”.
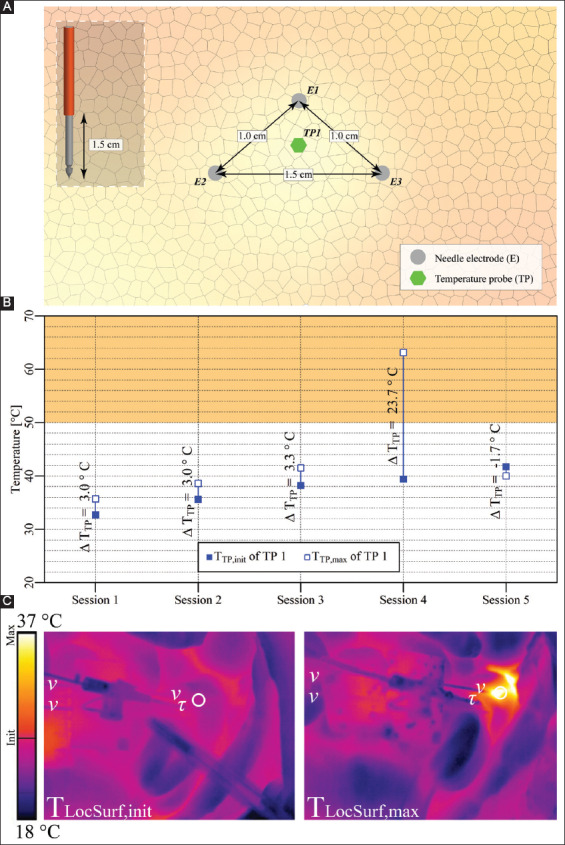
Table 9. Pulse parameters and the electrode pairs (triangular configuration) of the IRE sessions in the pancreas tail (case 8).
| Session | Electric field strength [V/cm] | Pulse duration [μs] | Number of pulses | Electrode pair |
|---|---|---|---|---|
| Session 1 | 1,500 | 90 | 20 | 1-2 |
| 2-3 | ||||
| 3-1 | ||||
| Session 2 | 1,750 | 90 | 20 | 1-2 |
| 2-3 | ||||
| 3-1 | ||||
| Session 3 | 2,250 | 90 | 20 | 1-2 |
| 2-3 | ||||
| 3-1 | ||||
| Session 4 | 3,000 | 90 | 90 | 1-2 |
| 2,000 | 90 | 90 | 2-3 | |
| 3,000 | 90 | 20* | 3-1 | |
| Session 5 | 1,500 | 90 | 70 | 3-1 |
Due to high current (>50 A), 20 pulses were applied instead of the preprogrammed 90.
3.3.2. Case 9: Pancreas tail – two electrodes
Two electrodes with an active tip length of 1.5 cm were inserted in the pancreatic tail, as shown in Figure 7A. Five consecutive IRE sessions were performed with intervals of 2.5 min between the start of the sessions and an interval of 4.5 min between the start of sessions 3 and 4. The pulse parameters are provided in Table 10. The TTP,init, TTP,max, and ΔTTP of each session are shown in Figure 7B. This figure reveals that TTP,max in the ablation zone ranged from 31.9 °C to 45.4 °C, with ΔTTP ranging from 0.1 °C to 5.4 °C. The ΔTTreat,max was 13.6 °C. Figure 7C shows TLocSurf,max ≈ 29 °C and ΔTLocSurf ≈ 7.5 °C.
Figure 7. (A) Configuration of electrodes and the temperature probe in the pancreas tail (case 9). (B) Measured TTP,init, TTP,max, and ΔTTP of the temperature probe. The orange rectangle indicates the thermal damage zone. (C) Thermal camera images with the TLocSurf,init on the left side and the TLocSurf,max on the right side, extracted from within the white encircled areas. Electrodes are indicated by “υ” and temperature probes by “τ.” One electrode in the right image did not appear due to its location behind the temperature probe. On the color bar, the initial and maximal temperatures are indicated by “Init” and “Max”.
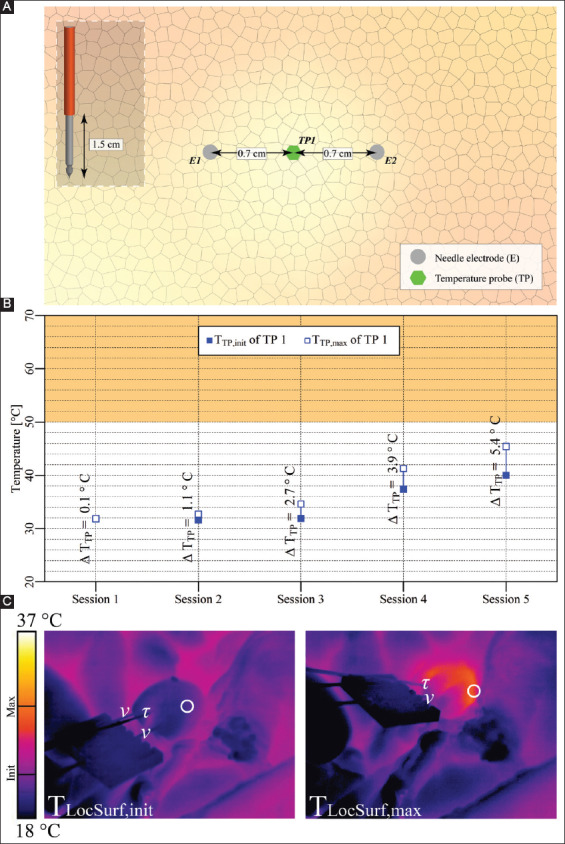
Table 10. Pulse parameters and electrode pair (lateral configuration) of the IRE sessions in the pancreas tail (case 9).
| Session | Electric field strength [V/cm] | Pulse duration [μs] | Number of pulses | Electrode pair |
|---|---|---|---|---|
| Session 1 | 1,500 | 90 | 20 | 1-2 |
| Session 2 | 1,750 | 90 | ||
| Session 3 | 2,200 | 90 | ||
| Session 4 | 2,200 | 90 | 70 | |
| Session 5 | 1,800 | 90 | 90 |
3.3.3. Case 10: Pancreas head – two electrodes in vicinity of the superior mesenteric vein
Two electrodes with an active tip length of 1.5 cm were inserted in the pancreas head above the superior mesenteric vein (Figure A5A). Three consecutive IRE sessions were performed with intervals of 4 min between the start of the sessions. The pulse parameters are provided in Table 11. The TTP,init, TTP,max, and ΔTTP of each session are shown in Figure A5B. The figure reveals that TTP,max in the ablation zone ranged from 33.1 °C to 33.4 °C, with ΔTTP ranging from 0 °C to 0.2 °C. The ΔTTreat,max was 0.3 °C. This case did not entail thermal camera measurements.
Figure A5. (A) Configuration of electrodes and the temperature probe in the pancreas head. (B) Measured TTP,init, TTP,max, and ΔTTP of the temperature probe in each session positioned adjacent to the treated region. The orange rectangle indicates the thermal damage zone.
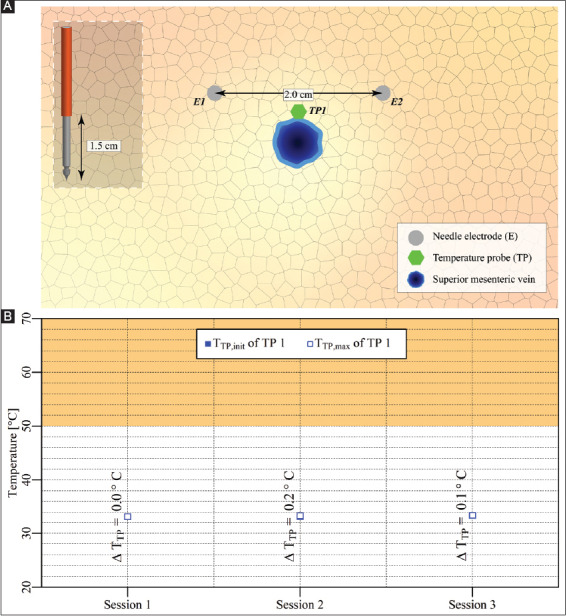
Table 11. Pulse parameters and electrode pair (lateral configuration) of the IRE sessions in the pancreas head with superior mesenteric vein near the treatment region (case 10).
| Session | Electric field strength [V/cm] | Pulse duration [μs] | Number of pulses | Electrode pair |
|---|---|---|---|---|
| Session 1 | 1,500 | 90 | 20 | 1-2 |
| Session 2 | 1,500 | 90 | 70 | 1-2 |
| Session 3 | 1,500 | 90 | 90 | 1-2 |
3.3.4. Case 11: Pancreas head – two electrodes surrounding the superior mesenteric vein
Two electrodes with an active tip length of 1.5 cm were inserted in the pancreas head parallel to the SMV, as shown in Figure A6A. Two consecutive IRE sessions were performed with an interval of 1 min between the start of the sessions. The pulse parameters are provided in Table 12. The TTP,init, TTP,max, and ΔTTP of each session are shown in Figure A6B. This figure reveals that TTP,max in the ablation zone ranged from 35.4 °C to 38.8 °C, with ΔTTP ranging from -0.1 °C to 3.2 °C. The ΔTTreat,max was 3.4 °C. This case did not entail thermal camera measurements.
Figure A6. (A) Configuration of electrodes and optical fiber temperature probes in the pancreas head. (B) Measured TTP,init, TTP,max, and ΔTTP of each temperature probe in each session positioned outside (TP1) and in the treated region (TP2). The orange rectangle indicates the thermal damage zone.
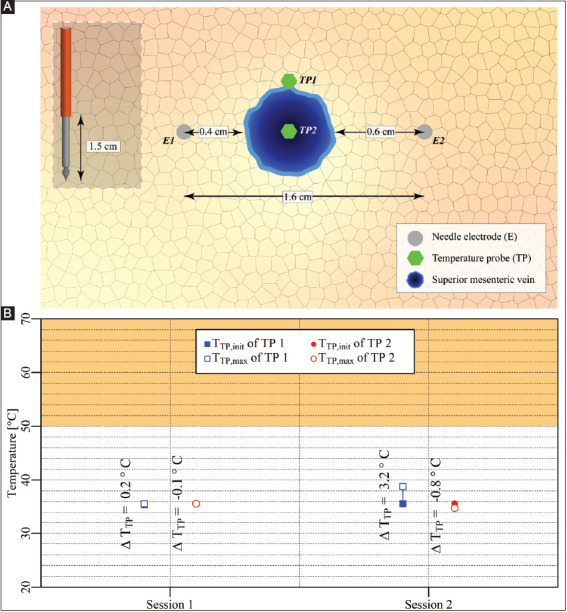
Table 12. Pulse parameters and electrode pair (lateral configuration) of the IRE sessions in the pancreas head with superior mesenteric vein in the treated region (case 11).
| Session | Electric field strength [V/cm] | Pulse duration [μs] | Number of pulses | Electrode pair |
|---|---|---|---|---|
| Session 1 | 1,500 | 90 | 10 | 1-2 |
| Session 2 | 1,350 | 90 | 80 | 1-2 |
3.3.5. Case 12: Pancreas head – two electrodes in the vicinity of a constricted superior mesenteric vein
After completing the IRE sessions in case 11, the superior mesenteric vein was constricted to cease blood flow, as shown in Figure A7A. Here, the configurations of the electrodes and the temperature probes were kept the same as in case 11. A single IRE session was performed with the pulse parameters provided in Table 13.
Figure A7. (A) Configuration of electrodes and the temperature probes in the pancreas head. (B) Measured TTP,init, TTP,max, and ΔTTP of each temperature probe positioned outside (TP1) and in the treated region (TP2). The orange rectangle indicates the thermal damage zone.
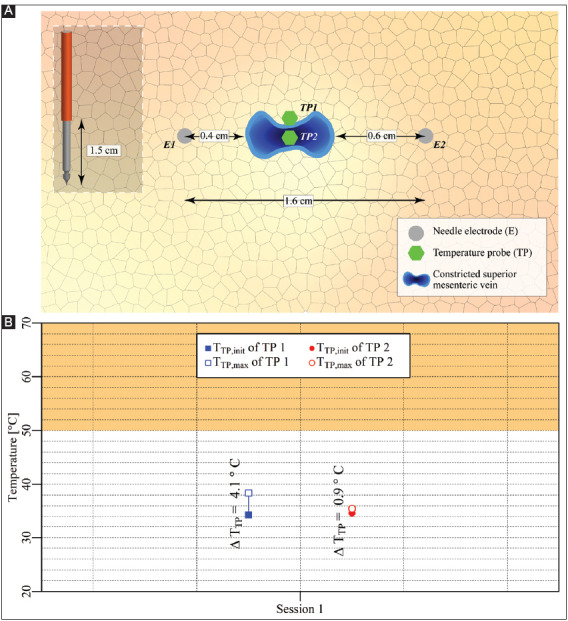
Table 13. Pulse parameters and electrode pair (lateral configuration) of the IRE session in the pancreas head with constricted superior mesenteric vein in the treated region (case 12).
| Session | Electric field strength [V/cm] | Pulse duration [μs] | Number of pulses | Electrode pair |
|---|---|---|---|---|
| Session 1 | 1,350 | 90 | 90 | 1-2 |
The TTP,init, TTP,max, and ΔTTP of each probe for each respective session are shown in Figure A7B. This figure reveals that TTP,max in the ablation zone ranged from 34.3 °C to 38.4 °C, with ΔTTP ranging from 0.9 °C to 4.1 °C. The ΔTTreat,max was 4.1 °C. This case did not entail thermal camera measurements.
3.4. Correlation between surface temperature and temperature within the treated region
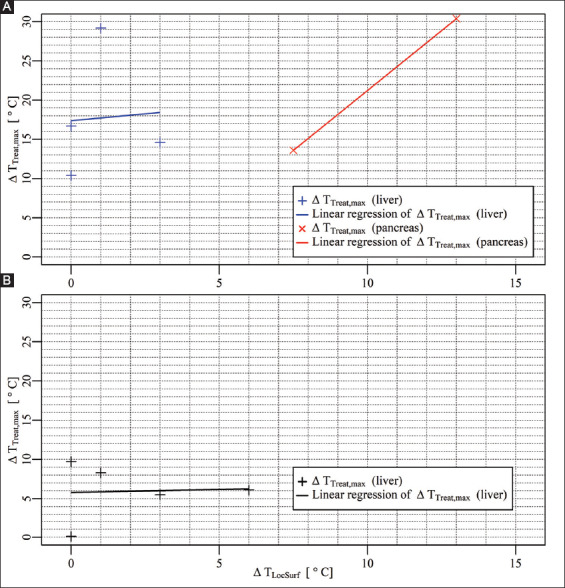
Figure 8 depicts the correlation between the ΔTLocSurf and the ΔTTreat,max inside the treated region in the liver and the pancreas (Figure 8A) and outside the treated region in the liver (Figure 8B). Inside the treated volume in the liver, the ΔTLocSurf ranged from 0 °C to 3 °C, with ΔTTreat,max ranging from 10.4 °C to 29.2 °C. Outside the treated volume, the ΔTLocSurf ranged from 0 °C to 6 °C, with ΔTTreat,max ranging from 0.1 °C to 9.7 °C. Inside the treated volume in the pancreas, the ΔTLocSurf ranged from 7.5 °C to 13 °C, with ΔTTreat,max ranging from 13.6 °C to 30.4 °C. The linear regression models in Figure 8A were calculated using ΔTTreat,max = 0.35⋅ΔTLocSurf + 17.38 for the liver, and ΔTTreat,max = 3.055⋅ΔTLocSurf-9.309 for the pancreas. In Figure 8B, the linear regression model was calculated using ΔTTreat,max = 0.07692⋅ΔTLocSurf + 5.78615 in the liver.
Figure 8. (A) ΔTLocSurf versus ΔTTreat,max inside the treated volumes in the liver (+) and the pancreas (×), including the linear regression models. (B) ΔTLocSurf versus ΔTTreat,max outside the treated volumes in the liver (+), including the linear regression model.
4. Discussion
4.1. Research questions
4.1.1. Temperature increase depends on the organ and IRE settings
This in vivo pilot study demonstrated that IRE is capable of producing sufficient ΔTSession,max to cause thermal damage (T ≥ 50 °C, ΔTSession,max ≥ 13 °C). This depends not only on tissue type and applied treatment parameters but also possibly on the occurrence of electrical arcing. For example, the dependence on tissue type was shown in the liver periphery and pancreatic tail, where the ΔTSession,max in the liver periphery was 18.4 °C higher compared to the pancreatic tail (case 2, session 1, TP1 vs. case 8, session 5). For the applied treatment parameters, a higher ΔTSession,max was observed with an increase in the number of electrode pairs (case 1, session 2 vs. case 2), the electric field strength (case 9, session1 vs. session 2 vs. session 3), and the pulse number (case 9, session 3 vs. session 4). These results are in accordance with the previous studies performed by Dunki-Jacobs et al. and Faroj et al. [17,19], who also demonstrated that IRE can cause thermal damage depending on the tissue type and the applied treatment parameters. In these pig studies IRE treatments were applied using several pulse parameters in the liver and the pancreas, while measuring the temperatures in the treated volume. For instance, Dunki-Jacobs et al. demonstrated higher ΔTSession,max in the liver than in the pancreas, while Faroj et al. showed higher ΔTSession,max for increasing electric field strength and pulse number in the liver.
Despite the significant influence of the applied treatment parameters on ΔTSession,max, a recent ex vivo study by O’Brien et al. concluded that it is still possible to reduce the ΔTSession,max by choosing an adequate order of the electrode pairs, and by applying a cycled pulsing scheme where the total number of pulses per electrode pair is subdivided and repeated in several cycles [22]. Using a perfused porcine liver model that cycled pulsing schemes it was possible to reduce the electrical current, increase the treatment zone size, and ultimately maintain a low tissue temperature compared to conventional pulsing schemes. Future in vivo studies should therefore investigate the thermal increase when cycled pulsing regimens are used.
Another element that can cause thermal damage is electrical arcing. In this phenomenon, an instantaneous increase in the electrical current density develops between the activated electrodes, resulting in (1) possibly inadequate treatment due to the redistribution of the electric field [23], and (2) significant temperature increase that can cause, for example, white coagulation [18,24,25]. During the IRE treatment, the electrical arcing is experienced as audible popping sound with visible electrical current spikes and possible system failure [23,25]. This phenomenon likely occurs because of:
High or increase in the electrical conductivity of the IRE-subjected tissue volume between the activated electrodes [25];
Ionization of gases that were formed by electrolysis of water into oxygen (O2) and hydrogen (H2) due to large electric field strengths[20,26,27].
To prevent this anomaly and reduce the probability of thermal damage, physicians are recommended to reduce the pulse voltage or the pulse width [5,23,25].
4.1.2. Surface temperature misrepresents ablation zone temperature
Temperature elevations induced by IRE in the treated regions sometimes produce a substantial rise in surface temperature. Our findings generally revealed a minimal temperature increase at the liver’s surface (with a median of 1 °C) and a relatively large temperature increase at the surface of the pancreas (with a median of 10 °C). This could be explained by the positions of the active electrodes with respect to the surface of the organs. Specifically, the active electrodes could be situated far from the hepatic surface, and close to the surface of the pancreatic tail. Another explanation could be higher perfusion in the liver, resulting in faster heat removal (heat sink effect) and therefore a smaller temperature rise at the surface of the liver.
In the clinic, it is not always feasible to perioperatively measure the surface temperature of the organ, even though it seems attractive as a simpler, time-saving alternative for temperature measurements with invasive probes. Such impracticality particularly holds when IRE treatments are performed percutaneously. For open procedures, the surface temperature may not significantly increase or even correlate with the maximum temperature increase during/after the treatment, despite the weak positive linear correlation, as was shown here for the liver. In our study, clinical pulse parameters were applied and the findings are hence translatable to the patient setting. In line with the findings, we recommend physicians to use invasive IRE-compatible temperature probes (probes that do not disturb the electric field distribution, e.g. non-metal probes) instead of surface measurements to accurately monitor perioperative temperature build-up.
4.1.3. Moderate hyperthermia in tumors may confer adjuvant effect on therapeutic efficacy
Although excessive temperatures can cause severe complications such as biliary obstruction and stenosis of blood vessels [2], moderate heating may enhance the IRE effect [28]. Edelblute et al. demonstrated that heating at 43 °C for 1-2 min significantly enhanced ex vivo IRE tumor ablation of Pan02 xenografts by 5.7-fold at 750 V/cm and by 1.7-fold at 1,500 V/cm. Furthermore, heating of the tumor area in an ectopic mouse model to 42 °C during IRE treatment almost doubled the median survival [16]. Pre-heating the tumor reduces the impedance of the tumor [29], thereby decreasing the IRE threshold. Accordingly, local heat evolution should be considered a welcomed side effect of IRE as long as it does not exceed mild hyperthermia that remains confined to the IRE ablation zone.
4.1.4. Heat sink effects are minimal in the liver and pancreas
Unexpectedly, the heat sink effects caused by the portal vein in the liver and the superior mesenteric vein in the pancreas were minimal. For example, after application of IRE in the vicinity of the portal vein in the liver hilum (case 3), a temperature increase of almost 6 °C was measured in the bile duct outside yet proximal to the treated region. Because of the poor contact of the temperature probe with the wall of the bile duct, this 6 °C can be considered an underestimation and hence possibly detrimental to such vital structures. Furthermore, in the pancreatic head with the superior mesenteric vein located inside the treated region (case 11), the ΔTSession,max was only 3 °C higher compared to that in case 10, where the superior mesenteric vein was located near the treated region.
There might be a (large) variation in blood flow and electrical resistance between the different animals used in the different experiments, possibly explaining the variation in ΔTSession,max. Furthermore, the flow resistance that was caused by the placement of the temperature probe might also affect the local blood flow. However, the most plausible explanation for the minimal heat sink effects is reduced blood flow due to anesthesia. This is illustrated in case 12, where the superior mesenteric vein was constricted, though only a 0.9 °C higher ΔTSession,max was registered compared to case 11. Both experiments were conducted in the same animal and a relatively low blood flow due to anesthesia could explain this relatively small difference. Further investigations should be performed to confirm whether the anesthesia adversely affects the heat sink effects caused by large blood vessels, including the superior mesenteric artery and the hepatic artery. In addition, the relatively short exposure to IRE could also contribute to the observed effect that sometimes the temperature increase was limited near large vessels.
4.1.5. Metal stents amplify the extent of heating
The presence and the orientation of the metal stent in the bile duct influence the ΔTSession,max. For instance, the experiments that included two electrodes parallel to the bile duct (case 6 and case 7) revealed that the presence of the stent resulted in a higher ΔTSession,max of 19.8 °C compared to similar IRE procedures in the absence of a stent. The experiments with three electrodes showed that the parallel orientation of the stent (case 4) resulted in a higher ΔTSession,max of 4.2 °C compared with perpendicular orientation (case 5).
These results are in line with the porcine study performed by Dunki-Jacobs et al. and with the phantom study performed by Scheffer et al. [17,30]. However, Scheffer et al. reported a higher ΔTSession,max in the phantom study when the stent was perpendicular to the electrodes, while we found a higher ΔTSession,max for a parallel orientation. This can be explained by the fact that, in the phantom composed of homogeneous tissue-mimetic material, the perpendicularly placed stent logically resulted in reduction of the length of the electrical current paths, resulting in larger electric current near the stent and, therefore, a greater increase in temperature. In our in vivo study, the stent was placed in the bile duct that has a wall with a comparatively large electrical resistance. Since the bile duct interrupts the current paths of the electrode pairs 1-2 and 3-1 in case 5, where electrodes were placed perpendicular to the bile duct, the length of the current paths was extended, resulting in larger electrical resistance (which means less electrical current) and, therefore, a lower ΔTSession,max.
According to case 4 through 7, placement of electrodes near a metal stent possibly produces thermal damage, also in surrounding normal tissue, which may explain the complications reported by Mansson et al. after applying IRE in the vicinity of a metal stent [31]. Thus, caution is warranted when a metal stent is placed in the treatment region and further investigations are required to determine the influence of the stent on the exacerbated ΔTSession,max that can be expected in the treated region.
4.2. Study limitations
This study has some limitations. First, the ΔTSession,max is underestimated in cases with a single electrode pair because the temperature increments in these cases are the highest near the electrode. Moreover, IRE was performed using an open surgery approach. It could be argued that, inasmuch as the operating room ventilation system was turned on, the surface temperature of the organs was lowered, which may have widened the temperature difference between the surface and tissue. Environmental cooling, however, is also employed in the human operating room setting and was therefore appropriately implemented in the experimental design. Another possible limitation is the application of IRE to healthy tissue. Several studies have found that healthy tissue has lower electrical conductivity than cancerous tissue [32,33]. This implies that ΔTSession,max in the treated volumes are underestimated in our study. However, Beitel-White et al. showed that healthy human hepatic and pancreatic tissues have higher electrical conductivities than the cancerous human hepatic and pancreatic tissue after the application of IRE [34], which validates the application of IRE in healthy tissue in this study. Still, limited data are available on electrical conductivity of IRE-subjected tissues. Finally, results are obtained from a case study series and a larger number of experiments would allow more robust conclusions. Nevertheless, the study provides very relevant insights that can contribute to future improvements in IRE protocols and make clinicians employing the technique aware of its limitations and factors that exact caution.
4.3. Future directions: Numerical treatment planning
The differences in organ-specific properties and their practical implications give rise to the notion that, in the future, numerical treatment planning should be performed to optimize IRE treatment. In the envisaged treatment planning protocol, numerical calculations are performed on 3D computer models constructed from patient-specific medical images before the IRE treatment. For each patient, parameters of pulses (such as voltage, duration, frequency, and number) and electrodes (such as configuration, number, active length, location, and distance between electrodes) are numerically optimized. This is done by calculating the distribution of the electric field strength and temperature in the treated volume, ensuring the coverage of the entire target volume with sufficient electric fields to produce a membrane permeabilization effect while reducing the probability of the thermal damage. In the 3D computer model, it is important to include perfusion effects to account for thermal redistribution in the treated volume, and large blood vessels to consider the heterogeneity of the tissues and to avoid a possible “electric field sink” effects [35,36]. The electric field sink is the reduction of the electric field strength in the target volume due to the presence of blood vessels in or near the target volume, which could result in incomplete treatment. The electric field sink effect depends for instance on the orientation of the electrode configuration with respect to the blood vessel and the diameter of the blood vessels [35].
Furthermore, the inclusion of large blood vessels can also be used to account for the local heat sink effect in regard to the thermal ablation techniques, such as radiofrequency ablation (RFA) and microwave ablation (MWA). Large blood vessels can yield a substantial local cooling effect in the treated volume, as was shown by several experimental and in silico studies [37-40]. However, to the best of our knowledge, no in silico study has considered the possible reduction of blood flow presumably due to anesthesia, which results in a possible underestimation of temperature increase. Therefore, the blood perfusion rate under the anesthesia effect should be investigated for more accurate treatment planning.
5. Conclusions
Based on this pilot study in porcine liver and pancreas, we conclude that IRE can produce sufficient temperature elevation to cause thermal damage, depending on tissue type, perfusion status, and IRE parameters such as the number of electrode pair, the electric field strength, and pulse number. The temperature elevation can be further influenced by the presence and orientation of a metal stent in the treatment zone. In the clinic, a temperature above 50 °C for a certain duration may undesirably damage vital structures proximal to the target tissue and cause clinical complications. Furthermore, the temperature elevation in the treatment zone is not always reflected in the surface temperature. Perioperative surface temperature monitoring therefore has little clinical value. Finally, the heat sink effect caused by the portal vein in the liver and the superior mesenteric vein in the pancreas is minimal. In the future, numerical treatment planning can be considered to optimize the IRE treatment and minimize thermal damage.
Potential Conflicts of Interest and Sources of Funding
This research was supported by the Dutch Cancer Society (Grants no. 2014-7244 and 10666). The author(s) declared the following potential conflicts of interest with respect to the research, authorship, and/or publication of this article: K. P. van Lienden, T. M. van Gulik and M.R. Meijerink are paid consultants for AngioDynamics. AngioDynamics had no role in the design of the study; in the collection, analyses, or interpretation of data; in the writing of the manuscript, or in the decision to publish the results.
References
- [1].Coelen RJ, Vogel JA, Vroomen LG, Roos E, Busch OR, van Delden OM, et al. Ablation with Irreversible Electroporation in Patients with Advanced Perihilar Cholangiocarcinoma (ALPACA): A Multicentre Phase I/II Feasibility Study Protocol. BMJ Open. (e015810) 2017;7 doi: 10.1136/bmjopen-2016-015810. [DOI] [PMC free article] [PubMed] [Google Scholar]
- [2].Scheffer HJ, Vroomen LG, de Jong MC, Melenhorst MC, Zonderhuis BM, Daams F, et al. Ablation of Locally Advanced Pancreatic Cancer with Percutaneous Irreversible Electroporation: Results of the Phase I/II PANFIRE Study. Radiology. 2017;282:585–97. doi: 10.1148/radiol.2016152835. [DOI] [PubMed] [Google Scholar]
- [3].Buijs M, Lienden KP, Wagstaff PG, Scheltema MJ, Bruin DM, Zondervan PJ, et al. Irreversible Electroporation for the Ablation of Renal Cell Carcinoma:A Prospective, Human In Vivo Study Protocol (IDEAL Phase 2b) JMIR Res Protoc. (e21) 2017;6 doi: 10.2196/resprot.6725. [DOI] [PMC free article] [PubMed] [Google Scholar]
- [4].Scheltema MJ, van den Bos W, de Bruin DM, Wijkstra H, Laguna MP, de Reijke TM. Focal vs Extended Ablation in Localized Prostate Cancer with Irreversible Electroporation;a Multi-center Randomized Controlled Trial. BMC Cancer. 2016;16:299. doi: 10.1186/s12885-016-2332-z. [DOI] [PMC free article] [PubMed] [Google Scholar]
- [5].O'Brien TJ, Bonakdar M, Bhonsle S, Neal RE, 2 nd, Aardema CH, Jr, Robertson JL, et al. Effects of Internal Electrode Cooling on Irreversible Electroporation Using a Perfused Organ Model. Int J Hyperthermia. 2019;35:44–55. doi: 10.1080/02656736.2018.1473893. [DOI] [PubMed] [Google Scholar]
- [6].Pucihar G, Kotnik T, Miklavcic D. Measuring the Induced Membrane Voltage with Di-8-ANEPPS. J Vis Exp. 2009;33:1659. doi: 10.3791/1659. [DOI] [PMC free article] [PubMed] [Google Scholar]
- [7].Neal RE, Davalos RV. The Feasibility of Irreversible Electroporation for the Treatment of Breast Cancer and Other Heterogeneous Systems. Ann Biomed Eng. 2009;37:2615–25. doi: 10.1007/s10439-009-9796-9. [DOI] [PubMed] [Google Scholar]
- [8].Heger M, van der Wal AC, Storm G, van Gemert MJ. Potential Therapeutic Benefits Stemming from the Thermal Nature of Irreversible Electroporation of Solid Cancers. Hepatob Pancreatic Dis Int Lett. 2015;14:331–3. doi: 10.1016/s1499-3872(15)60370-8. [DOI] [PubMed] [Google Scholar]
- [9].Zhao J, Wen X, Tian L, Li T, Xu C, Wen X, et al. Irreversible Electroporation Reverses Resistance to Immune Checkpoint Blockade in Pancreatic Cancer. Nat Commun. 2019;10:899. doi: 10.1038/s41467-019-08782-1. [DOI] [PMC free article] [PubMed] [Google Scholar]
- [10].Lee EW, Thai S, Kee ST. Irreversible Electroporation: A Novel Image-Guided Cancer Therapy. Gut Liver Rev. 2010;4:S99–104. doi: 10.5009/gnl.2010.4.S1.S99. [DOI] [PMC free article] [PubMed] [Google Scholar]
- [11].Lee EW, Chen C, Prieto VE, Dry SM, Loh CT, Kee ST. Advanced Hepatic Ablation Technique for Creating Complete Cell Death: Irreversible Electroporation. Radiology. 2010;255:426–33. doi: 10.1148/radiol.10090337. [DOI] [PubMed] [Google Scholar]
- [12].Onik G, Mikus P, Rubinsky B. Irreversible Electroporation: Implications for Prostate Ablation. Technol Cancer Res Treat. 2007;6:295–300. doi: 10.1177/153303460700600405. [DOI] [PubMed] [Google Scholar]
- [13].van Gemert MJ, Wagstaff PG, de Bruin DM, van Leeuwen TG, van der Wal AC, Heger M, et al. Irreversible Electroporation. Just Another Form of Thermal Therapy? Prostate. 2015;75:332–5. doi: 10.1002/pros.22913. [DOI] [PMC free article] [PubMed] [Google Scholar]
- [14].Nickfarjam A, Firoozabadi SM. Parametric Study of Irreversible Electroporation with Different Needle Electrodes: Electrical and Thermal Analysis. Int J Hyperthermia. 2014;30:335–47. doi: 10.3109/02656736.2014.937775. [DOI] [PubMed] [Google Scholar]
- [15].Lopresto V, Pinto R, Farina L, Cavagnaro M. Microwave Thermal Ablation: Effects of Tissue Properties Variations on Predictive Models for Treatment Planning. Med Eng Phys. 2017;46:63–70. doi: 10.1016/j.medengphy.2017.06.008. [DOI] [PubMed] [Google Scholar]
- [16].Davalos RV, Mir LM, Rubinsky B. Tissue Ablation with Irreversible Electroporation. Ann Biomed Eng. 2005;33:223–31. doi: 10.1007/s10439-005-8981-8. [DOI] [PubMed] [Google Scholar]
- [17].Dunki-Jacobs EM, Philips P, Martin RC. Evaluation of Thermal Injury to Liver, Pancreas and Kidney during Irreversible Electroporation in an In Vivo Experimental Model. Br J Surg. 2014;101:1113–21. doi: 10.1002/bjs.9536. [DOI] [PubMed] [Google Scholar]
- [18].Cornelis FH, Cindrič H, Kos B, Fujimori M, Petre EN, Miklavčič D, et al. Peri-tumoral Metallic Implants Reduce the Efficacy of Irreversible Electroporation for the Ablation of Colorectal Liver Metastases. Cardiovasc Interv Radiol. 2020;43:84–93. doi: 10.1007/s00270-019-02300-y. [DOI] [PMC free article] [PubMed] [Google Scholar]
- [19].Faroja M, Ahmed M, Appelbaum L, Ben-David E, Moussa M, Sosna J, et al. Irreversible Electroporation Ablation: Is All the Damage Nonthermal?Radiology. 2013;266:462–70. doi: 10.1148/radiol.12120609. [DOI] [PubMed] [Google Scholar]
- [20].van den Bos W, Scheffer HJ, Vogel JA, Wagstaff PG, de Bruin DM, de Jong MC, et al. Thermal Energy during Irreversible Electroporation and the Influence of Different Ablation Parameters. J Vasc Interv Radiol. 2016;27:433–43. doi: 10.1016/j.jvir.2015.10.020. [DOI] [PubMed] [Google Scholar]
- [21].Martin RC., 2 nd Irreversible Electroporation of Stage 3 Locally Advanced Pancreatic Cancer:Optimal Technique and Outcomes. J Vis Surg. 2015;1:4. doi: 10.3978/j.issn.2221-2965.2015.05.02. [DOI] [PMC free article] [PubMed] [Google Scholar]
- [22].O'Brien TJ, Lorenzo MF, Zhao Y, Neal Ii RE, Robertson JL, Goldberg SN, et al. Cycled Pulsing to Mitigate Thermal Damage for Multi-Electrode Irreversible Electroporation Therapy. Int J Hyperthermia. 2019;36:953–63. doi: 10.1080/02656736.2019.1657187. [DOI] [PubMed] [Google Scholar]
- [23].Neal RE, Kavnoudias H, Thomson KR. An “off-the-shelf“ System for Intraprocedural Electrical Current Evaluation and Monitoring of Irreversible Electroporation Therapy. Cardiovasc Intervent Radiol. 2015;38:736–41. doi: 10.1007/s00270-014-0961-7. [DOI] [PubMed] [Google Scholar]
- [24].Ben-David E, Ahmed M, Faroja M, Moussa M, Wandel A, Sosna J, et al. Irreversible Electroporation: Treatment Effect Is Susceptible to Local Environment and Tissue Properties. Radiology. 2013;269:738–47. doi: 10.1148/radiol.13122590. [DOI] [PMC free article] [PubMed] [Google Scholar]
- [25].Wandel A, Ben-David E, Ulusoy BS, Neal R, Faruja M, Nissenbaum I, et al. Optimizing Irreversible Electroporation Ablation with a Bipolar Electrode. J Vasc Interv Radiol. 2016;27:1441–50. doi: 10.1016/j.jvir.2016.06.001. [DOI] [PubMed] [Google Scholar]
- [26].Bardy GH, Coltorti F, Stewart RB, Greene HL, Ivey TD. Catheter-Mediated Electrical Ablation the Relation between Current and Pulse Width on Voltage Breakdown and Shock-Wave Generation. Circ Res. 1988;63:409–14. doi: 10.1161/01.res.63.2.409. [DOI] [PubMed] [Google Scholar]
- [27].Guenther E, Klein N, Mikus P, Stehling MK, Rubinsky B. Electrical Breakdown in Tissue Electroporation. Biochem Biophys Res Commun. 2015;467:736–41. doi: 10.1016/j.bbrc.2015.10.072. [DOI] [PubMed] [Google Scholar]
- [28].Edelblute CM, Hornef J, Burcus NI, Norman T, Beebe SJ, Schoenbach K, et al. Controllable Moderate Heating Enhances the Therapeutic Efficacy of Irreversible Electroporation for Pancreatic Cancer. Sci Rep. 2017;7:11767. doi: 10.1038/s41598-017-12227-4. [DOI] [PMC free article] [PubMed] [Google Scholar]
- [29].Rossmanna C, Haemmerich D. Review of Temperature Dependence of Thermal Properties, Dielectric Properties, and Perfusion of Biological Tissues at Hyperthermic and Ablation Temperatures. Crit Rev Biomed Eng Rev. 2014;42:467–92. doi: 10.1615/critrevbiomedeng.2015012486. [DOI] [PMC free article] [PubMed] [Google Scholar]
- [30].Scheffer HJ, Vogel JA, van den Bos W, Neal RE, 2 nd, van Lienden KP, Besselink MG, et al. The Influence of a Metal Stent on the Distribution of Thermal Energy during Irreversible Electroporation. PLoS One. (e0148457) 2016;11 doi: 10.1371/journal.pone.0148457. [DOI] [PMC free article] [PubMed] [Google Scholar]
- [31].Mansson C, Nilsson A, Karlson BM. Severe Complications with Irreversible Electroporation of the Pancreas in the Presence of a Metallic Stent: A Warning of a Procedure that Never Should be Performed. Acta Radiol Short Rep. 2014;3:1–3. doi: 10.1177/2047981614556409. [DOI] [PMC free article] [PubMed] [Google Scholar]
- [32].Haemmerich D, Schutt DJ, Wright AW, Webster JG, Mahvi DM. Electrical Conductivity Measurement of Excised Human Metastatic Liver Tumours before and after Thermal Ablation. Physiol Meas. 2009;30:459–66. doi: 10.1088/0967-3334/30/5/003. [DOI] [PMC free article] [PubMed] [Google Scholar]
- [33].Stauffer PR, Rossetto F, Prakash M, Neuman DG, Lee T. Phantom and Animal Tissues for Modelling the Electrical Properties of Human Liver. Int J Hyperthermia. 2003;19:89–101. doi: 10.1080/0265673021000017064. [DOI] [PubMed] [Google Scholar]
- [34].Beitel-White N, Bhonsle S, Martin RC, Davalos RV. Electrical Characterization of Human Biological Tissue for Irreversible Electroporation Treatments. 2018 40 th Annual International Conference of the IEEE Engineering in Medicine and Biology Society (EMBC) 2018:4170–3. doi: 10.1109/EMBC.2018.8513341. [DOI] [PubMed] [Google Scholar]
- [35].Marcan M, Kos B, Miklavcic D. Effect of Blood Vessel Segmentation on the Outcome of Electroporation-Based Treatments of Liver Tumors. PLoS One. (e0125591) 2015;10 doi: 10.1371/journal.pone.0125591. [DOI] [PMC free article] [PubMed] [Google Scholar]
- [36].Golberg A, Bruinsma BG, Uygun BE, Yarmush ML. Tissue Heterogeneity in Structure and Conductivity Contribute to Cell Survival during Irreversible Electroporation Ablation by “Electric Field Sinks“. Sci Rep. 2014;5:8485. doi: 10.1038/srep08485. [DOI] [PMC free article] [PubMed] [Google Scholar]
- [37].Zorbas G, Samaras T. A Study of the Sink Effect by Blood Vessels in Radiofrequency Ablation. Comput Biol Med. 2015;57:182–6. doi: 10.1016/j.compbiomed.2014.12.014. [DOI] [PubMed] [Google Scholar]
- [38].Jiang K, Chen Y, Liu Y, Dong J, Liu A, Huang Z, et al. Heat-Irrigate Effect of Radiofrequency Ablation on Relevant Regional Hepatocyte in Living Swine Liver-Initial Study on Pathology. Cell Biochem Biophys. 2015;72:37–41. doi: 10.1007/s12013-014-0398-2. [DOI] [PubMed] [Google Scholar]
- [39].Chen RD, Lu F, Wu F, Jiang T, Xie LT, Kong DX. An Analytical Solution for Temperature Distributions in Hepatic Radiofrequency Ablation Incorporating the Heat-sink Effect of Large Vessels. Phys Med Biol. 2018;63:235026. doi: 10.1088/1361-6560/aaeef9. [DOI] [PubMed] [Google Scholar]
- [40].Ringe KI, Lutat C, Rieder C, Schenk A, Wacker F, Raatschen HJ. Experimental Evaluation of the Heat Sink Effect in Hepatic Microwave Ablation. PLoS One. (e0134301) 2015;10 doi: 10.1371/journal.pone.0134301. [DOI] [PMC free article] [PubMed] [Google Scholar]


