

Abstract
Hierarchical cognitive control enables us to execute actions guided by abstract goals. Previous research has suggested that neuronal oscillations at different frequency bands are associated with top-down cognitive control; however, whether distinct neural oscillations have similar or different functions for cognitive control is not well understood. The aim of the current study was to investigate the oscillatory neuronal mechanisms underlying two distinct components of hierarchical cognitive control: the level of abstraction of a rule, and the number of rules that must be maintained (set-size). We collected EEG data in 31 men and women who performed a hierarchical cognitive control task that varied in levels of abstraction and set-size. Results from time-frequency analysis in frontal electrodes showed an increase in theta amplitude for increased set-size, whereas an increase in δ was associated with increased abstraction. Both theta and δ amplitude correlated with behavioral performance in the tasks but in an opposite manner: theta correlated with response time slowing when the number of rules increased, whereas δ correlated with response time when rules became more abstract. Phase-amplitude coupling analysis revealed that δ phase-coupled with β amplitude during conditions with a higher level of abstraction, whereby beta band may potentially represent motor output that was guided by the δ phase. These results suggest that distinct neural oscillatory mechanisms underlie different components of hierarchical cognitive control.
SIGNIFICANCE STATEMENT Cognitive control allows us to perform immediate actions while maintaining more abstract, overarching goals in mind and to choose between competing actions. We found distinct oscillatory signatures that correspond to two different components of hierarchical control: the level of abstraction of a rule and the number of rules in competition. An increase in the level of abstraction was associated with δ oscillations, whereas theta oscillations were observed when the number of rules increased. Oscillatory amplitude correlated with behavioral performance in the task. Finally, the expression of β amplitude was coordinated via the phase of δ oscillations, and theta phase-coupled with γ amplitude. These results suggest that distinct neural oscillatory mechanisms underlie different components of hierarchical cognitive control.
Keywords: abstraction, cognitive control, EEG, phase-amplitude coupling, set-size, time frequency
Introduction
Cognitive control orchestrates thoughts and actions according to internal goals (Norman and Shallice, 1986; Braver 2012). The frontal cortex is central to cognitive control, where representations of rules and goals provide top-down influences over motor and perceptual systems to guide actions (E. K. Miller and Cohen, 2001; B. T. Miller and D'Esposito, 2005; Badre and Nee, 2018; Vogelsang and D'Esposito, 2018). Previous research findings suggest that the frontal cortex is organized hierarchically along the rostral-caudal axis, where the caudal frontal cortex is involved in the control of concrete action representations, whereas the rostral PFC is involved in the control of abstract rules, goals, and contexts (Badre and Nee, 2018). We have previously demonstrated that, at any particular level of representation, an appropriate action can be chosen from a number of competing rules (number of rules defined as set-size); and as competition increases, cognitive control is required to adjudicate among alternatives (Badre and D'Esposito, 2007).
It is proposed that rhythmic neural oscillations support a diverse range of cognitive functions, whereby oscillations in different frequency bands, ranging from slow δ oscillations to faster γ oscillations, are generated by distinct biophysical mechanisms and are associated with different cognitive functions (for review, see Sauseng et al., 2010; Roux and Uhlhaas, 2014; Helfrich and Knight, 2016; Sadaghiani and Kleinschmidt, 2016; Helfrich et al., 2019). Phase-amplitude coupling (PAC) between frequency bands, in which the phase of a slow oscillation, such as theta, can modulate the amplitude of faster oscillations, such as γ (Lisman and Jensen, 2013; Nácher et al., 2013, Arnal et al., 2015; Morillas-Romero et al., 2015; Voytek et al., 2015; Heusser et al., 2016),further supports interareal communication and interactions between cognitive functions. However, whether or not there are distinct neural oscillations associated with different components of hierarchical cognitive control is unknown.
In our previous human electrocorticography study, we found that tasks that required increased hierarchical cognitive control were associated with increased theta-band synchronization between the prefrontal and premotor/motor regions (Voytek et al., 2015). Furthermore, the phase of prefrontal theta oscillations showed increased coupling with the amplitude of γ oscillations in the motor cortex (Voytek et al., 2015). A series of nonhuman primate experiments have also found that beta band oscillations are associated with rule representation in the frontal cortex, in which distinct neural populations represent different rules and become more synchronized in β frequency when the rule is behaviorally relevant (Buschman et al., 2012; Antzoulatos and Miller, 2014, 2016; Wutz et al., 2018). Furthermore, updating the active rule representation increases δ oscillations in these same neural populations, preceded by a modulation in β oscillations (Antzoulatos and Miller, 2016). Together, these findings suggest that theta-γ and δ-beta band oscillations are associated with hierarchical cognitive control. However, in these experiments, tasks that engaged more abstract rules also had higher set-size (higher number of rules to select from), making it impossible to determine whether the modulation of neural oscillations and PAC by these cognitive processes are driven by set-size or abstraction. In this study, our aim was to address this question.
Materials and Methods
Experimental design and statistical analysis
Thirty-one healthy participants (18 females; mean age 20 years; range 18-34 years) with normal or corrected-to-normal vision were recruited from the University of California, Berkeley. Written consent was obtained before the start of the experiment, and participants received monetary compensation for their participation. The study was approved by the University of California, Berkeley Committee for Protection of Human Subjects.
The experiment consisted of a single session of EEG during performance of the hierarchical cognitive control task. Behavioral performance, response time (RT), and accuracy were analyzed using two-way repeated-measures ANOVA with two factors: abstraction (high and low) and set-size (high and low). Time-frequency analysis was conducted using stimulus and response-locked epochs for the abstraction and set-size contrast. The time-frequency analysis was restricted to a midfrontal electrode cluster that was defined using hierarchical clustering of the time-frequency data independent of the contrasts of interest. We corrected for multiple comparisons and spurious findings using permutation testing with significance determined by cluster mass across all seven electrode clusters for the abstraction and set-size contrast. Next, the significant time-frequency bands were correlated with RT as a function of abstraction and set-size using Pearson correlation. Finally, PAC was computed between δ phase and β amplitude and theta phase and γ amplitude for each task condition. PAC values were input to a two-way repeated-measures ANOVA with two factors: abstraction and set-size.
Experimental task
The task used in this study was adapted from two previously published studies (Badre and D'Esposito, 2007, 2009; Voytek et al., 2015). We manipulated two components of hierarchical cognitive control: abstraction and set-size (Fig. 1A). During the response task (low-abstraction conditions), participants learned the association between a colored square and a button response. The response task had two levels of set-size: a low set-size condition (in which four colored squares had to be associated with four responses) and a high set-size condition (in which eight different colored squares had to be associated with eight response options; Fig. 1A). In the dimension task (high abstract conditions), participants were presented with a colored square that contained two objects. The color of the square indicated the dimension (shape or texture) by which the participant had to evaluate the two objects. Importantly, the abstraction task contained two levels of set-size similar to the response task: a low level of set-size and yet still higher in abstraction and a higher level of set-size and also high in abstraction (Fig. 1A). In the high-abstraction, low set-size condition, participants made a judgment along only one dimension (either shape or texture) as both colored squares mapped to a single dimension (e.g., a purple square or a green square signal that participants must judge whether the two objects have the same or different shape). In the high-abstraction, high set-size condition, two colored squares mapped to two different dimensions(e.g., red represents a perceptual judgment along the shape dimension, blue represents the texture dimension).
Figure 1.

Hierarchical cognitive control task. A, The hierarchical cognitive control task used a 2 × 2 design with four conditions. On the x axis, the set-size increases within a fixed level of abstraction. On the y axis, the level of abstraction increases. Behavioral results for RT (B) and accuracy (C). Error bars indicate SEM.
Our previous versions of the experiment (Badre and D'Esposito, 2007; Voytek et al., 2015) did not match performance between the low- and high-abstraction tasks, as the highest set-size condition of a low-abstraction task showed worse performance than the lowest set-size of a high-abstraction task. By matching performance across levels of abstraction, we remove a potential confound of task difficulty in isolating the processing of abstract rule representations (Todd et al., 2013). To match performance between levels of abstraction, we ran multiple pilot experiments, in which we increased the difficulty of the response task into a comparable performance range as the dimensions task. In particular, we iteratively increased the number of competing rules in the response task and shortened the response window from 3 to 2 s to increase RT and reduce the accuracy of participants for the response task. At the completion of this pilot testing, we selected two conditions to be defined as low set-size based on performance levels: the response task with four responses and the dimensions task with one dimension. For the high set-size conditions, we used the response task with eight responses and the dimension task with two dimensions.
In the experiment, participants performed eight blocks, two of each of the four conditions. Each block contained 48 trials; thus, each participant completed 96 trials per experimental condition. Each trial was presented on the screen for 2 s, and participants were instructed to provide their response within that time window. Each trial was separated by a fixation cross that varied exponentially in length from 3 to 10 s. The experiment was programmed in Psychtoolbox implemented in MATLAB 2015a (The MathWorks). Before the start of the experimental task, participants were instructed to maintain their gaze on a fixation point and to remain still for 5 min with eyes open followed by 5 min eyes closed. This resting-state EEG data were not analyzed for the purpose of this paper.
EEG recording and preprocessing
EEG data were recorded from 64 active electrodes using a BioSemi ActiveTwo amplifier with Ag-AgCl pin-type active electrodes mounted on an elastic cap according to the extended 10-20 system (BioSemi). In addition, four electrodes were used to monitor horizontal and vertical eye movements, and two electrodes recorded electrical activity from the mastoids. Signals were amplified and digitized at 1024 Hz and stored for offline analysis. Participants were trained before the experiment to minimize eye movements, blinking, and muscle movement before the experiment.
The EEG data were analyzed with the software package EEGLab14 (Delorme and Makeig, 2004), which used MATLAB2015a (The MathWorks). The continuous EEG data were rereferenced to an average of the mastoid electrodes and filtered digitally with a bandpass of 0.1–100 Hz (two-way least-squares finite impulse response filter). The continuous data were then divided into epochs ranging from 1000 ms before stimulus onset until 2000 ms after stimulus onset. The epochs in the EEG data were visually inspected and trials that contained excessive noise, such as muscle artifacts, were removed, resulting in an average of 4.5% of trials that were removed across participants. Furthermore, electrode channels with excessive noise were identified by visual inspection and reconstructed using the average of neighboring electrodes. Eye-blinks and other EEG-related artifacts were identified and rejected using the extended info-max independent component analysis using the EEGLab toolbox with default mode training parameters (Delorme and Makeig, 2004).
Electrode clustering
Electrode clusters were defined based on a data-driven hierarchical clustering approach that grouped electrodes based on the similarity of the evoked oscillatory amplitude that ranged from 2 to 30 Hz (for similar procedure, see Clarke et al., 2018). Time-frequency decomposition was averaged across all trials, conditions, and participants. Data from each electrode were vectorized such that it included all time points and frequencies. A distance metric was calculated for each electrode based on the similarity in evoked spectral response. An agglomerative hierarchical clustering algorithm was applied that grouped pairs of electrodes with the most similar spectral response. The two most similar electrode pairs were averaged. This process continued until all electrodes were paired under a single tree. A dendrogram of the hierarchical clusters was created, and only clusters that fit an a priori cluster scheme based on Clarke et al. (2018) were included in the time-frequency analysis. Each electrode cluster was defined to only included contiguous electrodes, and we excluded electrode clusters with less than three electrodes. This hierarchical clustering approach resulted in six electrode clusters that were used in the main analysis (Fig. 2). Results reported here for an electrode cluster is the averaged spectral response of all electrodes within the cluster. Our previous evidence using this task in fMRI (Badre and D'Esposito, 2007) and electrocorticography (Voytek et al., 2015) found task-modulated activity related to cognitive control in lateral PFC. However, due to the problem of volume conduction and electric field properties in EEG, activation of bilateral sites is commonly found in the midline (Sasaki et al., 1996; Stropahl et al., 2018). Therefore, we focused our analysis on the frontal midline electrode cluster and capitalized on the temporal resolution afforded by EEG. We hypothesized that the frontal midline electrode clusters (highlighted in Fig. 2) would show the strongest effects of hierarchical cognitive control (for review, see Cavanagh and Frank, 2014).
Figure 2.
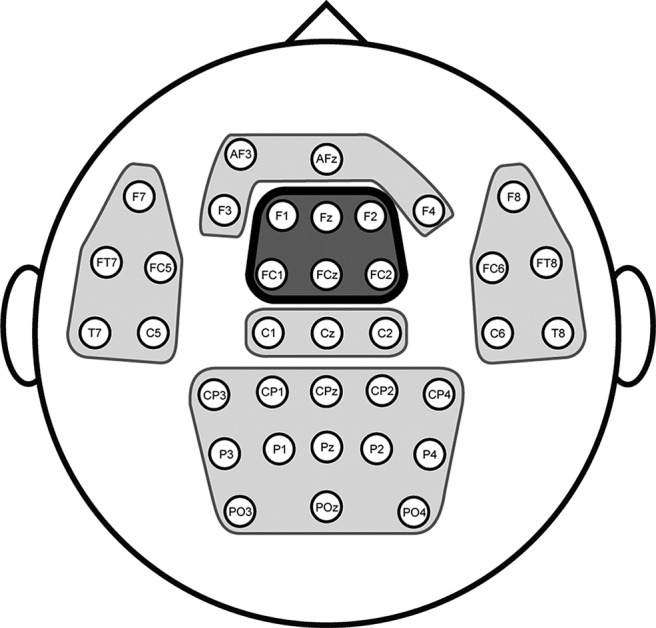
Electrode clusters used for EEG analysis. Hierarchical clustering of the time-frequency data for each electrode revealed six distinct electrode clusters. The analysis focused on the frontal midline electrode cluster (outlined). The other electrode clusters were used for cluster-mass permutation testing in time-frequency analysis.
Time-frequency analysis
Time-frequency analysis was applied using six cycle Morlet wavelet in the frequency range of 2–50 Hz with steps of 1 Hz between each wavelet center. The Morlet wavelets were applied to sliding time windows of 20 ms increments in the entire epoch ranging from −1000 ms to 2000 ms with stimulus onset as time 0. To minimize the problem of edge artifacts, we concatenated mirrored (i.e., time inverted) segments before and after the task epoch (Cohen, 2014). Time-frequency analysis was performed on these extended epochs, andmirrored segments were discarded from the final analysis (for similar procedure, see Fell and Axmacher, 2011; Vogelsang et al., 2018). Results reported here were not baseline-corrected since we were interested in differences across conditions; therefore, baseline correction is not necessary (for similar approaches, see Fell and Axmacher, 2011; Gruber et al., 2013; Vogelsang et al., 2018). For each of the four experimental conditions, only trials in which the participant made a correct response were included in the analysis. Trial numbers used in the analysis were as follows: low-abstraction, low set-size [mean (SD)] = 92.4 (4.8), range 76–96; low-abstraction, high set-size = 88.1 (8.0), range 56–96; high-abstraction, low set-size 91.8 (6.8), range 68–96; high-abstraction, high set-size 87.1 (7.4), range 68–96. Our main analysis was two contrasts: one for “abstraction” (high vs low) and one for “set-size” (high vs low)
An across-participant nonparametric statistical approach was applied to test for significant time-frequency differences between the contrasts of interest. We ran cluster-mass permutation testing in which the average t value within a significant cluster (p < 0.05) is used to evaluate significance. The permutation testing procedure consisted of the following steps. First, we computed the cluster mass for each of the contrasts of interest (abstraction and set-size) for each of the six electrode clusters. Second, the experimental conditions for the abstraction (or set-size) contrast were randomly swapped for 50% of the participants such that any systematic differences between the conditions were eliminated. We ran the contrast for this randomized pairing and calculated the largest absolute cluster mass across all electrode clusters. This randomization process was repeated 1000 times to create a null distribution of the largest negative and positive cluster mass values. Using an α level of 0.05 with 1000 permutations, we used the 25th and 975th values to represent the critical mass values, and values below or higher than these values were considered to be significant effects. This stringent procedure allowed us to control for multiple comparisons across the electrode clusters (Blair and Karniski, 1993; Maris and Oostenveld, 2007).
PAC analysis
In addition to a time-frequency analysis, we also sought evidence for how different frequency bands may interact with each other during hierarchical cognitive control. One possible mechanism is PAC, which involves examining the relationship between the phase of a lower-frequency band (e.g., δ and theta) and the amplitude of a higher-frequency band (e.g., β and γ). To examine whether the phase of slow oscillatory bands modulated the amplitude of faster-frequency bands as a function of increased rule abstraction and rule set-size, we computed PAC for the phase of slow-frequency bands in the range of2–7 Hz, which includes δ and theta, with the amplitude of the higher-frequency spectrum ranging from 10 to 49 Hz separately for each task condition. We narrowed our analysis to the coupled pairs motivated by our time-frequency analysis and a priori based on our previous findings (Voytek et al., 2015).
To compute PAC, we extracted the phase of the δ and theta frequency bands using a three cycle Morlet wavelet convolution and the amplitude of the higher frequencies using a five cycle Morlet wavelet convolution. We selected these parameters such that the half width full mass of the low and high frequencies were more closely matched (Cohen, 2019). We calculated PAC using the phase and amplitude values from the significant time windows observed in the time-frequency contrast for δ band (200–1400 ms) and theta band (600–1200 ms). For each participant, the phase (θ) and amplitude (M) values of each trial were concatenated into a single continuous time series (n is the number of time points) and PAC was calculated according to Equation 1 as follows:
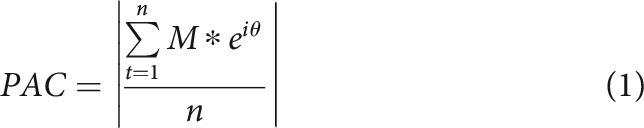 |
We applied nonparametric permutation testing to determine whether the obtained PAC values would be expected given the null hypothesis of no relationship between phase and amplitude. The permutation procedure involved temporally shifting the amplitude values with a random temporal offset of at least 10% the length of the time series and calculating PAC (Cohen, 2014). After 1000 repetitions, PAC is converted into a z score from the null distribution, resulting in PACz. We were interested in changes in PACz with increased abstraction and set-size. In order to reduce multiple comparisons, we used a priori coupled pairs for the hypothesized coupled frequencies based on the time-frequency analysis and ran a two-way repeated-measures ANOVA of within-participant factors: abstraction and set-size.
Code and data availability
Custom code used for these analyses is available on request to the corresponding author. The authors assert that all requests for raw data within reason will be fulfilled by the corresponding author.
Results
Behavioral results
The task was designed to separately manipulate abstraction and set-size during hierarchical cognitive control. To test the effects of our behavioral manipulation, we performed separate two-way repeated-measures ANOVA. We entered two independent variables: abstraction (low, high) and set-size (low, high), and RT and accuracy as dependent variables. For RT, the ANOVA revealed a significant main effect of abstraction (high-abstraction mean = 1132.0, SD = 105.3 ms; low-abstraction mean = 974.1, SD = 95.0 ms; F(1,30) = 398, p < 0.0001, η2p = 0.93), a main effect of set-size (high set-size mean = 1176.0, SD = 95.7 ms; low set-size mean = 930.1, SD = 95.5 ms; F(1,30) = 92.1, p < 0.0001, η2p = 0.75), and an interaction (F(1,30) = 53.1, p < 0.0001, η2p = 0.64) (Fig. 1B). Participants were slower as a function of abstraction and set-size. For accuracy, the ANOVA revealed a main effect of set-size (high set-size mean = 94.7%, SD = 5.0%; low set-size mean = 97.7%, SD = 2.9%; F(1,30) = 10.2, p = 0.003, η2p = 0.25) but did not reveal a significant main effect of abstraction (F(1,30) = 0.11, p = 0.75, η2p = 0.0036) or interaction (Fig. 1C). Participants were less accurate for the conditions that required maintenance of a larger set-size, but behavior was matched across levels of abstraction.
Time-frequency results
We performed time-frequency analyses to determine how set-size and abstraction modulate patterns of neural oscillations during hierarchical cognitive control. The time-frequency analyses focused on the spectral amplitude differences ranging from 2 to 50 Hz in the entire epoch time window (−1000 to 2000 ms relative to stimulus onset) for both the abstraction and set-size contrast (vs low-abstraction and vs low set-size). For the abstraction contrast (Fig. 3A), across all electrode clusters, there was a significant increase in the δ frequency band (2–3 Hz) from 100 to 2000 ms after stimulus onset and a significant decrease in the β frequency band (peak at 12–22 Hz) from 500 to 1500 ms after stimulus onset (peak at 500-1000 ms) for all electrode clusters. In the topographic plots, it can be seen that, in the abstraction contrast, δ amplitude showed the strongest increase in mid and right frontal electrode clusters (Fig. 3B), whereas β amplitude showed the strongest decrease in the mid frontal electrode cluster (Fig. 3C). For the set-size contrast (Fig. 3D), across all electrode clusters, there was a significant increase in amplitude in the theta frequency band (4–6 Hz) from 850 to 1700 ms after stimulus onset. There was a significant decrease in amplitude in the β frequency band (12–30 Hz) at ∼500–1500 ms after stimulus onset in frontal midline electrode cluster, and 500-1800 ms after stimulus onset in central and posterior electrode clusters. In the topographic plots, it can be seen that, in the set-size contrast, theta amplitude showed the strongest increase in the frontal midline electrode cluster and β amplitude showed the strongest decrease in the frontal midline and central midline electrode clusters. Together, two different low-frequency bands increased in amplitude in the midfrontal electrode cluster. δ amplitude increased for abstraction and theta amplitude increased for set-size. However, β band amplitude decreased for both higher abstraction and higher set-size, but with a slightly different spread in frequency within the beta band. Peak β amplitude modulation for the abstraction contrast occupied a lower-frequency range, from 12 to 18 Hz, compared with the wider frequency range in peak β amplitude modulation for the set-size contrast from 12 to 22 Hz.
Figure 3.

Time-frequency analysis of hierarchical cognitive control along two dimensions: abstraction and set-size. A, In the frontal-midline electrode cluster, there was a significant increase in δ and decrease in β amplitude as a function of task abstraction. Dark outline indicates time-frequency clusters that were found to be significant at p < 0.05 and survived correction for multiple comparisons. B, δ amplitude increase was localized to the frontal midline and right frontal. C, Beta amplitude decrease was localized to the frontal and central midline. D, In the frontal-midline electrode cluster, there was a significant increase in theta amplitude and decrease in β amplitude as a function of task set-size. E, The increase in theta amplitude was localized to the frontal-midline electrodes. F, The decrease in β amplitude was localized to frontal-midline electrodes.
In order to better understand the time course of amplitude modulations found for the contrasts of interest, the time course for the amplitude of δ, theta, and β frequency bands in the frontal midline cluster is plotted in Figure 4. At ∼500 ms after stimulus onset, the high-abstraction, high set-size condition showed the greatest δ amplitude increase followed by high-abstraction, low set-size, and then both low-abstraction conditions (Fig. 4A). At ∼1200–1800 ms after stimulus onset, the two high set-size conditions showed an increase in theta amplitude (Fig. 4B). Thus, both δ and theta frequency bands showed increased amplitude sustained throughout stimulus processing for greater abstraction or set-size. Finally, there was a decrease in amplitude in the β frequency band for all four conditions for the first 600 ms (Fig. 4C). However, only the high-abstraction, high set-size condition showed a significant and prolonged decrease in β amplitude relative to the other three conditions from 600 to 1600 ms after stimulus onset.
Figure 4.

Time course of task-evoked oscillatory amplitude. At time 0, the stimulus for the task is presented. A, δ amplitude showed the greatest increase in the two high-abstraction conditions (red and orange). B, Theta amplitude showed the greatest in the response task (dark blue and light blue) in the first 0.5 s and the greatest increase in the high set-size conditions (dark blue and red) in the 1–2 s range. C, Beta amplitude showed the greatest decrease in the high-abstraction, high set-size condition (red). Error bars indicate SEM.
Since the stimulus-locked time-frequency effects persist after the probe for >1 s, it is possible that decreased β amplitude was related to a systematic difference in RT between conditions, and low-frequency activity in δ and theta band might only be significantly elevated after a response is made reflecting post-response monitoring processes. If decreased β amplitude was indeed driven by motor-related processes, then it would not be observed in a response-locked analysis. If low-frequency activity reflects post-response monitoring processes, then it would only be observed after the response in a response-locked analysis. We performed a response-locked time-frequency analysis on the abstraction and set-size contrast in the midfrontal electrode cluster (Fig. 5). For the abstraction contrast (Fig. 5A), there was a significant decrease in amplitude in the β frequency band (10–20 Hz) just before a response, whereas there was no change in beta band amplitude for the set-size contrast (Fig. 5B). Thus, the modulation of β amplitude by set-size was most likely driven by a difference in RT, whereas the modulation of β amplitude as a function of task abstraction is more likely driven by stimulus processing. No significant δ band amplitude was observed time-locked to the period just before the response. For the set-size contrast (Fig. 5B), there was a significant increase in amplitude in the theta frequency band (3-8 Hz), starting at 1500 ms before a response and persisted after the response. Thus, the significant change in theta amplitude as a function of set-size most likely does not only reflect post-response processes, but also was related to preresponse stimulus processing.
Figure 5.

Response-locked time-frequency analysis for the abstraction (A) and set-size (B) contrast in the midfrontal electrode cluster found a significant decrease in low β amplitude before response for abstraction and increase in theta amplitude before and after response for set-size. The line at time 0 is the time that the participant made a response. Dark outline indicates time-frequency clusters that were found to be significant at p < 0.05 with a cluster correction of k = 100.
Relationship between neuronal oscillations and behavior
Next, we investigated whether the significant changes in spectral amplitude during different task conditions correlated with behavior. To test this, we extracted spectral amplitude values from the significant time-frequency clusters for the abstraction (2–3 Hz δ and 18–22 Hz β; Fig. 3A) and set-size (4–6 Hz theta and 18-22 Hz β; Fig. 3B) contrasts from the frontal midline electrode cluster, since this cluster showed the strongest peak in these contrasts (Fig. 3). We correlated the change in β and δ amplitude with the change in RT as a function of abstraction. RT was analyzed since accuracy was at ceiling for many participants. For the abstraction contrast, task differences in β band amplitude were significantly negatively correlated with RT (r(30) = −0.59, p = 0.001), and task differences in δ band amplitude were significantly positively correlated with RT (r(30) = 0.45, p = 0.012; Fig. 6A). For the set-size contrast, we correlated the change in β and theta amplitude with the change in RT as a function of task set-size. We found that the increase in theta band amplitude was significantly positively correlated with RT (r(30) = 0.36, p = 0.047), whereas there was no significant relationship between β band amplitude and behavior (r(30) = −0.24, p = 0.20; Fig. 6B). Our time-frequency results (Fig. 3) found that peak β amplitude decreased from 12 to 18 Hz by abstraction and decreased from 12 to 22 Hz by set-size. Therefore, we examined whether the observed behavioral correlation was consistent for the high (18-22 Hz) and low (12-18 Hz) β bands. Just as with the high beta band, amplitude in the low beta band significantly negatively correlated with abstraction (r(30) = −0.47, p = 0.008) but did not show a significant relationship with set-size (r(30) = −0.15, p = 0.41). Thus, we do not find evidence that low and high β serve different functional roles. Together, increased δ and decreased β amplitude correlated with increased RT as a function of rule abstraction, and increased theta amplitude correlated with increased RT as a function of task set-size.
Figure 6.

Behavior to brain correlations. Correlation analysis for RT to spectral density for the significant clusters in abstraction (A) and set-size (B). Error bars indicate 95% CIs. *p < 0.05, **p < 0.005, n.s., not significant.
PAC results
Our results thus far provide evidence that δ and β oscillations may reflect the cognitive processes related to increased abstraction, whereas theta may reflect the cognitive processes related to increased set-size. To further probe the interactions between these oscillations in different frequency bands, we conducted a PAC analysis. We investigated the coupling strength of the phase of the slower-frequency bands, δ and theta, with the amplitude of the higher-frequency bands, β and γ. The comodulograms for each condition were calculated for the phase of low frequencies (2–7 Hz) to the amplitude of high frequencies (10–49 Hz) (Fig. 7). Since both δ and β amplitude were modulated as a function of the abstraction of the task condition, we focused our statistical analysis on the coupling between δ phase (2–3 Hz) coupled to β amplitude (18–22 Hz). Given that we found theta-γ PAC in our previous electrocorticography study with a similar task (Voytek et al., 2015), we also analyzed coupling of the phase of the theta frequency band (4–6 Hz) with the amplitude of the γ frequency band (40–49 Hz). We found a significant increase in δ–β PAC with increased abstraction (F(1,30) = 7.62, p = 0.00976, η2p = 0.203; Fig. 7A,B), but not set-size (F(1,30) = 2.63, p = 0.115, η2p = 0.0807), and there was no interaction (F(1,30) = 2.79, p = 0.105, η2p = 0.0852). For theta-γ PAC, we found a significant increase in PAC for the low-abstraction conditions relative to the high-abstraction conditions (F(1,30) = 4.56, p = 0.0409, η2p = 0.132; Fig. 7C,D), but no effect of theta-γ PAC for set-size (F(1,30) = 1.16, p = 0.290, η2p = 0.0372) and no interaction (F(1,30) = 0.591, p = 0.448 η2p = 0.0193). During the high-abstraction, high set-size condition, we found a significant increase in δ–β PAC (t(30) = 2.377, p = 0.012, d = 0.427), one-tailed; Fig. 7B), and β amplitude was strongest at the trough and rise of δ phase (Fig. 8A). During the low-abstraction, high set-size condition, we found a moderate increase in theta-γ PAC (t(30) = 1.665, p = 0.053, d = 0.299, one-tailed; Fig. 7D), and γ amplitude was strongest at the rise of theta phase (Fig. 8B). Therefore, δ–β coupling may be how low-frequency oscillations modulate high-frequency oscillations to execute abstract rules, whereas theta-γ coupling may be relevant for maintaining task rules with higher set-size.
Figure 7.

Comodulograms of PAC for each task condition. For the high-abstraction conditions, there was increased coupling between δ phase (2–3 Hz) and β amplitude (18–22 Hz) in the high-set (B), but not low set-size condition (A). For the low-abstraction conditions, there was increased coupling between theta phase (4–6 Hz) and γ amplitude (40–49 Hz) in the low and high set-size conditions (C,D).
Figure 8.

Distribution of β and γ amplitude across δ and theta phase. Rose plots of δ phase-coupled to β amplitude (A) for the high-abstraction, high set-size condition and theta phase-coupled to γ amplitude (B) for the low-abstraction, high set-size condition. Amplitude values (z) were binned into 30 phase angles, averaged, and z-scored across phase bins. Error bars indicate within-participant SEM. Legends in boxes represent the peak and trough values in radians.
Discussion
In this experiment, we investigated the oscillatory neural dynamics associated with two dissociable components of hierarchical cognitive control: rule abstraction and set-size. Previous studies found that various frequency bands from low-frequency δ to high-frequency γ are associated with cognitive control (Helfrich and Knight, 2016), but the specific contribution of each of these bands to different control processes remains underspecified. We found that the abstraction and set-size of task rules are each associated with distinct oscillatory mechanisms. Specifically, when the abstractness of the rule increased, δ amplitude increased and β amplitude decreased; whereas when the number of rules (set-size) increased, theta amplitude increased and β amplitude decreased. These task-dependent changes in oscillatory amplitude correlated with behavioral performance. When the abstraction of the rule increased, slower RTs correlated with increased δ amplitude and decreased β amplitude. When the set-size increased, slower RTs correlated with increased theta amplitude. Before the motor response, increased abstraction decreased β amplitude, and increased set-size increased theta amplitude. Finally, coupling between the phase of δ oscillations and the amplitude of β oscillations strengthened as a function of task abstraction.
Cognitive control is organized hierarchically such that superordinate abstract representations influence subordinate, concrete action representations. In our previous study using electrocorticography with a similar version of the task (Voytek et al., 2015), we found that tasks that engaged more abstract task rules increased theta synchrony between the PFC and premotor cortex. Furthermore, we found theta phase in the PFC coupled with γ amplitude in premotor regions, suggesting that the PFC communicates with the motor cortex for hierarchical control via theta-γ PAC (Voytek et al., 2015). However, one important limitation of this previous study is that tasks that required more abstract rules also had increased set-size; therefore, we could not discern whether changes in oscillatory activities were driven by differences in abstraction or set-size. An important feature of our current experiment was to separately manipulate the abstraction of the rule and the number of competing rules (set-size). We further matched the performance (accuracy) between high and low abstraction. Therefore, we were able to dissociate these two components of hierarchical cognitive control.
Our findings suggest a relationship between theta oscillations and set-size, and this finding is consistent with previous studies that reported theta oscillations scale with working memory load (Jensen and Tesche, 2002; Meltzer et al., 2007; So et al., 2017; Berger et al., 2019). Other studies have also found that theta oscillations (presumably from frontal cortex) increase during tasks that required cognitive control (Cohen, 2011; Hsieh et al., 2011; Kikumoto and Mayr, 2018). Theta-γ coupling has been suggested as a mechanism by which multiple representations are organized for working memory (Bahramisharif et al., 2018) and long-term memory (Heusser et al., 2016). Therefore, the increased theta-γ PAC for higher set-size in our task could reflect the maintenance or retrieval of an increased number of rules. It should be noted that, in our previous study using electrocorticography, we found increased theta phase to highγ amplitude coupling for the high-abstraction, high set-size condition (Voytek et al., 2015). While we were unable to measure theta to high γ coupling due to the limitations of EEG, we did find increased theta amplitude for this condition consistent with these findings. Furthermore, this previous study did not separately manipulate abstraction and set-size, which we investigated in the current study (see Materials and Methods).
We observed that β amplitude decreased after stimulus onset as a function of increased abstraction and increased set-size. For the response-locked analysis, β oscillations decreased only as a function of increased abstraction, but not increased set-size. Many studies have found that β oscillations decrease when the motor system executes an action (Little and Brown, 2012). While we also observed that β band amplitude decreased before the button press, higher-abstraction conditions showed a greater β amplitude decrease compared with lower-abstraction conditions. We also found decreased β amplitude as a function of abstraction in the stimulus-locked analysis. Together, these abstraction-dependent results indicate a role for β oscillations beyond motor preparation. We propose that β oscillations may reflect top-down inhibitory signals for guiding action that are most robustly disengaged when guided by hierarchical goal representations.
Our findings of increased δ and decreased β oscillations with increased abstraction are consistent with a previous study that examined performance of a delayed-match-to-sample task in which monkeys had to evaluate an object according to two different categorical judgements: left versus right or up versus down (Antzoulatos and Miller, 2016). This study reported that distinct neural populations carry information for each of these two categories: vertically selective populations and horizontally selective populations. For the cued category, β coherence increased between the neural populations that coded for the relevant category. This pattern of activity led the authors to conclude that β oscillations were encoding rule categories. Our task also required the maintenance of abstract rules and similarly found an abstraction-related modulation of β amplitude in PFC. Furthermore, when there was a shift in the boundary between what was defined as “up” and “down,” there was an increase in δ synchrony between PFC and parietal cortex. This suggests that updates to abstract categorical rules modulate δ oscillations. In our experiment, for the high-abstraction, high set-size condition, participants had to evaluate the similarity of two different objects based on different stimuli attributes (e.g., judge the similarity in texture or shape), and the relevant attribute that participants should focus on was instructed by a supraordinate task rule cued by the color of the square surrounding the stimuli. Based on the findings from Antzoulatos and Miller (2016), the increase in δ oscillations in our study may reflect an update to the relevant supraordinate rule, and the change in β oscillations may reflect rule selection.
Participants with the greatest increase in RT when responding to the increased abstraction conditions showed the greatest increase in δ amplitude and decrease in β amplitude. Similarly, participants with the greatest increase in RT when responding to the increased set-size conditions showed the greatest increase in theta amplitude. These findings emphasize the behavioral relevance of these low-frequency neuronal oscillations and provide further support for a role of δ oscillations in processing task abstraction and theta oscillations in processing increased set-size.
The interplay between slow and fast neuronal oscillations has been investigated as a mechanism for cognitive control (Sauseng et al., 2009, 2010; Roux et al., 2012; Voytek et al., 2015) as long-range, low-frequency cognitive control signals from PFC couple to more local high-frequency oscillations (Canolty and Knight, 2010; Sauseng et al., 2010). Our PAC analysis revealed that δ phase-coupled with β amplitude when task conditions became more abstract. Specifically, δ-β coupling increased in the high-abstraction, high set-size condition in which participants decide between two task rules (e.g., focus on texture or shape). We observed that β amplitude decreased around the peak of the δ phase (see Fig. 8A). This finding is similar to Helfrich et al. (2017) in which α-β amplitude was lowest at peak δ-phase in PFC during a perceptual judgment (Helfrich et al., 2017). Wyart et al. (2012) also reported that the distribution of β oscillations in motor cortex was updated every cycle of a prefrontal δ signal, and the amplitude of β was inversely related to the probability of action of the underlying motor cortex (Wyart et al., 2012). Consistent with Wyart et al. (2012), our PAC finding suggests that δ phase in frontal regions may guide action selection via modulating beta band amplitude when cognitive tasks are hierarchically organized such that participants have to rely on supraordinate, abstract rules to guide concrete actions.
Together, low-frequency oscillations in the theta and δ frequency band may reflect different components of hierarchical cognitive control that couple to different high-frequency oscillations. γ oscillations play a primary role in carrying feedforward sensory processing signals (Börgers and Kopell, 2008; Michalareas et al., 2016). Theta oscillations in PFC couple with γ oscillations to support the organization of perceptual information during memory encoding and retrieval (Osipova et al., 2006; Hsieh and Ranganath, 2014). When multiple items must be held in mind, theta-γ coupling is increased (Alekseichuk et al., 2016; Tamura et al., 2017; Bahramisharif et al., 2018). Our findings suggest that increasing the set-size of a task may recruit a similar neural mechanism. β oscillations play a role in sensory feedback (Bastos et al., 2015; Michalareas et al., 2016) and motor control (Zhang et al., 2008; Picazio et al., 2014). Therefore, δ to β coupling may be a mechanism by which low-frequency oscillations in PFC guide future action according to abstract goals. Theoretical models on the role of γ and β oscillations in bottom-up and top-down attention (Fries, 2015; Riddle et al., 2019) may be extended to include theta and δ oscillations that show task-related modulations in the frontal cortex.
Footnotes
This work was supported by National Institutes of Health Grants R01 MH111737 and R01 MH063901 toM.D. and National Science Foundation Grant DGE 1106400 to J.R.
The authors declare no competing financial interests.
References
- Antzoulatos EG, Miller EK (2014) Increases in functional connectivity between prefrontal cortex and striatum during category learning. Neuron 83:216–225. 10.1016/j.neuron.2014.05.005 [DOI] [PMC free article] [PubMed] [Google Scholar]
- Antzoulatos EG, Miller EK (2016) Synchronous beta rhythms of frontoparietal networks support only behaviorally relevant representations. Elife 5:e17822 10.7554/eLife.17822 [DOI] [PMC free article] [PubMed] [Google Scholar]
- Alekseichuk I, Turi Z, de Lara GA, Antal A, Paulus W (2016) Spatial working memory in humans depends on theta and high gamma synchronization in the prefrontal cortex. Curr Biol 26:1513–1521. 10.1016/j.cub.2016.04.035 [DOI] [PubMed] [Google Scholar]
- Arnal LH, Doelling KB, Poeppel D (2015) Delta–beta coupled oscillations underlie temporal prediction accuracy. Cereb Cortex 25:3077–3085. 10.1093/cercor/bhu103 [DOI] [PMC free article] [PubMed] [Google Scholar]
- Badre D, D'Esposito M (2007) Functional magnetic resonance imaging evidence for a hierarchical organization of the prefrontal cortex. J Cogn Neurosci 19:2082–2099. 10.1162/jocn.2007.19.12.2082 [DOI] [PubMed] [Google Scholar]
- Badre D, D'Esposito M (2009) Is the rostro-caudal axis of the frontal lobe hierarchical? Nat Rev Neurosci 10:659–669. 10.1038/nrn2667 [DOI] [PMC free article] [PubMed] [Google Scholar]
- Badre D, Nee DE (2018) Frontal cortex and the hierarchical control of behavior. Trends Cogn Sci 22:170–188. 10.1016/j.tics.2017.11.005 [DOI] [PMC free article] [PubMed] [Google Scholar]
- Bahramisharif A, Jensen O, Jacobs J, Lisman J (2018) Serial representation of items during working memory maintenance at letter-selective cortical sites. PLoS Biol 16:e2003805 10.1371/journal.pbio.2003805 [DOI] [PMC free article] [PubMed] [Google Scholar]
- Bastos AM, Vezoli J, Bosman CA, Schoffelen JM, Oostenveld R, Dowdall JR, De Weerd P, Kennedy H, Fries P (2015) Visual areas exert feedforward and feedback influences through distinct frequency channels. Neuron 85:390–401. 10.1016/j.neuron.2014.12.018 [DOI] [PubMed] [Google Scholar]
- Berger B, Griesmayr B, Minarik T, Biel A, Pinal D, Sterr A, Sauseng P (2019) Dynamic regulation of interregional cortical communication by slow brain oscillations during working memory. Nat Commun 10:4242 10.1038/s41467-019-12057-0 [DOI] [PMC free article] [PubMed] [Google Scholar]
- Blair RC, Karniski W (1993) An alternative method for significance testing of waveform difference potentials. Psychophysiology 30:518–524. 10.1111/j.1469-8986.1993.tb02075.x [DOI] [PubMed] [Google Scholar]
- Börgers C, Kopell NJ (2008) Gamma oscillations and stimulus selection. Neural Comput 20:383–414. 10.1162/neco.2007.07-06-289 [DOI] [PubMed] [Google Scholar]
- Braver TS. (2012) The variable nature of cognitive control: a dual mechanisms framework. Trends Cogn Sci 16:106–113. 10.1016/j.tics.2011.12.010 [DOI] [PMC free article] [PubMed] [Google Scholar]
- Buschman TJ, Denovellis EL, Diogo C, Bullock D, Miller EK (2012) Synchronous oscillatory neural ensembles for rules in the prefrontal cortex. Neuron 76:838–846. 10.1016/j.neuron.2012.09.029 [DOI] [PMC free article] [PubMed] [Google Scholar]
- Canolty RT, Knight RT (2010) The functional role of cross-frequency coupling. Trends Cogn Sci 14:506–515. 10.1016/j.tics.2010.09.001 [DOI] [PMC free article] [PubMed] [Google Scholar]
- Cavanagh JF, Frank MJ (2014) Frontal theta as a mechanism for cognitive control. Trends Cogn Sci 18:414–421. 10.1016/j.tics.2014.04.012 [DOI] [PMC free article] [PubMed] [Google Scholar]
- Clarke A, Roberts BM, Ranganath C (2018) Neural oscillations during conditional associative learning. Neuroimage 174:485–493. 10.1016/j.neuroimage.2018.03.053 [DOI] [PubMed] [Google Scholar]
- Cohen MX. (2011) Hippocampal-prefrontal connectivity predicts midfrontal oscillations and long-term memory performance. Curr Biol 21:1900–1905. 10.1016/j.cub.2011.09.036 [DOI] [PubMed] [Google Scholar]
- Cohen MX. (2014) Analyzing neural time series data: theory and practice. Cambridge, MA: Massachusetts Institute of Technology. [Google Scholar]
- Cohen MX. (2019) A better way to define and describe Morlet wavelets for time-frequency analysis. Neuroimage 199:81–86. 10.1016/j.neuroimage.2019.05.048 [DOI] [PubMed] [Google Scholar]
- Delorme A, Makeig S (2004) EEGLAB: an open source toolbox for analysis of single-trial EEG dynamics including independent component analysis. J Neurosci Methods 134:9–21. 10.1016/j.jneumeth.2003.10.009 [DOI] [PubMed] [Google Scholar]
- Fell J, Axmacher N (2011) The role of phase synchronization in memory processes. Nat Rev Neurosci 12:105–118. 10.1038/nrn2979 [DOI] [PubMed] [Google Scholar]
- Fries P. (2015) Rhythms for cognition: communication through coherence. Neuron 88:220–235. 10.1016/j.neuron.2015.09.034 [DOI] [PMC free article] [PubMed] [Google Scholar]
- Gruber MJ, Watrous AJ, Ekstrom AD, Ranganath C, Otten LJ (2013) Expected reward modulates encoding-related theta activity before an event. Neuroimage 64:68–74. 10.1016/j.neuroimage.2012.07.064 [DOI] [PMC free article] [PubMed] [Google Scholar]
- Helfrich RF, Knight RT (2016) Oscillatory dynamics of prefrontal cognitive control. Trends Cogn Sci 20:916–930. 10.1016/j.tics.2016.09.007 [DOI] [PMC free article] [PubMed] [Google Scholar]
- Helfrich RF, Huang M, Wilson G, Knight RT (2017) Prefrontal cortex modulates posterior alpha oscillations during top-down guided visual perception. Proc Natl Acad Sci USA 114:9457–9462. 10.1073/pnas.1705965114 [DOI] [PMC free article] [PubMed] [Google Scholar]
- Helfrich RF, Breska A, Knight RT (2019) Neural entrainment and network resonance in support of top-down guided attention. Curr Opin Psychol 29:82–89. 10.1016/j.copsyc.2018.12.016 [DOI] [PMC free article] [PubMed] [Google Scholar]
- Heusser AC, Poeppel D, Ezzyat Y, Davachi L (2016) Episodic sequence memory is supported by a theta–gamma phase code. Nat Neurosci 19:1374–1380. 10.1038/nn.4374 [DOI] [PMC free article] [PubMed] [Google Scholar]
- Hsieh LT, Ranganath C (2014) Frontal midline theta oscillations during working memory maintenance and episodic encoding and retrieval. Neuroimage 85:721–729. 10.1016/j.neuroimage.2013.08.003 [DOI] [PMC free article] [PubMed] [Google Scholar]
- Hsieh LT, Ekstrom AD, Ranganath C (2011) Neural oscillations associated with item and temporal order maintenance in working memory. J Neurosci 31:10803–10810. 10.1523/JNEUROSCI.0828-11.2011 [DOI] [PMC free article] [PubMed] [Google Scholar]
- Jensen O, Tesche CD (2002) Frontal theta activity in humans increases with memory load in a working memory task. Eur J Neurosci 15:1395–1399. 10.1046/j.1460-9568.2002.01975.x [DOI] [PubMed] [Google Scholar]
- Kikumoto A, Mayr U (2018) Decoding hierarchical control of sequential behavior in oscillatory EEG activity. eLife 7:e38550 10.7554/eLife.38550 [DOI] [PMC free article] [PubMed] [Google Scholar]
- Lisman JE, Jensen O (2013) The theta-gamma neural code. Neuron 77:1002–1016. 10.1016/j.neuron.2013.03.007 [DOI] [PMC free article] [PubMed] [Google Scholar]
- Little S, Brown P (2012) What brain signals are suitable for feedback control of deep brain stimulation in Parkinson's disease? Ann NY Acad Sci 1265:9–24. 10.1111/j.1749-6632.2012.06650.x [DOI] [PMC free article] [PubMed] [Google Scholar]
- Maris E, Oostenveld R (2007) Nonparametric statistical testing of EEG- and MEG-data. J Neurosci Methods 164:177–190. 10.1016/j.jneumeth.2007.03.024 [DOI] [PubMed] [Google Scholar]
- Meltzer JA, Negishi M, Mayes LC, Constable RT (2007) Individual differences in EEG theta and alpha dynamics during working memory correlate with fMRI responses across subjects. Clin Neurophysiol 118:2419–2436. 10.1016/j.clinph.2007.07.023 [DOI] [PMC free article] [PubMed] [Google Scholar]
- Michalareas G, Vezoli J, Van Pelt S, Schoffelen JM, Kennedy H, Fries P (2016) Alpha-beta and gamma rhythms subserve feedback and feedforward influences among human visual cortical areas. Neuron 89:384–397. 10.1016/j.neuron.2015.12.018 [DOI] [PMC free article] [PubMed] [Google Scholar]
- Miller BT, D'Esposito M (2005) Searching for “the top” in top-down control. Neuron 48:535–538. 10.1016/j.neuron.2005.11.002 [DOI] [PubMed] [Google Scholar]
- Miller EK, Cohen JD (2001) An integrative theory of prefrontal cortex function. Annu Rev Neurosci 24:167–202. 10.1146/annurev.neuro.24.1.167 [DOI] [PubMed] [Google Scholar]
- Morillas-Romero A, Tortella-Feliu M, Bornas X, Putman P (2015) Spontaneous EEG theta/beta ratio and delta–beta coupling in relation to attentional network functioning and self-reported attentional control. Cogn Affect Behav Neurosci 15:598–606. 10.3758/s13415-015-0351-x [DOI] [PubMed] [Google Scholar]
- Nácher V, Ledberg A, Deco G, Romo R (2013) Coherent delta-band oscillations between cortical areas correlate with decision making. Proc Natl Acad Sci USA 110:15085–15090. 10.1073/pnas.1314681110 [DOI] [PMC free article] [PubMed] [Google Scholar]
- Norman DA, Shallice T (1986) Attention to action. In: Consciousness and self-regulation, pp 1–18. New York: Springer. [Google Scholar]
- Osipova D, Takashima A, Oostenveld R, Fernández G, Maris E, Jensen O (2006) Theta and gamma oscillations predict encoding and retrieval of declarative memory. J Neurosci 26:7523–7531. 10.1523/JNEUROSCI.1948-06.2006 [DOI] [PMC free article] [PubMed] [Google Scholar]
- Picazio S, Veniero D, Ponzo V, Caltagirone C, Gross J, Thut G, Koch G (2014) Prefrontal control over motor cortex cycles at beta frequency during movement inhibition. Curr Biol 24:2940–2945. 10.1016/j.cub.2014.10.043 [DOI] [PMC free article] [PubMed] [Google Scholar]
- Riddle J, Hwang K, Cellier D, Dhanani S, D'Esposito M (2019) Causal evidence for the role of neuronal oscillations in top–down and bottom–up attention. J Cogn Neurosci 31:768–779. 10.1162/jocn_a_01376 [DOI] [PMC free article] [PubMed] [Google Scholar]
- Roux F, Uhlhaas PJ (2014) Working memory and neural oscillations: alpha–gamma versus theta–gamma codes for distinct WM information? Trends Cogn Sci 18:16–25. 10.1016/j.tics.2013.10.010 [DOI] [PubMed] [Google Scholar]
- Roux F, Wibral M, Mohr HM, Singer W, Uhlhaas PJ (2012) Gamma-band activity in human prefrontal cortex codes for the number of relevant items maintained in working memory. J Neurosci 32:12411–12420. 10.1523/JNEUROSCI.0421-12.2012 [DOI] [PMC free article] [PubMed] [Google Scholar]
- Sadaghiani S, Kleinschmidt A (2016) Brain networks and α-oscillations: structural and functional foundations of cognitive control. Trends Cogn Sci 20:805–817. 10.1016/j.tics.2016.09.004 [DOI] [PubMed] [Google Scholar]
- Sasaki K, Tsujimoto T, Nishikawa S, Nishitani N, Ishihara T (1996) Frontal mental theta wave recorded simultaneously with magnetoencephalography and electroencephalography. Neurosci Res 26:79–81. 10.1016/0168-0102(96)01082-6 [DOI] [PubMed] [Google Scholar]
- Sauseng P, Klimesch W, Heise KF, Gruber WR, Holz E, Karim AA, Glennon M, Gerloff C, Birbaumer N, Hummel FC (2009) Brain oscillatory substrates of visual short-term memory capacity. Curr Biol 19:1846–1852. 10.1016/j.cub.2009.08.062 [DOI] [PubMed] [Google Scholar]
- Sauseng P, Griesmayr B, Freunberger R, Klimesch W (2010) Control mechanisms in working memory: a possible function of EEG theta oscillations. Neurosci Biobehav Rev 34:1015–1022. 10.1016/j.neubiorev.2009.12.006 [DOI] [PubMed] [Google Scholar]
- So WK, Wong SW, Mak JN, Chan RH (2017) An evaluation of mental workload with frontal EEG. PLoS One 12:e0174949. 10.1371/journal.pone.0174949 [DOI] [PMC free article] [PubMed] [Google Scholar]
- Stropahl M, Bauer AK, Debener S, Bleichner MG (2018) Source-modelling auditory processes of EEG data using EEGLAB and Brainstorm. Front Neurosci 12:309. 10.3389/fnins.2018.00309 [DOI] [PMC free article] [PubMed] [Google Scholar]
- Tamura M, Spellman TJ, Rosen AM, Gogos JA, Gordon JA (2017) Hippocampal-prefrontal theta-gamma coupling during performance of a spatial working memory task. Nat Commun 8:1–9. 10.1038/s41467-017-02108-9 [DOI] [PMC free article] [PubMed] [Google Scholar]
- Todd MT, Nystrom LE, Cohen JD (2013) Confounds in multivariate pattern analysis: theory and rule representation case study. Neuroimage 77:157–165. 10.1016/j.neuroimage.2013.03.039 [DOI] [PubMed] [Google Scholar]
- Vogelsang DA, D'Esposito M (2018) Is there evidence for a rostral-caudal gradient in fronto-striatal loops and what role does dopamine play? Front Neurosci 12:242. 10.3389/fnins.2018.00242 [DOI] [PMC free article] [PubMed] [Google Scholar]
- Vogelsang DA, Gruber M, Bergström ZM, Ranganath C, Simons JS (2018) Alpha oscillations during incidental encoding predict subsequent memory for new “foil” information. J Cogn Neurosci 30:667–679. 10.1162/jocn_a_01234 [DOI] [PMC free article] [PubMed] [Google Scholar]
- Voytek B, Kayser AS, Badre D, Fegen D, Chang EF, Crone NE, Parvizi J, Knight RT, D'Esposito M (2015) Oscillatory dynamics coordinating human frontal networks in support of goal maintenance. Nat Neurosci 18:1318–1324. 10.1038/nn.4071 [DOI] [PMC free article] [PubMed] [Google Scholar]
- Wutz A, Loonis R, Roy JE, Donoghue JA, Miller EK (2018) Different levels of category abstraction by different dynamics in different prefrontal areas. Neuron 97:716–726.e718. 10.1016/j.neuron.2018.01.009 [DOI] [PMC free article] [PubMed] [Google Scholar]
- Wyart V, de Gardelle V, Scholl J, Summerfield C (2012) Rhythmic fluctuations in evidence accumulation during decision making in the human brain. Neuron 76:847–858. 10.1016/j.neuron.2012.09.015 [DOI] [PMC free article] [PubMed] [Google Scholar]
- Zhang YY, Chen Y, Bressler SL, Ding M (2008) Response preparation and inhibition: the role of the cortical sensorimotor beta rhythm. Neuroscience 156:238–246. 10.1016/j.neuroscience.2008.06.061 [DOI] [PMC free article] [PubMed] [Google Scholar]
Associated Data
This section collects any data citations, data availability statements, or supplementary materials included in this article.
Data Availability Statement
Custom code used for these analyses is available on request to the corresponding author. The authors assert that all requests for raw data within reason will be fulfilled by the corresponding author.