

Summary
Effector CD8+ T cells are important mediators of adaptive immunity, and receptor-ligand interactions that regulate their survival may have therapeutic potential. Here, we identified a subset of effector CD8+ T cells that expressed the inhibitory Fc receptor FcγRIIB following activation and multiple rounds of division. CD8+ T cell-intrinsic genetic deletion of Fcgr2b increased CD8+ effector T cell accumulation, resulting in accelerated graft rejection and decreased tumor volume in mouse models. IgG antibody was not required for FcγRIIB-mediated control of CD8+ T cell immunity, and instead, the immunosuppressive cytokine Fgl2 was a functional ligand for FcγRIIB on CD8+ T cells, in that Fgl2 induced caspase 3/7-mediated apoptosis in Fcgr2b+ but not Fcgr2b−/− CD8+ T cells. Moreover, Increased expression of FcγRIIB correlated with freedom from rejection following withdrawal from immunosuppression in a clinical trial of kidney transplant recipients. Together, these findings demonstrate a cell-intrinsic coinhibitory function of FcγRIIB in regulating CD8+ T cell immunity.
Introduction
Targeting costimulatory and coinhibitory molecules has become an effective therapeutic approach for the treatment of T cell-mediated diseases, including cancer, transplantation, and autoimmunity. Costimulatory receptors are necessary secondary signals for T cell activation, and the constellation of cosignaling molecules expressed on the cell surface serves to calibrate the cell’s threshold for activation. Cosignaling receptors also play crucial roles in T cell differentiation and function and impact the outcome of both primary and recall responses. In primary responses, CD8+ T cells expand and differentiate into short-lived effector cells (SLECs) or memory precursor effector cells (MPECs) (Kaech and Cui, 2012). Highly differentiated CD8+ T cells may obviate the requirement for traditional costimulatory pathways, circumventing the typical checkpoints that control CD8+ T cell responses. Because highly differentiated effector T cells are present in many disease processes, including autoimmunity, transplantation, and cancer, understanding the pathways that regulate their function remains an important unanswered question.
Fcγ receptors play a pivotal role in immunity, controlling innate and humoral immunity by actuating the effector functions of antibodies. FcγRIIB is a low-affinity Fcγ receptor well-known to be expressed on B cells, macrophages, DCs, and granulocytes, and is the sole inhibitory Fcγ receptor (Nimmerjahn and Ravetch, 2008). The cytoplasmic domain of FcγRIIB contains an immunoreceptor tyrosine-based inhibitory motif (ITIM) that recruits the inhibitory phosphatase SHIP (Ono et al., 1996), which functions to inhibit phosphorylation of signaling molecules important in activation, including Btk and PLCγ, that disrupt calcium flux through hydrolysis of PIP3 (Bolland et al., 1998). On innate immune cells, this function of FcγRIIB directly antagonizes activating Fcγ receptors; thus, the balance of activating and inhibitory signals dictates the outcome of the cellular response, similar to cosignaling molecules. On B cells, FcγRIIB is the sole Fcγ receptor (Ravetch et al., 1986); thus, instead of modulating the signaling of activating Fcγ receptors, FcγRIIB-mediated SHIP recruitment functions primarily to attenuate BCR signaling (Ono et al., 1996). In the absence of BCR signaling, however, FcγRIIB signaling promotes apoptosis in a SHIP-independent manner (Pearse et al., 1999). Although early literature suggested T cells might express Fc receptors (Yoshida and Andersson, 1972), (Anderson and Grey, 1974), (Stout and Herzenberg, 1975), the consensus in the field for the past few decades has been that T cells do not express FcγRIIB (Smith and Clatworthy, 2010). Because Fc-containing reagents are increasingly being used therapeutically in transplantation, autoimmunity, and cancer immunotherapy, understanding the role of FcγRs on all cell types is critical to optimize the efficacy of Fc-containing immunotherapeutics in these settings.
Here, we identified a distinct subset of CD44hi CD8+ T cells that expressed FcγRIIB in both mice and humans and in models of both transplantation and tumor immunity. We demonstrated in co-adoptive transfer studies that antigen-specific CD8+ T cells deficient in FcγRIIB exhibited impaired contraction and reduced induction of apoptosis compared to wild-type CD8+ T cells. The impaired attrition observed in FcγRIIB−/− CD8+ T cells was independent of IgG; instead, the immunosuppressive cytokine fibrinogen-like 2 (Fgl2) functioned to induce FcγRIIB-mediated apoptosis in CD8+ T cells. These data thus illuminate a cell-intrinsic role for FcγRIIB as an important modulator of CD8+ T cell responses in vivo.
Results
FcγRIIB is expressed on a subset of effector-memory CD8+ T cells
We assessed the efficacy of the Fc-containing cytotoxic T-lymphocyte antigen-4-Ig (CTLA-4Ig) immunotherapeutic reagent in mice that are genetically deficient in FcγRIIB (Fig. 1A). Fcgr2b−/− animals exhibited accelerated rejection of skin allografts as compared to WT animals treated with CTLA-4Ig (Fig. 1B). Because of the known critical role of FcγRIIB in inhibiting B cell activation and antibody production, we hypothesized that this accelerated rejection was due to an unencumbered humoral anti-graft response. However, analysis of donor-specific antibody revealed that in the context of CTLA-4Ig, there was no increase in donor-specific antibody in the Fcgr2b−/− recipients as compared to WT hosts (Fig. 1C). Thus, we hypothesized that the rejection-accelerating effect of Fcgr2b deficiency must be functioning on some other cell type. Analysis of the T cell response in these animals revealed an increase in the frequency and number of donor-reactive CD8+ T cells (Fig. 1D–E). While it is known that Fcgr2b deficiency can enhance antigen-presenting cell (APC) function leading to augmented CD8+ T cell activation (Li et al., 2014), flow cytometric analysis revealed expression of FcγRIIB on CD8+ T cells themselves. In detail, a stringent gating strategy was used to gate on CD4+ and CD8+ CD19− CD11c− CD3+ T cells (Fig. 1F), and a distinct population of FcγRIIB-expressing CD8+ cells in aged (>6 months), naïve mice was identified (Fig. 1G–H). Because the anti-CD16/CD32 clone 2.4G2 used for staining binds to both FcγRIIB and FcγRIII, we utilized Fcgr2b−/− animals to determine the specificity of staining on CD8+ T cells. In Fcgr2b−/− animals, 2.4G2 failed to stain CD8+ T cells, indicating that 2.4G2 binding was specific to FcγRIIB (Fig.1G). This specificity was further confirmed by staining with an FcγRIIB-specific clone (AT130, Fig. S1A). We further queried the expression of FcγRIIB on CD44loCD62L+ (naïve) cells, CD44hiCD62L+ (Tcm) cells, and CD44hiCD62Llo (Tem) cells and found that the Tem cell subset contained the highest frequencies of FcγRIIB+ cells and that the naïve subset contained the lowest frequencies of FcγRIIB+ cells (Fig. 1I–J). Moreover, the frequency of FcγRIIB-expressing CD44hi CD8+ T cells was highest in the liver, spleen, and bone marrow (Figure 1K–L). These data show that, in contrast to prevailing dogma, FcγRIIB is expressed on a subset of effector/effector memory CD8+ T cells present in both secondary lymphoid organs and in tissues throughout the organism.
Figure 1: FcγRIIB is expressed on a subset of effector-memory CD8+ T cells.
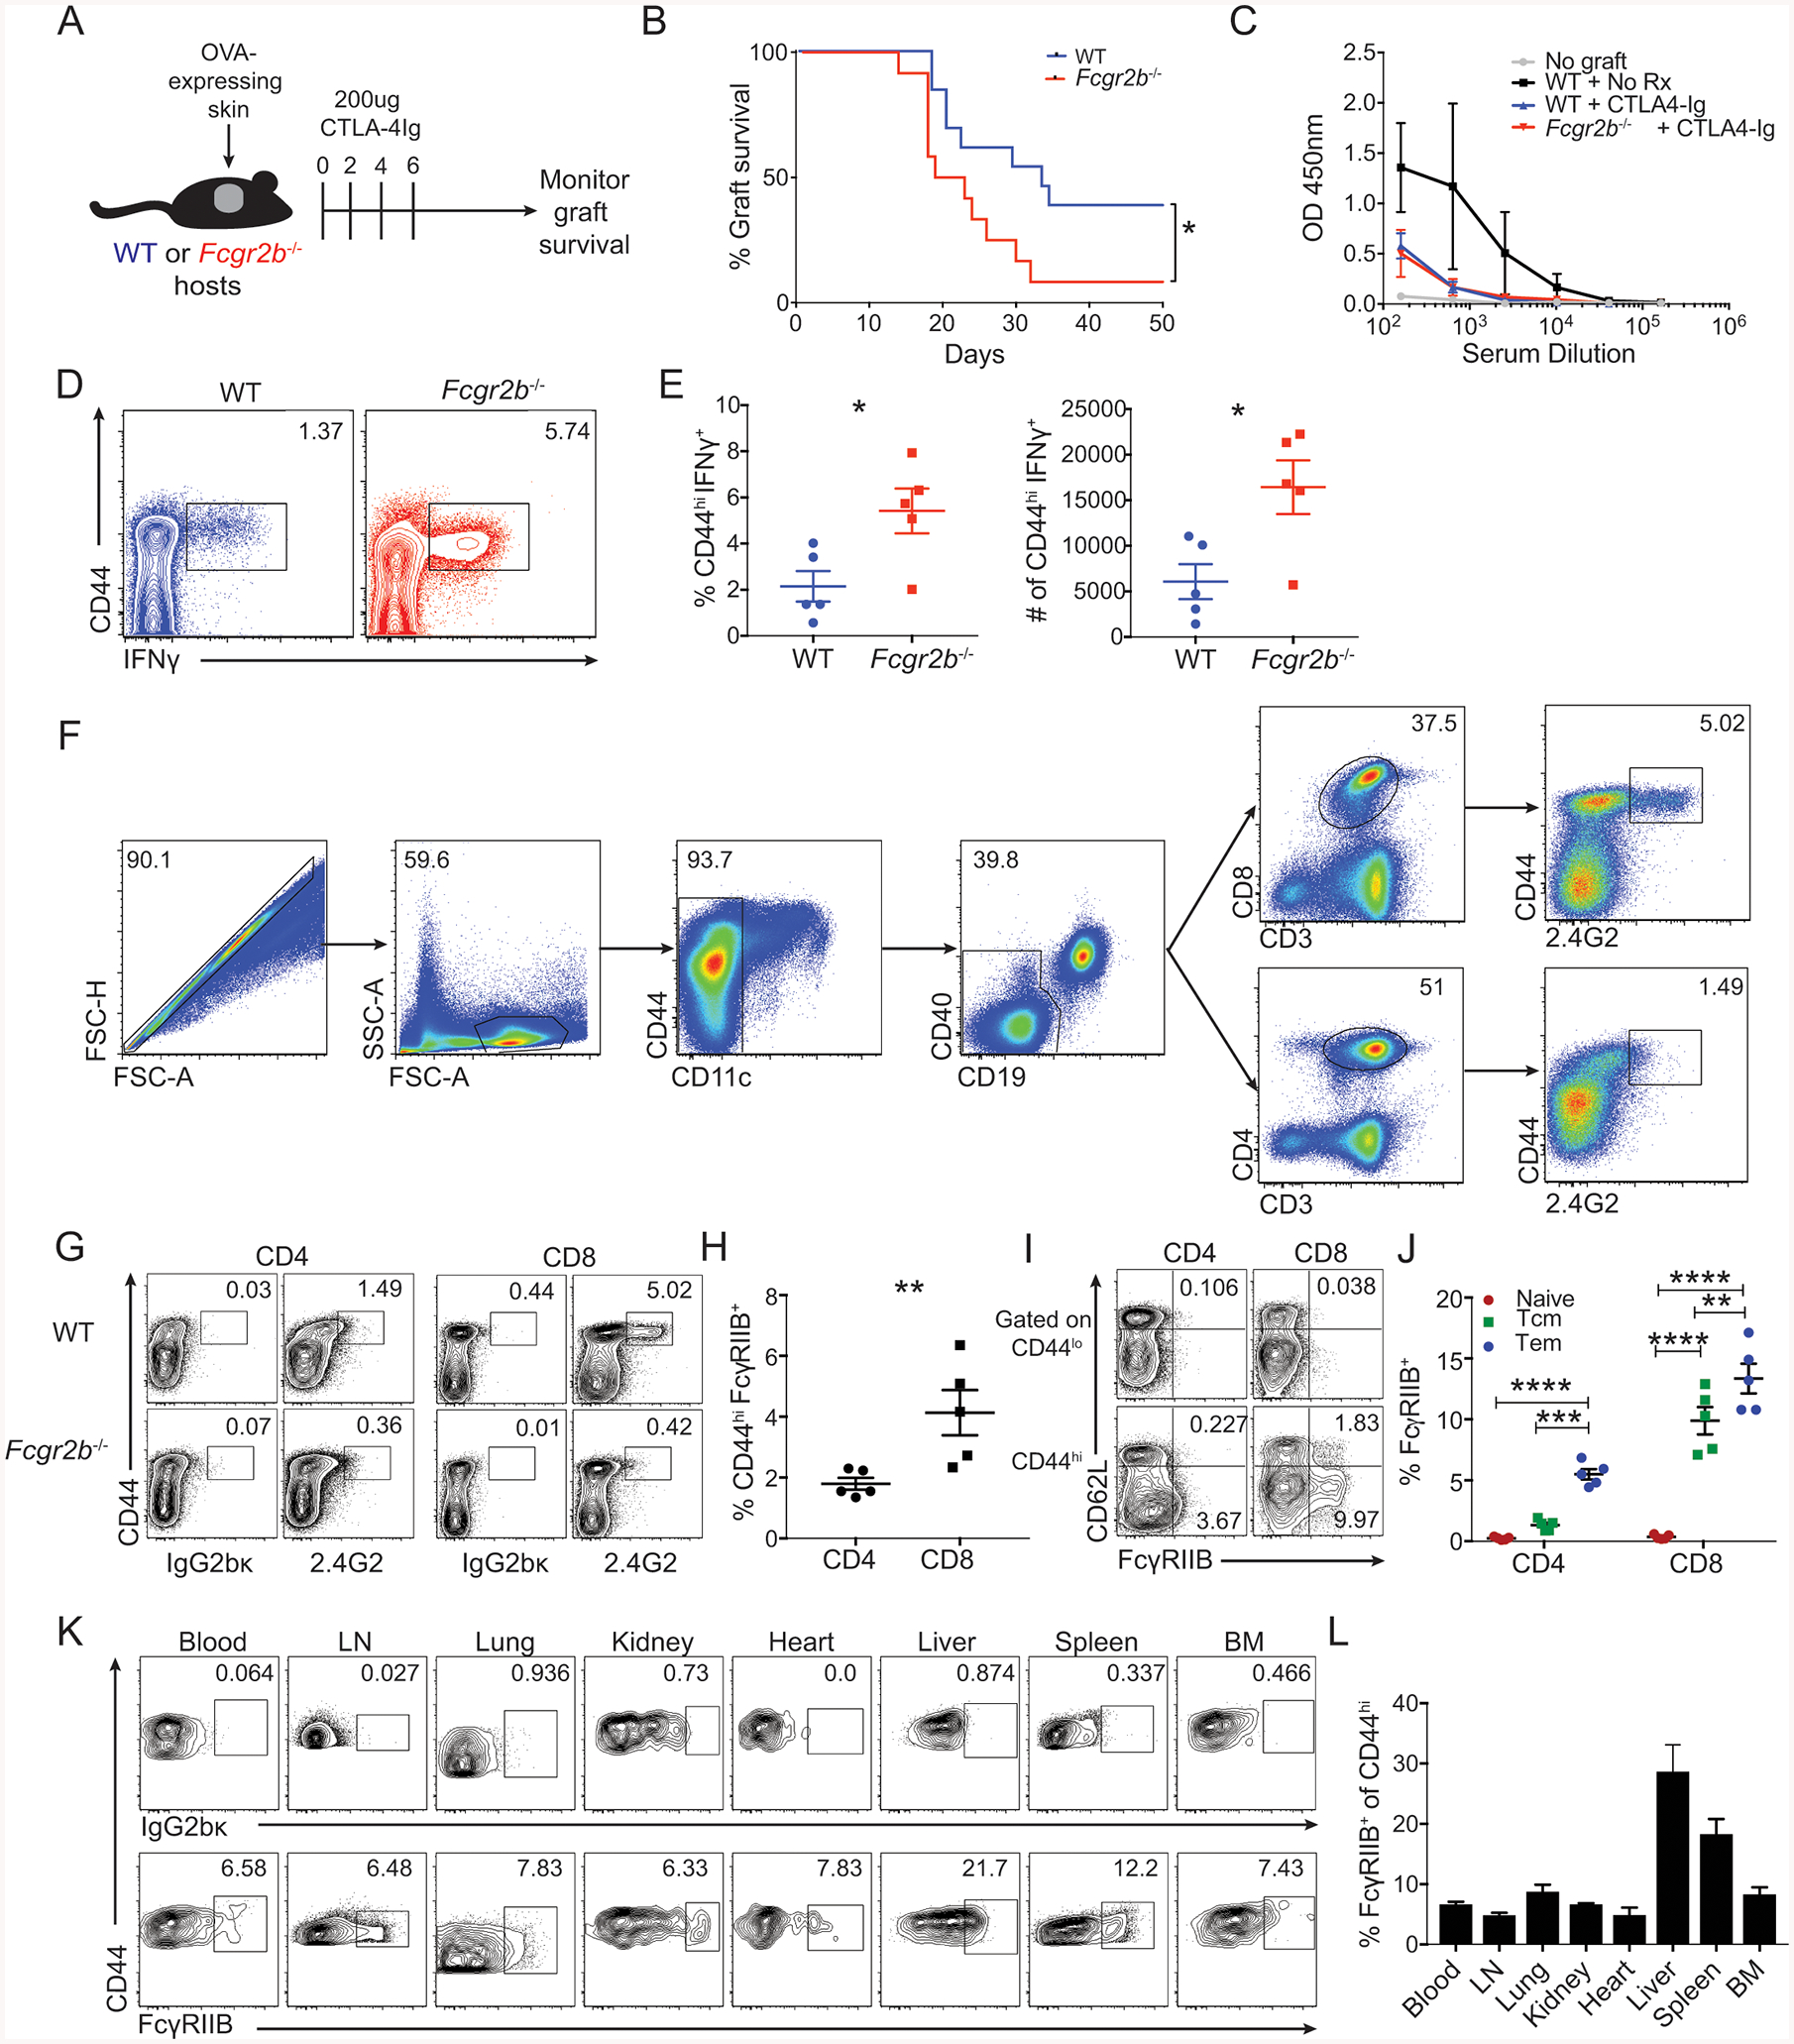
(A-E) A: Schematic of experimental design for panels B-E: WT or Fcgr2b−/− animals (Jackson- B6;129S-Fcgr2btm1Ttk/J (Takai et al., 1996)) were grafted with OVA-expressing skin and treated with 250ug CTLA-4Ig on days 0, 2, 4 and 6.
B. Summary of graft survival (Log-rank (Mantel-Cox) test, p= 0.0124)). Pooled data from two independent experiments, n=7–10 mice per group.
C. Readout at OD450nm of an anti-OVA total IgG ELISA from serum collected on day 13 post grafting. Representative data from two independent experiments, n=4–5 mice per group.
D. Mice were sacrificed at day 14 post grafting and splenocytes were analyzed by flow cytometry for the frequency of CD44hiIFNγ+ of CD8+ T cells in WT and Fcgr2b−/− animals (Jackson- B6;129S-Fcgr2btm1Ttk/J). Representative flow plots are shown.
E. Mice were sacrificed at day 14 post grafting and splenocytes were analyzed by flow cytometry for the frequency and number of CD44hiIFNγ+ CD8+ T cells in WT and Fcgr2b−/− shown in D. Representative data from two independent experiments, n=5 mice per group, ± SEM. Mann-Whitney test, *p<0.05).
(F-J) Splenocytes from mice aged 6 months or older were analyzed by flow cytometry for T cell expression of FcγRIIB through staining with the monoclonal antibody anti-CD16/CD32 (clone 2.4G2). Representative data from two independent experiments, n=5 mice per group.
F: Gating strategy for excluding CD11c+ and CD19+ cells and gating on CD3+CD8+ or CD3+CD4+ double-positive T cells in the spleen. Gates were drawn for 2.4G2 using an isotype control.
G: Representative flow cytometric plots of the expression of 2.4G2 (or isotype control IgG2bκ) for CD4+ and CD8+ populations in the spleen of WT and Fcgr2b−/− animals (Jackson- B6;129S-Fcgr2btm1Ttk/J).
H: The frequency of CD44hi FcγRIIB+ cells of the CD4+ and CD8+ T cell compartments in WT animals. Summary data ± SEM of G is shown. Mann-Whitney test, **p<0.01).
I: Representative flow cytometric plots of the expression of 2.4G2 (anti-FcγRIIB) for CD44lo and CD44hi CD4+ and CD8+ T cells in the spleen. Frequencies are included for CD44loCD62L+ (naïve cells), CD44hiCD62L+ (Tcm cells), and CD44hiCD62Llo (Tem cells).
J: The frequency of 2.4G2+ (anti-FcγRIIB) cells of CD44loCD62L+ (naïve cells), CD44hiCD62L+ (Tcm cells), and CD44hiCD62Llo (Tem cells) CD8+ T cells. Summary data ± SEM is shown. Two-way ANOVA with multiple comparisons, **p<0.01, ***p<0.001, ****p<0.0001).
(K-L) Naïve B6 hosts were grafted with OVA-expressing skin and sacrificed at day 10. The blood, lymph nodes, lung, kidney, heart, liver, spleen, and bone marrow were harvested and analyzed by flow cytometry. Pooled data from two independent experiments, n=3 mice per group.
K: Representative flow cytometric plots of CD44hi endogenous CD8+ T cells from the blood, lymph nodes, lung, kidney, heart, liver, spleen, and bone marrow on day 10. Gates for FcγRIIB were drawn according to binding of the cell-specific population to the isotype control antibody (top row).
L: The frequency of FcγRIIB+ cells of the CD44hi endogenous CD8+ T cell population in the blood, lymph nodes, lung, kidney, heart, liver, spleen, and bone marrow on day 10, as shown in K. Summary data ± SEM is shown.
See also Figure S1.
FcγRIIB functions intrinsically on CD8+ T cells to limit T cell responses
Given the finding that FcγRIIB was expressed on effector-like CD8+ T cells, we sought to determine whether T cell-expressed FcγRIIB has a functional role on these cells. CD45.2+ Fcgr2b−/− OVA-specific (OT-I) T cells were co-transferred at a 1:1 ratio with Thy1.1+ WT OT-I into congenically marked hosts (CD45.1+) (Fig. 2A–B). We then probed the expression of FcγRIIB on WT CD8+ Thy1.1+ OT-I following OVA-expressing skin transplantation and found that the frequency of FcγRIIB+ CD8+ T cells increased over time to constitute ~33% of OT-I T cells at day 21 post-transplant (Fig. 2C). Although WT and Fcgr2b−/− OT-I T cells were present at similar frequencies in the spleen on days 4, 7 and 10 post-transplant, by days 14 and 21, Fcgr2b−/− OT-I T cells were present at significantly higher frequencies relative to WT OT-I T cells (Fig. 2D–E). The absolute number of Fcgr2b−/− OT-I cells was also significantly higher as compared to the number of WT OT-I T cells on days 14 and 21 post-transplant (Fig. 2F). Given the enrichment of FcγRIIB on CD44hiCD62Llo T cells (Fig. 1J), we compared CD62L expression in the WT vs. Fcgr2b−/− OT-I populations. We identified a significant increase in the frequency and number of CD44hiCD62Llo cells on days 14 and 21 in the Fcgr2b−/− relative to the WT OT-I T cells (Fig. 2G–I). Similarly, during the contraction phase of the response on days 14 and 21, the frequency and number of Fcgr2b−/− CD44hiCD62L+ memory CD8+ T cells was lower than WT CD44hiCD62L+ memory CD8+ T cells (Fig. S2A–C). Moreover, Fcgr2b−/− OT-I T cells exhibited a significantly higher frequency and number of EomesloTbethi cells relative to WT OT-I (Fig. 2J–K). This difference was driven mainly by a decrease in Eomes expression in Fcgr2b−/− cells, as Tbet expression was not different between WT and Fcgr2b−/− OT-I T cells (Fig. 2L and data not shown). These data demonstrate that FcγRIIB has a functional, intrinsic, inhibitory role in limiting the accumulation of differentiated CD62Llo Eomeslo CD8+ effector T cells. Given these differences in the accumulation of donor-reactive CD8+ T cells, we sought to determine whether CD8+ T cell-specific Fcgr2b deficiency had a physiologic impact on allograft rejection. WT or Fcgr2b−/− OT-I T cells were adoptively transferred into naïve B6 recipients of OVA-expressing skin grafts, which were then treated with costimulation blockade immunosuppression. Importantly, mice containing Fcgr2b−/− donor-reactive CD8+ T cells exhibited accelerated graft rejection compared to animals containing WT donor-reactive CD8+ T cells (Fig. 2M). These data demonstrate that T cell-specific Fcgr2b deficiency has a functional, physiologic impact on allograft rejection.
Figure 2: FcγRIIB functions intrinsically on CD8+ T cells to limit T cell responses.
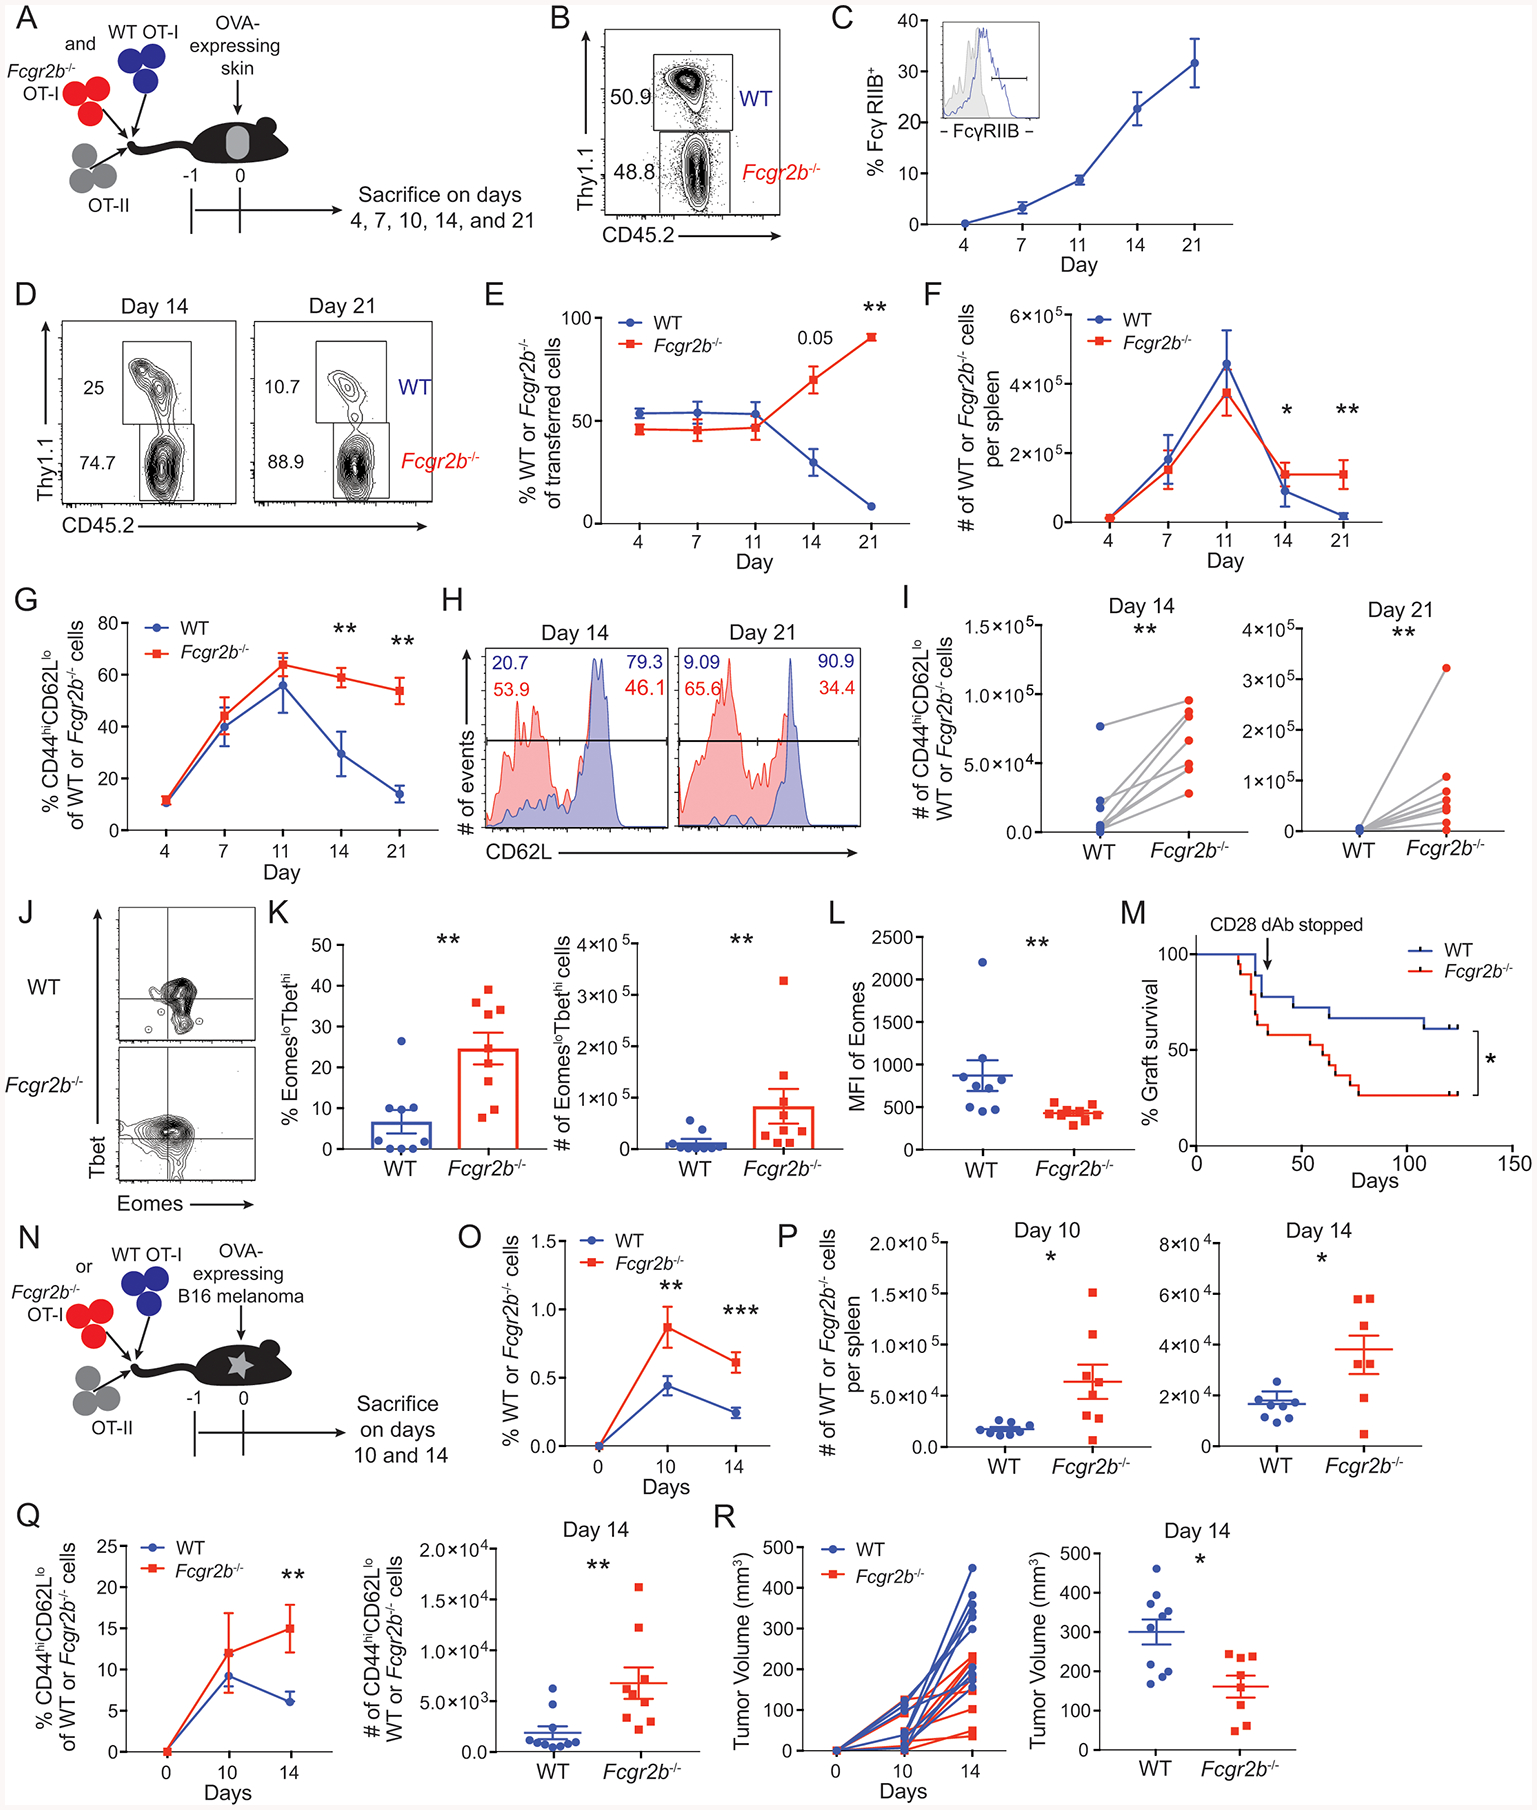
(A-L) A: Schematic of experimental design for panels B-L: 5×10⁵ WT Thy1.1+ OT-I T cells, 5×10⁵ Fcgr2b−/− CD45.2+ OT-I T cells, and 106 Thy1.1+ OT-II T cells were harvested from the spleen and mesenteric lymph node and adoptively transferred into congenically marked (CD45.1+, Thy1.2+) naïve mice 24 hours prior to skin transplantation with OVA-expressing skin. Mice were sacrificed at indicated timepoints and splenocytes were analyzed by flow cytometry.
B: Prior to transfer, flow cytometry was performed to determine the ratio of WT to Fcgr2b−/− OT-I T cells.
C: FcγRIIB expression on WT OT-I T splenocytes at the indicated timepoints. Inset histograms show gating strategy for FcγRIIB (tinted gray histogram shows isotype control (IgG2bκ)). Summary data ±SEM is shown. Pooled data from 2 independent experiments, n=5 mice per group.
D: Representative flow cytometric plots on day 14 and 21 in the spleen of the ratio of WT to Fcgr2b−/− OT-I T cells based on the expression of CD45.2 and Thy1.1.
E: The frequency of WT to Fcgr2b−/− OT-I T cells based on expression of CD45.2 and Thy1.1 in the spleen. Summary data ±SEM is shown. Pooled data from 2 independent experiments, n=5 mice per group. Wilcoxon test on individual time points, **p<0.01.
F: The absolute cell number per spleen of WT and Fcgr2b−/− OT-I T cells. Summary data ±SEM is shown. Representative data from 2 independent experiments, n=5 mice per group. Wilcoxon test on individual time points, *p<0.05, **p<0.01.
G: The frequency of CD44hiCD62Llo cells of WT or Fcgr2b−/− OT-I T cell populations in the spleen. Summary data ±SEM is shown. Pooled data from 2 independent experiments, n=5 mice per group. Wilcoxon test on individual time points, **p<0.01.
H: Flow cytometric plots on days 14 and 21 in the spleen for the expression of CD62L on WT (blue) or Fcgr2b−/− (red) OT-I T cells. Representative data from 2 independent experiments, n=5 mice per group.
I: The absolute number per spleen of CD44hiCD62Llo cells of WT or Fcgr2b−/− OT-I T cell populations on days 14 and 21. Summary data is shown. Pooled data from 2 independent experiments, n=5 mice per group. Wilcoxon test, p<0.01.
J: Representative flow cytometric plots on day 21 in the spleen of the expression of Tbet and Eomes on WT and Fcgr2b−/− OT-I T cell populations at day 21. Representative data from 2 independent experiments, n=5 mice per group.
K: The frequency and absolute cell number per spleen of EomesloTbethi cells of WT or Fcgr2b−/− OT-I T cell populations at day 21. Summary data ±SEM is shown. Pooled data from 2 independent experiments, n=5 mice per group. Wilcoxon test, p<0.01.
L: The geometric mean fluorescent intensity of Eomes on WT or Fcgr2b−/− OT-I T cell populations at day 21 in the spleen. Summary data ±SEM is shown. Pooled data from 2 independent experiments, n=5 mice per group. Wilcoxon test, p<0.01.
M: Graft survival data of animals that received either 106 WT or Fcgr2b−/− OT-I T cells, and 106 Thy1.1+ OT-II T cells 24 hours prior to OVA-expressing skin transplantation. Animals were treated with 50ug of CD28 domain antibody on days 0, 2, 4, 6 and every other day thereafter until day 30. Pooled data from 2 independent experiments, n=5 mice per group. Log-rank (Mantel-Cox) test, p= 0.0283.
(N-R) N: Schematic of experimental design for O-R: 106 WT Thy1.1+ OT-I T cells or 106 Fcgr2b−/− CD45.2+ OT-I T cells, and 106 Thy1.1+ OT-II T cells were harvested from the spleen and mesenteric lymph nodes and adoptively transferred into congenically marked naïve mice 24 hours prior to inoculation with a B16-melanoma-expressing OVA cell line. Mice were sacrificed at indicated timepoints post tumor inoculation and splenocytes were assessed by flow cytometry.
O: The frequency of WT or Fcgr2b−/− OT-I T cells of CD8+ T cells in the spleen. Summary data ± SEM is shown. Pooled data from 2–3 independent experiments, n=3–5 mice per group. Mann-Whitney test for individual timepoints, **p<0.01, ***p<0.001.
P: The absolute cell number per spleen of WT or Fcgr2b−/− OT-I T cells on days 10 and 14. Summary data ± SEM is shown. Pooled data from 2–3 independent experiments, n=3–5 mice per group. Mann-Whitney test, *p<0.05.
Q: The frequency and absolute cell number per spleen of CD44hiCD62Llo cells of WT or Fcgr2b−/− OT-I T cell populations. Summary data ± SEM is shown. Pooled data from 2–3 independent experiments, n=3–5 mice per group. Mann-Whitney test for individual timepoints, **p<0.01.
R: Mice were sacrificed and tumor volume (measured in mm3) for each individual mouse that received WT or Fcgr2b−/− OT-I T cells was measured. Scatter plot is shown for day 14. Summary data ± SEM is shown. Pooled data from 2–3 independent experiments, n=3–5 mice per group. Mann-Whitney test, *p<0.05.
See also Figure S2.
We then sought to assess the T cell intrinsic role of FcγRIIB in response to a tumor model in which naïve B6 recipients of WT or Fcgr2b−/− OT-I T cells were inoculated with an OVA-expressing B16 melanoma (Fig. 2N). Assessment of FcγRIIB expression on WT OT-I in this model system revealed that while ~12% of CD44hi tumor antigen (Ag)-specific CD8+ T cells isolated from the spleen expressed FcγRIIB, ~27% of CD44hi tumor Ag-specific CD8+ T cells isolated from the tumor expressed FcγRIIB by day 14 post tumor inoculation (Fig. S2D–E). The finding that tumor-infiltrating CD8+ T cells contained a high frequency of FcγRIIB+ cells is corroborated by analysis of graft-infiltrating cells isolated on day 14 following transplantation, which revealed that ~30% of graft-specific CD8+ T cells expressed FcγRIIB (Fig. S2H). As in the transplant model, tumor Ag-reactive FcγRIIB+ CD8+ T cells were more enriched in the Tem cell compartment as compared to naïve or Tcm cells, both in the spleen and tumor (Fig. S2F). Moreover, both the frequency and absolute number of Fcgr2b−/− OT-I T cells were significantly elevated relative to WT OT-I T cells at days 10 and 14 following B16-OVA inoculation (Fig. 2O–P). As observed in the transplant model, both the frequency and number of CD44hiCD62Llo cells were significantly increased in the Fcgr2b−/− CD8+ population relative to the WT CD8+ population on day 14 post-tumor inoculation (Fig. 2Q). Importantly, recipients of Fcgr2b−/− OT-I T cells exhibited a reduction in tumor volume on days 10 (Fig. S2G) and 14 (Fig. 2R) as compared to recipients of WT OT- I T cells. Taken together, these data illuminate a functional, cell-intrinsic coinhibitory role for FcγRIIB in controlling CD8+ T cell responses in models of both transplantation and tumor immunity
FcγRIIB-expressing antigen-specific CD8+ T cells are highly divided and potent cytokine producers
Given the finding that FcγRIIB functions intrinsically on CD8+ T cells, we next sought to identify key differences in expression of cell surface proteins in FcγRIIB+ and FcγRIIB− OT-I T cell populations at day 14 following skin transplantation using viSNE (Fig. 3A). FcγRIIB-expressing OT-I T cells exhibited a higher mean fluorescent intensity (MFI) of the activation marker CD44, the coinhibitory molecule 2B4, and the costimulatory molecule CD40 and exhibited a lower MFI of CD69 relative to FcγRIIB− OT-I T cells (Fig. 3B). Furthermore, Cell Trace Violet (CTV)-labeling experiments revealed that antigen-specific CD8+ T cells that had undergone 5 or 6 divisions contained a significantly higher frequency of FcγRIIB-expressing cells compared to CD8+ T cell populations in earlier rounds of division (Fig. 3C–D). Of note, the FcγRIIB+ antigen-specific CD8+ T cell population in the spleen contained a significantly higher frequency of IL-2-, TNF-, and IFN-γ-secreting cells relative to their FcγRIIB− counterparts (Fig. 3E). Taken together, these data suggest that FcγRIIB+ CD8+ cells are not functionally exhausted but instead are activated, highly divided, and potent cytokine-producing effector cells.
Figure 3: FcγRIIB inhibits highly divided and potent cytokine-producing CD8+ T cell responses by inducing active caspase 3/7 in a cell intrinsic manner.
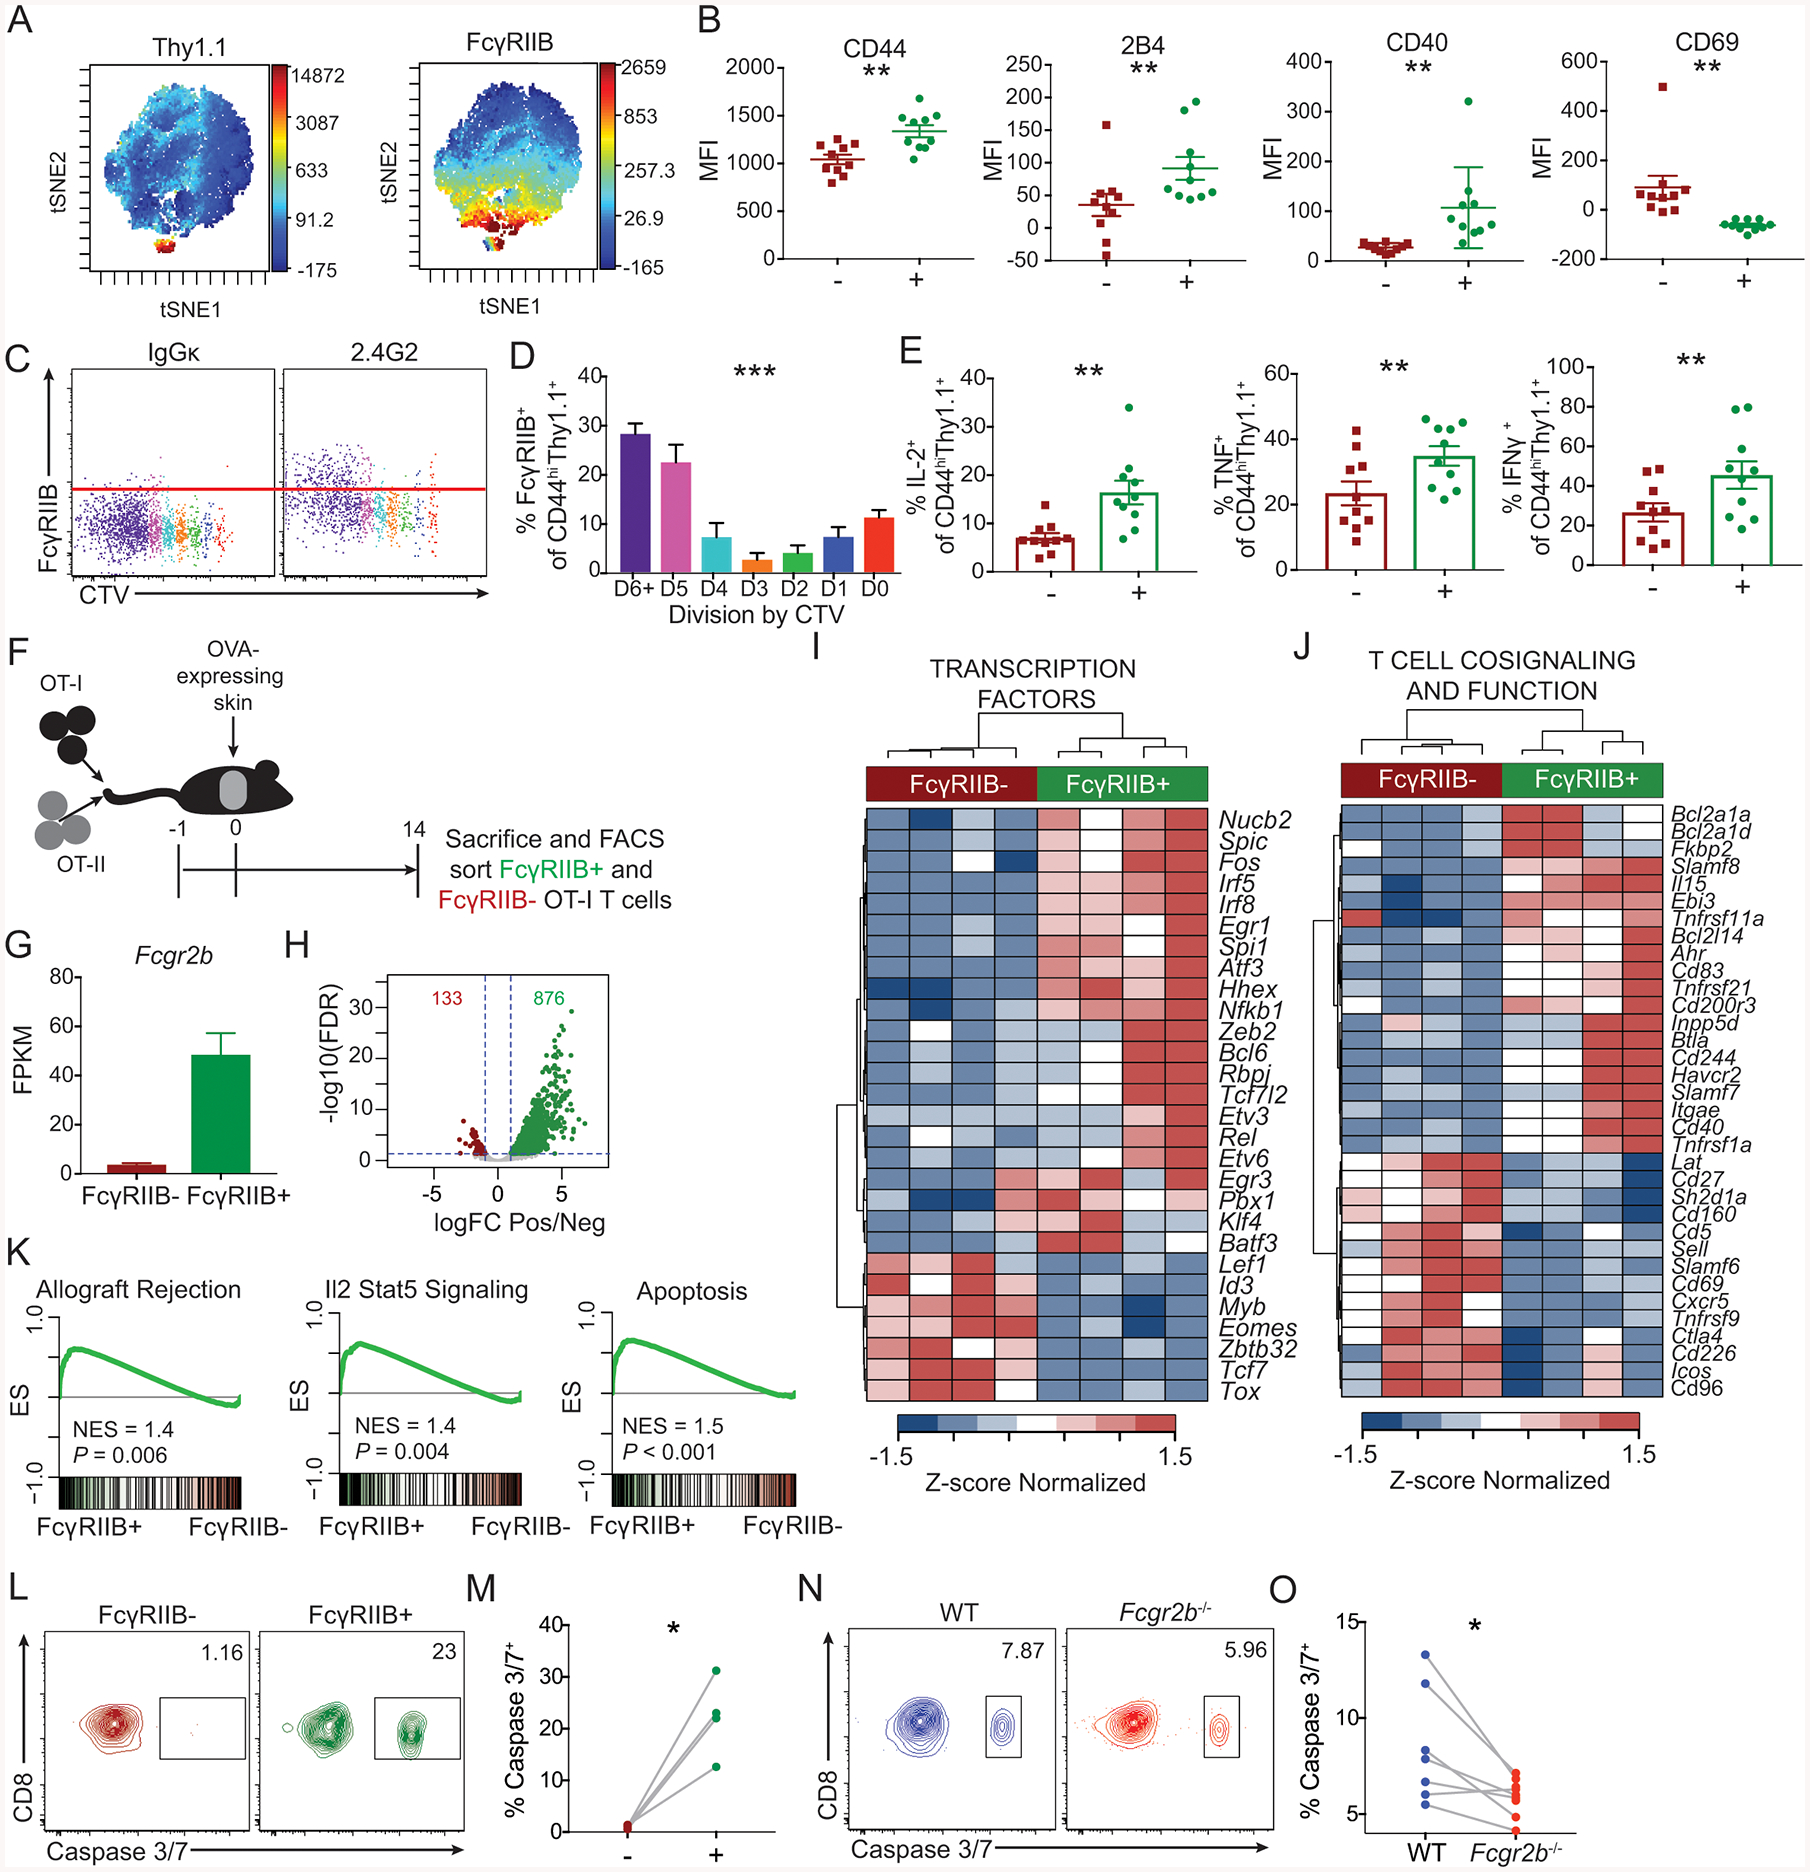
(A-E)106 OT-I and OT-II were harvested from the spleen and mesenteric lymph node and adoptively transferred into naïve hosts 24 hours prior to skin transplantation with OVA-expressing skin. Mice were sacrificed at day 14 post grafting and splenocytes were assessed by flow cytometry.
A: Representative viSNE plots of CD8+ T cells, with high fluorescent intensity displayed as red and low fluorescent intensity displayed as blue for the markers Thy1.1 and FcγRIIB. Representative data from two independent experiments, n=10 mice per group.
B. MFIs were extracted for CD44, 2B4, CD40, and CD69, of the Thy1.1+ FcγRIIB+ and Thy1.1+ FcγRIIB− viSNE populations. Summary data ±SEM is shown. Representative data from two independent experiments, n=10 mice per group. Wilcoxon test, **p<0.01.
C: Representative flow cytometric plots of CTV by FcγRIIB of OT-I T cells.
D: The frequency of FcγRIIB+ CD44hiThy1.1+ OT-I T cells by division of CTV. Summary data ±SEM is shown. Representative data from 2 independent experiments, n=4–5 mice per group. One-way ANOVA was performed.
E: The frequencies of IL-2, TNF, and IFN-γ-producing FcγRIIB+ and FcγRIIB− CD44hiThy1.1+ OT-I cells following ex vivo stimulation with SIINFEKL peptide. Summary data ±SEM is shown. Pooled data from 2–3 independent experiments, n=5 mice per group. Wilcoxon test, **p<0.01.
(F-K) F: Schematic of experimental design for panels G-K:106 Thy1.1+ OT-I and OT-II were harvested from spleen and mesenteric lymph node and adoptively transferred into naïve hosts 24 hours prior to skin transplantation with OVA-expressing skin. On day 14 post grafting, splenocytes were ficolled for lymphocyte isolation, and FcγRIIB+ and FcγRIIB− CD44hiThy1.1+ CD8+ T cells were FACS sorted and RNAseq was performed.
G: Fragments per kilobase per million (FPKM) of Fcgr2b in the FcγRIIB+ and FcγRIIB− sorted OT-I T cells.
H: Volcano plot of the differentially expressed genes (DEGs). FDR: False discovery rate, logFC: log2 fold change.
I: Heatmap of DEGs that function as transcription factors.
J: Heatmap of DEGs that contribute to T cell cosignaling and function.
K: GSEA for the indicated HALLMARK gene sets comparing a ranked list of all detected genes between FcγRIIB+ and FcγRIIB− CD8+ T cells.
(L-M)106 OT-I and OT-II were harvested from the spleen and mesenteric lymph node and adoptively transferred into naïve hosts 24 hours prior to skin transplantation with OVA-expressing skin. Mice were sacrificed at day 16 post grafting and splenocytes were assessed by flow cytometry.
L: Representative flow cytometric plots of the expression of active caspase 3/7 of Thy1.1+ CD44hi FcγRIIB+ vs. FcγRIIB− OT-I T cells of splenic CD8+ T cells on day 16 post grafting. Representative data, n=4 mice per group.
M: The frequency of active caspase 3/7+ cells of Thy1.1+ CD44hi FcγRIIB+ vs. FcγRIIB− OT-I T cells of splenic CD8+ T cells as shown in K. Summary data are shown, n=4 mice per group. Wilcoxon test, *p<0.05.
(N-O) 5×10⁵ WT Thy1.1+ OT-I T cells, 5×10⁵ Fcgr2b−/− CD45.2+ OT-I T cells, and 106 Thy1.1+ OT-II T cells were harvested from the spleen and mesenteric lymph nodes and adoptively transferred into congenically marked (CD45.1) naïve mice 24 hours prior to skin transplantation with OVA-expressing skin. Mice were sacrificed at day 16 post grafting and splenocytes were assessed by flow cytometry.
N: Representative flow cytometric plots of the expression of active caspase 3/7 of Thy1.1+ CD44hi WT and CD45.2+ CD44hi Fcgr2b−/− OT-I T cells of splenic CD8+ T cells on day 16 post grafting. Representative data from two independent experiments, n=3–4 mice per group.
O: The frequency of active caspase 3/7+ cells of Thy1.1+ CD44hi WT and CD45.2+ CD44hi Fcgr2b−/− OT-I T cells of splenic CD8+ T cells as shown in N. Summary data are shown. Pooled data from two independent experiments, n=3–4 mice per group. Wilcoxon test, *p<0.05.
See also Figure S3.
FcγRIIB+ antigen-specific CD8+ T cells exhibit a distinct gene expression profile
To further interrogate the transcriptional program underlying these differences in proliferation and cytokine effector function, RNA-seq was performed on FACS-sorted FcγRIIB+ and FcγRIIB− antigen-specific CD8+ T cells on day 14 post- transplantation (Fig. 3F). Of note, use of a MACS CD8+ T cell negative selection kit resulted in the preferential depletion of FcγRIIB+ CD8+CD44hiThy1.1+ OT-I T cells (Fig. S3). 1009 genes were differentially expressed between FcγRIIB+ vs. FcγRIIB− antigen-specific CD8+ T cells, including Fcgr2b (Fig. 3G–H). A number of transcription factors were also differentially expressed between FcγRIIB+ and FcγRIIB− OT-I T cells (Fig. 3I), as well as many cosignaling molecules (Figure 3J). The gene expression of Sell (CD62L) was significantly lower in the FcγRIIB+ OT-I T cells, confirming flow cytometric data which demonstrated that FcγRIIB+ T cells are predominately CD44hiCD62Llo (Fig. 1J) and further that FcγRIIB preferentially regulates CD44hiCD62Llo CD8+ T cells (Fig. 2G–I). Moreover, gene set enrichment analysis (GSEA) revealed that FcγRIIB+ CD8+ T cells are positively enriched in HALLMARK gene sets for allograft rejection, the IL-2-STAT5 signaling pathway, and apoptosis (Fig. 3K). These data show that FcγRIIB+ CD8+ T cells exhibit a distinct gene expression profile as compared to FcγRIIB− CD8+ T cells, one that is indicative of highly potent, multi-functional effector T cells.
FcγRIIB inhibits CD8+ T cell responses by inducing active caspase 3/7 in a cell intrinsic manner
Given the GSEA signature suggesting altered apoptosis, along with the observation that Fcgr2b−/− CD8+ T cells exhibited enhanced survival during the contraction phase of the response, we hypothesized that FcγRIIB was functioning to inhibit Ag-specific CD8+ T cell accumulation by inducing apoptosis. To test this, we first measured active caspase 3/7 expression in FcγRIIB+ vs. FcγRIIB− Ag-specific CD8+ T cells at day 16 post-transplant. Results indicated a marked increase in the frequency of active caspase 3/7+ cells within the FcγRIIB+ subset relative to the FcγRIIB− subset (Fig. 3L–M). To determine whether this impact of FcγRIIB deficiency on Ag-specific CD8+ T cell apoptosis was T cell intrinsic, we co-adoptively transferred WT and Fcgr2b−/− OT-I T cells into congenic hosts and measured the frequency of caspase 3/7+ apoptotic cells at day 16 post-transplant. Results indicated a significant reduction in the frequency of active caspase 3/7+ T cells within the Fcgr2b−/− vs. WT CD8+ Ag-specific transferred cells (Fig. 3N–O), suggesting that FcγRIIB-mediated signals result in CD8+ T cell apoptosis.
Immunotherapy with anti-FcγRIIB functions to augment CD8+ T cell responses in vivo
Because these data indicated that FcγRIIB functions as a cell-intrinsic coinhibitor of CD8+ T cells, we sought to determine whether FcγRIIB could be pharmacologically targeted to manipulate alloreactive CD8+ T cell responses in vivo. Naïve B6 animals received adoptive transfers of Thy1.1+ OT-I T cells and Thy1.1+ CD4+ OVA-specific (OT-II) T cells along with OVA-expressing skin grafts and were then treated with an FcγRIIB-specific antagonistic monoclonal antibody (AT-128) (Fig. 4A). This FcγRIIB-blocking antibody has shown to be non-cross-reactive with other FcRs (Williams et al., 2012). Analysis of the T cell response in the spleens of anti-FcγRIIB-treated recipients on day 14 post-transplant revealed a significant increase in both frequency and number of antigen-specific Thy1.1+ CD8+ T cells as compared to untreated controls (Fig. 4B–C), demonstrating that pharmacologic antagonism of FcγRIIB functions to augment antigen-specific CD8+ T cell responses in vivo. Moreover, blockade of the FcγRIIB pathway impacted CD8+ T cell apoptosis, in that the frequency of active caspase 3/7+ 7-AAD+ antigen-specific Thy1.1+ CD8+ T cells was significantly lower in animals treated with anti-FcγRIIB relative to untreated controls (Fig. 4D–E). These data demonstrate that FcγRIIB can be pharmacologically manipulated, and suggest it requires ligand binding in order to control CD8+ T cell responses in vivo.
Figure 4: Immunotherapy with anti-FcγRIIB functions to augment CD8+ T cell responses in vivo.
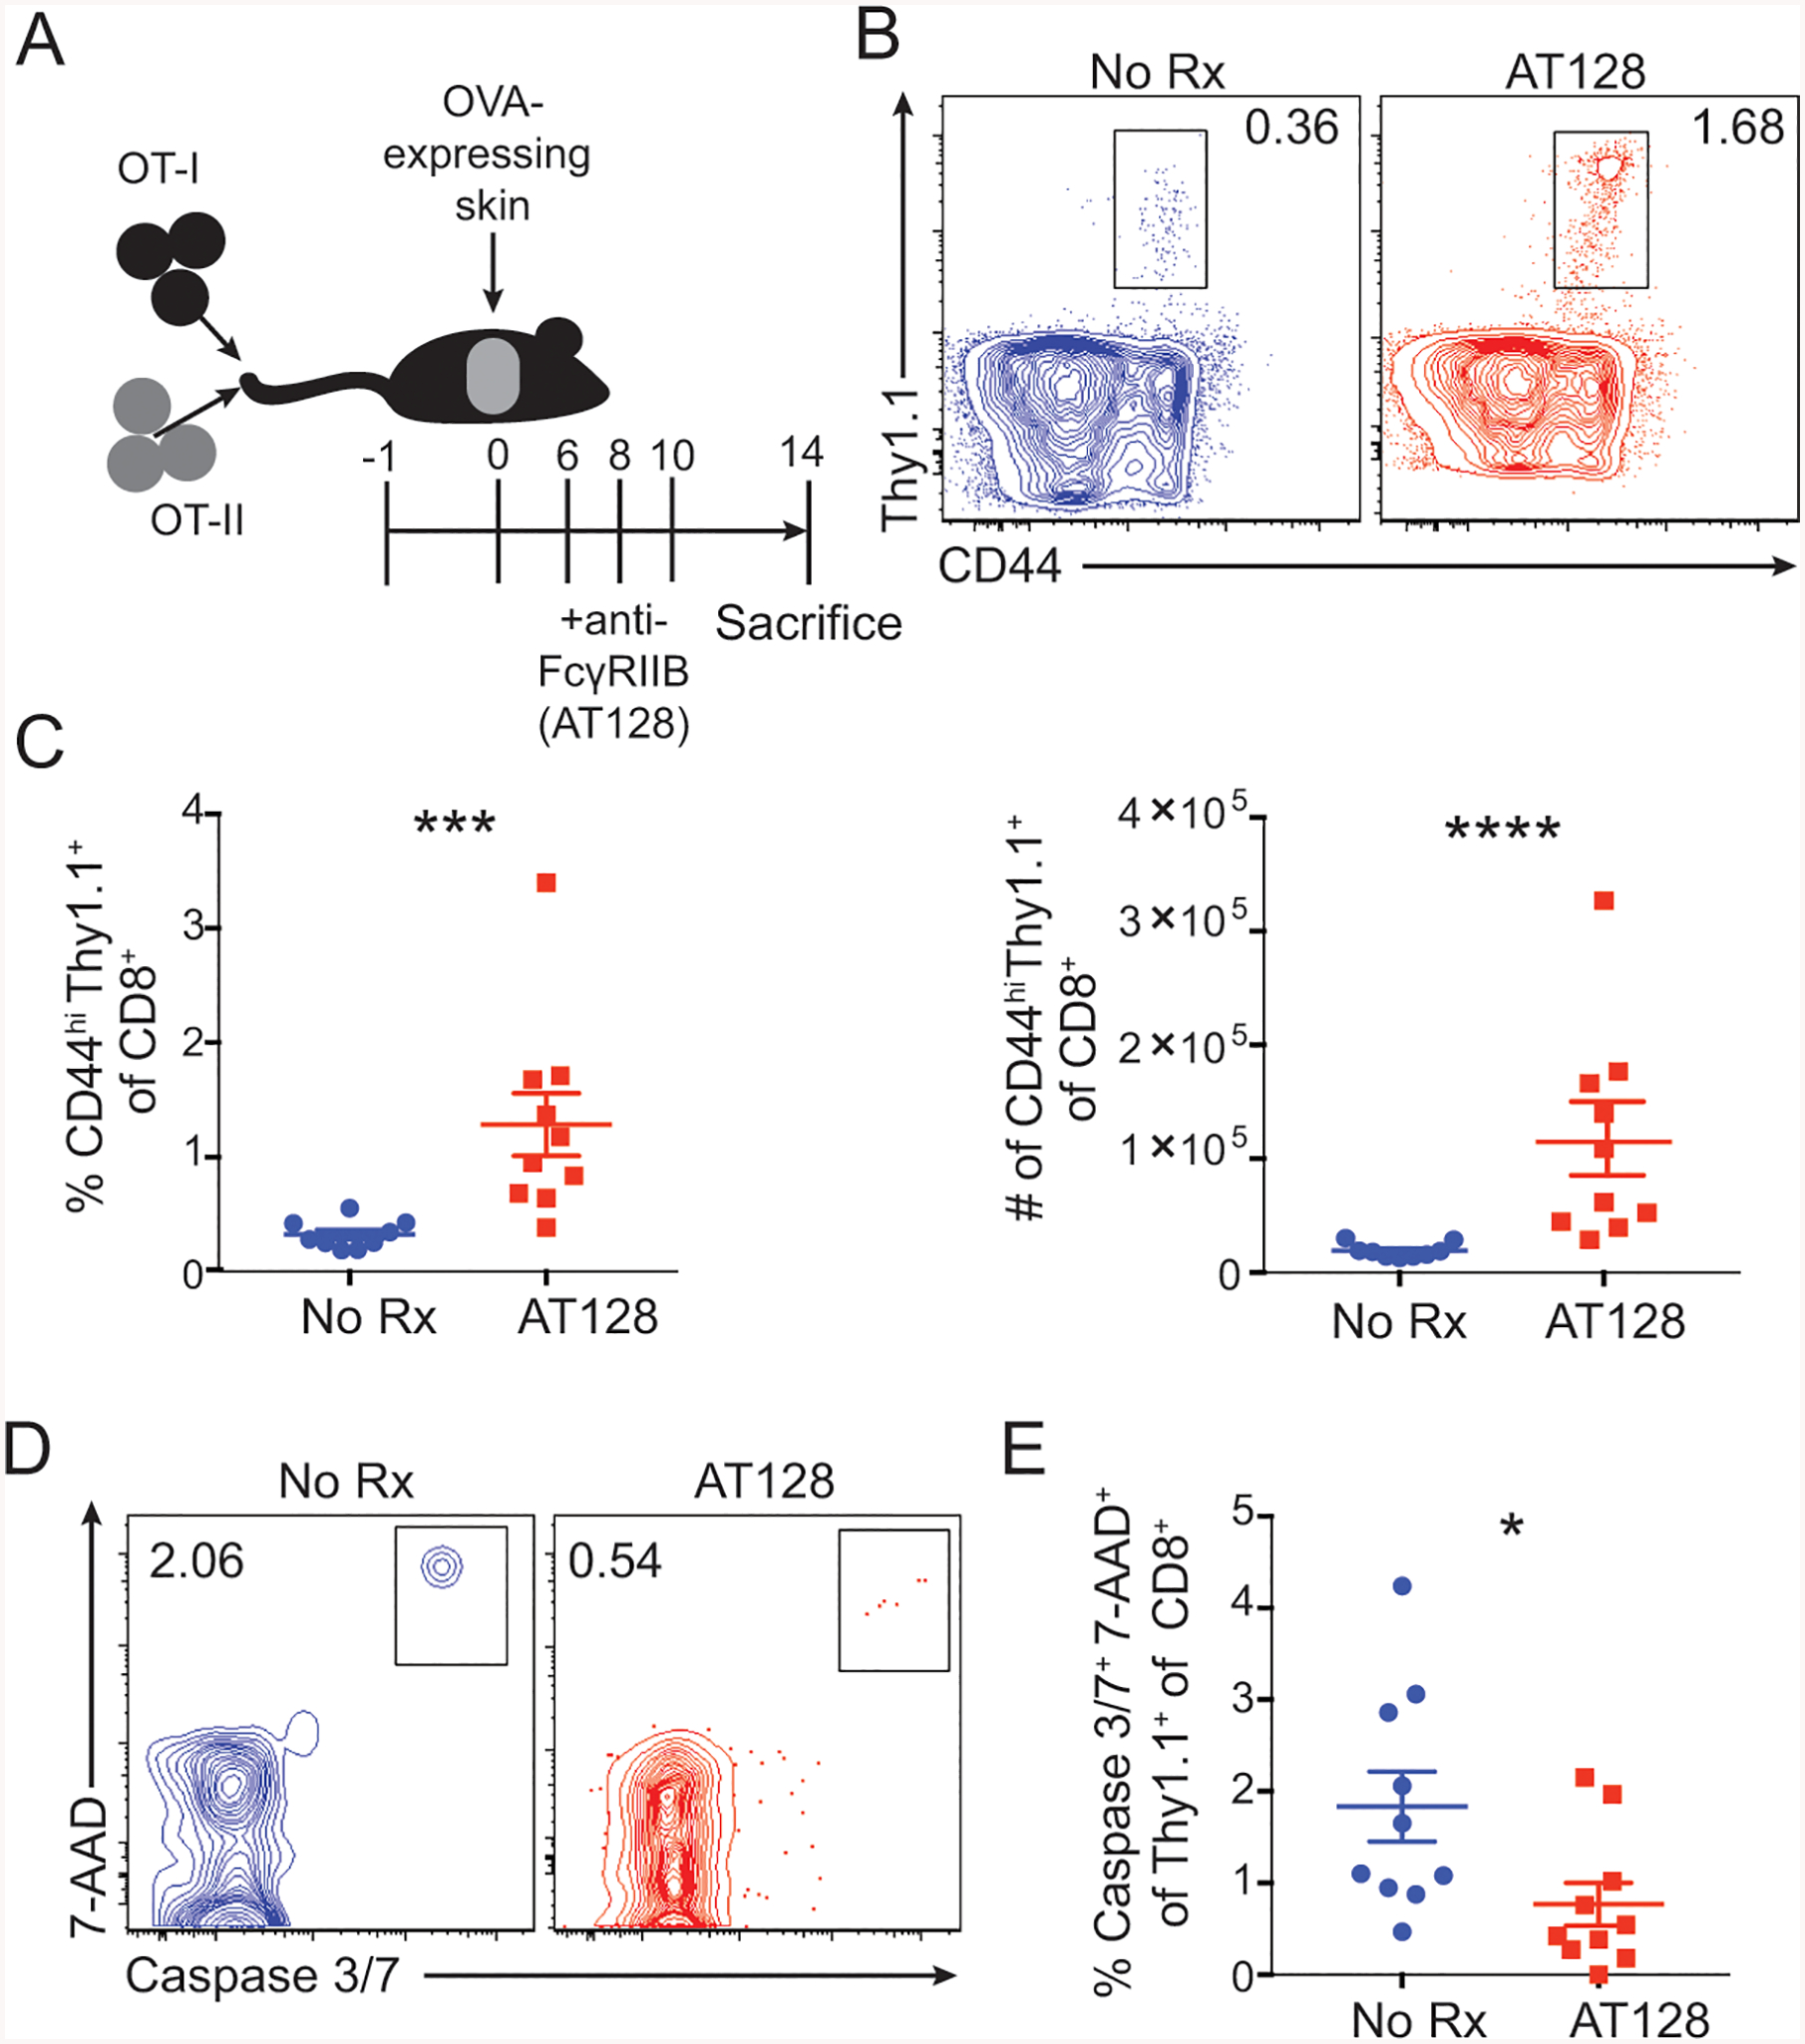
(A-E) A: Schematic of experimental design for panels B-E: 106 Thy1.1+ OT-I and OT-II were harvested from spleen and mesenteric lymph node and adoptively transferred 24 hours prior to skin grafting with OVA-expressing skin. Animals were treated with 250ug of the anti-FcγRIIB monoclonal antibody (clone AT-128) on days 6, 8, and 10 post grafting, and splenocytes were analyzed by flow cytometry at day 14.
B: Representative flow cytometric plots of CD44hiThy1.1+ OT-I T cells of splenic CD8+ T cells isolated from untreated and AT-128-treated mice. Representative data from 2 independent experiments, n=5 per group.
C: The frequency and absolute cell number of CD44hi Thy1.1+ CD8+ OT-I T cells of splenic CD8+ T cells isolated from untreated and AT-128-treated mice. Summary data ±SEM are shown. Pooled data from 2 independent experiments, n=5 per group. Mann-Whitney test, ***p<0.001.
D: Representative flow cytometric plots of caspase 3/7 and 7-AAD double-positive cells among CD44hi Thy1.1+ OT-I T cells of splenic CD8+ T cells from untreated and AT-128-treated mice. Representative data from 2 independent experiments, n=5 per group.
E: The frequency of caspase 3/7+ 7-AAD+ cells among the CD44hi Thy1.1+ OT-I T cells of the splenic CD8+ T cells of untreated and AT-128-treated treated mice. Summary data ±SEM are shown. Pooled data from 2 independent experiments, n=5 per group. Mann-Whitney test, *p<0.05.
See also Figure S4.
It is worth noting that we also addressed the impact of blockade of the FcγRIIB pathway on antigen-specific CD4+ T cell responses in this system. Results indicated that antibody blockade of FcγRIIB resulted in a significant increase in both the frequency and number of graft-specific CD4+ OT-II T cells (Fig. S4A–C). However, as demonstrated in Fig. 1G–J, we failed to detect FcγRIIB expression on CD4+ T cell populations. The ability of FcγRIIB deficiency to secondarily increase T cell responses via its effect on DC has previously been demonstrated by Ravetch’s group (Li et al., 2014). Thus, in order to determine if there is any contribution of CD8+ T cell-expressed FcγRIIB on the contemporaneous CD4+ T cell response, we assessed the tumor-reactive CD4+ OT-II T cell response in animals that had received either WT or Fcgr2b−/− CD8+ OT-I T cells (Fig S4D–F). Results indicated that there was no difference in either the frequency or number of tumor-specific OT-II T cells in recipients of WT vs. Fcgr2b−/− CD8+ T cells. Taken together, these results suggest that the impact of FcγRIIB blockade to augment CD4+ T cell responses is likely functioning primarily through its effect on APC. They further demonstrate that the accelerated rejection observed in skin graft recipients containing Fcgr2b−/− vs. WT CD8+ OT-I T cells (Fig. 2M) is not due to secondary effects on the graft-specific CD4+ T cell population.
IgG antibodies are not required for FcγRIIB-mediated control of CD8+ T cell responses
The results presented above demonstrate that ligand binding is required for the ability of FcγRIIB to regulate the survival of potent, differentiated CD8+ effectors. However, the nature of the ligand was unknown. Thus, we next addressed the requirement for IgG antibody in FcγRIIB-mediated control of CD8+ T cell responses. WT graft-specific OT-I T cells were adoptively transferred into either WT or Aicda−/− animals, which lack the ability to class-switch and thus have a complete absence of endogenous IgG (Fig. 5A) (Muramatsu et al., 2000; Robbiani et al., 2008). WT or Aicda−/− recipients were transplanted with OVA-expressing skin grafts and then were left untreated or were treated with anti-FcγRIIB (2.4G2). Results indicated that the ability of anti-FcγRIIB to enhance donor-reactive CD8+ T cell responses was preserved in Aicda−/− hosts (Fig. 5B). To confirm these results in the setting of CD8+ T cell-specific FcγRIIB deficiency, WT vs. Fcgr2b−/− OT-I T cells were adoptively transferred into WT or Aicda−/− hosts, which received OVA-expressing skin grafts and were sacrificed on day 21 post-transplant. Importantly, results indicated that the augmented accumulation of Fcgr2b−/− vs. WT CD8+ T cells is still observed when animals lacked IgG (Fig. 5C). These data demonstrate that antibody binding is not required for the observed ability of cell-intrinsic Fcgr2b deficiency to increase CD8+ T cell responses, and suggest that antibodies are not the functional ligand by which FcγRIIB controls CD8+ T cells.
Figure 5: FcγRIIB requires ligation with Fgl2, and not endogenous antibodies, for induction of apoptosis.
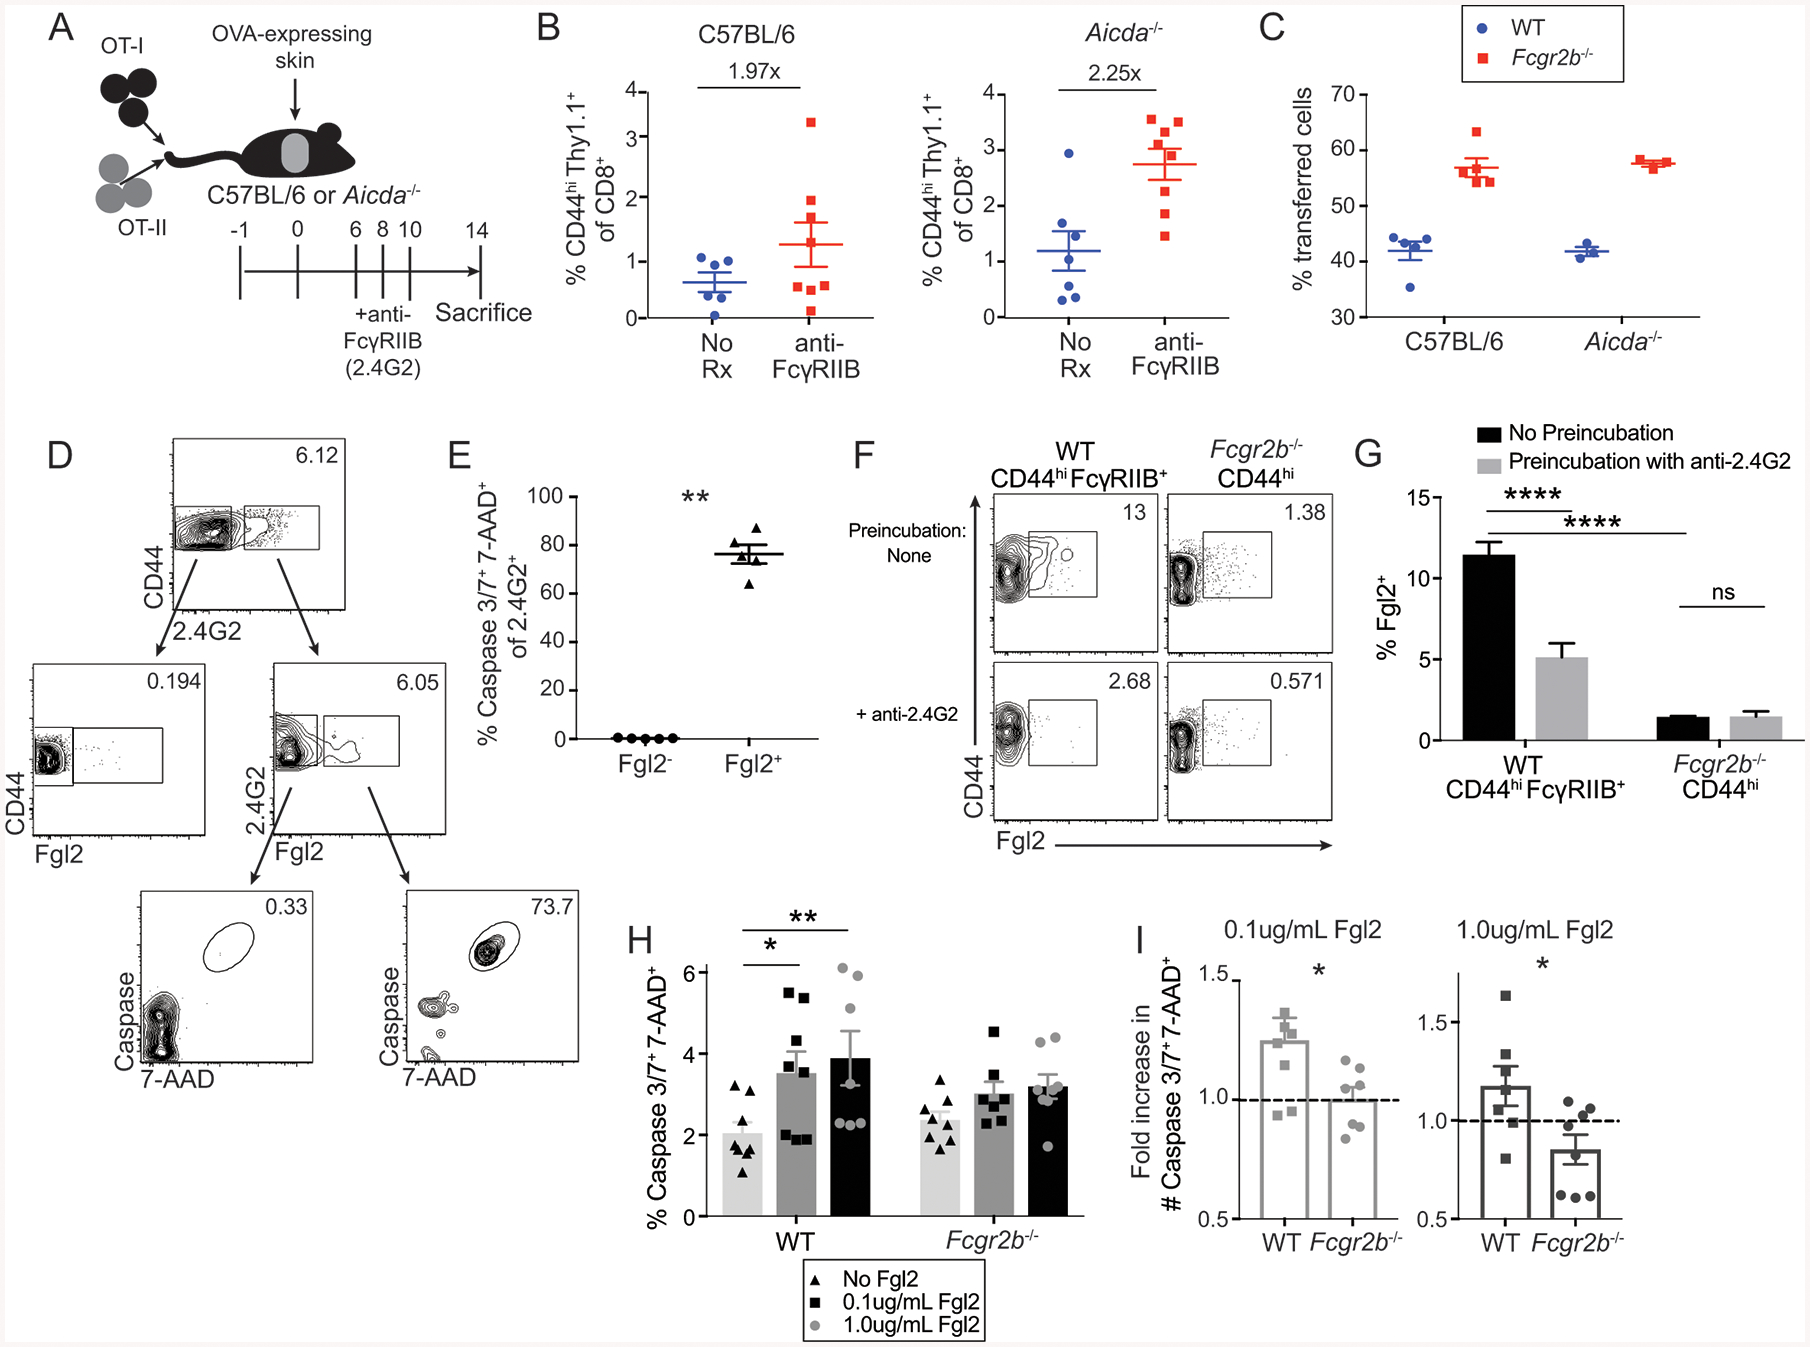
(A-B) A: Schematic of experimental design for panel B: 106 Thy1.1+ OT-I and OT-II were harvested from spleen and mesenteric lymph node and adoptively transferred into C57BL/6 or Aicda−/− animals 24 hours prior to skin grafting with OVA-expressing skin. Animals were treated with 250ug of the monoclonal antibody anti-FcγRIIB (clone 2.4G2) on days 6, 8, and 10 post grafting, and splenocytes were analyzed at day 14.
B: The frequency of CD44hi Thy1.1+ OT-I T cells of splenic CD8+ T cells in C57BL/6 and Aicda−/− recipients. Summary data ±SEM are shown. Pooled data from 2–3 independent experiments, n=3–5 per group.
C: 5×10⁵ WT Thy1.1+, 5×10⁵ Fcgr2b−/− Thy1.1+ Thy1.2+ OT-I T cells, and 106 OT-II T cells were harvested from the spleen and mesenteric lymph nodes and adoptively transferred into C57BL/6 and Aicda−/− recipients 24 hours prior to skin transplantation with OVA-expressing skin. Frequencies of WT vs Fcgr2b−/− T cells were assessed on day 21 post-transplant in the draining lymph node (axial and brachial). Summary data ±SEM are shown. Representative data from 2 independent experiments, n=5 mice per group
D: WT B6 mice received OVA-expressing skin grafts and were sacrificed at day 14. Splenocytes were analyzed via flow cytometry. Bulk CD8+ CD44hi cells were stained for anti-FcγRIIB (clone 2.4G2) and Fgl2. Gating strategy is as follows: CD44hiCD8+ T cells are gated on 2.4G2− and 2.4G2+ cells. 2.4G2− and 2.4G2+ cells are then gated for Fgl2. 2.4G2+Fgl2− and 2.4G2+Fgl2+ cells are then gated for frequency of caspase 3/7 and 7-AAD double-positive cells.
E: The frequency of caspase 3/7+ 7-AAD+ cells from the 2.4G2+Fgl2− and 2.4G2+Fgl2+ populations gated on in D. Summary data ±SEM are shown, n=5 mice. Mann-Whitney test, **p<0.01.
F: CD44hiFcγRIIB+ CD8+ T cell splenocytes from naïve WT mice or CD44hi CD8+ T cell splenocytes from naïve Fcgr2b−/− mice, aged 6 months, were either preincubated with media or anti-FcγRIIB (clone 2.4G2) and then stained with Fgl2. Representative flow cytometric plots of Fgl2 expression is shown, n=4 replicates per group.
G: The frequency of Fgl2+ cells from either CD44hi FcγRIIB+ CD8+ T cells from WT hosts or CD44hi CD8+ T cells from Fcgr2b−/− hosts that were preincubated with media alone or anti-FcγRIIB (clone 2.4G2) and then stained with Fgl2. Summary data ±SEM are shown, n=4 replicates per group. Two-way ANOVA with multiple comparisons, ****p<0.0001.
(H-I) WT or Fcgr2b−/− OT-I CD8+ T cells isolated from the spleen were stimulated for 2 days with SIINFEKL peptide and then supplemented with 0.1 or 1.0ug/mL soluble Fgl2 for 24 hours.
H: The frequency of caspase 3/7+7-AAD+ OT-I CD8+ T cells following stimulation with or without soluble Fgl2. Summary data ±SEM is shown. Pooled data from 3 independent experiments, n=2–3 per group. Two-way ANOVA with multiple comparisons, *p<0.05, **p<0.01.
I: The fold increase in cell number of caspase 3/7+ 7-AAD+ OT-I T cells following stimulation with or without soluble Fgl2. Summary data ±SEM is shown. Pooled data from 3 independent experiments, n=2–3 per group. Mann-Whitney test, *p<0.05.
See also Figure S2.
Fibrinogen-like 2 (Fgl2) induces CD8+ T cell apoptosis in an FcγRIIB-dependent manner
Given the results that IgG is not required for FcγRIIB-mediated control of CD8+ T cell responses, we queried other potential FcγRIIB ligands. Fibrinogen-like 2 (Fgl2) is an anti-inflammatory cytokine produced by many cell types, most prominently Foxp3+ Treg (Joller et al., 2014), and has been shown to ligate FcγRIIB on dendritic cells and macrophages (Liu et al., 2008). However, a direct role for Fgl2 in controlling CD8+ T cell responses via FcγRIIB has not been investigated. To begin to assess the ability of Fgl2 to bind to FcγRIIB on CD8+ T cells in the setting of transplantation, soluble Fgl2 (sFgl2) protein was first measured in the serum in naïve and grafted animals. Data show an increase in serum concentration of sFgl2 protein on day 21 post-transplant relative to day 3 post-transplant (Fig. S2I). Surface Fgl2 binding was next assessed on FcγRIIB+ vs. FcγRIIB− CD44hi CD8+ T cells obtained from grafted mice at day 14 post-transplant. Results revealed that FcγRIIB+ CD8+ T cells contained a markedly greater frequency of cells that also stained positively for Fgl2 surface expression, relative to FcγRIIB− CD8+ T cells (Fig. 5D). Moreover, Fgl2+ FcγRIIB+ CD8+ cells exhibited a significant increase in active caspase 3/7 relative to Fgl2− FcγRIIB+ CD8+ T cells, suggesting that ligation of FcγRIIB by Fgl2 was associated with an increase in apoptosis in CD8+ T cells (Fig. 5E).
To determine whether Fgl2 physically ligates FcγRIIB on CD8+ T cells, we tested whether pre-incubation with 2.4G2 blocked binding of Fgl2. Results indicated that pre-incubation with 2.4G2 significantly diminished staining of Fgl2 relative to cells that were pre-incubated with media alone (Fig. 5F–G). Moreover, Fgl2 was unable to bind Fcgr2b−/− CD8+ T cells, and there was no effect of pre-incubation with 2.4G2 (Fig. 5F–G). In aggregate, these data show that Fgl2 physically ligates FcγRIIB on CD8+ T cells. Next, to determine whether Fgl2 can serve as a functional ligand for FcγRIIB and induce apoptosis in FcγRIIB-expressing CD8+ T cells, WT vs. Fcgr2b−/− CD8+ T cells were first stimulated with cognate antigen for 2 days ex vivo and then cultured in the presence or absence of recombinant Fgl2 for 24 hours. Data demonstrate that the addition of Fgl2 resulted in a significantly increased frequency of active caspase 3/7+ 7-AAD+ cells among WT CD8+ T cells, but not among Fcgr2b−/− CD8+ T cells (Fig. 5H–I). These data demonstrate that Fgl2 is a functional ligand by which FcγRIIB controls CD8+ T cell apoptosis.
FcγRIIB is expressed on human CD8+ T cells and is associated with freedom from rejection following withdrawal of tacrolimus immunosuppression in human renal transplant recipients
In order to assess the potential clinical relevance of these results, we next queried the expression of FcγRIIB on CD8+ T cells isolated from both normal healthy controls and from transplant recipients. PBMC from healthy volunteers and from 4 transplant recipients were isolated in an IRB-approved protocol and are gated on CD8+ T cells. Cells were stained with anti-FcγRII (clone FUN-2). Results indicate that anti-FcγRII stained human CD8+ T cells in both normal healthy controls and in transplant recipients (Fig. 6A–B). While we observed a range of frequencies of positive cells within the CD8+ T cells compartments between individuals, the average frequency among transplant recipients was significantly lower as compared to normal healthy controls (Fig. 6C). To confirm that specifically FcγRIIB is expressed on human CD8+ T cells, we isolated PBMC from 7 healthy volunteers and from 4 pre-transplant recipients and FACS-sorted (97%) for CD19−CD14−CD3+CD4− CD8+ T cells (Fig. 6A, D). RNA was then extracted for qPCR analysis for FCGR2B. Results indicate that human CD8+ T cells in both normal healthy controls and in transplant recipients express ~400- fold greater FCGR2B mRNA than CD4+ T cells (Fig. 6E).
Figure 6: FcγRIIB is expressed on human CD8+ T cells and is associated with freedom from rejection following withdrawal from tacrolimus immunosuppression in renal transplant recipients.
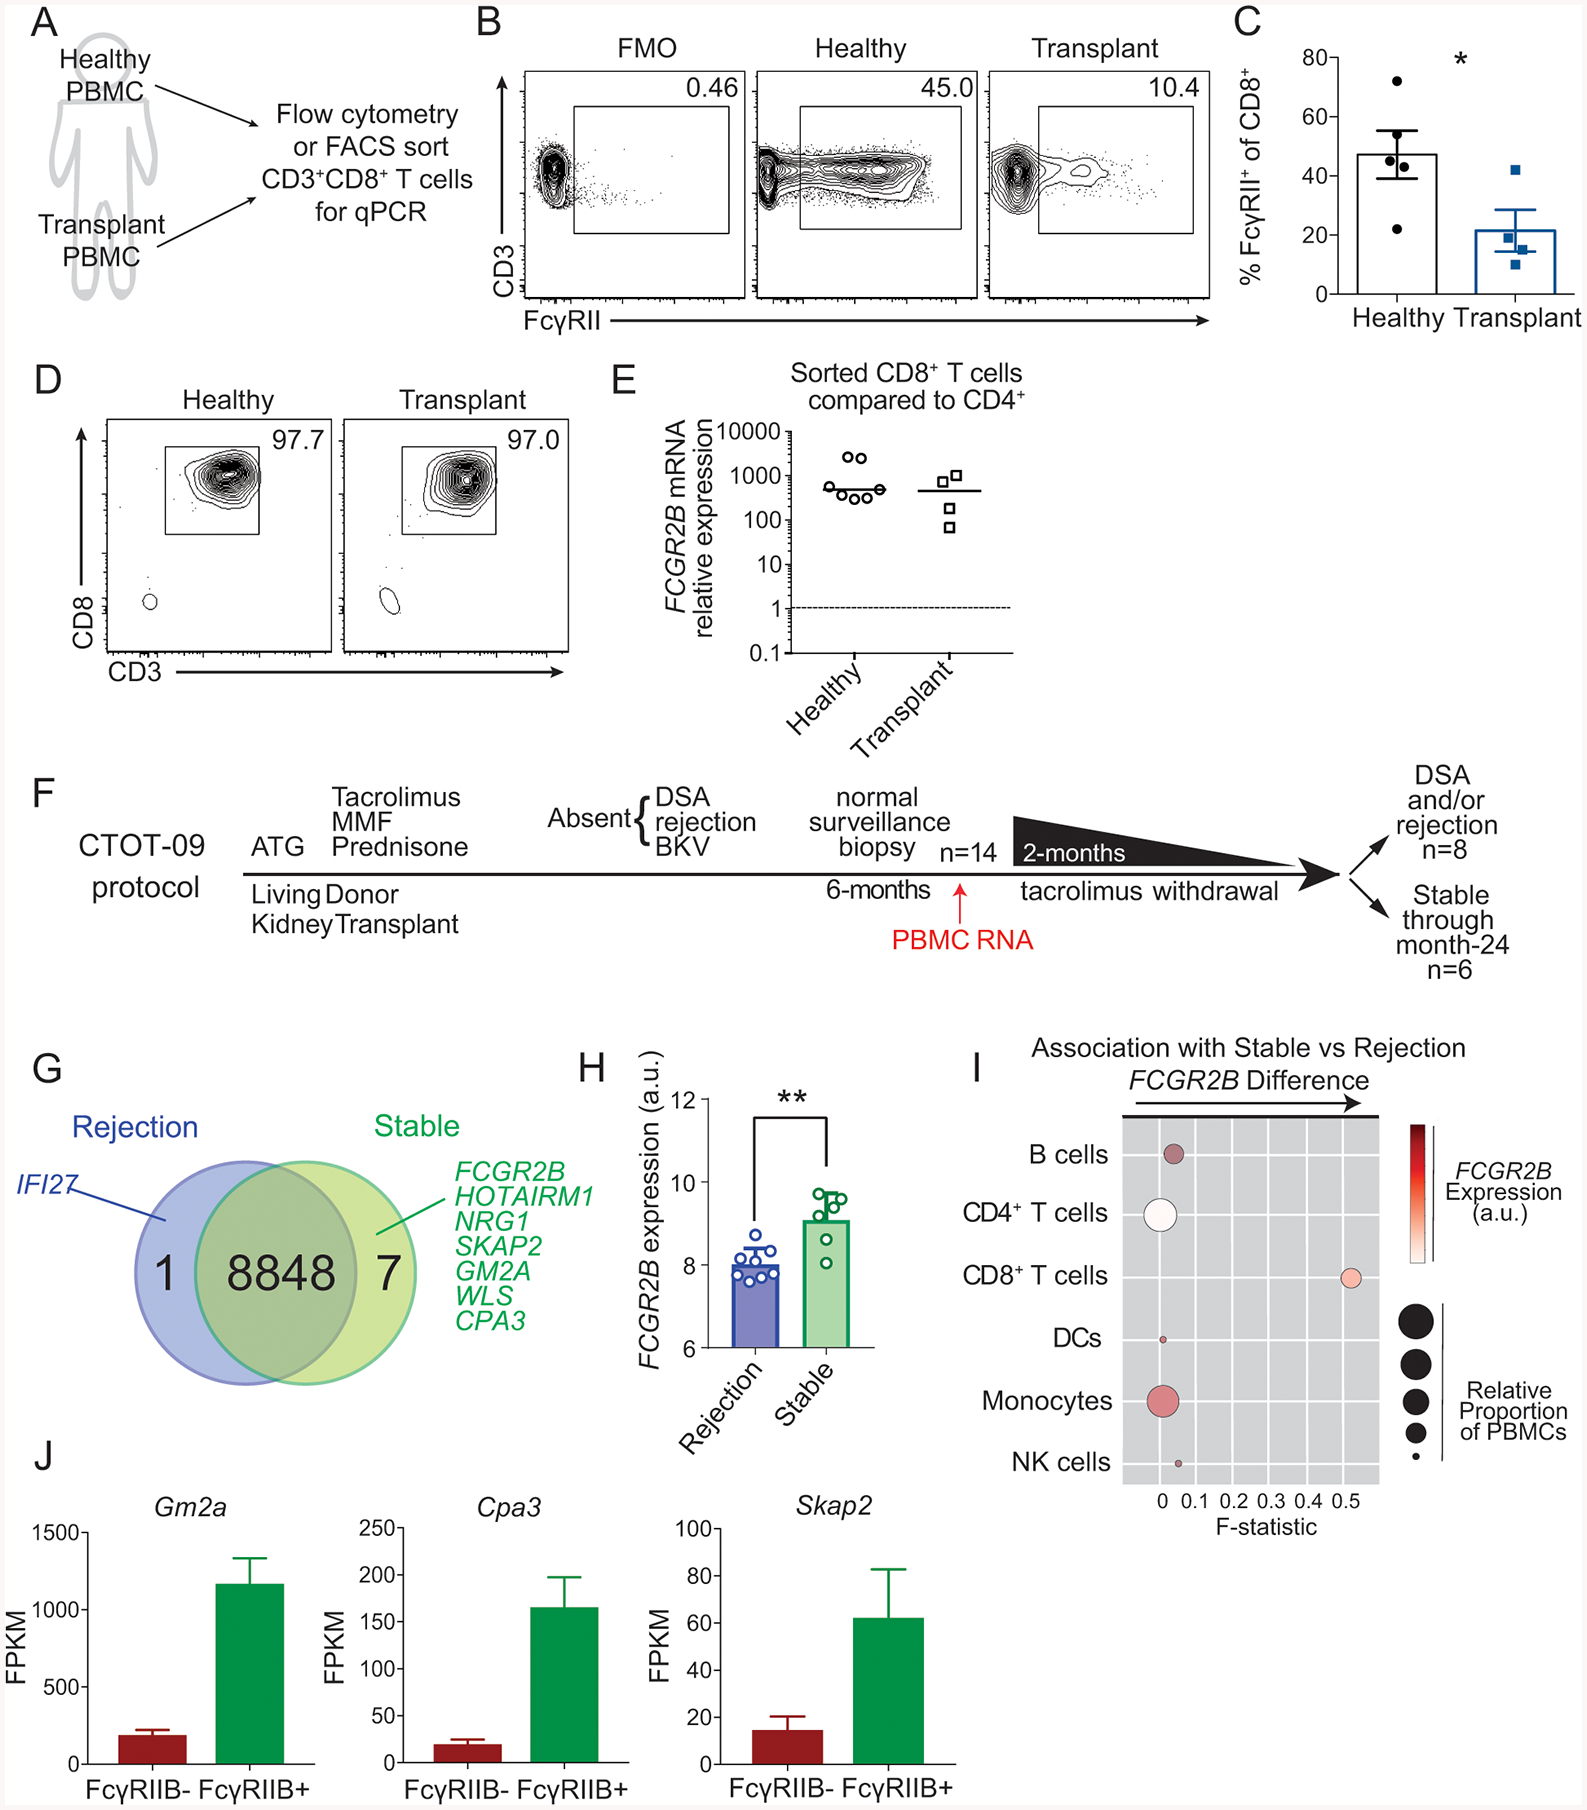
(A-E) A: Schematic of experimental design for B-E: PBMCs from healthy human subjects and renal transplant recipients were isolated for flow cytometry and sorting to perform qPCR of FCGR2B.
B: Representative flow cytometric plots of the expression of FcγRII on CD8+ T cells in PBMCs from healthy human subjects and in renal transplant recipients.
C: The frequency of FcγRII+ cells among CD8+ T cells as shown in B. Summary data ±SEM are shown. n=5 healthy controls and n=4 transplant recipients. Mann-Whitney test, *p<0.05.
D: Flow cytometric plots of the purity of cells following FACS sorting of CD19−CD14−CD3+CD4−CD8+ T cells from healthy and transplant recipients.
E: Relative expression (2−ΔΔCT) of FCGR2B normalized to internal GAPDH and to CD4+ T cells from sorted CD19−CD14−CD3+CD4−CD8+ T cells from healthy and transplant recipients.
(F-I) F: Schematic overview of the CTOT09 study analyzed in panels G-I. PBMC RNA was harvested prior to tacrolimus withdrawal and analyzed for differential gene expression.
G. Summary of differentially expressed genes from microarrays analyzing mRNA extracted from PBMCs of stable patients vs. patients that rejected. Upregulation logFc > 1.5, p<0.001.
H. FCGR2B expression in patients that rejected vs. those that were stable, p<0.01.
I. CellCODE analysis of microarray samples obtained before tacrolimus withdrawal. Data points depict the surrogate proportion variables (size) association, the average relative expression of FCGR2B across all the samples (color intensity), and its association with the difference in expression observed for each major subset between stable patients and patients that reject (x-axis, see Methods).
J: Fragments per kilobase per million (FPKM) of Gm2a, Cpa3, and Skap2 in the FcγRIIB+ and FcγRIIB− sorted OT-I T cells from the experimental design in Fig. 3F.
Given these data showing that human CD8+ T cells express FcγRIIB, we queried whether increased expression of FcγRIIB might portend better outcomes by limiting the alloreactive CD8+ T cell response post-transplantation. We interrogated the association of FcγRIIB with transplant rejection and the development of new donor specific antibodies in a subset of renal transplant recipients as part of the CTOT-09 clinical trial (Hricik et al., 2015) (Fig. 6F). In brief, 14 clinically stable subjects 6-months post-transplant were randomized to be weaned off of tacrolimus immunosuppression (but remained on low doses of steroids and mycophenolic acid). RNA from PBMC samples was obtained prior to initiating the tacrolimus withdrawal. Eight of the 14 subjects developed donor-specific antibody or acute cellular and/or antibody rejection following weaning of tacrolimus, while the remaining six were stable (without rejection, donor specific antibody or changes in kidney function) for the duration of the 18-month follow up period. Transcript analysis of pre-withdrawal PBMC revealed only eight differentially expressed genes between those that developed evidence of transplant dysfunction and those that were stable. Of these, seven genes were upregulated and one was downregulated in the patients that remained stable following immunosuppression withdrawal (Fig. 6G). FCGR2B was one of the genes that was significantly higher in patients who were rejection-free off tacrolimus immunosuppression as compared to those who developed alloantibodies, cellular or humoral graft rejection following withdrawal from tacrolimus (Fig. 6H). CellCODE analysis, which quantifies the strength of relationships between canonical gene sets of distinct immune cell lineages and a gene of interest, was then used to assess the strength of the association between FCGR2B expression and B cells, CD4+ T cells, CD8+ T cells, DCs, monocytes, and NK cells (Chikina et al., 2015). In brief, CellCODE corrects for cell mixture variation in data sets using a latent variable approach to reliably estimate proportions of cells using publicly available homogeneous datasets in the form of surrogate proportion variables (SPVs) and is used to perform cell type deconvolution in transcriptomic data analyses with high accuracy (Chikina et al., 2015). Several recent high-impact studies have employed the CellCODE bioinformatics approach in lieu of traditional cell-sorting to assess cell-type specific gene expression patterns (Altman et al., 2019; Hartmann et al., 2017; Lee et al., 2018; Liu et al., 2019). Using this platform, we found that FCGR2B mRNA expression was highest in B cells, dendritic cells, and monocytes, findings which are consistent with our flow cytometry data (not shown), thus validating the successful application of CellCODE. Using an interaction model, we queried which cell lineage was most tightly associated with the differences in FCGR2B mRNA expression between the stable and rejecting patients at time of tacrolimus withdrawal. The F-statistic derived from these analyses was the highest for CD8+ T cells, indicating that FCGR2B mRNA expression in the CD8+ T cell subset drives the differences observed between stable vs. rejected patients (Fig. 6I). We then compared the original list of 8 genes that were differentially expressed between stable vs. rejecting transplant patients in this trial against our RNASeq data set comparing FACS-sorted FcγRIIB+ vs. FcγRIIB− CD8+ T cells. Of note, of the 7 remaining transcripts that were upregulated in the stable patients, 3 of them were significantly upregulated in FACS-purified FcγRIIB+ T cells relative to FcγRIIB− CD8+ T cells (Cpa3, Gm2a, Skap2) (Fig. 6J). These data further support the conclusion that it is FcγRIIB on CD8+ T cells that underlies the differential expression observed in rejecting vs. stable transplant recipients.
Discussion
Here we show that FcγRIIB functions intrinsically to inhibit murine and human CD8+ T cell responses. These studies challenge long-held dogma that T cells do not express Fc receptors (Nimmerjahn and Ravetch, 2008). Instead, our data corroborate recent studies demonstrating FcγRIIB mRNA in and protein expression on CD8+ T cells (Alfei et al., 2019; Starbeck-Miller et al., 2014; Wirth et al., 2010). Importantly, the mRNA expression of FcγRIIB excludes the possibility that the observed FcγRIIB is solely due to the acquisition of FcγRIIB protein from other cells. The results presented here suggest that under physiologic conditions, FcγRIIB inhibits the survival of CD8+ T cells. In line with this hypothesis, we show that FcγRIIB+ antigen-specific CD8+ T cells exhibit gene set enrichment in apoptosis. These data suggest that FcγRIIB modulates apoptosis signaling pathways in CD8+ T cells, similar to one of the reported functions of FcγRIIB on B cells (Ono et al., 1996). The ability of FcγRIIB to induce apoptosis in CD8+ T cells is biologically significant, in that CD8+ T cell-specific Fcgr2b deficiency resulted in accelerated allograft rejection and decreased tumor load in mouse models of transplantation and melanoma, respectively, and in that increased CD8+ T cell-associated FcγRIIB correlated with rejection-free allograft survival in a cohort of renal transplant recipients. These data therefore demonstrate that FcγRIIB is an important, overlooked intrinsic regulator of CD8+ T cell responses in both mouse and humans.
Our study also provides insight into the mechanisms by which FcγRIIB regulates CD8+ T cell immunity. We showed that FcγRIIB functionality on CD8+ T cells is controlled by ligation of a binding partner; however, the most well-known FcγRIIB ligand, IgG antibody, is not required for the ability of FcγRIIB to regulate CD8+ T cell responses. Instead, our results implicated Fgl2 as the functional ligand via which FcγRIIB signaling induces apoptosis in CD8+ effector T cells. Together, these data provide conceptual insight into the physiologic role of the FcγRIIB pathway on CD8+ T cells. As shown in Fig. 3C–E, FcγRIIB is upregulated after the 6th division and persists on differentiated effector-memory CD8+ T cells that have potent effector function. It is known that systemic serum Fgl2 protein concentration is increased in settings of chronic inflammation including cancer (Latha et al., 2019; Tang et al., 2017; Yan et al., 2015; Yan et al., 2019; Zhu et al., 2017) and chronic viral infection (Foerster et al., 2010; Marsden et al., 2003), and here we have shown that Fgl2 induces apoptosis of FcγRIIB+ CD8+ T cells. Thus, these data suggest that the physiologic relevance of this pathway is to allow for control of active, highly differentiated effectors in the setting of chronic inflammation in order to limit immune pathology. FcγRIIB/Fgl2 interactions are thus a potential therapeutic target for controlling CD8+ T cells that has clinical applicability in cancer, infection, transplantation, and autoimmunity.
The data presented here indicate that Fgl2 is a functional ligand for FcγRIIB on CD8+ T cells resulting in apoptosis, and not that Fgl2 binds to some other receptor expressed on a subset of FcγRIIB+ T cells and induces apoptosis. This conclusion is supported by our findings that 1) pre-incubation with anti-FcγRIIB blocks Fgl2 binding and 2) Fgl2 binding is absent on Fcgr2b−/− CD8+ T cells. However, only a subset of FcγRIIB+ T cells (~10%) stain positive for Fgl2, raising the possibility that FcγRIIB requires a specific modification for Fgl2 binding which occurs only a subset of FcγRIIB+ cells. Given our results that IgG antibody was not required for the induction of apoptosis in FcγRIIB+ CD8+ T cells, it is possible that some modification of FcγRIIB+ may render it unable to bind IgG and instead able to bind Fgl2 to induce apoptosis. In support of this notion, ~80% of FcγRIIB+ cells that were able to bind Fgl2 stained positive for markers of apoptosis. Of course, these findings do not preclude the existence of other ligands for FcγRIIB on CD8+ T cells. Future studies to explore the range of responses of FcγRIIB+ CD8+ T cells to both endogenous and pharmacologic ligands are ongoing.
Further bolstering the notion that FcγRIIB modulates CD8+ T cell survival, we observed a tight relationship between FcγRIIB-expressing cells and effector-like phenotypes, including the observations that FcγRIIB+ cells are highly enriched in the effector memory population, are potent cytokine producers, and have undergone multiple rounds of division. Moreover, FcγRIIB+ cells have lower transcripts of CD62L and the transcription factor Eomes, suggesting that FcγRIIB ligation may induce a negative signal in CD44hiCD62Llo and Eomeslo short-lived effector T cells that are then programmed for deletion. Mechanistically, this deletion may proceed through the cell-intrinsic apoptotic pathway, as FcγRIIB+ CD8+ T cells contain a higher frequency of cells that stain positively for active caspase 3/7. Furthermore, we found that pharmacologic targeting of FcγRIIB resulted in an accumulation of CD44hiCD62Llo cells and that Fcgr2b−/− antigen-specific CD8+ T cells are enriched in CD44hiCD62Llo and Eomeslo cells. These data confirm that FcγRIIB preferentially inhibits CD44hiCD62Llo and Eomeslo cells. Because Eomes and CD62L are canonical molecules associated with high-quality memory T cell differentiation (reviewed in (Kaech and Cui, 2012)), these data suggest that FcγRIIB functions to inhibit highly potent effector cells.
Why has FcγRIIB expression on T cells not been well-characterized before now? Of note, FcγRIIB is not present on naïve T cells (Fig. 1I–J). FcγRIIB upregulation becomes most prevalent during the contraction phase at day 14 and 21. As cells are contracting quickly, smaller numbers might make it difficult to detect FcγRIIB-expressing cells. Further, the MFI of FcγRIIB is lower on T cells than it is on B cells (data not shown), and to obtain clear, interpretable staining, we utilized a biotinylated antibody to amplify the signal. Moreover, we found that FcγRIIB+ OT-I T cells were depleted following the use of a negative selection CD8+ MACS enrichment kit (Fig. S3), raising the issue that any study enriching for CD8+ in this manner would likely exclude this subset of T cells, potentially biasing the results of the study.
The potential implications of T cells expressing Fcγ receptors are profound. As we move into the era of biologics to treat human disease (which have the potential to interact with Fc receptors, either in harmful or beneficial ways), elucidating the coinhibitory role of FcγRIIB on T cells is critical for complete understanding of how these reagents work and why they sometimes fail. Further, the identification of the role of Fgl2 in inhibiting the accumulation of effector CD8+ T cells demonstrate a regulatory interaction between innate and adaptive aspects of immunity. Therapeutic modulation of this inhibitory pathway could be applied to mitigate T cell-mediated diseases, including transplant rejection, tumor immunity, autoimmunity, and protective immunity against pathogens.
STARMethods
LEAD CONTACT AND MATERIALS AVAILABILITY
Further information and requests for resources and reagents should be directed to and will be fulfilled by the Lead Contact, Mandy Ford (mandy.ford@emory.edu).
There are restrictions related to the availability of the Fcgr2b−/− OT-I mice generated in this study, the anti-CD28 domain antibodies used, and the AT128 antibodies used due to the limitations of the MTAs through which we obtained these reagents.
EXPERIMENTAL MODEL AND SUBJECT DETAILS
Mice
Male C57BL/6 (H-2b) and B6/Ly5.2 mice aged 6–8 weeks were obtained from the National Cancer Institute (Frederick, MD). OT-I (Hogquist et al., 1994) and OT-II (Barnden et al., 1998) transgenic mice were purchased from Taconic Farms (Germantown, NY) and bred to Thy1.1+ background at Emory University. OVA-transgenic mice (C57BL/6 background, H-2b) (Ehst et al., 2003) were a generous gift from Dr. Marc Jenkins (University of Minnesota, Minneapolis, MN). B6;129S-Fcgr2btm1Ttk/J (Fcgr2b−/−) were purchased from The Jackson Laboratory (stock #002848, (Takai et al., 1996)). These mice were used in Fig. 1. EM:06078 Fcgr2b Fcgr2bB6null B6(Cg)-Fcgr2btm12Sjv/Cnbc (or Fcgr2b−/−) mice were purchased from the European Mutant Mouse Archive (EMMA) and provided by the Academisch Siekenhuis Leiden/Leiden University Medical Center from Dr. J.S. Verbeek (Boross et al., 2011). These mice were generated using embryonic stem cells from B6 mice and used in Fig. 2, 3, 5, S2, and S4. Fcgr2b−/− mice from EMMA were bred to OT-I transgenic mice at Emory University for use in intrinsic experiments to exclude any T cell effects of the 129 background. B6.129P2-Aicdatm1(cre)Mnz/J (Aicda−/−) mice were purchased from The Jackson Laboratory (stock #007770). Unless otherwise stated in the figure legend and text, mice were aged 8 weeks at the start of the experiment, experimental hosts were male, and donor animals for adoptive transfers and skin transplantation were male or female. This study was carried out in strict accordance with the recommendations in the Guide for the Care and Use of Laboratory Animals. The protocol (PROTO201700558) was approved by the Institutional Animal Care and Use Committee of Emory University. All surgery was performed under general anesthesia with maximum efforts made to minimize suffering. All animals were housed in specific pathogen-free animal facilities at Emory University.
Human subjects
Patients undergoing renal transplantation at Emory University Hospital between the years 2009 and 2015, as well as normal healthy controls, were enrolled in an immune monitoring protocol approved by Emory University’s Institutional Review Board (IRB #00046593) after informed consent was obtained. Patient samples for this study were acquired prior to transplantation (baseline).
Healthy and transplant recipients for flow cytometry
Of the 5 healthy controls, there were 3 males and 2 females, age range 22–63. Of the 4 transplant recipients, there were 3 males and 1 female, age range 22–79.
Healthy and transplant recipients for qPCR
Of the 4 healthy controls, there were 2 males and 2 females, age range 52–62. Of the 4 transplant recipients, there were 2 males and 2 females, age range 26–69.
CTOT09 clinical trial
The CTOT09 study included 21 living donor renal transplant recipients who received anti-thymoglobulin (ATG), mycophenolate mofeteil (MMF), steroids, and tacrolimus and were without rejection, development of donor-specific antibody (DSA), or BK virus (BKV) for 6 months and had normal protocol biopsies at 6–7 months post-transplant. Seven of these patients were randomized to stay on tacrolimus, MMF, and steroids while 14 patients underwent withdrawal from tacrolimus immunosuppression over a 2-month period. There were no differences in age (range= 37–61 for control group, range= 24–73 for tacrolimus withdrawal group, p=0.79) or sex (p=0.66) between the two groups (Hricik et al., 2015). RNA was isolated from PBMC samples taken prior to initiating withdrawal. Of the 14 patients who underwent withdrawal from immunosuppression, eight developed donor-specific antibody or acute cellular rejection, while six did well for the duration of the 18-month follow up period off of tacrolimus immunosuppression.
METHOD DETAILS
Adoptive cell transfers
To monitor antigen-specific donor-reactive CD8+ T cell responses, we used our previously described system in which OVA-specific transgenic T cells in naïve animals are adoptively transferred prior to skin transplantation with OVA-expressing skin. For the adoptive transfer, WT OT-I, Fcgr2b−/− OT-I, and OT-II transgenic cells were harvested from the spleen and mesenteric lymph nodes. Cells were counted using a Nexcelom Cellometer Auto T4 (Nexecelom Bioscience, Lawrence, MA) and stained with CD8- BV785, CD4- PacBlue, Thy1.1- PerCP, Vα2- FITC, and Vβ5- PE (BioLegend). Frequency of OT-I and OT-II was determined via Vα2 and Vβ5 TCR co-expression. Cells were resuspended in 1X PBS and adoptively transferred into naïve hosts 24 hours prior to skin transplantation or B16-OVA melanoma inoculation. Where indicated, OT-I T cells were labeled with 5uM CellTrace Violet (CTV) dye (Life Technologies, Invitrogen) according to manufacturer’s instructions and then adoptively transferred into naïve hosts. Proliferation was measured on day 14 post transplantation via flow cytometry on a BS LSR II (BD Biosciences) and data were analyzed with FlowJo (Tree Star, San Carlos, CA) and Prism (GraphPad Software).
Antigenic challenges
Mice were transplanted with full thickness (~1cm) tail, ear, or trunk skins from transgenic OVA-expressing mice on the dorsal thorax and wrapped with adhesive bandages for seven days (Trambley et al., 1999). For tumor challenge, mice were inoculated with 106 B16-OVA melanoma cells in the subcutaneous tissue of the right flank. The B16 melanoma cell line engineered to express the OVA epitope was provided by Dr. Yang-Xin Fu (Brown et al., 2001). Tumor growth was then followed by daily visual inspection. Tumor volume was calculated using caliper measurement of height, width and depth.
Where indicated, mice were treated intraperitoneally with 250ug CTLA-4Ig (abatacept, Bristol Myers-Squibb) on days 0, 2, 4, and 6, 50ug CD28 domain antibody (anti-CD28dAb, Bristol Myers-Squibb) on days 0, 2, 4, 6, and every other day thereafter until day 30, 250ug CD32B (Clone: AT128) provided by Dr. Mark Cragg (Williams et al., 2012) on days 6, 8 and 10, or with 250ug CD16/CD32 (Clone: 2.4G2, BioXCell, West Lebanon, NJ) on days 6, 8 and 10. Grafts were considered rejected when less than 10% of viable graft remained.
ELISAs
For the anti-OVA IgG ELISA, 96-well plates were incubated overnight with 10ug/mL OVA protein in coating buffer. Wells were blocked with blocking buffer (PBS + 0.2% Tween-20 + 10% FBS) for 30 minutes at room temperature (RT), and serial dilutions of serum were added to each well and incubated for 90 minutes at 37C. Plates were then washed three times in PBS + 0.5% Tween-20. A 1:1000 dilution of biotinylated anti-IgG was then added and incubated for 30 minutes at RT. Plates were then washed three times in PBS + 0.5% Tween-20. A 1:1000 dilution of Avidin-D-HRP was then added and incubated for 30 minutes at RT. Plates were then washed four times in PBS + 0.5% Tween-20. TMB with peroxide was then added, and the reaction was stopped after 15 minutes with 2N H2SO4, and read at OD450nm.
To measure plasma levels of Fgl2, the Fgl2 ELISA kit (BioLegend) was followed according to the manufacturer’s instructions.
Lymphocyte isolation from peripheral organs
Prior to organ harvesting, the heart and portal vein were perfused with 10 mL cold PBS. Livers were homogenized manually and filtered, and then spun lightly at 300rpm to pellet the hepatocytes. The supernatant was resuspended in a 40% percoll solution and overlaid on 60% percoll, and then spun at 2000rpm for 20 minutes. The buffy coat was isolated, washed, and stained with antibodies for flow cytometry. Lungs were chopped and digested for 1 hour at 37°C with 1.5mg/mL Collagenase (type 1A, Sigma-Aldrich, C2654) and 0.75mg/mL hyaluronidase (type 1, Sigma-Aldrich,) in DMEM + 10% FBS. Digested lungs were then homogenized, filtered, washed, and stained with antibodies for flow cytometry. Heart and kidney were chopped and digested with 0.5mg/mL Collagenase D (Sigma- Aldrich) in HBSS (with calcium and magnesium) with 5% FBS, 10mM HEPES, and 2mM EDTA for 40 minutes at 37°C with shaking (200rpm). The digested kidney and heart were then homogenized, filtered, washed, and stained with antibodies for flow cytometry. Skin grafts were cleaned and defatted, chopped, and digested with 2mg/mL Collagenase P (Sigma-Aldrich) in HBSS (with calcium and magnesium) for 30 minutes at 37°C. Digested lungs were then homogenized, filtered, washed, and stained with antibodies for flow cytometry.
Flow cytometry, transcription factor staining, and intracellular cytokine staining
Spleens were processed into single cell suspensions and stained according to manufacturer’s instructions with CD3e- BV650 (BD Biosciences), biotinylated CD16/CD32 (2.4G2, BD Biosciences), biotinylated isotype control (IgG2b κ isotype, BD Biosciences), and CD4-PacBlue, CD8- BV785, CD19-BV510, CD11c- FITC, CD44- APC-Cy7, CD62L- PE-Cy7,Thy1.1- PerCP, CD45.1- BV605, CD45.2- PE-Dazzle, CD40- FITC, 2B4-PE, CD69- BV711, and streptavidin-APC (all from BioLegend). For Fgl2 staining, anti-Fgl2 (clone 6D9, Abnova) was conjugated to PE using an R-PE conjugation kit according to manufacturer’s instructions (Novus, 703–0010). For transcription factor staining, cells were permeabilized using a FoxP3/transcription factor kit (Invitrogen) and stained with Eomes- PE and Tbet- BV421 (BioLegend). For active caspase 3/7 and 7-AAD staining, the caspase 3/7 kit (Thermofisher) was followed according to manufacturer’s instructions. For cytokine staining, splenocytes were ex vivo stimulated at 37°C with 30nm OVA257–264 (SIINFEKL) peptide and 10ug/mL GolgiPlug (BD Biosciences). After 4 hours, cells were processed and stained using an intracellular cytokine staining kit (BD Biosciences) according to manufacturer’s instructions with TNF- PE-Cy7, IFNγ- Alexafluor700, and IL-2- BV421 (all from BioLegend). Samples without peptide were analyzed for unstimulated controls. All flow cytometry samples were acquired on an LSR II flow cytometer (BD Biosciences) and data were analyzed using FlowJo (Tree Star, San Carlos, CA) and Prism (GraphPad Software). Sorting was performed on an ARIAII instrument (BD Biosciences). Absolute cell numbers were calculated using CountBright Beads (Life Technologies) according to the manufacturer’s instructions.
In vitro stimulation of WT and Fcgr2b−/− OT-I T cells with Fgl2
5×10⁶ splenocytes from WT or Fcgr2b−/− OT-I transgenic mice were stimulated for 48 hours with SIINFEKL peptide. Cells were further stimulated for another 24 hours in the presence or absence of 0.1 or 1.0ug/mL soluble Fgl2 (R&D Systems). Cells were then harvested and caspase 3/7 and 7-AAD (Thermofisher) was assessed via flow cytometry.
PBMC isolation for flow cytometry phenotyping of human CD8+ T cells and sorting for qPCR
Patients undergoing renal transplantation at Emory University Hospital between the years 2009 and 2015, as well as normal healthy controls, were enrolled in an immune monitoring protocol approved by Emory University’s Institutional Review Board (IRB #00046593) after informed consent was obtained. Patient samples for this study were acquired prior to transplantation (baseline). PBMCs were purified from peripheral blood samples via density gradient centrifugation (cell preparation tubes, BD Pharmingen) and cryopreserved at −80 degrees C at the Emory Transplant Center Biorepository. For phenotyping of isolated PBMCs, the following antibodies were used: CD14/CD19-V500 (BD Pharmingen), CD8-BV785 (BD Pharmingen), CD4-APC-H7 (BD Pharmingen), and anti-CD32-PE (clone FUN-2, BioLegend). For FACS sorting, standard extracellular staining was performed on PBMCs using the following fluorophore-labeled antibodies: BV510-CD19 (BD Pharmingen), BV510-CD14 (BD Pharmingen), CD3-PerCP-Cy5.5 (BD Pharmingen), CD8-BV711 (BD Pharmingen), and CD4-V450 (BD Pharmingen). Following FACS sorting of CD19−CD14−CD3+CD4−CD8+ T cells, RNA was purified using the RNeasy Plus Micro Kit (Qiagen cat. #74034) and then converted to cDNA using the High Capacity cDNA reverse transcription kit (Thermo Fisher cat. #4368814). cDNA was then used as template in a qPCR reaction with PCR Taqman probes for FCGR2B (Thermo Fisher, Hs00269610_m1, cat. # 4448892) and GAPDH (Thermo Fisher, Hs02786624_g1, cat. # 4331182). Quantitative RT-PCR was performed using the QuantStudio Flex Systems (Thermo Fisher Scientific). ΔΔCT values were determined by normalizing to GAPDH and normalizing to the CD4+ ΔCT values. Relative mRNA expression of FCGR2B were determined using the 2−ΔΔCT method.
viSNE analysis
viSNE (visual high-dimensional single-cell data analysis based on the t-Distributed Stochastic Neighbor Embedding (t-SNE) algorithm) allows visualization of multi-dimensional data as a 2D scatter plot (Amir el et al., 2013). viSNE was performed in cytobank (Cytobank, Santa Clara, CA). FCS files of CD8+ T cells on day 14 post transplantation with OVA-expressing skin were imported into cytobank and viSNE was run using default parameters (iterations= 1000, perplexity= 30, and theta=0.5). The median fluorescent intensity for each marker is displayed on the plot, with a scale representing the range of fluorescent intensity (high-red, low-blue) on the left-hand side. From the Thy1.1 and FcγRIIB plots, Thy1.1+ FcγRIIB+ and Thy1.1+ FcγRIIB− cells were gated on, and MFIs of those cell populations were extracted for 2B4, CD40, CD69, and CD44.
RNA-seq
106 antigen-specific OT-I T cells were adoptively transferred 24hrs prior to skin transplantation with OVA-expressing skin. On day 14 post grafting, lymphocytes were ficolled or enriched in CD8+ T cells using the MACS CD8+ negative selection isolation kit (Miltenyi Biotech, 130-104-075). 1000 FcγRIIB+ and FcγRIIB− CD44hiThy1.1+CD8+ T cells from the spleen were then isolated by FACS on an ARIAII instrument (BD Biosciences). Total RNA was purified using the Quick-RNA MicroPrep Kit (Zymo Research) and used as input for the SMART-seq v4 cDNA synthesis kit (Takara). Final libraries were constructed using 200 pg of cDNA as input for the NexteraXT kit with the NexteraXT indexing primers (Illumina). Libraries were quality checked on an Agilent Bioanalyzer, pooled at an equimolar ratio and sequenced on a NextSeq500 using 75 bp paired-end chemistry. Raw sequencing reads were mapped to the mm9 genome using TopHat2 (Kim et al., 2013) and the UCSC mm9 Known Gene reference transcript database (Hsu et al., 2006). For each sample, reads that overlapped exons of unique ENTREZ genes were annotated using the GenomicRanges (v1.22.4) package in R/Bioconductor. Genes with less than 3 reads per million in at least 3 samples were removed and edgeR (Robinson et al., 2010) was used to find significantly differentially expressed genes between FcγRIIB+ and FcγRIIB− OT-I T cells. Genes with an FDR < 0.05 were termed significant. For GSEA, all detected genes were ranked by multiplying the sign of the fold change (+ or −) by the -log10 of the P-value. The resulting list was used in a GSEA PreRanked analysis. All sequencing data is available from the NCBI Gene Expression Omnibus (GEO) under accession GSE118439.
Microarray Analysis of Transplant Patient PBMC
RNA samples were processed and hybridized to a human HT HG-U133 Plus PM BeadChip gene chip (Affymetrix, Santa Clara, CA). Arrays were processed at Scripps (La Jolla, CA) and raw expression data were obtained. The data were log transformed and RMA normalized. Differential expression between stable and rejection patients was defined with an absolute fold change of at least 1.5, and a significant change in expression by limma (linear models of microarray data, Bioconductor (Gentleman et al., 2004) implementation) after correction for multiple-hypothesis testing. Genes with multiple probes were collapsed to keep probes with the highest average expression within differentially expressed genes. CellCODE (Chikina et al., 2015) analysis was applied to the samples before Tac withdrawal (6 months post-transplant) using the IRIS dataset (Abbas et al., 2009) to obtain the tag matrix. Average FCGR2B mRNA expression in each cell subset was inferred from correlation analysis between the total FCGR2B mRNA expression and the surrogate proportion variables (SPVs) obtained with CellCODE in each sample. SPVs were converted into proportions of PBMCs using paired SPV-flow cytometry measurements obtained from similar studies (Chikina et al., 2015). The association of each cell subset with the differences observed between stable and rejection patients were obtained using an interaction model, which included the SPVs, and deriving an interaction F statistic for each cell subset (Chikina et al., 2015).
QUANTIFICATION AND STATISTICAL ANALYSIS
Wilcoxon matched-pairs signed rank tests were performed to compare two groups in the co-transfer experiments or if comparisons were made within the same host animals, and Mann-Whitney tests were performed to compare unpaired groups. One-way ANOVA with multiple comparisons was performed when comparing multiple groups, two-way ANOVA with multiple comparisons was performed when comparing multiple groups. Survival data were plotted on Kaplan-Meier curves, and a log-rank (Mantel-Cox) test was performed. All analyses were done using Prism (GraphPad Software). In all legends and figures, mean ± SEM is shown, and *p<0.05, **p<0.01, ***p<0.001, ****p<0.0001.
DATA AND CODE AVAILABILITY
RNAseq data generated in the study have been deposited to NCBI Gene Expression Omnibus (GEO) under accession GSE118439.
Supplementary Material
Figure S3, refers to Figure 3: Negative selection CD8+ MACS enrichment kits lead to the selective depletion of FcγRIIB-expressing CD8+ T cells. 106 OT-I and OT-II were harvested from the spleen and mesenteric lymph nodes and adoptively transferred into naïve hosts 24 hours prior to skin transplantation with OVA-expressing skin. On day 14 post grafting, splenocytes were either ficolled or enriched for CD8+ T cells using the MACS negative selection CD8+ isolation kit.
A: Representative flow plots of FcγRIIB+ cells of CD44hiThy1.1+ CD8+ T cells following ficoll or CD8+ MACS enrichment, either in the enriched subset or eluent.
B: The frequency of FcγRIIB+ cells of CD44hiThy1.1+ CD8+ T cells following ficoll or CD8+ MACS enrichment, either in the enriched subset or eluent. Summary data ±SEM is shown. One-way ANOVA, **p<0.01, ****p<0.0001.
Figure S1, refers to Figure 1: FcγRIIB detection on CD8+ T cells using a FcγRIIB-specific clone, AT130–2. Splenocytes from WT mice aged 6 months or older were probed for B and T cell expression of FcγRIIB through staining with the monoclonal antibody anti-CD32b (clone AT130–2)
A: Representative flow cytometric plots of the expression of FcγRIIB on splenic B cells, CD8+ T cells, and CD4+ T cells via staining with AT130–2 and an isotype control.
Figure S4, refers to Figure 4: Blockade of FcγRIIB, but not CD8+ T cell specific FcγRIIB deficiency, results in increased CD4+ T cell responses. A: Schematic of experimental design: 106 OT-I and OT-II were harvested from spleen and mesenteric lymph node and adoptively transferred 24 hours prior to skin grafting with OVA-expressing skin. Animals were treated with 250ug of the monoclonal antibody anti-FcγRIIB (clone AT-128) on days 6, 8, and 10 post grafting, and splenocytes were analyzed by flow cytometry at day 14.
B: Representative flow cytometric plots of CD44hiThy1.1+ OT-II T cells of CD4+ T cells in untreated and treated mice. Representative data from two independent experiments, n=4–5 mice per group.
C: The frequency and absolute cell number of CD44hiThy1.1+ OT-II T cells of CD4+ T cells in untreated and treated mice. Summary data ±SEM is shown. Pooled data from two independent experiments, n=4–5 mice per group. Mann-Whitney test, *p<0.05.
D: Schematic of experimental design: 106 WT Thy1.1+ OT-I T cells or 106 Fcgr2b−/− Thy1.1+ OT-I T cells, and 106 Thy1.1+ OT-II T cells were harvested from spleen and mesenteric lymph nodes and adoptively transferred into congenically marked naïve mice 24 hours prior to inoculation with a B16-melanoma-expressing OVA. Splenocytes were assessed by flow cytometry on day 10 post tumor inoculation.
E: Representative flow plots of CD44hi Thy1.1+ OT-II T cells of CD4+ T cells in animals that received either WT or Fcgr2b−/− OT-I T cells. Representative data from 2 independent experiments, n=4 mice per group.
F: The frequency and absolute number of CD44hi Thy1.1+ OT-II T cells of CD4+ T cells in animals that received either WT or Fcgr2b−/− OT-I T cells. Summary data ±SEM is shown. Pooled data from 2 independent experiments, n=4 mice per group. Mann-Whitney test, ns=not significant.
Figure S2, refers to Figure 2 and 5: Lack of FcγRIIB leads to decreased frequency of Tcm cells, and expression of FcγRIIB is elevated in tumor- and allograft-infiltrating CD8+ T cells. (A-C) 5×10⁵ WT Thy1.1+ OT-I T cells, 5×10⁵ Fcgr2b−/− CD45.2+ OT-I T cells, and 106 Thy1.1+ OT-II T cells were harvested from the spleen and mesenteric lymph node and adoptively transferred into congenically marked (CD45.1+, Thy1.2+) naïve mice 24 hours prior to skin transplantation with OVA-expressing skin. Mice were sacrificed at indicated timepoints and splenocytes were analyzed by flow cytometry.
A: The frequency of naïve CD44loCD62L+ WT or Fcgr2b−/− OT-I T cells on days 4, 7, 10, 14, and 21 post grafting. Summary data ±SEM are shown. Pooled data from two independent experiments, n=5 mice per group.
B: The frequency of CD44hiCD62L+ (Tcm) cells WT or Fcgr2b−/− OT-I T cells on days 4, 7, 10, 14, and 21 post grafting. Summary data ±SEM are shown. Pooled data from two independent experiments, n=5 mice per group. Two-way ANOVA, **p<0.01.
C: The absolute cell number of CD44hiCD62L+ (Tcm) cells WT or Fcgr2b−/− OT-I T cells on days 14 and 21 post grafting. Summary data are shown. Pooled data from two independent experiments, n=5 mice per group. Wilcoxon test, **p<0.01.
(D-G) 106 WT Thy1.1+ OT-I T cells or 106 Fcgr2b−/− CD45.2+ OT-I T cells, and 106 Thy1.1+ OT-II T cells were harvested from the spleen and mesenteric lymph nodes and adoptively transferred into congenically marked naïve mice 24 hours prior to inoculation with a B16-melanoma-expressing OVA cell line. Mice were sacrificed at indicated timepoints post tumor inoculation and indicated tissues were assessed by flow cytometry.
D: Representative flow cytometric plots of the expression of FcγRIIB in WT OT-I T cells in the lymph node, spleen, and tumor on days 10 and 14 following tumor inoculation. Pooled data from two independent experiments, n=3–5 mice per group.
E: The frequency of FcγRIIB-expressing WT OT-I T cells on days 10 and 14 in the lymph node, spleen, and tumor following tumor inoculation. Summary data ±SEM are shown. Pooled data from two independent experiments, n=3–5 mice per group.
F. The frequency of FcγRIIB-expressing naïve (CD62L+CD44lo), Tcm cells (CD62L+CD44hi), and Tem cells (CD62L−CD44hi) WT OT-I T cells on day 14 in the lymph node, spleen, and tumor. Summary data ±SEM are shown. Pooled data from two independent experiments, n=3–5 mice per group.
G: Representative photographs of tumor volume on day 10 post-tumor inoculation from mice that received either WT or Fcgr2b−/− OT-I T cells. Representative data from two independent experiments, n=3–5 mice per group.
H: Representative flow cytometric plots and summary data of the expression of FcγRIIB on cells infiltrating BALB/c skin grafts on C57BL/6 recipients on day 14 post-transplant. Summary data ±SEM are shown, n=4 mice.
I: Plasma was analyzed via ELISA for Fgl2 on day 3 and 21 post-transplant of C57BL/6 recipients with BALB/c skin grafts. Summary data ±SEM are shown, n=3–4 mice per group. Mann-Whitney test, p=0.0571.
KEY RESOURCES TABLE
| REAGENT or RESOURCE | SOURCE | IDENTIFIER |
|---|---|---|
| Antibodies | ||
| BV785 anti-mouse CD8a antibody | BioLegend | BioLegend Cat# 100750, RRID:AB_2562610 |
| PacBlue anti-mouse CD4 antibody | BioLegend | BioLegend Cat# 100428, RRID:AB_493647 |
| PerCP anti-mouse Thy1.1 antibody | BioLegend | BioLegend Cat# 202512, RRID:AB_1595487 |
| BV605 anti-mouse CD45.1 antibody | BioLegend | BioLegend Cat# 110738, RRID:AB_2562565 |
| PE-Dazzle anti-mouse CD45.2 antibody | BioLegend | BioLegend Cat# 109846, RRID:AB_2564177 |
| Biotin anti-mouse CD16/32 antibody, clone 2.4G2 | BD Biosciences | BD Biosciences Cat# 553143, RRID:AB_394658 |
| PE anti-mouse TCR Vb5 antibody | BioLegend | BioLegend Cat# 139504, RRID:AB_10613279 |
| APC Streptavidin | BioLegend | BioLegend Cat# 405207 |
| Biotin anti-mouse IgG2b k isotype control antibody | BD Biosciences | Cat# 553987, RRID:AB_10053772 |
| FITC anti-mouse TCR Va2 antibody | BioLegend | BioLegend Cat# 127806, RRID:AB_1134188 |
| BV605 anti-mouse CD3e antibody | BD Biosciences | BD Biosciences Cat# 564378, RRID:AB_2738779 |
| BV510 anti-mouse CD19 antibody | BioLegend | BioLegend Cat# 115546, RRID:AB_2562137 |
| BV510 anti-mouse CD14 antibody | BioLegend | BioLegend Cat# 123323, RRID:AB_2564129 |
| FITC anti-mouse CD11c antibody | BioLegend | BioLegend Cat# 117306, RRID:AB_313775 |
| APC-Cy7 anti-mouse CD44 antibody | BioLegend | BioLegend Cat# 103028, RRID:AB_830785 |
| PE-Cy7 anti-mouse CD62L antibody | BioLegend | BioLegend Cat# 104418, RRID:AB_313103 |
| FITC anti-mouse CD40 antibody | BioLegend | Biolegend Cat# 124610, RRID:AB_1134075 |
| APC anti-mouse FcγRIIB (clone AT130) | eBiosciences | Ref# 17-0321-82 |
| PE anti-mouse CD244 antibody | BD Biosciences | BD Biosciences Cat# 553306, RRID:AB_394770 |
| BV711 anti-mouse CD69 antibody | BioLegend | BioLegend Cat# 104537, RRID:AB_2566120 |
| PE anti-mouse Eomes antibody | BD Pharmingen | Cat# 566749 |
| BV421 anti-mouse Tbet antibody | BioLegend | BioLegend Cat# 644815, RRID:AB_10896427 |
| PE-Cy7 anti-mouse TNF antibody | BioLegend | BioLegend Cat# 506323, RRID:AB_2204356 |
| AlexaFlour700 anti-mouse IFNγ antibody | BioLegend | BioLegend Cat# 505824, RRID:AB_2561300 |
| BV421 anti-mouse IL-2 antibody | BioLegend | BioLegend Cat# 503825, RRID:AB_10895901 |
| Fgl2 monoclonal antibody (clone 6D9) | Abnova | Abnova Cat# H00010875-M01, RRID:AB_565732 |
| PE mouse IgG2a,k | BioLegend | BioLegend Cat# 400212 |
| Caspase 3/7 kit | Thermofisher | Cat # C10427 |
| V500 anti-human CD14 | BD Pharmingen | BD Biosciences Cat# 562693, RRID:AB_2737727 |
| V500 anti-human CD19 | BD Pharmingen | BD Biosciences Cat# 561121, RRID:AB_10562391 |
| BV510 anti-human CD14 | BioLegend | BioLegend Cat# 301842, RRID:AB_2561946 |
| BV510 anti-human CD19 | BioLegend | BioLegend Cat# 302242, RRID:AB_2561668 |
| BV711 anti-human CD8 | BioLegend | BioLegend Cat# 344734, RRID:AB_2565243 |
| V450 anti-human CD4 | BD Pharmingen | BD Biosciences Cat# 560345, RRID:AB_1645572 |
| PerCP-Cy5.5 anti-human CD3 | BD Pharmingen | BD Biosciences Cat# 560835, RRID:AB_2033956 |
| BV785 anti-human CD8 | BD Pharmingen | BD Biosciences Cat# 563823, RRID:AB_2687487 |
| APC-H7 anti-human CD4 | BD Pharmingen | BD Biosciences Cat# 560158, RRID:AB_1645478 |
| PE anti-human CD32 (FUN-2) | BioLegend | Cat# 303205, RRID:AB_314337 |
| anti-mouse FcγRIIB (clone AT128) | Williams, et al., 2012. Dr. Mark Cragg | |
| InVivoMAb anti-mouse CD16/32 (clone 2.4G2) | BioXcell | Cat# BE0307, RRID:AB_2736987 |
| Bacterial and Virus Strains | ||
| Biological Samples | ||
| Emory Transplant Center Biorepository | Emory IRB protocol #00046593 | |
| Chemicals, Peptides, and Recombinant Proteins | ||
| GolgiPlug | BD Biosciences | Cat# 555029 |
| OVA peptide 257–264 (SIINFEKL) | GenScript | Cat# RP10611 |
| CTLA-4Ig (abatacept) | Bristol-Myers Squibb, | Abatacept (Orencia) |
| Anti-CD28 domain antibodies | Bristol-Myers Squibb | |
| Collagenase (type 1A) | Sigma-Aldrich | C2654 |
| Hyaluronidase (type 1) | Sigma-Aldrich | H3506 |
| Collagenase P | Sigma-Aldrich | Ref# 11213865001 |
| Collagenase D | Sigma-Aldrich | Ref# 1088866001 |
| Recombinant Fgl2 | R&D Systems | R&D Cat# 5257-FL-050 |
| Critical Commercial Assays | ||
| MACS CD8a+ T cell isolation kit, mouse | Miltenyi Biotec | 130-104-075 |
| Quick-RNA MicroPrep Kit | Zyma Research | R1051 |
| SMART-seq v4 cDNA synthesis kit | Takara | Cat# 634894 |
| NexteraXT kit | Illumina | FC-131–1096 |
| Mouse Fgl2 ELISA | Biolegend | Biolegend Cat# 437807 |
| RNeasy Plus Micro Kit | Qiagen | Qiagen Cat# 74034 |
| High Capacity cDNA reverse transcription kit | ThermoFisher | ThermoFisher Cat# 4368814 |
| HT HG-U133 Plus PM BeadChip | Affymetrix | Thermo Fisher Cat# 901261 |
| Lightning Link R-PE Antibody Labeling kit | Novus Biologicals | Cat # 703–0010 |
| CountBright Beads | Life Technologies | Cat # C36950 |
| Deposited Data | ||
| RNAseq data | NCBI Gene Expression Omnibus (GEO) | GSE118439 |
| Experimental Models: Cell Lines | ||
| B16 Melanoma-OVA | Brown, et al., 2001, provided by Dr. Yang-Xin Fu | |
| Experimental Models: Organisms/Strains | ||
| NCI C57Bl/6Ncr (NCI grantee program) | Charles River | Stock #556 |
| NCI B6-LY5.1/Cr (NCI grantee program) | Charles River | Stock #564 |
| OT-I | Hogquist et al., 1994 | |
| OT-II | Barnden et al., 1998 | |
| mOVA (C57Bl/6 background, H-2b) | Ehst et al., 2013 Dr. Marc Jenkins | |
| B6.129P2-Aicdatm1(cre)Mnz/J (Aicda−/−) | The Jackson Laboratory | Stock #007770 |
| B6;129S-Fcgr2btm1Ttk/J (Fcgr2b−/−) | The Jackson Laboratory | Stock #002848 |
| EM:06078 Fcgr2b Fcgr2bB6null B6(Cg)-Fcgr2btm12Sjv/Cnbc (Fcgr2b−/−) | European Mutant Mouse Archive; Dr. J.S. Verbeek | EM: 06078 |
| Fcgr2b−/− OT-I (bred from EM:06078 and OT-I) | This paper | N/A |
| Oligonucleotides | ||
| Fcgr2b | Thermo Fisher | Hs00269610_m1, cat. # 4448892 |
| Gapdh | Thermo Fisher | Hs02786624_g1, cat. # 4331182 |
| Recombinant DNA | ||
| Software and Algorithms | ||
| TopHat2 | Kim et al., 2013 | |
| UCSC mm9 Known Gene | Hsu et al., 2009 | |
| GenomicRanges (v1.22.4) | R/Bioconductor | |
| edgeR | Robinson et al., 2010 | |
| Cytobank (viSNE) | Amir el et al., 2013 | |
| Bioconductor | Gentleman, et al., 2004 | |
| CellCODE | Chikina, et al., 2015 | |
| Prism v7 | Graphpad Software | |
| FlowJo (v9.9.4, v9.9.6) | Tree Star | |
| Other | ||
Acknowledgements
The authors would like to acknowledge the contributions of the NIAID Clinical Trials in Organ Transplantation Consortium, including CTOT09 investigators Donald E. Hricik (University Hospitals Case Medical Center, Cleveland OH USA), Richard N. Formica (Yale University School of Medicine, New Haven CT USA), Peter Nickerson and David Rush (University of Manitoba, Winnipeg, Manitoba, Canada), Emilio D. Poggio, (Cleveland Clinic, Cleveland OH), Kathryn Tinckam (University of Toronto, Toronto Canada) Suphamai Bunnapradist, Milagros Samaniego-Picota (University of Michigan Medical Center, Ann Arbor MI USA) Daniel C. Brennan (Washington University, St. Louis MO USA) Bernd Schröppel (Icahn School of Medicine at Mount Sinai, NY, NY USA), Osama Gaber (Houston Methodist Hospital, Houston TX and Weil Cornell Medical College, NY, NY USA), Nancy D. Bridges (National Institute of Allergy and Infectious Diseases, National Institutes of Health, Bethesda MD). The arrays on CTOT samples were performed by the late Dr. Dan Salomon, the Scripps Research Institute, La Jolla CA. We also acknowledge Dr. Aaron Rae and the Emory Pediatrics Flow Core, Dr. Jennifer Robertson (Emory University), Ms. Lisa Anderson (Mt. Sinai School of Medicine), and Dr. Marvi Tariq (Emory University) for assistance with flow cytometry, and the NYU Genome Technology Center for Illumina sequencing. The study was funded by NIH awards AI073707 and AI104699 to MLF. The CTOT09 trial was supported by NIH (NIAID) U01 AI63594 awarded to PSH.
References
- Abbas AR, Wolslegel K, Seshasayee D, Modrusan Z, and Clark HF (2009). Deconvolution of blood microarray data identifies cellular activation patterns in systemic lupus erythematosus. PLoS One 4, e6098. [DOI] [PMC free article] [PubMed] [Google Scholar]
- Alfei F, Kanev K, Hofmann M, Wu M, Ghoneim HE, Roelli P, Utzschneider DT, von Hoesslin M, Cullen JG, Fan Y, et al. (2019). TOX reinforces the phenotype and longevity of exhausted T cells in chronic viral infection. Nature 571, 265–269. [DOI] [PubMed] [Google Scholar]
- Altman MC, Gill MA, Whalen E, Babineau DC, Shao B, Liu AH, Jepson B, Gruchalla RS, O’Connor GT, Pongracic JA, et al. (2019). Transcriptome networks identify mechanisms of viral and nonviral asthma exacerbations in children. Nat Immunol 20, 637–651. [DOI] [PMC free article] [PubMed] [Google Scholar]
- Amir el AD, Davis KL, Tadmor MD, Simonds EF, Levine JH, Bendall SC, Shenfeld DK, Krishnaswamy S, Nolan GP, and Pe’er D (2013). viSNE enables visualization of high dimensional single-cell data and reveals phenotypic heterogeneity of leukemia. Nat Biotechnol 31, 545–552. [DOI] [PMC free article] [PubMed] [Google Scholar]
- Anderson CL, and Grey HM (1974). Receptors for aggregated IgG on mouse lymphocytes: their presence on thymocytes, thymus-derived, and bone marrow-derived lymphocytes. J Exp Med 139, 1175–1188. [DOI] [PMC free article] [PubMed] [Google Scholar]
- Barnden MJ, Allison J, Heath WR, and Carbone FR (1998). Defective TCR expression in transgenic mice constructed using cDNA-based alpha- and beta-chain genes under the control of heterologous regulatory elements. Immunol Cell Biol 76, 34–40. [DOI] [PubMed] [Google Scholar]
- Bolland S, Pearse RN, Kurosaki T, and Ravetch JV (1998). SHIP modulates immune receptor responses by regulating membrane association of Btk. Immunity 8, 509–516. [DOI] [PubMed] [Google Scholar]
- Boross P, Arandhara VL, Martin-Ramirez J, Santiago-Raber ML, Carlucci F, Flierman R, van der Kaa J, Breukel C, Claassens JW, Camps M, et al. (2011). The inhibiting Fc receptor for IgG, FcgammaRIIB, is a modifier of autoimmune susceptibility. J Immunol 187, 1304–1313. [DOI] [PubMed] [Google Scholar]
- Brown DM, Fisher TL, Wei C, Frelinger JG, and Lord EM (2001). Tumours can act as adjuvants for humoral immunity. Immunology 102, 486–497. [DOI] [PMC free article] [PubMed] [Google Scholar]
- Chikina M, Zaslavsky E, and Sealfon SC (2015). CellCODE: a robust latent variable approach to differential expression analysis for heterogeneous cell populations. Bioinformatics 31, 1584–1591. [DOI] [PMC free article] [PubMed] [Google Scholar]
- Ehst BD, Ingulli E, and Jenkins MK (2003). Development of a novel transgenic mouse for the study of interactions between CD4 and CD8 T cells during graft rejection. Am J Transplant 3, 1355–1362. [DOI] [PubMed] [Google Scholar]
- Foerster K, Helmy A, Zhu Y, Khattar R, Adeyi OA, Wong KM, Shalev I, Clark DA, Wong PY, Heathcote EJ, et al. (2010). The novel immunoregulatory molecule FGL2: a potential biomarker for severity of chronic hepatitis C virus infection. J Hepatol 53, 608–615. [DOI] [PubMed] [Google Scholar]
- Gentleman RC, Carey VJ, Bates DM, Bolstad B, Dettling M, Dudoit S, Ellis B, Gautier L, Ge Y, Gentry J, et al. (2004). Bioconductor: open software development for computational biology and bioinformatics. Genome Biol 5, R80. [DOI] [PMC free article] [PubMed] [Google Scholar]
- Hartmann BM, Albrecht RA, Zaslavsky E, Nudelman G, Pincas H, Marjanovic N, Schotsaert M, Martinez-Romero C, Fenutria R, Ingram JP, et al. (2017). Pandemic H1N1 influenza A viruses suppress immunogenic RIPK3-driven dendritic cell death. Nat Commun 8, 1931. [DOI] [PMC free article] [PubMed] [Google Scholar]
- Hogquist KA, Jameson SC, Heath WR, Howard JL, Bevan MJ, and Carbone FR (1994). T cell receptor antagonist peptides induce positive selection. Cell 76, 17–27. [DOI] [PubMed] [Google Scholar]
- Hricik DE, Formica RN, Nickerson P, Rush D, Fairchild RL, Poggio ED, Gibson IW, Wiebe C, Tinckam K, Bunnapradist S, et al. (2015). Adverse Outcomes of Tacrolimus Withdrawal in Immune-Quiescent Kidney Transplant Recipients. J Am Soc Nephrol 26, 3114–3122. [DOI] [PMC free article] [PubMed] [Google Scholar]
- Hsu F, Kent WJ, Clawson H, Kuhn RM, Diekhans M, and Haussler D (2006). The UCSC Known Genes. Bioinformatics 22, 1036–1046. [DOI] [PubMed] [Google Scholar]
- Joller N, Lozano E, Burkett PR, Patel B, Xiao S, Zhu C, Xia J, Tan TG, Sefik E, Yajnik V, et al. (2014). Treg cells expressing the coinhibitory molecule TIGIT selectively inhibit proinflammatory Th1 and Th17 cell responses. Immunity 40, 569–581. [DOI] [PMC free article] [PubMed] [Google Scholar]
- Kaech SM, and Cui W (2012). Transcriptional control of effector and memory CD8+ T cell differentiation. Nat Rev Immunol 12, 749–761. [DOI] [PMC free article] [PubMed] [Google Scholar]
- Kim D, Pertea G, Trapnell C, Pimentel H, Kelley R, and Salzberg SL (2013). TopHat2: accurate alignment of transcriptomes in the presence of insertions, deletions and gene fusions. Genome Biol 14, R36. [DOI] [PMC free article] [PubMed] [Google Scholar]
- Latha K, Yan J, Yang Y, Gressot LV, Kong LY, Manyam G, Ezhilarasan R, Wang Q, Sulman EP, Eric Davis R, et al. (2019). The Role of Fibrinogen-Like Protein 2 on Immunosuppression and Malignant Progression in Glioma. J Natl Cancer Inst 111, 292–300. [DOI] [PMC free article] [PubMed] [Google Scholar]
- Lee HJ, Georgiadou A, Walther M, Nwakanma D, Stewart LB, Levin M, Otto TD, Conway DJ, Coin LJ, and Cunnington AJ (2018). Integrated pathogen load and dual transcriptome analysis of systemic host-pathogen interactions in severe malaria. Sci Transl Med 10. [DOI] [PMC free article] [PubMed] [Google Scholar]
- Li F, Smith P, and Ravetch JV (2014). Inhibitory Fcgamma receptor is required for the maintenance of tolerance through distinct mechanisms. J Immunol 192, 3021–3028. [DOI] [PMC free article] [PubMed] [Google Scholar]
- Liu C, Chikina M, Deshpande R, Menk AV, Wang T, Tabib T, Brunazzi EA, Vignali KM, Sun M, Stolz DB, et al. (2019). Treg Cells Promote the SREBP1-Dependent Metabolic Fitness of Tumor-Promoting Macrophages via Repression of CD8(+) T Cell-Derived Interferon-gamma. Immunity 51, 381–397 e386. [DOI] [PMC free article] [PubMed] [Google Scholar]
- Liu H, Shalev I, Manuel J, He W, Leung E, Crookshank J, Liu MF, Diao J, Cattral M, Clark DA, et al. (2008). The FGL2-FcgammaRIIB pathway: a novel mechanism leading to immunosuppression. Eur J Immunol 38, 3114–3126. [DOI] [PubMed] [Google Scholar]
- Marsden PA, Ning Q, Fung LS, Luo X, Chen Y, Mendicino M, Ghanekar A, Scott JA, Miller T, Chan CW, et al. (2003). The Fgl2/fibroleukin prothrombinase contributes to immunologically mediated thrombosis in experimental and human viral hepatitis. J Clin Invest 112, 58–66. [DOI] [PMC free article] [PubMed] [Google Scholar]
- Muramatsu M, Kinoshita K, Fagarasan S, Yamada S, Shinkai Y, and Honjo T (2000). Class switch recombination and hypermutation require activation-induced cytidine deaminase (AID), a potential RNA editing enzyme. Cell 102, 553–563. [DOI] [PubMed] [Google Scholar]
- Nimmerjahn F, and Ravetch JV (2008). Fcgamma receptors as regulators of immune responses. Nat Rev Immunol 8, 34–47. [DOI] [PubMed] [Google Scholar]
- Ono M, Bolland S, Tempst P, and Ravetch JV (1996). Role of the inositol phosphatase SHIP in negative regulation of the immune system by the receptor Fc(gamma)RIIB. Nature 383, 263–266. [DOI] [PubMed] [Google Scholar]
- Pearse R, Kawabe T, Boiland S, Guinamard R, Kurosaki T, and Ravetch J (1999). SHIP recruitment attentuates FcgRIIB- induced B cell apoptosis. Immunity 10, 753–760. [DOI] [PubMed] [Google Scholar]
- Ravetch JV, Luster AD, Weinshank R, Kochan J, Pavlovec A, Portnoy DA, Hulmes J, Pan YC, and Unkeless JC (1986). Structural heterogeneity and functional domains of murine immunoglobulin G Fc receptors. Science 234, 718–725. [DOI] [PubMed] [Google Scholar]
- Robbiani DF, Bothmer A, Callen E, Reina-San-Martin B, Dorsett Y, Difilippantonio S, Bolland DJ, Chen HT, Corcoran AE, Nussenzweig A, and Nussenzweig MC (2008). AID is required for the chromosomal breaks in c-myc that lead to c-myc/IgH translocations. Cell 135, 1028–1038. [DOI] [PMC free article] [PubMed] [Google Scholar]
- Robinson MD, McCarthy DJ, and Smyth GK (2010). edgeR: a Bioconductor package for differential expression analysis of digital gene expression data. Bioinformatics 26, 139–140. [DOI] [PMC free article] [PubMed] [Google Scholar]
- Smith KG, and Clatworthy MR (2010). FcgammaRIIB in autoimmunity and infection: evolutionary and therapeutic implications. Nat Rev Immunol 10, 328–343. [DOI] [PMC free article] [PubMed] [Google Scholar]
- Starbeck-Miller GR, Badovinac VP, Barber DL, and Harty JT (2014). Cutting edge: Expression of FcgammaRIIB tempers memory CD8 T cell function in vivo. J Immunol 192, 35–39. [DOI] [PMC free article] [PubMed] [Google Scholar]
- Stout RD, and Herzenberg LA (1975). The Fc receptor on thymus-derived lymphocytes. I. Detection of a subpopulation of murine T lymphocytes bearing the Fc receptor. J Exp Med 142, 611–621. [DOI] [PMC free article] [PubMed] [Google Scholar]
- Takai T, Ono M, Hikida M, Ohmori H, and Ravetch JV (1996). Augmented humoral and anaphylactic responses in Fc gamma RII-deficient mice. Nature 379, 346–349. [DOI] [PubMed] [Google Scholar]
- Tang M, Cao X, Li P, Zhang K, Li Y, Zheng QY, Li GQ, Chen J, Xu GL, and Zhang KQ (2017). Increased expression of Fibrinogen-Like Protein 2 is associated with poor prognosis in patients with clear cell renal cell carcinoma. Sci Rep 7, 12676. [DOI] [PMC free article] [PubMed] [Google Scholar]
- Trambley J, Bingaman AW, Lin A, Elwood ET, Waitze SY, Ha J, Durham MM, Corbascio M, Cowan SR, Pearson TC, and Larsen CP (1999). Asialo GM1(+) CD8(+) T cells play a critical role in costimulation blockade-resistant allograft rejection. J Clin Invest 104, 1715–1722. [DOI] [PMC free article] [PubMed] [Google Scholar]
- Williams EL, Tutt AL, French RR, Chan HT, Lau B, Penfold CA, Mockridge CI, Roghanian A, Cox KL, Verbeek JS, et al. (2012). Development and characterisation of monoclonal antibodies specific for the murine inhibitory FcgammaRIIB (CD32B). Eur J Immunol 42, 2109–2120. [DOI] [PubMed] [Google Scholar]
- Wirth TC, Xue HH, Rai D, Sabel JT, Bair T, Harty JT, and Badovinac VP (2010). Repetitive antigen stimulation induces stepwise transcriptome diversification but preserves a core signature of memory CD8(+) T cell differentiation. Immunity 33, 128–140. [DOI] [PMC free article] [PubMed] [Google Scholar]
- Yan J, Kong LY, Hu J, Gabrusiewicz K, Dibra D, Xia X, Heimberger AB, and Li S (2015). FGL2 as a Multimodality Regulator of Tumor-Mediated Immune Suppression and Therapeutic Target in Gliomas. J Natl Cancer Inst 107. [DOI] [PMC free article] [PubMed] [Google Scholar]
- Yan J, Zhao Q, Gabrusiewicz K, Kong LY, Xia X, Wang J, Ott M, Xu J, Davis RE, Huo L, et al. (2019). FGL2 promotes tumor progression in the CNS by suppressing CD103(+) dendritic cell differentiation. Nat Commun 10, 448. [DOI] [PMC free article] [PubMed] [Google Scholar]
- Yoshida TO, and Andersson B (1972). Evidence for a receptor recognizing antigen complexed immunoglobulin on the surface of activated mouse thymus lymphocytes. Scand J Immunol 1, 401–408. [DOI] [PubMed] [Google Scholar]
- Zhu Y, Zhang L, Zha H, Yang F, Hu C, Chen L, Guo B, and Zhu B (2017). Stroma-derived Fibrinogen-like Protein 2 Activates Cancer-associated Fibroblasts to Promote Tumor Growth in Lung Cancer. Int J Biol Sci 13, 804–814. [DOI] [PMC free article] [PubMed] [Google Scholar]
Associated Data
This section collects any data citations, data availability statements, or supplementary materials included in this article.
Supplementary Materials
Figure S3, refers to Figure 3: Negative selection CD8+ MACS enrichment kits lead to the selective depletion of FcγRIIB-expressing CD8+ T cells. 106 OT-I and OT-II were harvested from the spleen and mesenteric lymph nodes and adoptively transferred into naïve hosts 24 hours prior to skin transplantation with OVA-expressing skin. On day 14 post grafting, splenocytes were either ficolled or enriched for CD8+ T cells using the MACS negative selection CD8+ isolation kit.
A: Representative flow plots of FcγRIIB+ cells of CD44hiThy1.1+ CD8+ T cells following ficoll or CD8+ MACS enrichment, either in the enriched subset or eluent.
B: The frequency of FcγRIIB+ cells of CD44hiThy1.1+ CD8+ T cells following ficoll or CD8+ MACS enrichment, either in the enriched subset or eluent. Summary data ±SEM is shown. One-way ANOVA, **p<0.01, ****p<0.0001.
Figure S1, refers to Figure 1: FcγRIIB detection on CD8+ T cells using a FcγRIIB-specific clone, AT130–2. Splenocytes from WT mice aged 6 months or older were probed for B and T cell expression of FcγRIIB through staining with the monoclonal antibody anti-CD32b (clone AT130–2)
A: Representative flow cytometric plots of the expression of FcγRIIB on splenic B cells, CD8+ T cells, and CD4+ T cells via staining with AT130–2 and an isotype control.
Figure S4, refers to Figure 4: Blockade of FcγRIIB, but not CD8+ T cell specific FcγRIIB deficiency, results in increased CD4+ T cell responses. A: Schematic of experimental design: 106 OT-I and OT-II were harvested from spleen and mesenteric lymph node and adoptively transferred 24 hours prior to skin grafting with OVA-expressing skin. Animals were treated with 250ug of the monoclonal antibody anti-FcγRIIB (clone AT-128) on days 6, 8, and 10 post grafting, and splenocytes were analyzed by flow cytometry at day 14.
B: Representative flow cytometric plots of CD44hiThy1.1+ OT-II T cells of CD4+ T cells in untreated and treated mice. Representative data from two independent experiments, n=4–5 mice per group.
C: The frequency and absolute cell number of CD44hiThy1.1+ OT-II T cells of CD4+ T cells in untreated and treated mice. Summary data ±SEM is shown. Pooled data from two independent experiments, n=4–5 mice per group. Mann-Whitney test, *p<0.05.
D: Schematic of experimental design: 106 WT Thy1.1+ OT-I T cells or 106 Fcgr2b−/− Thy1.1+ OT-I T cells, and 106 Thy1.1+ OT-II T cells were harvested from spleen and mesenteric lymph nodes and adoptively transferred into congenically marked naïve mice 24 hours prior to inoculation with a B16-melanoma-expressing OVA. Splenocytes were assessed by flow cytometry on day 10 post tumor inoculation.
E: Representative flow plots of CD44hi Thy1.1+ OT-II T cells of CD4+ T cells in animals that received either WT or Fcgr2b−/− OT-I T cells. Representative data from 2 independent experiments, n=4 mice per group.
F: The frequency and absolute number of CD44hi Thy1.1+ OT-II T cells of CD4+ T cells in animals that received either WT or Fcgr2b−/− OT-I T cells. Summary data ±SEM is shown. Pooled data from 2 independent experiments, n=4 mice per group. Mann-Whitney test, ns=not significant.
Figure S2, refers to Figure 2 and 5: Lack of FcγRIIB leads to decreased frequency of Tcm cells, and expression of FcγRIIB is elevated in tumor- and allograft-infiltrating CD8+ T cells. (A-C) 5×10⁵ WT Thy1.1+ OT-I T cells, 5×10⁵ Fcgr2b−/− CD45.2+ OT-I T cells, and 106 Thy1.1+ OT-II T cells were harvested from the spleen and mesenteric lymph node and adoptively transferred into congenically marked (CD45.1+, Thy1.2+) naïve mice 24 hours prior to skin transplantation with OVA-expressing skin. Mice were sacrificed at indicated timepoints and splenocytes were analyzed by flow cytometry.
A: The frequency of naïve CD44loCD62L+ WT or Fcgr2b−/− OT-I T cells on days 4, 7, 10, 14, and 21 post grafting. Summary data ±SEM are shown. Pooled data from two independent experiments, n=5 mice per group.
B: The frequency of CD44hiCD62L+ (Tcm) cells WT or Fcgr2b−/− OT-I T cells on days 4, 7, 10, 14, and 21 post grafting. Summary data ±SEM are shown. Pooled data from two independent experiments, n=5 mice per group. Two-way ANOVA, **p<0.01.
C: The absolute cell number of CD44hiCD62L+ (Tcm) cells WT or Fcgr2b−/− OT-I T cells on days 14 and 21 post grafting. Summary data are shown. Pooled data from two independent experiments, n=5 mice per group. Wilcoxon test, **p<0.01.
(D-G) 106 WT Thy1.1+ OT-I T cells or 106 Fcgr2b−/− CD45.2+ OT-I T cells, and 106 Thy1.1+ OT-II T cells were harvested from the spleen and mesenteric lymph nodes and adoptively transferred into congenically marked naïve mice 24 hours prior to inoculation with a B16-melanoma-expressing OVA cell line. Mice were sacrificed at indicated timepoints post tumor inoculation and indicated tissues were assessed by flow cytometry.
D: Representative flow cytometric plots of the expression of FcγRIIB in WT OT-I T cells in the lymph node, spleen, and tumor on days 10 and 14 following tumor inoculation. Pooled data from two independent experiments, n=3–5 mice per group.
E: The frequency of FcγRIIB-expressing WT OT-I T cells on days 10 and 14 in the lymph node, spleen, and tumor following tumor inoculation. Summary data ±SEM are shown. Pooled data from two independent experiments, n=3–5 mice per group.
F. The frequency of FcγRIIB-expressing naïve (CD62L+CD44lo), Tcm cells (CD62L+CD44hi), and Tem cells (CD62L−CD44hi) WT OT-I T cells on day 14 in the lymph node, spleen, and tumor. Summary data ±SEM are shown. Pooled data from two independent experiments, n=3–5 mice per group.
G: Representative photographs of tumor volume on day 10 post-tumor inoculation from mice that received either WT or Fcgr2b−/− OT-I T cells. Representative data from two independent experiments, n=3–5 mice per group.
H: Representative flow cytometric plots and summary data of the expression of FcγRIIB on cells infiltrating BALB/c skin grafts on C57BL/6 recipients on day 14 post-transplant. Summary data ±SEM are shown, n=4 mice.
I: Plasma was analyzed via ELISA for Fgl2 on day 3 and 21 post-transplant of C57BL/6 recipients with BALB/c skin grafts. Summary data ±SEM are shown, n=3–4 mice per group. Mann-Whitney test, p=0.0571.
Data Availability Statement
RNAseq data generated in the study have been deposited to NCBI Gene Expression Omnibus (GEO) under accession GSE118439.