Abstract
Purpose
Vigabatrin (VGB) is an effective antiepileptic that increases concentrations of inhibitory γ-aminobutyric acid (GABA) by inhibiting GABA transaminase. Reports of VGB-associated visual field loss limit its clinical usefulness, and retinal toxicity studies in laboratory animals have yielded conflicting results.
Methods
We examined the functional and morphologic effects of VGB in C57BL/6J mice that received either VGB or saline IP from 10 to 18 weeks of age. Retinal structure and function were assessed in vivo by optical coherence tomography (OCT), ERG, and optomotor response. After euthanasia, retinas were processed for immunohistochemistry, and retinal GABA, and VGB quantified by mass spectrometry.
Results
No significant differences in visual acuity or total retinal thickness were identified between groups by optomotor response or optical coherence tomography, respectively. After 4 weeks of VGB treatment, ERG b-wave amplitude was enhanced, and amplitudes of oscillatory potentials were reduced. Dramatic rod and cone bipolar and horizontal cell remodeling, with extension of dendrites into the outer nuclear layer, was observed in retinas of VGB-treated mice. VGB treatment resulted in a mean 3.3-fold increase in retinal GABA concentration relative to controls and retinal VGB concentrations that were 20-fold greater than brain.
Conclusions
No evidence of significant retinal thinning or ERG a- or b-wave deficits were apparent, although we describe significant alterations in ERG b-wave and oscillatory potentials and in retinal cell morphology in VGB-treated C57BL/6J mice. The dramatic concentration of VGB in retina relative to the target tissue (brain), with a corresponding increase in retinal GABA, offers insight into the pathophysiology of VGB-associated visual field loss.
Keywords: vigabatrin, mouse, GABA
The antiepileptic drug, vigabatrin (VGB; γ-vinyl-γ-aminobutyric acid [GABA]) is indicated as first-line, monotherapy treatment for infantile spasms and as adjuvant therapy for refractory complex partial seizures; it is also used as empirical treatment of a rare metabolic disorder, succinic semialdehyde dehydrogenase deficiency.1,2 VGB is a selective, irreversible inhibitor of GABA transaminase and increases intracellular concentrations of GABA, a major neurotransmitter in inhibitory pathways of the central nervous system.3 VGB is rapid-acting and highly effective in controlling epilepsy, with complete cessation of seizures reported in 35% to 75% of infantile spasm cases across multiple studies.2 However, visual field loss has been recognized as an adverse effect of VGB administration that limits the prescription and duration of use of VGB, with the risk of visual field loss increasing from 9% after less than 1 year of treatment to 63% with treatment of more than 2 years in duration.4 In a review of 1678 patients receiving VGB, the random effects estimate of VGB-associated visual field loss (VAVFL) was 34% in children and 52% in adults.5 The frequency and severity of VAVFL as an adverse effect has limited the prescription of VGB to only those seizure disorders where the benefits outweigh the risks and, even then, for a minimal length of time.6
Changes associated with and used as markers for VAVFL in infants and other patients where the visual field cannot be directly assessed, include attenuation of 30 Hz flicker ERG responses, decreased scotopic and photopic b-wave amplitude, and a marked increase in d-wave latency.7–11 However, there have been conflicting reports of which of these markers are significantly associated with VAVFL in the clinical setting.10 Similarly, with VGB administration in laboratory models, reports of VGB's effects in the retina have been inconsistent. Both enhancement and attenuation of the photopic b-wave amplitude have been reported along with significantly increased, decreased, and insignificantly altered scotopic b-wave amplitudes.12–16 However, there is a paucity of detailed reports on morphologic retinal changes and of VGB and GABA retinal concentrations in pigmented mouse models.
In ongoing efforts to elucidate and mitigate the toxic effects of VGB on the retina, administering VGB to mice and monitoring alterations in retinal structure and function in vivo, we were unable to replicate a previously described model of VGB-associated retinal toxicity in pigmented mice.16 We report striking findings, including marked second-order neuron remodeling, enhancement of scotopic b-wave amplitude with attenuation of later oscillatory potential (OP) wavelets and significant concentration of VGB and GABA in the retina of the VGB-treated pigmented mouse. These findings provide insight into potential causes of VAVFL and suggest specific avenues for future exploration to reduce the frequency and severity of VAVFL in humans.
Methods
Animals
Ten-week-old male C57BL/6J (n = 18 per group) were purchased from Jackson Laboratories (Bar Harbor, ME) and housed under relatively bright light intensity conditions (approximately 120 lux; 12-hour light/dark cycle). Mice were maintained on Teklad 8604 rodent diet (Envigo, Madison, WI). All procedures were approved by the University of Wisconsin–Madison Institutional Animal Care and Use Committee and performed in accordance with the ARVO Statement for the Use of Animals in Ophthalmic and Vision Research.
VGB Treatment
Mice were randomized to receive either VGB 140 mg/kg/d intraperitoneally or vehicle only (0.9% NaCl) at the same volume, duration, and route, as above for 4 weeks (n = 6 per treatment group) or 8 weeks (n = 12 per treatment group). The mice were injected 5 days per week with 2 consecutive days without injection. On the last day of the 5 consecutive days of intraperitoneal injection, a 280-mg/kg dose was delivered. This VGB dose of 140 mg/kg/d was based on human clinical doses.2 VGB was synthesized as described in Walters et al., 201917 for the first cohort of 12 C57BL/6J mice (n = 6 per treatment group) and purchased from Sigma-Aldrich (St. Louis, MO) for the second and third cohorts of mice (n = 12 per treatment group).
ERG was performed between 5 AM and 1 PM on Tuesday and Wednesday of each week of testing, with alternation between treatment groups, in mice anesthetized with ketamine (100 mg/kg, Akorn, Lake Forest, IL) and xylazine (10 mg/kg, Akorn) and pupils dilated with 0.5% tropicamide (Akorn). Silver thread electrodes (OcuScience, Henderson, NV) attached to 2.5-mm contact lenses were placed on the corneas with 2.5% methylcellulose gel (Akorn), and subdermal reference and ground needle electrodes were placed on the nose between the eyes, and at the base of the tail, respectively, under dim red light. The red light was extinguished for at least 2 minutes before obtaining recordings. Body temperature was maintained around 37°C with a heating pad. An Espion e2 system with a ColorDome Ganzfield stimulator (Diagnosys LLC, Lowell, MA) was used to elicit and record full-field flash and flicker ERG responses under both scotopic (after a >10-hour overnight dark adaptation) and subsequently photopic conditions (after 10 minutes of 30 cd/m2 light adaptation) with corresponding waveforms acquired from both eyes. Scotopic flash intensity ranged in 8 steps from 0.001 to 10.000 cd*s/m2 with a 2- to 5-second interstimulus interval. Photopic flash intensity ranged in six steps from 0.78 to 20.00 cd*s/m2 with a 2- to 10-second interstimulus interval in the presence of a 6 cd/m2 rod-suppressing background. Flicker responses were obtained at 8 Hz and 16 Hz at the maximum intensity for photopic and scotopic conditions, respectively. The c-wave was measured in response to 2.5 and 25 cd*s/m2 stimuli immediately before light adaptation. The a-wave was measured from baseline to the trough of the first corneal negative deflection. The b-wave was measured from the trough of the a-wave to the peak of the succeeding corneal positive deflection, with care taken to avoid selecting OPs. The a-, b-, and c-wave amplitudes and implicit times were measured with Espion V6 software (Diagnosys LLC). The OP root mean square, amplitude, and implicit time of individual wavelets and c-wave amplitude were measured with an in-house R script after a bandpass filter was applied from 100 to 300Hz by the Espion V6 software. The OP root mean square was calculated from 10 to 60 milliseconds after the stimulus; OP1 was measured from baseline to the first positive peak; each successive OP (OP2–OP4) was measured from the preceding negative deflection to the immediately following positive peak. Analysis of the ERG data was performed with open-source software R (version 3.5.2; The R Foundation, Vienna, Austria) for summary statistics of the a- and b-wave and OPs. Naka-Rushton functions were fitted to b-wave data with an in-house R script following the equations described by Naka and Rushton,.18,19
Optomotor Response (OMR) Testing
The qOMR system (Phenosys GmbH, Berlin, Germany) was used to determine the visual acuity threshold (maximum spatial frequency at which an OMR is elicited to a consistent, high-contrast grating) in awake, unrestrained mice. Sinusoidal gratings ranging from 0.05 to 0.50 cycles per degree and at maximal contrast20 were displayed in a randomized order for 1 minute with a solid gray pattern displayed for 10 seconds in between gratings. Data were averaged from six sessions per time point for each subject, using integrated software for detection of head tracking movements and projection of a virtual cylinder of revolving gratings of different spatial frequencies. Mice were tested for no more than 30 minutes at one time with at least 2 hours between testing sessions. The visual acuity threshold was determined by fitting a sigmoid curve as described by Frund et al., where the curve reaches 25% of the maximum response.20–22
Optical coherence tomography (OCT) was performed in ketamine/xylazine anesthetized mice using Spectralis HRA+OCT (Heidelberg Engineering Inc., Heidelberg, Germany). Pupils were dilated with 0.5% tropicamide, and corneal desiccation prevented by the application of a corneal contact lens. OCT volume scans (20 × 20 degrees, 120 µm width) were obtained centered on the optic nerve head and in consistent locations and orientation between testing sessions by use of proprietary tracking software. Total retinal thicknesses were calculated by the manufacturer's proprietary Eye Explorer algorithm, with manual correction of segmentation as needed, and averaged for each region.23
Immunohistochemistry
After euthanasia by cervical dislocation, freshly enucleated eyecups were placed in artificial cerebrospinal fluid (pH 7.4, containing in millimole: 119 NaCl, 2.5 KCl, 2.5 CaCl2, 1.3 MgCl2, 1 NaH2PO4, 11 glucose, and 20 HEPES) with the retinas dissected within 30 minutes and fixed for 30 minutes at room temperature in 4% (w/v) paraformaldehyde prepared in artificial cerebrospinal fluid. Thereafter the retinas were rinsed in 1× PBS (pH 7.4) and embedded in 4% agarose for vibratome sectioning (120 µm thickness). Retina slices were incubated with primary antibodies in PBS containing 0.5% Triton X-100 and 5% normal donkey serum overnight at 4°C. The primary antibodies used were directed against protein kinase C alpha (1:1000; Sigma, St. Louis, MO), glutamic acid decarboxylase 67 (1:1000; Millipore, Burlington, MA), glycine transporter 1 (1:1000; Synaptic Systems, Goettingen, Germany), Ribeye (1:1000, Synaptic Systems), synaptotagmin 2 (1:1000; Zebrafish International Resource Center, Eugene, OR), glial fibrillary acidic protein (1:1000; Novus Biologicals, Centennial, CO, and Invitrogen, Carlsbad, CA), cellular retinaldehyde-binding protein (1:500; Abcam, Cambridge, UK), and calbindin (1:500; Swant, Marly, Switzerland). After rinses in PBS, the samples were routinely labeled with appropriate Alexa Fluor-conjugated secondary antibodies (1:1000) for 3 hours at room temperature. Fluorescein-conjugated peanut agglutinin (1:200; Vector Laboratories, Burlingame, CA) was included within the secondary antibody incubation step. Sections were then rinsed, mounted on glass slides with Vectashield (Vector Laboratories) and imaged with a Leica TCS SP8 confocal microscope (Leica Microsystems, Wetzlar, Germany). Images were acquired with a 20× (Numerical Aperture (NA) = 0.75) or 60× (NA = 1.4) objective at a resolution of 0.1 µm × 0.1 µm × 0.3 µm. Cell numbers were quantified by manual counting in FIJI.24
Mass Spectrometry
The brain, liver, and retina were rapidly dissected within 5 minutes after cervical dislocation and flash frozen in liquid nitrogen. The tissues were stored at –80°C and shipped on dry ice for extraction and quantification of VGB and GABA concentrations in tissue samples, performed as described by Walters et al..17
Statistical Analyses
Statistical comparisons were performed with Prism 8 (GraphPad, San Diego, CA, USA) by t-tests with Holm-Sidak correction for multiple comparisons, and mixed-effects models with Tukey post hoc tests. Results were considered significant at a P value of less than .05.
Results
For all ERG, OCT, and OMR results presented, from baseline to 4-week timepoints: VGB-treated n = 18, control n = 17; at 6 week timepoint: VGB-treated n = 12, control n = 11; and at 8 weeks: VGB-treated n = 10, control n = 11. The control group is smaller than the VGB-treated group because initial ERG indicated no response to light in a single mouse assigned to that group. Six mice per group were euthanized at the 4-week timepoint for histology. A further two mice were lost from the VGB group when they died between weeks 6 and 8 of the study (the cause of death was not established in either mouse).
ERG
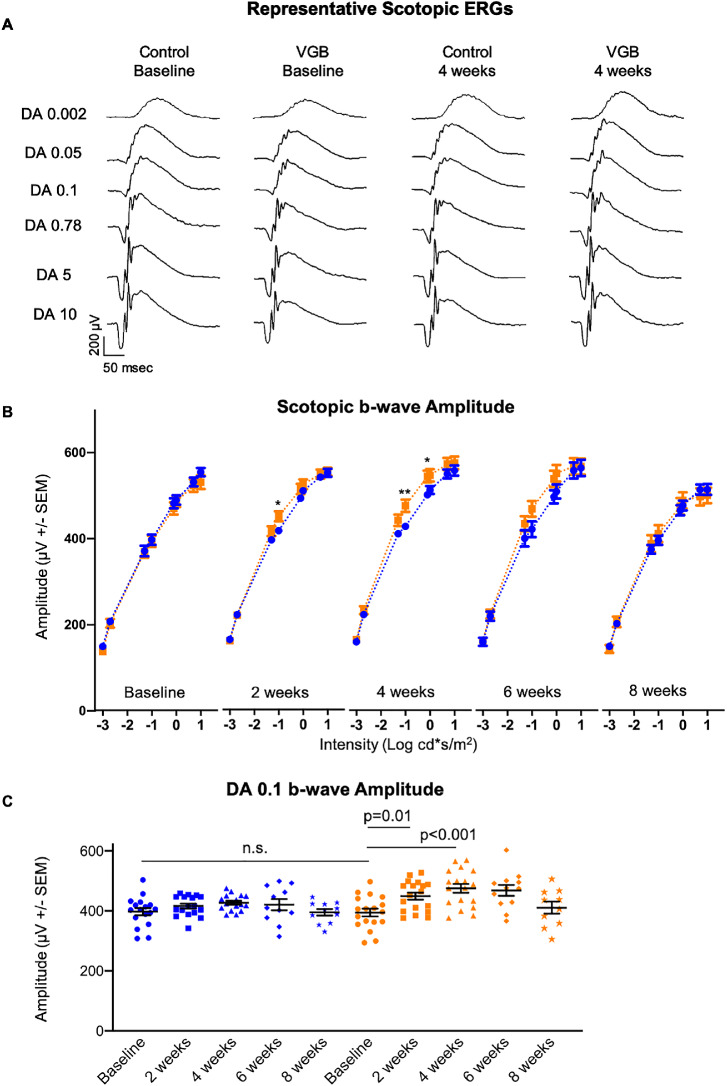
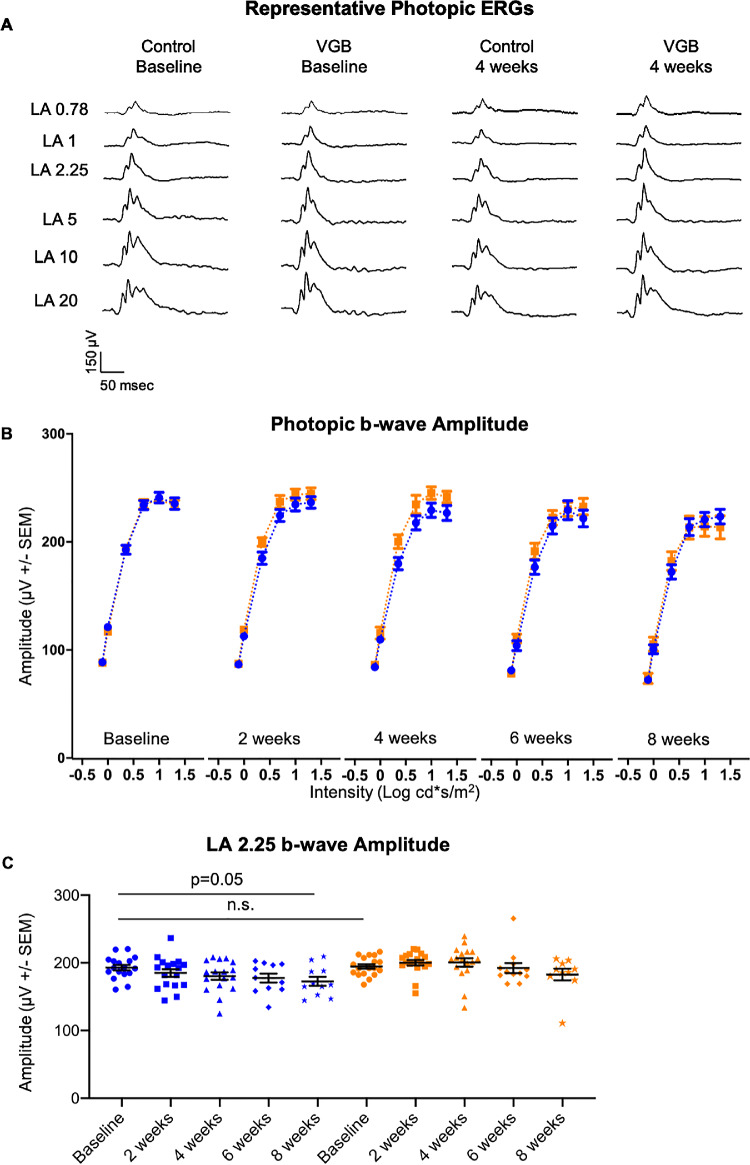
Statistically significant enhancement of the scotopic b-wave amplitude in response to mesopic light stimuli was identified in VGB-treated mice between 2 and 4 weeks of VGB treatment, relative to vehicle-treated mice at the same time points (Fig. 1). The photopic b-wave amplitude tended to be higher in VGB-treated mice than control between 2 and 4 weeks as well, but differences were not statistically significant (Fig. 2). Although the photopic and scotopic b-wave amplitudes were lower than baseline values after 8 weeks of treatment in the vehicle-treated group, this age-related decrease was expected.25
Figure 1.
The scotopic b-wave (A) amplitude of VGB-treated mice (orange) is significantly enhanced between 2 and 4 weeks of VGB treatment compared with controls (blue) at those timepoints (B) as well as baseline values (C). DA, dark adapted. *P < .05; **P < .01.
Figure 2.
The photopic b-wave (A) amplitude of VGB-treated mice (orange) is qualitatively increased between 2 and 4 weeks of VGB treatment compared with controls (blue) at those timepoints (B) as well as baseline values (C). LA, light adapted.
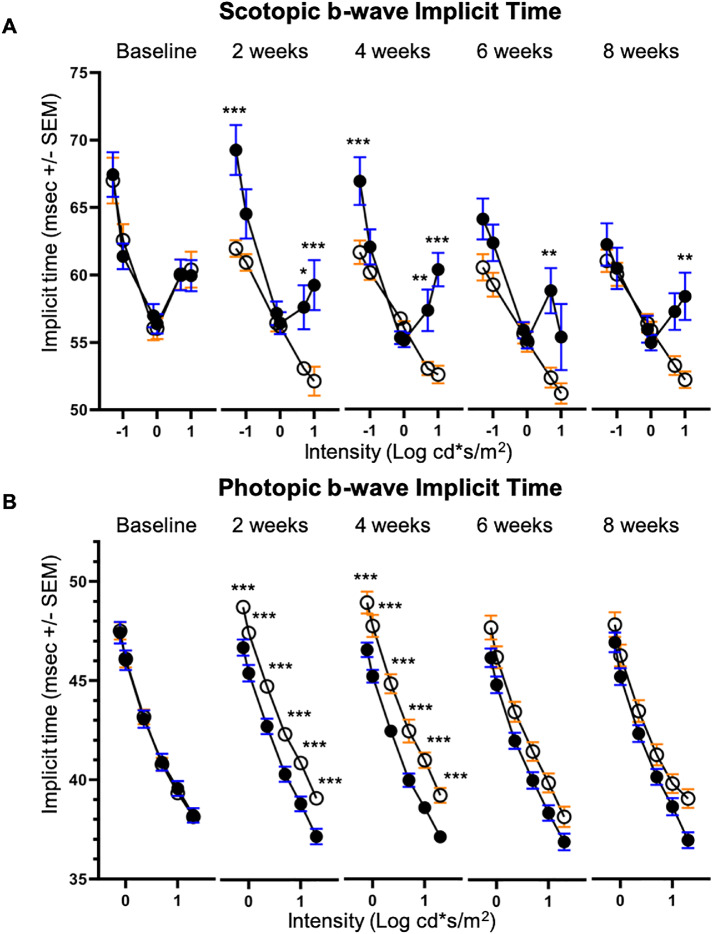
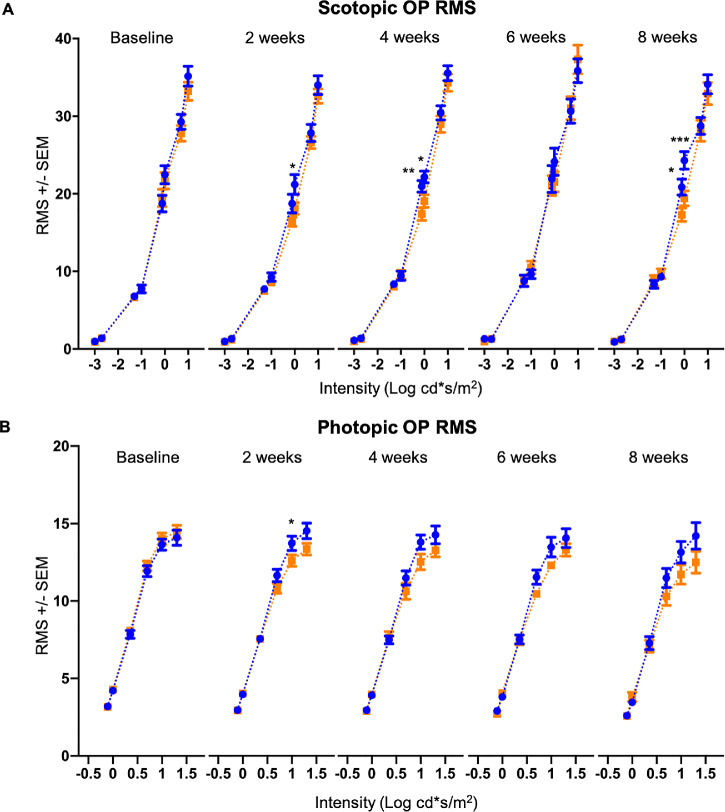
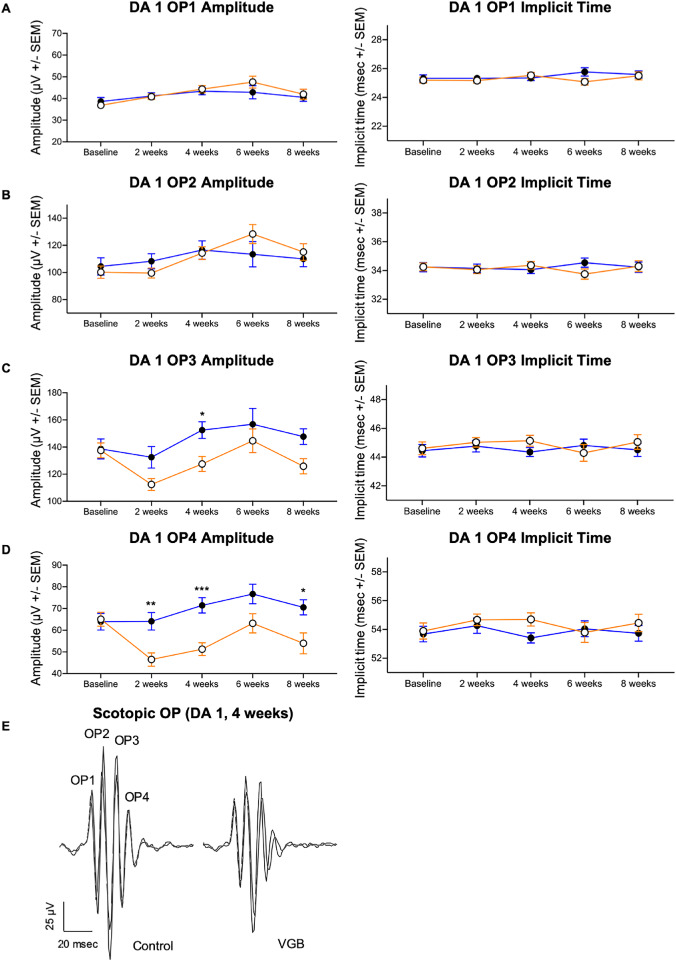
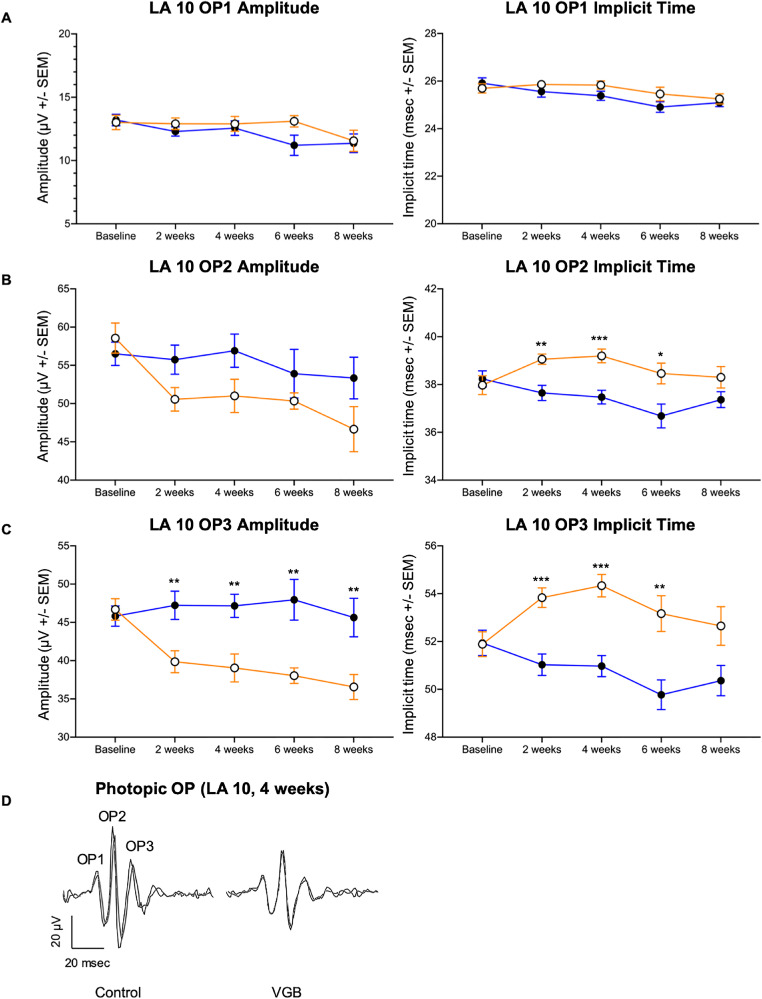
Implicit times of the scotopic b-wave were shorter in VGB-treated mice compared with age-matched vehicle-treated controls in response to 0.05, 5.00 and 10.00 cd*s/m2 stimuli between 2 and 8 weeks of treatment (Fig. 3.). In contrast, implicit times of the photopic b-wave were prolonged in response to all tested stimuli in mice treated with VGB for between 2 and 4 weeks, relative to age-matched vehicle-treated controls (Fig. 3). Root mean square values of scotopic (Fig. 4) and photopic (Fig. 4) OPs were significantly lower in VGB-treated mice compared with controls between 2 and 8 weeks of VGB treatment. Specifically, there was a significant reduction in the scotopic OP3 and OP4 waveform components with 1 cd*s/m2 stimulus (Fig. 5) and a significant reduction of the photopic OP3 with 10 cd*s/m2 stimulus (Fig. 6). Implicit times of the photopic OP2 and OP3 were significantly prolonged in VGB-treated mice compared with age-matched controls between 2 and 6 weeks of VGB treatment (Fig. 6). In contrast with the b-wave, after 8 weeks of treatment, the scotopic a-wave amplitude of the ERG was significantly decreased in VGB-treated mice compared with age-matched vehicle-treated mice (Fig. 7). No significant changes were identified in the photopic and scotopic a-wave implicit time, photopic a-wave amplitude, scotopic and photopic flicker responses or c-wave amplitude (not shown). (For all ERG results presented, from baseline to the 4-week timepoints: VGB-treated n = 18, control n = 17; at 6 weeks of treatment: VGB-treated n = 11, control n = 12; and at 8 weeks: VGB-treated n = 11, control n = 10).
Figure 3.
The scotopic b-wave implicit time (A) of VGB-treated mice (open circles) is selectively decreased compared with age-matched controls (filled circles) between 2 and 8 weeks of VGB treatment. The photopic b-wave implicit time (B) of VGB-treated mice is globally increased compared with controls between 2 and 4 weeks of VGB treatment with a trend toward increased implicit time at 6 and 8 weeks as well. *P < .05; **P < .01; ***P < .001.
Figure 4.
VGB attenuates the OP RMS in mice. The scotopic OP RMS (A) is decreased in VGB-treated mice (orange) compared with controls (blue) at the 2-, 4-, and 8-week timepoints. The photopic OP RMS (B) is decreased in VGB-treated mice at 2 weeks and remains qualitatively decreased from 4 to 8 weeks of VGB treatment. RMS, root mean square. *P < .05; **P < .01; ***P < .001.
Figure 5.
VGB attenuates the amplitude of later scotopic OP wavelets in mice. In VGB-treated mice (open circles), although OP1 and OP2 amplitudes were not significantly different (A, B), the DA 1 cd*s/m2 OP3 amplitude was decreased in VGB-treated mice (filled circles) compared with time-matched controls at 4 weeks of VGB treatment (C). The OP4 amplitude was attenuated in VGB-treated mice at 2, 4, and 8 weeks of VGB treatment (D). Implicit times of OP wavelets were not significantly different between groups (A–D). Representative waveforms from both right and left eyes shown for one control and one VGB-treated mouse (E). DA, dark adapted. *P < .05; **P < .01; ***P < .001.
Figure 6.
VGB decreases the amplitude of later photopic OP wavelets in mice while increasing the implicit time. In VGB-treated mice (open circles), although OP1 amplitudes (A) were not not significantly different between groups, the LA 10 cd*s/m2 OP2 and the OP3 implicit time (B, C) was increased compared with age-matched controls (filled circles) between 2 and 6 weeks of VGB treatment. Additionally, the OP3 amplitude was decreased in VGB-treated mice relative to age-matched controls between 2 and 8 weeks of VGB treatment (C). Representative waveforms from both right and left eyes shown for one control and one VGB-treated mouse (D). LA, light adapted. *P < .05; **P < .01; ***P < .001.
Figure 7.
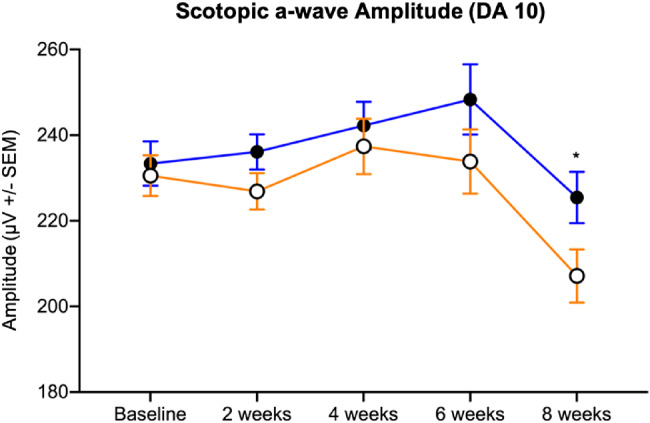
The scotopic a-wave amplitude of VGB-treated mice (open circles) was qualitatively decreased compared with age-matched controls (filled circles) between 2 and 6 weeks and significantly attenuated at 8 weeks of VGB treatment. DA, dark adapted. *P < .05.
OMR
No statistically significant differences in visual acuity were identified between groups by qOMR testing over 8 weeks of VGB treatment (t-test) (Fig. 8A).
Figure 8.
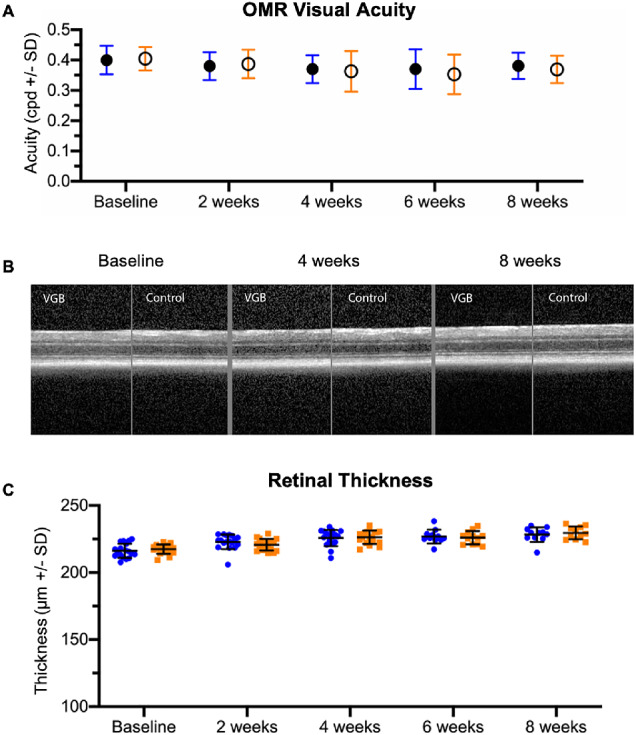
By quantitative OMR testing, no statistically significant differences in visual acuity were identified (A). With in vivo OCT imaging, no significant structural retinal alterations were identified qualitatively over 8 weeks of VGB treatment (B). Quantitative measurements of total retinal thickness (C) reveal no significant differences between VGB-treated mice (blue) and age-matched controls (orange).
Optical Coherence Tomography
No alteration in retinal morphology were identified with OCT imaging over 8 weeks of VGB treatment (Fig. 8B). There were no significant differences in retinal thickness between control and VGB-treated mice throughout the study (t-test) (Fig. 8C).
Immunohistochemistry
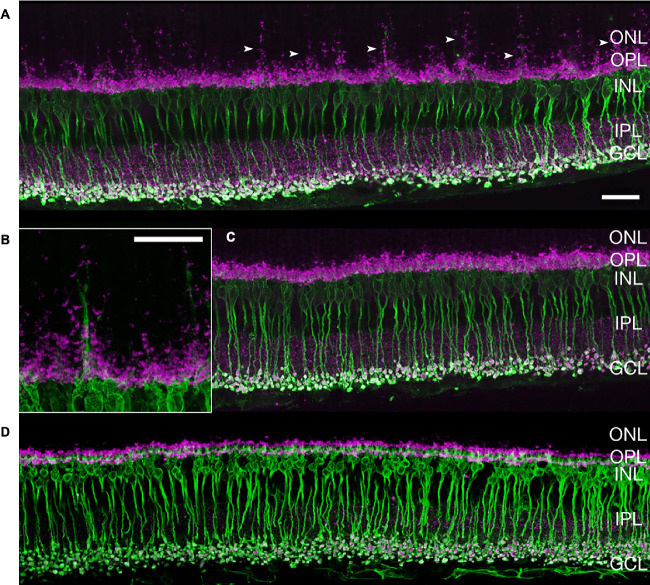
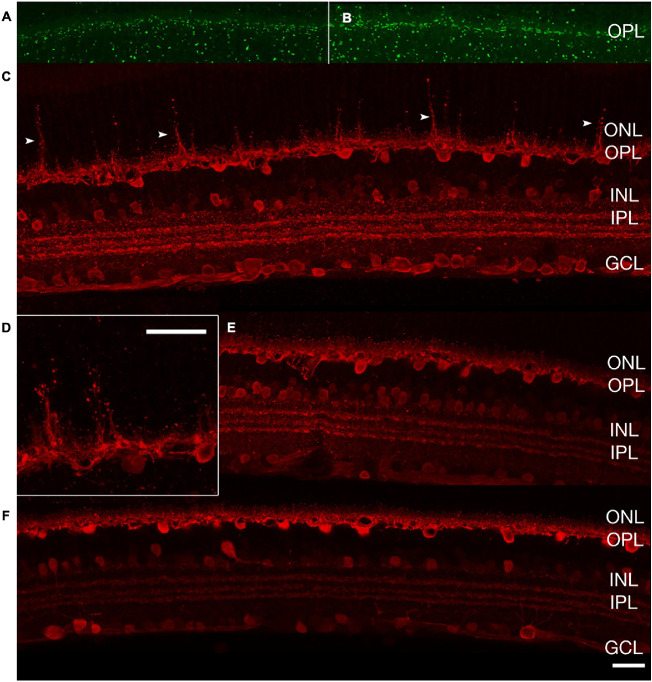
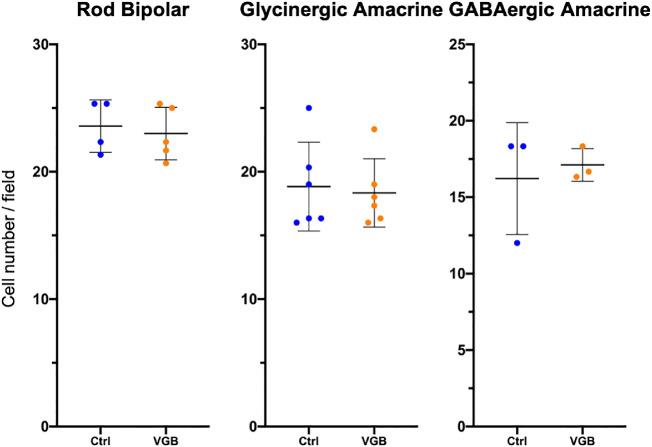
In mice treated with VGB for 8 weeks, antibodies directed against protein kinase C alpha consistently identified striking extension of rod bipolar cell dendrites into the outer nuclear layer of the retina. Protein kinase C alpha–labeled rod bipolar cell dendritic extensions were closely apposed to the ribbon synapse marker Ribeye, enriched at photoreceptor terminals (Fig. 9). Additionally, extension of synaptotagmin 2-positive (type 2 OFF and type 6 ON bipolar26) cone bipolar cell dendrites into the outer nuclear layer could be observed in 8-week VGB-treated retinas (Fig. 10). Dendritic sprouting of calbindin-positive horizontal cell processes into the outer nuclear layer could also be observed in VGB-treated retina (Fig. 11), providing further evidence of retinal neuronal plasticity upon VGB treatment. These findings were not identified in retinas of mice treated with VGB for 4 weeks or in vehicle-treated mice at any time point (Figs. 9, 10, 11). Initial studies provided no evidence suggestive of cone photoreceptor loss in VGB treated retinas as determined by labeling with peanut agglutinin (Fig. 11, but with only one mouse per treatment group), or of gliosis in response to VGB treatment when labeled with antibodies against the glial fibrillary acidic protein (Fig. 10). No significant differences in either rod bipolar cell, glycinergic, or GABAergic amacrine cell numbers were identified between vehicle-treated and VGB-treated retinas (Fig. 12).
Figure 9.
After 8 weeks of treatment, extension of rod bipolar cells dendrites (arrowheads) into the ONL is evident (anti-PKC⍺, green) in VGB-treated mice (A, B) and is not seen in sham-treated mice (C). This finding was consistent in four retinas. There is colocalization of synaptic ribbons (anti-Ribeye, magenta) at the sites of PKC⍺ labeling. Bipolar cell plasticity was not identified at 4 weeks of VGB treatment (D). Scale bar = 25 µm. GCL, ganglion cell layer; INL, inner nuclear layer; IPL, inner plexiform layer; ONL, outer nuclear layer; OPL, outer plexiform layer; PKC⍺, protein kinase C alpha.
Figure 10.
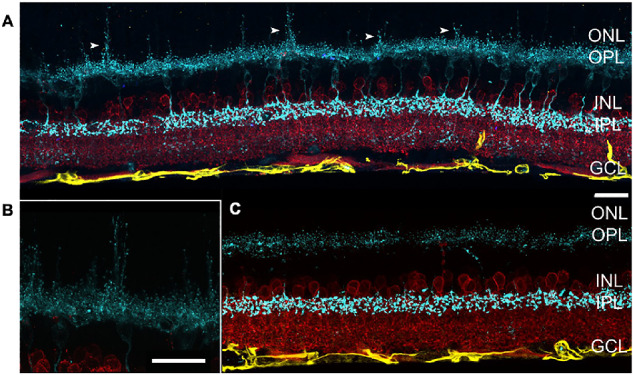
After 8 weeks of treatment, extension of cone bipolar cell dendrites (arrowheads) into the ONL is evident (antisynaptotagmin 2, cyan) in VGB-treated mice (A, B) and is not seen in sham-treated mice (C). No apparent changes in GFAP expression (anti-GFAP, yellow) or glycinergic amacrine cells (anti-GlyT1, red) can be observed upon VGB treatment. Scale bar = 25 µm. GCL, ganglion cell layer; GFAP, glial fibrillary acidic protein; GlyT1, glycine transporter 1; INL, inner nuclear layer; IPL, inner plexiform layer; ONL, outer nuclear layer; OPL, outer plexiform layer.
Figure 11.
After 8 weeks of treatment, there was no identifiable change in cone photoreceptors (PNA, green) in VGB-treated retina (A) compared with sham treated (B). Extension of horizontal cell dendrites (arrowheads) into the ONL is evident (anticalbindin, red) in VGB-treated mice (C, D) and is not seen in sham-treated mice (E). Horizontal cell plasticity was not identified at 4 weeks of VGB treatment (F). Scale bar = 25 µm. GCL, ganglion cell layer; INL, inner nuclear layer; IPL, inner plexiform layer; ONL, outer nuclear layer; OPL, outer plexiform layer; OS/IS, outer and inner segments; PNA, peanut agglutinin.
Figure 12.
After 8 weeks of VGB treatment, there was no significant change in number of rod bipolar cells (two retinas with two to three fields per retina), glycinergic amacrine cells (one retina with three fields per retina) or GABAergic (two retinas with three fields per retina) between VGB-treated and sham-treated retinas. Error bars represent standard deviation.
Mass Spectrometry
The active S+ enantiomer of VGB was concentrated in the retinas of VGB-treated mice by a mean of 21-fold compared with the brain of VGB-treated mice (n = 6; P < .0001, Welch's t-test) (Fig. 13A). No appreciable amounts of VGB were detected in tissues of vehicle-treated mice. In VGB-treated mice compared with saline-treated controls, GABA concentrations in the retina were increased 3.3-fold (n = 6; P < .0001, t-test) (Fig. 13B).
Figure 13.
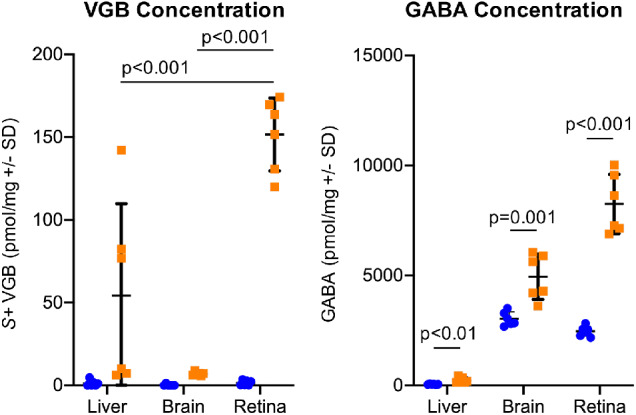
VGB (A) and GABA (B) is significantly concentrated in the retina of VGB-treated mice (orange). The active S+ isomer of VGB is concentrated 21-fold in the retina compared with the brain of VGB-treated mice. GABA concentrations are increased 3.3-fold in the retina of VGB-treated mice compared with controls (blue).
Discussion
In this study of pigmented adult mice, we identified subtle changes in retinal function: a transitory increase in the ERG b-wave amplitude that was maximal after 4 weeks of VGB treatment and persistent depression of OP amplitudes. Enhanced b-wave amplitudes have been described previously both in VGB-treated albino and pigmented rats.15 In contrast, there are also multiple reports of ERG deficits of varying magnitude in laboratory animals treated with VGB, including rabbits, pigmented mice, and albino and pigmented rats.12,16,27,28 In laboratory studies of VGB, OPs have been reported infrequently. However, VGB treatment has been found in two separate studies to have either no effect on OP amplitudes or to decrease OP amplitudes in pigmented rats.15,28 These discrepancies between studies could be reflective of differences in VGB dose, route of administration, dietary taurine and other amino acid concentrations, and environmental light conditions, as well as species and strain of the animals. In our studies, we used a pigmented mouse strain, C57BL/6J, and confirmed the absence of a common confounding mutation associated with retinal pathology (rd8) in mice of this general genetic background. Care was taken to ensure that all mice were subject to consistent light levels because light exposure has been reported to exacerbate severity of VGB toxicity.16 Our findings were reproduced in multiple cohorts of mice using two sources of VGB. Retinal VGB concentrations were confirmed, as was elevated retinal GABA, indicating a pharmacologic effect of VGB on the physiology of the retina.
Accumulation of GABA within the retina was pronounced, as previously reported,29,30 and we extend these findings to confirm that there was marked increase in VGB concentration in the retina of VGB-treated mice. It is likely that supraphysiologic retinal GABA concentrations impact GABAergic signaling in retinal neurons and could result in abnormal bipolar cell-driven responses (principally ERG b-wave) and amacrine cell-associated ERG responses (OPs), as we identified in this study. However, the precise underlying mechanism(s) for effects of accumulation of endogenous retinal GABA on the ERG remains unclear. In both in vivo and ex vivo studies, administration of exogenous GABA has been found to enhance,31–33 reduce,34–36 or have no significant effect37 on b-wave amplitude. In C57BL/6 mice, intravitreal injection of GABA has been found to decrease the b-wave amplitude of responses to dim light stimuli, but increase the b-wave amplitude of responses to brighter stimuli.38 Inhibitory inputs in the retina are largely mediated by GABAA, GABAC, and glycine receptors, which are expressed in different ratios on various retinal cell types.39 Studies conducted to examine differential effects of GABAA and GABAC receptors on the b-wave by pharmacologic blockade have also yielded conflicting results between and within mammalian species. GABAA receptor blockade resulted in an increase in b-wave amplitude in the rat,40 but abolished the b-wave in the rabbit.35 Effects of GABAC receptor blockade have been similarly variable, with reports of increase,35 decrease,40,41 or no effect42 on the b-wave amplitude of the ERG. These inconsistencies could be reflective of differences in species, experimental techniques, and concentration and choice of pharmacologic agents used, but leaves no clear consensus on the effect of GABA and its receptors on the b-wave.
Our finding of attenuation of the later OP waveform components (OP3 and OP4) in VGB-treated mice is likely due to supraphysiologic concentrations of GABA in the retina, as supported by previously published literature. It has been shown that intravitreal injection of GABA abolishes OPs in C57BL/6 mice,38 with similar results reported in the rat, including complete OP removal43 and selective abolishment of later wavelet components.44 This finding is consistent with reports that later OPs are primarily generated or at least modulated by third-order neurons in the ON pathway, particularly GABAergic amacrine cells.44,45 Further, it is clear that GABA receptors in bipolar cells35,36,46 and third-order neurons, likely GABAergic amacrine cells,41,47 play an important role in shaping the ERG b-wave, as well as the OPs. There is a compelling body of work demonstrating that pharmacologic blockade of GABAC receptors can decrease b-wave amplitude while enhancing OP amplitude.40,41 GABA receptors respond differentially to tonic versus phasic stimuli48,49 and GABAC receptors do not desensitize and are more sensitive to GABA than GABAA receptors.50 Importantly, differential uptake and activity of VGB have been shown in various retinal cell types, with a preference toward GABAergic amacrine cells.29,30 Thus, our findings underscore an apparent association between supraphysiologic concentrations of GABA within the VGB-treated retina, b-wave amplitude enhancement, and depression of the later OPs. These effects on retinal electrophysiology may be attributable to preferential stimulation of GABAC receptors and/or GABA-modulated disinhibition of retinal inhibitory circuits at the bipolar axon terminal. However, the observed enhancement of the b-wave was not sustained throughout the entire duration of the 8-week study period. The transitory nature of this effect may reflect homeostatic processes regulating GABA receptors and changes in other contributions to the b-wave.51 Unfortunately, within the scope of the present study, it was not possible to interrogate the precise cellular and molecular mechanisms responsible for the observed functional abnormalities.
In addition to these functional changes, we identified morphologic evidence of pronounced retinal plasticity of second-order neurons. This neuronal plasticity was, however, not directly associated with our finding of b-wave amplitude enhancement, although it affected bipolar cells, because neuronal plasticity was not identified at the 4-week time point when the b-wave enhancement was most evident. Thus, neuronal plasticity may instead reflect changes associated with more chronic VGB administration. Broad extension of rod bipolar dendrites upon VGB treatment has been previously described in albino rats15 and mice, along with horizontal cell dendritic outgrowth.14 Here we extend these findings to pigmented mice and additionally provide evidence for dendritic sprouting of cone bipolar cells, which was reported to not occur in albino mice.14 An outgrowth of bipolar cell dendrites may be observed under pathologic conditions such as progressive photoreceptor degeneration52 and retinal detachment53 and in mutant knockouts such as the nob2 mouse with a calcium channel Cav1.4 null mutation54 and Bsn mice lacking functional Bassoon protein.55 as well as in aged wild-type C57BL/6 mice.56
Concurrent horizontal cell plasticity has also been identified under most of those conditions outlined.52–55 In contrast with the presynaptic changes described, bipolar cell dendrite outgrowth has not been associated with postsynaptic changes in the photoreceptor–bipolar cell synapse.57–59 In light of this evidence, it is reasonable to suggest that photoreceptor presynaptic transmission is impaired by VGB, such that the photoreceptor terminals retract, and bipolar and horizontal cell dendritic extend to maintain the synaptic connection, although the initiating event is unclear and could not be elucidated in our study design. Evidence for significant cone photoreceptor damage or gliosis was absent in our mice, contrary to previously published work in albino rodents,13,14 perhaps reflective of the protective nature of ocular pigmentation.60 Light-induced retinal toxicity has been well-documented in albino rodents, including photoreceptor damage and retinal gliosis, and could have been possible even at standard vivarium illumination levels, and particularly in conjunction with VGB-induced retinal toxicity.61–64
In addition to light exposure, deficiency of the amino acid taurine has been shown to influence the severity of VGB toxicity in albino rats.65 Administration of VGB has been reported to interfere with taurine transport and result in taurine plasma deficiency below reference levels in VGB-treated animals and human infants.65,66 In VGB-treated neonatal and adult albino rats, bipolar cell plasticity and cone photoreceptor and retinal ganglion cell damage have been demonstrated with concurrent taurine deficiency,27,65 with taurine supplementation partially rescuing these changes in VGB toxicity.27,65 Taurine depletion in rodent models with guanidoethane sulfonate also results in bipolar cell plasticity, as well as cone photoreceptor and retinal ganglion cell damage.67 In these rodent models, animals were fed a low protein, low nutrient, and vegetarian diet without taurine, whereas mice in the current study were maintained on a nonvegetarian diet with animal protein, including a source of taurine.15 Although quantification of dietary or tissue taurine levels was outside the scope of our study, the manifestation of enhanced ERG responses, or even complete rescue from morphologic effects of VGB toxicity, has not been demonstrated with taurine supplementation. In one study of pigmented rats, taurine was not found to have a protective effect against retinal VGB toxicity.28 Further, some subsets of human patients receiving VGB have not shown significantly decreased taurine concentrations compared with reference levels.68,69 However, a recent report of just two cases suggested that taurine supplementation may help to mitigate retinal VGB toxicity in pediatric patients with the rare metabolic disorder, succinate semialdehyde dehydrogenase deficiency.70 Then, there are additional factors involved in VGB-associated retinal morphologic and functional changes described, because the effects of VGB on amino acid metabolism and synthesis within neural tissues, including the retina, is complex and taurine deficiency models alone do not fully address the observed effects.71
In human patients, there have been only very limited histologic reports of retinal morphologic changes associated with VAVFL72 and, as with animal models, functional changes attributed to VGB administration have been inconsistent. The pathophysiology of VGB resulting in visual field loss remains uncertain73 with a majority of the literature describing electrophysiological markers, testing and/or prevalence of VAVFL.4,5,74 Despite significant retinal remodeling and ERG perturbance in our mice, the lack of significant alteration in the visual acuity threshold between VGB-treated and sham-treated mice suggests that these morphologic and functional retinal changes identified at 8 weeks of VGB treatment do not severely impact vision. In this respect, our finding is consistent with the generally asymptomatic nature of VAVFL in people74 and highlights the importance of developing sensitive and specific tests for VAVFL for patients where perimetry is impossible. With regard to the electrophysiologic findings described in humans, it is important to separate unassociated, reversible physiologic effects, and pathologic findings associated with VAVFL.75 A reduction in the International Society for Clinical Electrophysiology of Vision light-adapted 30-Hz flicker has been generally accepted as a reliable marker for VAVFL,7,11,76,77 although not without some controversy.10,78 Abnormalities in the 30-Hz flicker is considered reflective of (largely postreceptoral) dysfunction in the cone pathway and is consistent with our findings of cone bipolar and horizontal cell plasticity. Although photopic ERG b-wave amplitudes were comparable in our study, in contrast with previous findings in human patients,11,75,79,80 this finding may reflect differences in the duration of treatment, because an initial increase preceding a decrease in the photopic b-wave amplitude was also described in humans.81,82 Consistent with our findings in mice, a reduction in OP amplitudes was reported in human patients, but with a greater effect on the early OP wavelets.82 These findings in human subjects are broadly similar to the results of this study, although we found later OP wavelets to be significantly affected rather than early OP wavelets. The reason for this apparent species difference is unclear. Because the OP deficits demonstrate dramatic improvement upon discontinuation of VGB in human patients, it has been postulated that OP alterations represent a physiologic response that is not directly associated with the pathology of VAVFL.79 Bipolar cell abnormalities with presynaptic photoreceptor disruption could explain ERG perturbations described commonly in humans, such as attenuation of the light-adapted 30-Hz flicker, and warrant further study in our model.
In summary, we document significant alterations in retinal function and morphology secondary to VGB administration in C57BL/6J mice, primarily enhancement of the b-wave amplitude with concurrent depression of OPs and second-order neuron plasticity. Within the scope of the current study, we were unable to establish the precise mechanisms responsible for these functional and morphologic effects of VGB administration. However, we confirmed the dramatic preferential accumulation of VGB in the mouse retina over the brain, the target organ for VGB's antiepileptic activity. Irrespective of the precise mechanisms responsible for VAVFL, it is evident that our results underscore the association between the intense concentration of VGB and GABA in the retina and VGB-associated retinal toxicity. Our findings also highlight the current knowledge gaps that are important to address in ongoing efforts to understand the pathophysiology of VGB-associated retinal toxicity, namely, (1) mechanisms responsible for the preferential accumulation of VGB in the retina, (2) the effects of chronic supraphysiologic concentrations of GABA on retinal circuitry, and (3) the role of photoreceptors, horizontal, and amacrine cells in the observed changes in retinal bipolar cells. In turn, the answers to these questions are likely to advance efforts to mitigate VAVFL in human patients by informing the design of pharmacologic approaches to avoid VGB concentration in off-target tissues, or of drugs in this class that do not share VGB's adverse effects.
Acknowledgments
The authors thank Kazuya Oikawa for his advice and support.
Supported by NIH R01 EY027476, NIH P30 EY016665, NIH S10 OD018221, NIH T32 EY027721, a Fight for Sight summer student fellowship, and unrestricted funds to the University of Wisconsin-Madison, Department of Ophthalmology and Visual Sciences from Research to Prevent Blindness.
Disclosure: K. Chan, None; M. Hoon, None; B.R. Pattnaik, None; J.N. Ver Hoeve, None; B. Wahlgren, None; S.Gloe, None; J. Williams, None; B. Wetherbee, None; J.A. Kiland, None; K.R. Vogel, None; E. Jansen, None; G. Salomons, None; D. Walters, None; J.-B. Roullet, None; K.M. Gibson, None; G.J. McLellan, None
References
- 1. Vogel KR, Pearl PL, Theodore WH, McCarter RC, Jakobs C, Gibson KM. Thirty years beyond discovery–clinical trials in succinic semialdehyde dehydrogenase deficiency, a disorder of GABA metabolism. J Inherit Metab Dis. 2013; 36: 401–410. [DOI] [PMC free article] [PubMed] [Google Scholar]
- 2. Carmant L. Vigabatrin therapy for infantile spasms: review of major trials in Europe, Canada, and the United States; and recommendations for dosing. Acta Neurol Scand Suppl. 2011;(192): 36–47. doi: 10.1111/j.1600-0404.2011.01599.x [DOI] [PubMed] [Google Scholar]
- 3. Ben-Menachem E. Mechanism of action of vigabatrin: correcting misperceptions. Acta Neurol Scand. 2011; 124: 5–15. [DOI] [PubMed] [Google Scholar]
- 4. Riikonen R, Rener-Primec Z, Carmant L, et al.. Does vigabatrin treatment for infantile spasms cause visual field defects? An international multicentre study. Dev Med Child Neurol. 2015; 57: 60–67. [DOI] [PubMed] [Google Scholar]
- 5. Maguire MJ, Hemming K, Wild JM, Hutton JL, Marson AG. Prevalence of visual field loss following exposure to vigabatrin therapy: a systematic review. Epilepsia. 2010; 51: 2423–2431. [DOI] [PubMed] [Google Scholar]
- 6. Plant GT, Sergott RC. Understanding and interpreting vision safety issues with vigabatrin therapy. Acta Neurol Scand. 2011; 124: 57–71. [DOI] [PubMed] [Google Scholar]
- 7. Harding GFA, Robertson K, Spencer EL, Holliday I. Vigabatrin; its effect on the electrophysiology of vision. Doc Ophthalmol. 2002; 104: 213–229. [DOI] [PubMed] [Google Scholar]
- 8. Buncic JR, Westall CA, Panton CM, Munn JR, MacKeen LD, Logan WJ. Characteristic retinal atrophy with secondary “inverse” optic atrophy identifies vigabatrin toxicity in children. Ophthalmology. 2004; 111: 1935–1942. [DOI] [PMC free article] [PubMed] [Google Scholar]
- 9. Dragas R, Westall C, Wright T. Changes in the ERG d-wave with vigabatrin treatment in a pediatric cohort. Doc Ophthalmol. 2014; 129: 97–104. [DOI] [PubMed] [Google Scholar]
- 10. Moskowitz A, Hansen RM, Eklund SE, Fulton AB. Electroretinographic (ERG) responses in pediatric patients using vigabatrin. Doc Ophthalmol. 2012; 124: 197–209. [DOI] [PubMed] [Google Scholar]
- 11. Coupland SG, Zackon DH, Leonard BC, Ross TM. Vigabatrin effect on inner retinal function. Ophthalmology. 2001; 108: 1493–1496. [DOI] [PubMed] [Google Scholar]
- 12. Kjellström U, Bruun A, Ghosh F, Andréasson S, Ponjavic V. Dose-related changes in retinal function and PKC-alpha expression in rabbits on vigabatrin medication. Graefes Arch Clin Exp Ophthalmol. 2009; 247: 1057–1067. [DOI] [PubMed] [Google Scholar]
- 13. Duboc A, Hanoteau N, Simonutti M, et al.. Vigabatrin, the GABA-transaminase inhibitor, damages cone photoreceptors in rats. Ann Neurol. 2004; 55: 695–705. [DOI] [PubMed] [Google Scholar]
- 14. Wang QP, Jammoul F, Duboc A, et al.. Treatment of epilepsy: the GABA-transaminase inhibitor, vigabatrin, induces neuronal plasticity in the mouse retina. Eur J Neurosci. 2008; 27: 2177–2187. [DOI] [PMC free article] [PubMed] [Google Scholar]
- 15. Akula JD, Noonan ER, Di Nardo A, et al.. Vigabatrin can enhance electroretinographic responses in pigmented and albino rats. Doc Ophthalmol. 2015; 131: 1–11. [DOI] [PubMed] [Google Scholar]
- 16. Tao Y, Yang J, Ma Z, et al.. The vigabatrin induced retinal toxicity is associated with photopic exposure and taurine deficiency: an in vivo study. Cell Physiol Biochem. 2016; 40: 831–846. [DOI] [PubMed] [Google Scholar]
- 17. Walters DC, Jansen EEW, Ainslie GR, et al.. Preclinical tissue distribution and metabolic correlations of vigabatrin, an antiepileptic drug associated with potential use‐limiting visual field defects. Pharmacol Res Perspect. 2019; 7: e00456. [DOI] [PMC free article] [PubMed] [Google Scholar]
- 18. Naka KI, Rushton WAH. S-potentials from colour units in the retina of fish (Cyprinidae). J Physiol. 1966; 185: 536–555. [DOI] [PMC free article] [PubMed] [Google Scholar]
- 19. Severns ML, Johnson MA. The care and fitting of Naka-Rushton functions to electroretinographic intensity-response data. Doc Ophthalmol. 1993; 85: 135–150. [DOI] [PubMed] [Google Scholar]
- 20. Kretschmer F, Tariq M, Chatila W, Wu B, Badea TC. Comparison of optomotor and optokinetic reflexes in mice. J Neurophysiol. 2017; 118: 300–316. [DOI] [PMC free article] [PubMed] [Google Scholar]
- 21. Frund I, Haenel NV, Wichmann FA. Inference for psychometric functions in the presence of nonstationary behavior. J Vis. 2011; 11: 16. [DOI] [PubMed] [Google Scholar]
- 22. Kretschmer F, Sajgo S, Kretschmer V, Badea TC. A system to measure the optokinetic and optomotor response in mice. J Neurosci Methods. 2015; 256: 91–105. [DOI] [PMC free article] [PubMed] [Google Scholar]
- 23. Dysli C, Enzmann V, Sznitman R, Zinkernagel MS. Quantitative analysis of mouse retinal layers using automated segmentation of spectral domain optical coherence tomography images. Transl Vis Sci Technol. 2015; 4: 9. [DOI] [PMC free article] [PubMed] [Google Scholar]
- 24. Schindelin J, Arganda-Carreras I, Frise E, et al.. Fiji: an open-source platform for biological-image analysis. Nat Methods. 2012; 9: 676–682. [DOI] [PMC free article] [PubMed] [Google Scholar]
- 25. Baba K, Mazzoni F, Owino S, Contreras-Alcantara S, Strettoi E, Tosini G. Age-related changes in the daily rhythm of photoreceptor functioning and circuitry in a melatonin-proficient mouse strain. PLoS One. 2012; 7: e37799. [DOI] [PMC free article] [PubMed] [Google Scholar]
- 26. Wässle H, Puller C, Müller F, Haverkamp S. Cone contacts, mosaics, and territories of bipolar cells in the mouse retina. J Neurosci. 2009; 29: 106–117. [DOI] [PMC free article] [PubMed] [Google Scholar]
- 27. Jammoul F, Dégardin J, Pain D, et al.. Taurine deficiency damages photoreceptors and retinal ganglion cells in vigabatrin-treated neonatal rats. Mol Cell Neurosci. 2010; 43: 414–421. [DOI] [PMC free article] [PubMed] [Google Scholar]
- 28. Rasmussen AD, Truchot N, Pickersgill N, Thale ZI, Rosolen SG, Botteron C. The effects of taurine on Vigabatrin, high light intensity and mydriasis induced retinal toxicity in the pigmented rat. Exp Toxicol Pathol. 2014; 67: 13–20. [DOI] [PubMed] [Google Scholar]
- 29. Pow DV, Baldridge W, Crook DK. Activity-dependent transport of GABA analogues into specific cell types demonstrated at high resolution using a novel immunocytochemical strategy. Neuroscience. 1996; 73: 1129–1143. [DOI] [PubMed] [Google Scholar]
- 30. Neal MJ, Cunningham JR, Shah MA, Yazulla S. Immunocytochemical evidence that vigabatrin in rats causes GABA accumulation in glial cells of the retina. Neurosci Lett. 1989; 98: 29–32. [DOI] [PubMed] [Google Scholar]
- 31. Starr MS. The effects of various amino acids, dopamine and some convulsants on the electroretinogram of the rabbit. Eq Eye Res. 1975; 21: 79–87. [DOI] [PubMed] [Google Scholar]
- 32. Dick E, Miller RF, Bloomfield S. Extracellular K+ activity changes related to electroretinogram components. II. Rabbit (E-type) retinas. J Gen Physiol. 1985; 85: 911–931. [DOI] [PMC free article] [PubMed] [Google Scholar]
- 33. Naarendorp F, Sieving PA. The scotopic threshold response of the cat ERG is suppressed selectively by GABA and glycine. Vis Res. 1991; 31(I): 15. [DOI] [PubMed] [Google Scholar]
- 34. De Vries GW, Friedman AH. GABA, picrotoxin and retinal sensitivity. Brain Res. 1978; 148: 530–535. [DOI] [PubMed] [Google Scholar]
- 35. Gottlob I, Wündsch L, Tuppy FK. The rabbit electroretinogram: effect of GABA and its antagonists. Vision Res. 1988; 28: 203–210. [DOI] [PubMed] [Google Scholar]
- 36. Hanitzsch R, Küppers L, Flade A. The effect of GABA and the GABA-uptake-blocker NO-711 on the b-wave of the ERG and the responses of horizontal cells to light. Graefes Arch Clin Exp Ophthalmol. 2004; 242: 784–791. [DOI] [PubMed] [Google Scholar]
- 37. Wachtmeister L. Further studies of the chemical sensitivity of the oscillatory potentials of the electroretinogram (ERG). Acta Ophthalmol. 1980; 58: 712–725. [DOI] [PubMed] [Google Scholar]
- 38. Robson JG, Maeda H, Saszik SM, Frishman LJ. In vivo studies of signaling in rod pathways of the mouse using the electroretinogram. Vision Res. 2004; 44: 3253–3268. [DOI] [PubMed] [Google Scholar]
- 39. Eggers E, Lukasiewicz P. Multiple pathways of inhibition shape bipolar cell responses in the retina. Vis Neurosci. 2011; 28: 95–108. [DOI] [PMC free article] [PubMed] [Google Scholar]
- 40. Kapousta-Bruneau NV. Opposite effects of GABA(A) and GABA(C) receptor antagonists on the b- wave of ERG recorded from the isolated rat retina. Vision Res. 2000; 40: 1653–1665. [DOI] [PubMed] [Google Scholar]
- 41. Dong C-J, Hare WA. GABAc feedback pathway modulates the amplitude and kinetics of ERG b-wave in a mammalian retina in vivo. Vision Res. 2002; 42: 1081–1087. [DOI] [PubMed] [Google Scholar]
- 42. McCall MA, Lukasiewicz PD, Gregg RG, Peachey NS. Elimination of the ρ1 subunit abolishes GABAC receptor expression and alters visual processing in the mouse retina. J Neurosci. 2002; 22: 4163–4174. [DOI] [PMC free article] [PubMed] [Google Scholar]
- 43. Möller A, Eysteinsson T. Modulation of the components of the rat dark-adapted electroretinogram by the three subtypes of GABA receptors. Vis Neurosci. 2003; 20: 535–542. [DOI] [PubMed] [Google Scholar]
- 44. Dai J, He J, Wang G, et al.. Contribution of GABAa, GABAc and glycine receptors to rat dark-adapted oscillatory potentials in the time and frequency domain. Oncotarget. 2017; 8: 77696–77709. [DOI] [PMC free article] [PubMed] [Google Scholar]
- 45. Dong C-J, Agey P, Hare WA. Origins of the electroretinogram oscillatory potentials in the rabbit retina. Vis Neurosci. 2004; 21: 533–543. [DOI] [PubMed] [Google Scholar]
- 46. Wurziger K, Lichtenberger T, Hanitzsch R. On-bipolar cells and depolarising third-order neurons as the origin of the ERG-b-wave in the RCS rat. Vision Res. 2001; 41: 1091–1101. [DOI] [PubMed] [Google Scholar]
- 47. Dong C-J, Hare WA. Contribution to the kinetics and amplitude of the electroretinogram b-wave by third-order retinal neurons in the rabbit retina. Vision Res. 2000; 40: 579–590. [DOI] [PubMed] [Google Scholar]
- 48. Farrant M, Nusser Z. Variations on an inhibitory theme: phasic and tonic activation of GABAA receptors. Nat Rev Neurosci. 2005; 6: 215–229. [DOI] [PubMed] [Google Scholar]
- 49. Owens DF, Kriegstein AR. Is there more to gaba than synaptic inhibition? Nat Rev Neurosci. 2002; 3: 715–727. [DOI] [PubMed] [Google Scholar]
- 50. Feigenspan A, Bormann J. GABA-gated Cl- channels in the rat retina. Prog Retin Eye Res. 1998; 17: 99–126. [DOI] [PubMed] [Google Scholar]
- 51. Sieving PA, Murayama K, Naarendorp F. Push-pull model of the primate photopic electroretinogram: a role for hyperpolarizing neurons in shaping the b-wave. Vis Neurosci. 1994; 11: 519–532. [DOI] [PubMed] [Google Scholar]
- 52. Cuenca N, Pinilla I, Sauvé Y, Lund R. Early changes in synaptic connectivity following progressive photoreceptor degeneration in RCS rats. Eur J Neurosci. 2005; 22: 1057–1072. [DOI] [PubMed] [Google Scholar]
- 53. Fisher SK, Lewis GP, Linberg KA, Verardo MR. Cellular remodeling in mammalian retina: results from studies of experimental retinal detachment. Prog Retin Eye Res. 2005; 24: 395–431. [DOI] [PubMed] [Google Scholar]
- 54. Bayley PR, Morgans CW. Rod bipolar cells and horizontal cells form displaced synaptic contacts with rods in the outer nuclear layer of the nob2 retina. J Comp Neurol. 2007; 500: 286–298. [DOI] [PMC free article] [PubMed] [Google Scholar]
- 55. Dick O, tom Dieck S, Altrock WD, et al.. The Presynaptic active zone protein bassoon is essential for photoreceptor ribbon synapse formation in the retina. Neuron. 2003; 37: 775–786. [DOI] [PubMed] [Google Scholar]
- 56. Liets LC, Eliasieh K, van der List DA, Chalupa LM. Dendrites of rod bipolar cells sprout in normal aging retina. Proc Natl Acad Sci U S A. 2006; 103: 12156–12160. [DOI] [PMC free article] [PubMed] [Google Scholar]
- 57. Ball SL, Pardue MT, Mccall MA, Gregg RG, Peachey NS. Immunohistochemical analysis of the outer plexiform layer in the nob mouse shows no abnormalities. Vis Neurosci. 2003; 20: 267–272. [DOI] [PubMed] [Google Scholar]
- 58. Tagawa Y, Sawai H, Ueda Y, Tauchi M, Nakanishi S. Immunohistological studies of metabotropic glutamate receptor subtype 6-deficient mice show no abnormality of retinal cell organization and ganglion cell maturation. J Neurosci. 1999; 19: 2568–2579. [DOI] [PMC free article] [PubMed] [Google Scholar]
- 59. Dhingra A, Lyubarsky A, Jiang M, et al.. The light response of ON bipolar neurons requires G[alpha]o. J Neurosci. 2000; 20: 9053–9058. [DOI] [PMC free article] [PubMed] [Google Scholar]
- 60. Trachimowicz RA, Fisher LJ, Hinds JW. Preservation of retinal structure in aged pigmented mice. Neurobiol Aging. 1981; 2: 133–141. [DOI] [PubMed] [Google Scholar]
- 61. Marc RE, Jones BW, Watt CB, Vazquez-Chona F, Vaughan DK, Organisciak DT. Extreme retinal remodeling triggered by light damage: implications for age related macular degeneration. Mol Vis. 2008; 14: 782–806. [PMC free article] [PubMed] [Google Scholar]
- 62. Grosche J, Hartig W, Reichenbach A. Expression of glial fibrillary acidic protein (GFAP), glutamine synthetase (GS), and Bcl-2 protooncogene protein by Mtiller (glial) cells in retinal light damage of rats. Neurosci Lett. 1995; 185: 119–122. [DOI] [PubMed] [Google Scholar]
- 63. Perez J, Perentes E. Light-induced retinopathy in the albino rat in long-term studies: an immunohistochemical and quantitative approach. Exp Toxicol Pathol. 1994; 46: 229–235. [DOI] [PubMed] [Google Scholar]
- 64. Rutar M, Provis JM, Valter K. Brief Exposure to damaging light causes focal recruitment of macrophages, and long-term destabilization of photoreceptors in the albino rat retina. Curr Eye Res. 2010; 35: 631–643. [DOI] [PubMed] [Google Scholar]
- 65. Jammoul F, Wang Q, Nabbout R, et al.. Taurine deficiency is a cause of vigabatrin-induced retinal phototoxicity. Ann Neurol. 2009; 65: 98–107. [DOI] [PMC free article] [PubMed] [Google Scholar]
- 66. Plum J, Nøhr MK, Hansen SH, Holm R, Nielsen CU. The anti-epileptic drug substance vigabatrin inhibits taurine transport in intestinal and renal cell culture models. Int J Pharm. 2014; 473: 395–397. [DOI] [PubMed] [Google Scholar]
- 67. Gaucher D, Arnault E, Husson Z, et al.. Taurine deficiency damages retinal neurones: cone photoreceptors and retinal ganglion cells. Amino Acids. 2012; 43: 1979–1993. [DOI] [PMC free article] [PubMed] [Google Scholar]
- 68. Spelbrink EM, Mabud TS, Reimer R, Porter BE. Plasma taurine levels are not affected by vigabatrin in pediatric patients. Epilepsia. 2016; 57: e168–e172. [DOI] [PubMed] [Google Scholar]
- 69. Löscher W, Fassbender CP, Gram L, et al.. Determination of GABA and vigabatrin in human plasma by a rapid and simple HPLC method: correlation between clinical response to vigabatrin and increase in plasma GABA. Epilepsy Res. 1993. [DOI] [PubMed] [Google Scholar]
- 70. Horvath G-A, Hukin J, Stockler-Ipsiroglu S, Aroichane M. Eye findings on vigabatrin and taurine treatment in two patients with succinic semialdehyde dehydrogenase deficiency. Neuropediatrics. 2016; 47: 263–267. [DOI] [PubMed] [Google Scholar]
- 71. Walters DC, Arning E, Bottiglieri T, et al.. Metabolomic analyses of vigabatrin (VGB)-treated mice: GABA-transaminase inhibition significantly alters amino acid profiles in murine neural and non-neural tissues. Neurochem Int. 2019; 125: 151–162. [DOI] [PMC free article] [PubMed] [Google Scholar]
- 72. Ravindran J, Blumbergs P, Crompton J, Pietris G, Waddy H. Visual field loss associated with vigabatrin: pathological correlations.J Neurol Neurosurg Psychiatry. 2001; 70: 787–789. [DOI] [PMC free article] [PubMed] [Google Scholar]
- 73. Heim MK, Gidal BE. Vigabatrin-associated retinal damage - potential biochemical mechanisms. Acta Neurol Scand. 2012; 126: 219–228. [DOI] [PubMed] [Google Scholar]
- 74. Malmgren K, Ben-Menachem E, Frisén L. Vigabatrin visual toxicity: evolution and dose dependence. Epilepsia. 2001; 42: 609–615. [DOI] [PubMed] [Google Scholar]
- 75. Harding GFA, Wild JM, Robertson KA, Rietbrock S, Martinez C. Separating the retinal electrophysiologic effects of vigabatrin Treatment versus field loss. AM J Ophthalmol. 2000;130:691. [DOI] [PubMed] [Google Scholar]
- 76. Kjellström U, Lövestam-Adrian M, Andréasson S, Ponjavic V. Full-field ERG and visual fields in patients 5 years after discontinuing vigabatrin therapy. Doc Ophthalmol. 2008; 117: 93–101. [DOI] [PubMed] [Google Scholar]
- 77. McCoy B, Wright T, Weiss S, Go C, Westall CA. Electroretinogram changes in a pediatric population with epilepsy: is vigabatrin acting alone? J Child Neurol. 2011;26:729–733. [DOI] [PMC free article] [PubMed] [Google Scholar]
- 78. Akula JD, Westall CA, Wright T. Vigabatrin retinal toxicity in children with infantile spasms: an observational cohort study. Neurology. 2015; 85: 655.2–656. [DOI] [PubMed] [Google Scholar]
- 79. Westall CA, Westall CA, Westall CA, et al.. Changes in the electroretinogram resulting from discontinuation of vigabatrin in children. Doc Ophthalmol. 2003; 107: 299–309. [DOI] [PMC free article] [PubMed] [Google Scholar]
- 80. Westall CA, Wright T, Cortese F, Kumarappah A, Snead OC, Buncic JR. Vigabatrin retinal toxicity in children with infantile spasms: an observational cohort study. Neurology. 2014; 83: 2262–2268. [DOI] [PMC free article] [PubMed] [Google Scholar]
- 81. Westall CA, Logan WJ, Smith K, Buncic JR, Panton CM, Abdolell M. The Hospital for Sick Children, Toronto, longitudinal ERG study of children on vigabatrin. Doc Ophthalmol. 2002; 104: 133–149. [DOI] [PMC free article] [PubMed] [Google Scholar]
- 82. Morong S, Westall CA, Nobile R, et al.. Longitudinal changes in photopic OPs occurring with vigabatrin treatment. Doc Ophthalmol. 2003; 107: 289. [DOI] [PMC free article] [PubMed] [Google Scholar]


