

Abstract
Chromatin integrity is essential for cellular homeostasis. Polycomb group proteins modulate chromatin states and transcriptionally repress developmental genes to maintain cell identity. They also repress repetitive sequences such as major satellites and constitute an alternative state of pericentromeric constitutive heterochromatin at paternal chromosomes (pat‐PCH) in mouse pre‐implantation embryos. Remarkably, pat‐PCH contains the histone H3.3 variant, which is absent from canonical PCH at maternal chromosomes, which is marked by histone H3 lysine 9 trimethylation (H3K9me3), HP1, and ATRX proteins. Here, we show that SUMO2‐modified CBX2‐containing Polycomb Repressive Complex 1 (PRC1) recruits the H3.3‐specific chaperone DAXX to pat‐PCH, enabling H3.3 incorporation at these loci. Deficiency of Daxx or PRC1 components Ring1 and Rnf2 abrogates H3.3 incorporation, induces chromatin decompaction and breakage at PCH of exclusively paternal chromosomes, and causes their mis‐segregation. Complementation assays show that DAXX‐mediated H3.3 deposition is required for chromosome stability in early embryos. DAXX also regulates repression of PRC1 target genes during oogenesis and early embryogenesis. The study identifies a novel critical role for Polycomb in ensuring heterochromatin integrity and chromosome stability in mouse early development.
Keywords: chromosome stability, constitutive heterochromatin, histone variant, PRC1, SUMOylation
Subject Categories: Chromatin, Epigenetics, Genomics & Functional Genomics; Development & Differentiation; Post-translational Modifications, Proteolysis & Proteomics
SUMO‐dependent CBX2 interactions control recruitment of the DAXX‐ATRX histone chaperone/remodeler for formation and maintenance of pericentromeric heterochromatin in early mouse embryos.
Introduction
Major parts of metazoan genomes are composed of repetitive sequences such as endogenous retroviral sequences (ERVs) and tandem repeat sequences flanking and underlying centromeres and at telomeres. These sequences are packaged in constitutive heterochromatin characterized by H3 lysine 9 di‐/trimethylation (H3K9me2/3) and occupancy of HP1 proteins and are largely transcriptionally repressed (Allshire et al, 1995; Peters et al, 2001; Ebert et al, 2004). While such chromatin states are effectively perpetuated during DNA replication (Alabert et al, 2017; Mendiratta et al, 2019), they also undergo nucleosome turnover outside of S phase and incorporate nucleosomes containing the histone variant H3.3. H3.3 is expressed throughout the cell cycle and is mostly deposited at transcription start sites (TSS) and along gene bodies of transcriptionally active genes, and at enhancers by the HIRA/CABIN1/UBN1 complex (Goldberg et al, 2010; Szenker et al, 2011; Martire et al, 2019; Mendiratta et al, 2019). In contrast, the chaperone DAXX drives H3.3 incorporation at and facilitates transcription of pericentromeric and telomeric repeat regions (Drane et al, 2010; Lewis et al, 2010; Gauchier et al, 2019). DAXX is required for the structural organization of PCH (Rapkin et al, 2015), and its localization at PCH is mediated via its interaction with ATRX (alpha thalassemia/mental retardation syndrome X‐linked), a chromatin remodeler recruited via binding to H3K9me3 and HP1 (Tang et al, 2004; Eustermann et al, 2011; Iwase et al, 2011; Hoelper et al, 2017). At ERVs, H3.3 deposition is not required for transcriptional silencing, yet it increases DAXX occupancy levels by stabilizing the protein (Hoelper et al, 2017).
In embryonic stem cells (ESCs) and other somatic cells, conjugation with the small ubiquitin‐like modification (SUMO) is a prominent component of heterochromatic components at PCH, telomeres, and ERVs, with DAXX, ATRX, KAP1, and SETDB1 being SUMOylated (Hendriks et al, 2014). Moreover, the H3K9me3 histone methyltransferase (HMT) SUV39H1 functions as an E3 SUMO1 ligase for HP1 proteins (Maison et al, 2016), thereby promoting recruitment of HP1α to canonical H3K9me3/HP1 PCH in mouse fibroblasts (Maison et al, 2011). Importantly, deficiency of the SUMO E2 conjugating enzyme UBC9 induces major chromosome condensation and segregation defects suggesting a major role of SUMOylation in maintaining the heterochromatic state of H3K9me3/HP1 at PCH and genome integrity (Nacerddine et al, 2005). Indeed, SUMO2 was recently shown to be required in human cells for the association of DAXX and for H3.3 deposition at centromeres, presumably via SUMOylation of CENP‐B. CENP‐B and DAXX deficiency impaired the heterochromatin state at and function of centromeres (Morozov et al, 2017).
Besides at actively expressed genes, nucleosomes also undergo turnover at TSS of genes repressed by Polycomb group proteins. PcG proteins bind and robustly modify the chromatin state of their target loci in order to perpetuate a specific transcriptional program over cellular divisions (Beisel & Paro, 2011). They assemble in two major types of complexes, Polycomb Repressive Complex 1 and complex 2 (PRC1 and PRC2), which exist in multiple flavors harboring different subunits and enzymatic activities. The core subunits of PRC1, RING1 and RNF2, are responsible for catalyzing ubiquitination of lysine 119 of histone H2A (H2AK119ub1), while the EZH1/2 subunits of PRC2 mediate H3K27me3 (Cao et al, 2002; de Napoles et al, 2004). ESC models with synthetic targets showed that canonical PRC1 (cPRC1) complexes containing CBX proteins mediate heritable gene silencing by sustaining a positive feedback mechanism for recruitment of PRC2 and cPRC1 complexes through H3K27me3 and H2AK119u1 (Moussa et al, 2019). In contrast, variant PRC1 complexes (vPRC1) do not contain CBX subunits and do not rely on preexisting H3K27me3 for chromatin targeting (Blackledge et al, 2014; Cooper et al, 2014). Instead, vPRC1 complexes mediate repression of targets genes in ESCs by catalyzing H2AK119u1 (Fursova et al, 2019; Scelfo et al, 2019) and stimulate binding of PRC2 to their targets (Kalb et al, 2014; Cooper et al, 2016). Intriguingly, H3.3 and HIRA are required to sustain H3K27me3 levels at and repression of some developmental transcription factor genes in ESCs, possibly by modulating PRC2 recruitment to chromatin (Banaszynski et al, 2013). Moreover, during heart development, the repressive activity of cPRC1 is controlled by CBX4, which functions as a SUMO E3 ligase for several chromatin proteins and itself (Kang et al, 2010). Auto‐SUMOylation of CBX4 is counteracted by the SUMO protease SENP2. Loss of Senp2 induces increased recruitment of cPCR1 to PcG target genes and their repression (Kang et al, 2010).
Genetic and chemical perturbation studies in ESCs have revealed plasticity in heterochromatin states at PCH, telomeres, and ERVs between H3K9me3/HP1, DNA methylation and Polycomb repressive pathways (Peters et al, 2003; Saksouk et al, 2014; Walter et al, 2016; Gauchier et al, 2019). In development, natural plasticity in the formation of repressive heterochromatic states has been observed at PCH in mouse pre‐implantation embryos (Santos et al, 2005; Puschendorf et al, 2008; Albert & Peters, 2009). PCH on maternal chromosomes (mat‐PCH) is defined by Suv39h2‐dependent and maternally inherited H3K9me3, and by HP1β and ATRX (Santos et al, 2005; Puschendorf et al, 2008; De La Fuente et al, 2015). In contrast, chromatin of the paternal genome becomes extensively reprogrammed in early embryos. Following the exchange of most nucleosomes by highly basic nuclear proteins during sperm formation (Gill et al, 2012), the nucleosomal configuration is re‐established along the paternal genome shortly after fertilization. Such reconstitution occurs prior to replication and is mediated by HIRA‐driven H3.3 incorporation (Loppin et al, 2005; Lin et al, 2014). It is, however, unknown whether HIRA controls H3.3 deposition at PCH (Lin et al, 2014). We demonstrated previously that proteins of the cPRC1 and PRC2, and their associated histone modifications, constitute an alternative repressive state at PCH of paternal chromosomes, in response to the absence of paternally inherited H3K9me3 (Puschendorf et al, 2008; Tardat et al, 2015). Remarkably, the H3.3 variant is incorporated at PCH after sperm decondensation and remains further enriched during the S/G2 phases of zygotes at paternal, but not maternal, PCH in a replication‐independent manner (Santenard et al, 2010; Akiyama et al, 2011), suggesting the existence of an alternative mechanism for H3.3 deposition, independent of the classical repressive marking such as H3K9me3 and HP1, normally targeting ATRX and thereafter DAXX.
In this study, we unravel the molecular mechanism underlying specific H3.3 deposition at pat‐PCH in mouse zygotes. We show that asymmetric loading of DAXX at pat‐PCH depends on cPRC1 containing CBX2. Germline deficiency for PRC1 subunits Ring1 and Rnf2 results in loss of binding of DAXX and H3.3 occupancy at pat‐PCH. The two SUMO‐interacting motifs (SIMs) of DAXX are required for its association with pat‐PCH implying a role for SUMOylation in DAXX chromatin targeting to these loci. Accordingly, mutation of specific residues in CBX2, which impair its SUMOylation, prevent DAXX targeting to PCH. Finally, we demonstrate that loss of H3.3 at pat‐PCH upon Daxx knockout induces chromatin decompaction and breakage at PCH of exclusively paternal chromosomes and causes their mis‐segregation. We show that H3.3 deposition by DAXX is required for chromosome stability in early embryos. Thus, we identify a novel pathway and role for SUMOylation and Polycomb in ensuring chromatin integrity. Genome‐wide transcriptional analysis shows that Daxx regulates repression of PRC1 target genes in oocytes and 2‐cell embryos. Our data suggest a regulatory function of the novel CBX2/cPRC1 → SUMO2 → DAXX → H3.3 pathway in PRC1‐mediated gene silencing during mouse development.
Results
The histone variant H3.3 is incorporated into pat‐PCH prior to the first round of DNA replication
The paternal genome undergoes extensive chromatin remodeling shortly after fertilization, with the replacement of sperm‐born protamines by maternally provided histones. The remodeling process occurs many hours before the first round of replication arguing for de novo nucleosome deposition onto the paternal DNA template. To monitor the timing of incorporation of histone proteins at pat‐PCH in mouse zygotes, we microinjected mRNAs encoding for EGFP‐tagged H3.2 and mCherry‐tagged H3.3 proteins into metaphase II (M‐II) oocytes prior to their activation by intracytoplasmic sperm injection (ICSI). We monitored the localization of the tagged histones by fluorescence spinning‐disk live microscopy in fertilized embryos (Fig EV1A; [Link], [Link], [Link]). As reported previously (Akiyama et al, 2011), canonical H3.2 became incorporated in both pronuclei at the time of replication (Fig 1A). The deposition of the H3.3 variant into the maternal genome started with similar kinetics. In contrast, H3.3 was incorporated into the paternal genome immediately after fertilization (Lin et al, 2014), including the DAPI‐brightly stained PCH domain of decondensing sperm heads (Fig 1A). H3.3 was clearly detectable at pat‐PCH surrounding pre‐nucleolar bodies in G2‐stage zygotes (Santenard et al, 2010). Three variant residues in the globular domain of histones H3.3 versus H3.1/H3.2 confer specificity for associations with DAXX and HIRA/UBN1 versus CAF1 (Ahmad & Henikoff, 2002; Goldberg et al, 2010; Elsasser et al, 2012; Ricketts et al, 2015). Importantly, expression of a H3.3 mutant protein, carrying either a triple amino acid substitution mimicking H3.1/H3.2 or only the single G90M substitution, abrogated H3.3 incorporation into PCH of the decondensing sperm in zygotes (Fig EV1B and C). These data underscore the specificity of the assay. While Hira is required for H3.3 deposition in the decondensing sperm (Lin et al, 2014), it remains open whether H3.3 deposition at PCH is controlled by HIRA or another H3.3 chaperone, such as DEK or DAXX (Drane et al, 2010; Ivanauskiene et al, 2014).
Figure EV1. Incorporation of H3.3 at pat‐PCH in mouse zygotes requires interaction between histone H3.3 and H3.3‐specific chaperones.
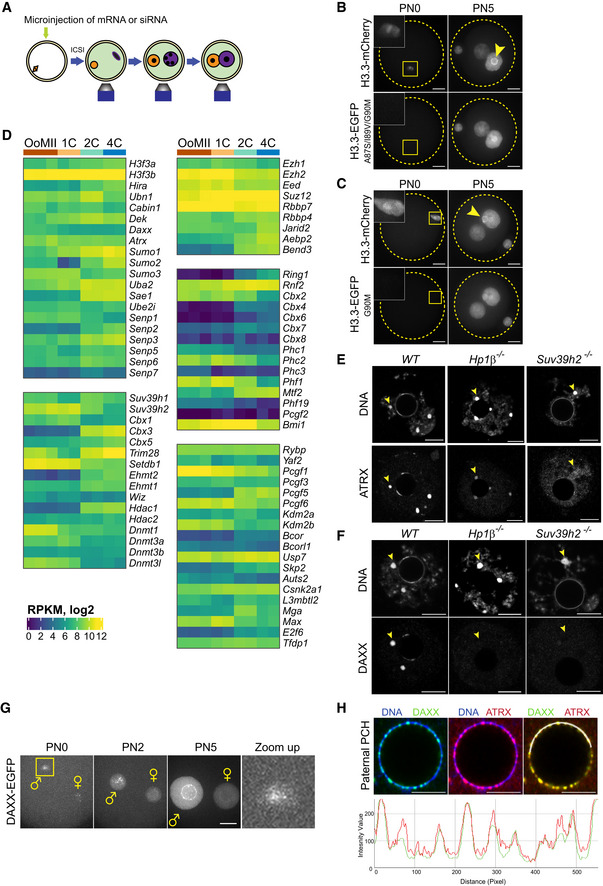
- Experimental design for live imaging of exogenously provided H3.3, H3.2, H3.3G90M, H3.3A87S/I89V/G90M, and DAXX proteins in wild‐type, Daxx conditionally deficient or siRNA‐treated mouse zygotes. mRNA transcripts and siRNAs were microinjected in MII‐arrested oocytes, which were subsequently fertilized by injection of sperm (ICSI).
- Still images of time‐lapse imaging of first cell cycle showing temporal and spatial dynamics of H3.3‐mCherry and H3.3A87S/I89V/G90M‐EGFP proteins in wild‐type zygotes (n = 8). The data demonstrate that interactions with H3.3‐specific chaperone(s) are required for H3.3 deposition into the paternal genome shortly after fertilization (PN0) and into pat‐PCH during/after replication (PN5; yellow arrowhead). Except for PCH, exogenous H3.3A87S/I89V/G90M is incorporated during S phase throughout paternal and maternal genomes, presumably in a replication‐mediated manner. Yellow dashed circles represent the contours of the pronuclei. Scale bar, 15 μm.
- Still images of time‐lapse imaging of first cell cycle showing temporal and spatial dynamics of H3.3‐mCherry and H3.3G90M‐EGFP proteins in wild‐type zygotes (n = 8). As in the H3.3A87S/I89V/G90M triple substitution mutant, the G90M substitution is sufficient to inhibit H3.3‐chaperone‐dependent H3.3 deposition in the decondensing sperm genome and into pat‐PCH during/after replication (PN5; yellow arrowhead). Yellow dashed circles represent the contours of the pronuclei. Scale bar, 15 μm.
- Heatmaps showing mRNA expression levels of histone H3 chaperones and various chromatin associated proteins during early embryogenesis (Park et al, 2013).
- IF detection of ATRX in wild‐type (WT) (n = 22), HP1β‐deficient (n = 8), and Suv39h2‐deficient (n = 18) germinal vesicle (GV) stage oocytes. Arrowheads point to location of PCH in oocyte nuclei. Scale bar, 10 μm.
- IF detection of DAXX in wild‐type (WT) (n = 26), HP1β‐deficient (n = 11), and Suv39h2‐deficient (n = 7) GV oocytes. Arrowheads point to location of PCH in oocyte nuclei. Scale bar, 10 μm.
- Still images of time‐lapse imaging of first cell cycle showing temporal and spatial dynamics of DAXX‐EGFP in wild‐type zygotes (n = 19). DAXX‐EGFP localizes at pat‐PCH throughout the first cell cycle. Zoom‐up image shows magnification of DAXX‐EGFP localization at pat‐PCH in decondensing sperm (yellow box in PN0 image). Scale bar, 10 μm.
- Top: IF detection of DAXX and ATRX at pat‐PCH in WT PN5 zygotes. Bottom: Fluorescence intensity profiles of DAXX and ATRX along white crescent line in the top panel at pat‐PCH of zygotes. Scale bars, 5 μm.
Figure 1. Parent‐of‐origin‐specific targeting pathways for DAXX and ATRX to PCH in mouse zygotes.
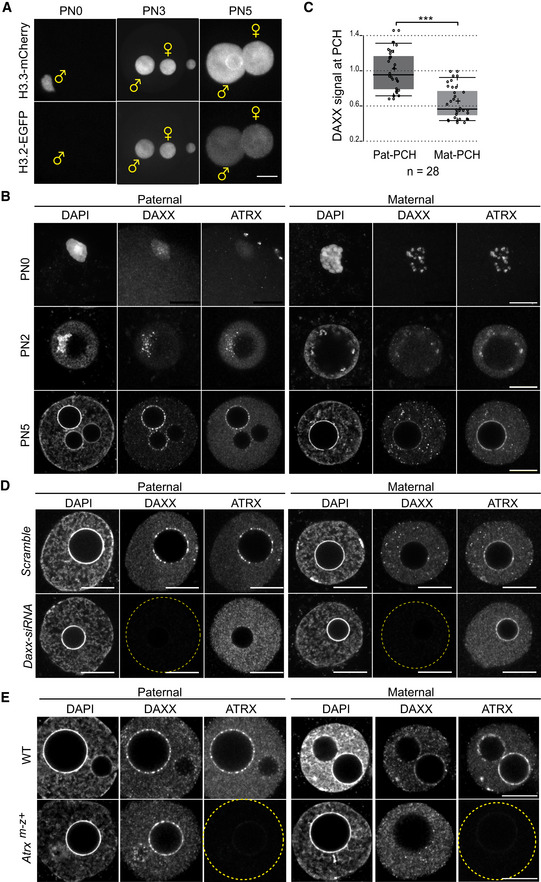
- Still images of time‐lapse imaging of H3.3‐mCherry and H3.2‐EGFP proteins in wild‐type zygotes (n = 17).
- IF of DAXX and ATRX in zygotes at different pronuclear (PN) stages (PN0, n = 8; PN2, n = 6; PN5, n = 33).
- Boxplot displaying signal intensity of DAXX at pat‐ and mat‐PCH in mouse zygotes at PN5 stage, relative to mean signal at pat‐PCH. In boxplots, the enter lines show the medians; box limits indicate the 25th and 75th percentiles as determined by R software; and whiskers extend 1.5 times the interquartile range from the 25th and 75th percentiles. Datapoints are indicated by circles. Experiments were replicated three times. ***P < 0.001, n = 28, paired t‐test.
- IF of DAXX and ATRX in PN5 zygotes upon siRNA‐mediated knockdown of Daxx (n = 14) or with control siRNAs (n = 8).
- IF of DAXX and ATRX in control (n = 15) and Atrx m−z+ (n = 14) PN5 zygotes.
The H3.3 chaperone DAXX localizes to pat‐PCH in mouse zygotes
In somatic cells, the H3.3 chaperone DAXX and the chromatin remodeler ATRX drive incorporation of H3.3 at various heterochromatin regions including PCH (Drane et al, 2010; Goldberg et al, 2010; Lewis et al, 2010). During oogenesis and pre‐implantation embryogenesis, Daxx and Atrx but also other H3.3 chaperones like Hira and Dek are abundantly expressed (Fig EV1D, and Park et al, 2013). Exogenous expression of DAXX was shown to mediate H3.3 incorporation at pat‐PCH in zygotes deficient for Stella (Arakawa et al, 2015). To evaluate a possible contribution of endogenous DAXX and ATRX to H3.3 deposition at pat‐PCH, we investigated their localization in zygotes by immunofluorescence (IF). Following fertilization, both proteins co‐localized at PCH regions of decondensing maternal chromosomes (Fig 1B), marked by H3K9me3 and HP1β (Puschendorf et al, 2008). Such localization argues for targeting of ATRX to H3K9me3‐modified nucleosomes via its ATRX‐DNMT3‐DNMT3L (ADD) domain and to HP1 proteins via its “Leu–X–Val–X–Leu” motif (Eustermann et al, 2011; Iwase et al, 2011). Indeed, ATRX and particularly DAXX localization was reduced at PCH in fully grown germinal vesicle (GV) oocytes deficient for Cbx1 (Hp1β) (Fig EV1E and F) (Tardat et al, 2015) and fully abrogated in GV oocytes deficient for the Suv39h2 HMT lacking both H3K9me3 and HP1β at PCH (Fig EV1E and F) (Peters et al, 2001). Following cell cycle progression, we observed a rapid reduction in DAXX levels at mat‐PCH despite the persistence of ATRX (Fig 1B). In contrast, DAXX already localized at pat‐PCH in decondensing sperm, while ATRX was not detectable there. Live‐imaging analysis of decondensing sperm confirmed DAXX's early association to pat‐PCH (Fig EV1G). Shortly thereafter, prior to replication, ATRX started to co‐localize with DAXX at pat‐PCH (Figs 1B and EV1H). Using a custom developed method to quantify IF signal specifically at PCH domains in zygotes (Appendix Fig S1), we confirmed that DAXX is strongly enriched at pat‐PCH compared to mat‐PCH despite ATRX's presence maternally (Fig 1C). Interestingly, for unidentified reasons, DAXX and ATRX co‐localize to pat‐PCH in a dotted “pearls on a string” pattern, while the signals are more continuous along the nucleolar precursor bodies of mat‐PCH (Fig 1B).
To determine recruitment dependencies between ATRX and DAXX, we efficiently depleted Daxx by siRNA injection (Fig. 1D) and investigated ATRX localization in late‐stage zygotes. While the ATRX signal at euchromatin and mat‐PCH was unaffected, ATRX was specifically lost from pat‐PCH (Fig 1D), demonstrating that ATRX association with pat‐PCH requires DAXX. In contrast, maternal deficiency of the ATRX protein, resulting from conditional deletion of the Atrx gene during oogenesis, caused complete loss of DAXX protein from mat‐PCH only, while DAXX levels at pat‐PCH were unaffected (Fig 1E). Thus, these genetic experiments demonstrate unambiguously that DAXX localization at pat‐PCH is upstream of ATRX, while it is downstream at mat‐PCH.
Canonical PRC1 associates genetically and biochemically with DAXX
We next investigated whether PRC2 or cPRC1 controls DAXX localization to pat‐PCH. A previous study implicated lysine 27 of H3.3 (H3.3K27) in formation and function of PCH in early embryos (Santenard et al, 2010). PRC2 and H3K27me3, though, do not localize to pat‐PCH before replication (Puschendorf et al, 2008). Moreover, maternal deficiency for Ezh1 and/or the Ezh2 paralog did not affect DAXX localization at pat‐PCH (Fig 2A) excluding PRC2 and H3K27me3 as key determinants of DAXX recruitment and function in mouse zygotes.
Figure 2. Targeting of DAXX to pat‐PCH is dependent on PRC1.
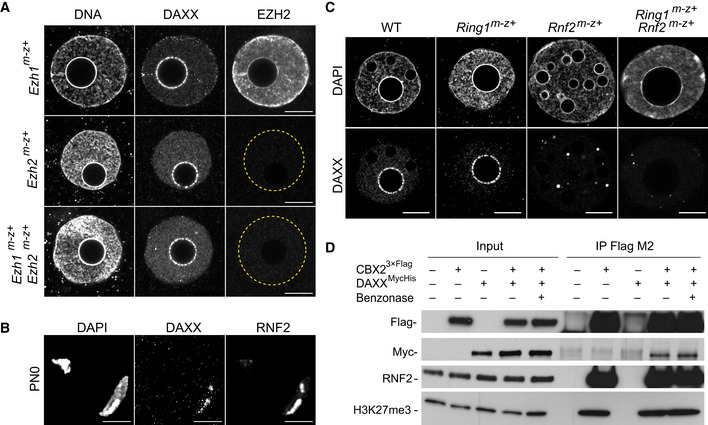
- IF of DAXX and EZH2 in paternal pronuclei of Ezh1 m−z+ (n = 5), Ezh2 m−z+ (n = 3), and Ezh1 m−z+; Ezh2 m−z+ (n = 4) late zygotes. Yellow dashed circles represent the contours of the pronuclei.
- IF of DAXX and RNF2 in PN0 zygotes (n = 10).
- IF of DAXX in wild‐type (n = 30), Ring1 m−z+ (n = 12), Rnf2 m−z+ (n = 11), and Ring1 m−z+; Rnf2 m−z+ (n = 12) paternal pronuclei of PN5 zygotes.
- Anti‐Flag co‐IP of DAXXMycHis, RNF2, and H3K27me3 with CBX23×Flag from extracts of HEK293 cells in the presence or absence of benzonase, followed by immunoblot analyses for indicated antigens.
In contrast, several cPRC1 members including RNF2, CBX2, BMI1, and PHC2 co‐localize with DAXX at PCH already in decondensing sperm (Fig 2B) (Puschendorf et al, 2008). To test for possible genetic interactions, we generated zygotes maternally deficient for Rnf2 and/or the Ring1 paralog (Posfai et al, 2012). Indeed, we observed loss of DAXX from pat‐PCH in zygotes lacking either RNF2 or both RNF2 and RING1 (Fig 2C).
In mouse zygotes, CBX2 controls cPRC1 targeting to pat‐PCH (Tardat et al, 2015). To investigate the biochemical association of DAXX with CBX2‐PRC1 components, we performed co‐immunoprecipitation (co‐IP) experiments with extracts prepared from HEK293 cells expressing DAXXMycHis and CBX23×Flag proteins. We found that CBX23×Flag co‐immunoprecipitated with DAXXMycHis and endogenous RNF2, even in the presence of benzonase, excluding a role for RNA or chromatin in these interactions (Fig 2D). CBX23×Flag also immunoprecipitated H3K27me3, likely reflecting the interaction with the chromodomain of CBX2 as demonstrated previously (Tardat et al, 2015). Together, these results reveal a novel association of cPRC1 with DAXX that controls targeting of DAXX to chromatin.
The cPRC1 subunit CBX2 targets DAXX to chromatin
To determine whether CBX2, as part of cPRC1, can target DAXX to other loci in the genome, we co‐expressed DAXXMycHis with human full‐length CBX2 (CBX2.1), N‐terminally tagged with a GAL4 DNA‐binding domain in HEK2935xUAS cells which carry a single copy of the 5xUAS‐luciferase reporter gene (Stielow et al, 2008). We performed chromatin immunoprecipitation assays (ChIP) to measure protein occupancies at the 5xUAS site (Fig 3A and B). We measured robust enrichment of RNF2, DAXXMycHis, and H3.3 when co‐expressing GAL4DBDCBX2.1 (Fig 3C), showing that CBX2 enables H3.3 deposition via targeting DAXX to chromatin.
Figure 3. CBX2‐cPRC1‐dependent targeting of DAXX to Polycomb regulated genes in human cells.
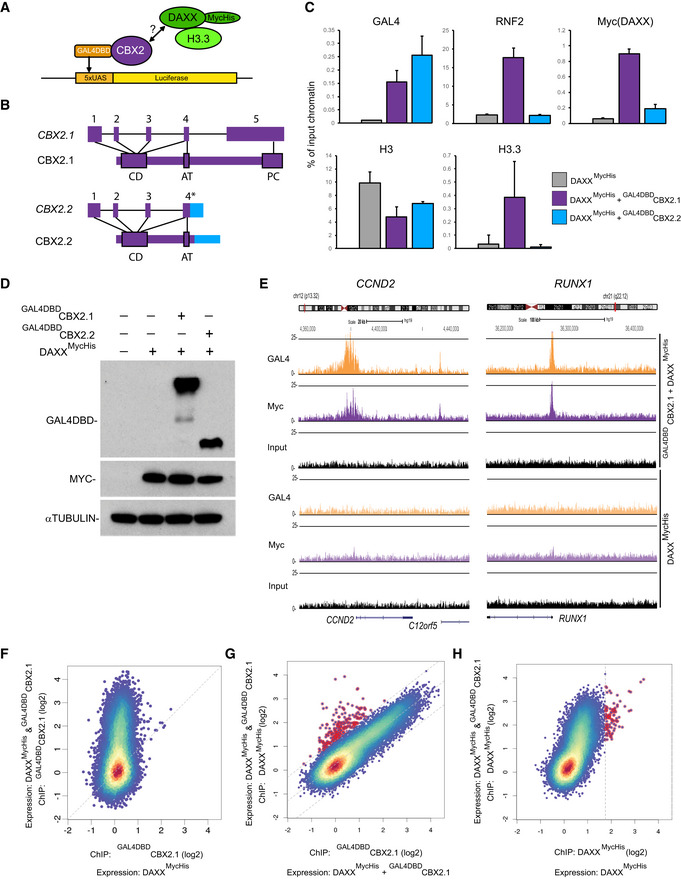
- Cartoon displaying recruitment of DAXXMycHis by GAL4DBDCBX2 (CBX2.1 or CBX2.2) to a 5 × UAS site integrated in the first intron of the NCOA5 gene in HEK2935xUAS cells.
- Schematic diagram of CBX2.1 and CBX2.2 human isoform genes and proteins. *Highlights the alternative chimeric exon 4.
- Occupancy (% of IP‐ed DNA/input DNA) of GAL4DBDCBX2, RNF2, DAXXMycHis, H3.3, and H3 proteins at 5 × UAS site as measured by ChIP‐qPCR of chromatin from HEK2935xUAS cells. Data are means ± SEM (n = 3).
- Immunoblots for the indicated proteins in HEK2935xUAS cells from (C).
- ChIP‐seq analysis of HEK2935xUAS cells expressing full‐length GAL4DBDCBX2.1 and DaxxMycHis showing CBX2.1‐dependent recruitment of DAXX to promoters of CCND2 and RUNX1 genes.
- ChIP‐seq analysis of GAL4DBDCBX2.1 occupancy in HEK2935xUAS cells expressing DAXXMycHis (x‐axis) or GAL4DBDCBX2.1 and DAXXMycHis (y‐axis), showing (log2) enrichment for GAL4DBDCBX2.1 at many TSSs (± 1 kb) in cells expressing the CBX2.1 protein (y‐axis).
- ChIP‐seq analysis of GAL4DBDCBX2.1 versus DAXXMycHis occupancy in HEK2935xUAS cells expressing GAL4DBDCBX2.1 and DAXXMycHis, revealing very comparable enrichment levels (log2) of both proteins at TSSs. TSSs highlighted in red show enrichment with anti‐Myc antibody independently of GAL4DBDCBX2.1 occupancy.
- ChIP‐seq analysis of DAXXMycHis occupancy in HEK2935xUAS cells expressing DAXXMycHis (x‐axis) versus GAL4DBDCBX2.1 and DAXXMycHis (y‐axis) showing strong enrichment (log2) for DAXXMycHis at many TSSs of genes, but only when both proteins are expressed (y‐axis), indicating that CBX2.1 targets DAXX to chromatin. TSSs highlighted in red show enrichment with anti‐Myc antibody independently of GAL4DBDCBX2.1 occupancy.
Source data are available online for this figure.
To investigate which domains of CBX2 are required for DAXX recruitment, we co‐expressed DAXXMycHis with CBX2.2, a shorter, natural splice isoform of human CBX2 (Völkel et al, 2012), that contains the N‐terminal chromo domain and the AT hook of CBX2.1, yet harbors a different C‐terminus. CBX2.2 lacks most of the middle region and C‐terminus of CBX2.1 including the Pc‐Box, a sequence known to mediate interactions with other cPRC1 components (Fig 3B) (Schoorlemmer et al, 1997). Though both GAL4DBDCBX2.1 and GAL4DBDCBX2.2 proteins were similarly expressed and showed robust enrichment at the 5x‐UAS site, the truncated CBX2.2 failed to recruit RNF2 or DAXX, or to mediate H3.3 incorporation (Fig 3C and D). These data argue that DAXX directly interacts with the middle to C‐terminal parts of CBX2.1 or with other cPRC1 complex members, bound via its Pc‐Box. To investigate these possibilities, we performed ChIP assays for CBX7, a CBX2 homolog sharing sequence similarity only in the CD and the Pc‐Box (Fig EV2A). As compared to GAL4DBDCBX2.1, we measured comparably low enrichment values for DAXXMycHis at the 5‐UAS site when expressing either GAL4DBDCBX7 or GAL4DBDCBX2.2, though both proteins themselves were enriched at the site (Fig EV2B). In co‐IP experiments, as compared to CBX2, we observed only weak interactions between DAXXMycHis and CBX7 or with RYBP, a core component of the variant PRC1 complex (Garcia et al, 1999; Gao et al, 2012) (Fig EV2C). These results indicate that amino acids unique to CBX2.1, located between the AT hook and the Pc‐Box, enable DAXX recruitment to chromatin.
Figure EV2. CBX2‐dependent targeting of DAXX to PRC1 target genes.
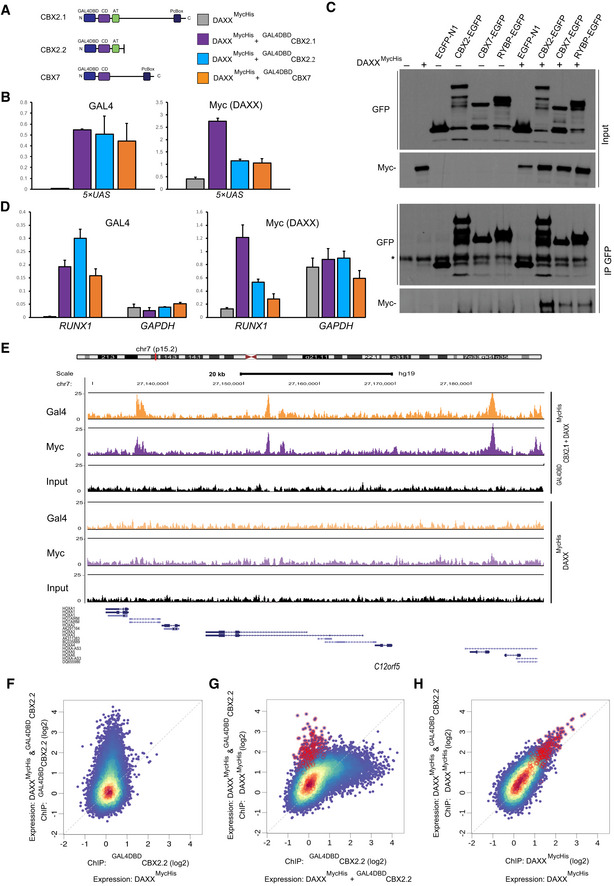
- Left: Schematic diagrams of hCBX2.1, hCBX2.2, and mCBX7 proteins illustrating location of functional domains. Right: legend for panels (B and D).
- ChIP‐qPCR analyses of chromatin isolated from HEK2935xUAS cells expressing either the full‐length GAL4DBDCBX2.1, the short isoform GAL4DBDCBX2.2, or GAL4DBDCBX7 in combination with DAXXMycHis show that DAXX is efficiently recruited by CBX2.1 to the 5xUAS site, while CBX2.2 and CBX7 are inefficient. Data are means ± SEM (n = 3).
- Co‐immunoprecipitation of DAXXMycHis with CBX2‐EGFP, CBX7‐EGFP, or RYBP‐EGFP proteins expressed in HEK293T cells. DAXXMycHis was more efficiently recovered with CBX2‐EGFP.
- ChIP‐qPCR analyses of chromatin isolated from HEK2935xUAS cells expressing either the full‐length GAL4DBDCBX2.1, the short isoform GAL4DBDCBX2.2, or GAL4DBDCBX7 in combination with DAXXMycHis show that DAXX is efficiently recruited by CBX2.1 to the promoter of RUNX1, while CBX2.2 and CBX7 are inefficient. Data are means ± SEM (n = 3).
- Browser plot showing occupancy for Gal4DBDCBX2.1 and DAXXMycHis proteins along the HOXA cluster genes in the genome of HEK2935xUAS cells expressing the proteins indicated on the right.
- ChIP‐seq analysis of GAL4DBDCBX2.2 occupancy in HEK2935xUAS cells expressing DAXXMycHis (x‐axis) versus GAL4DBDCBX2.2 and DAXXMycHis (y‐axis) showing (log2) enrichment for GAL4DBDCBX2.2 only at a few TSSs (± 1 kb) in cells expressing the CBX2.2 protein (y‐axis).
- ChIP‐seq analysis of GAL4DBDCBX2.2 versus DAXXMycHis occupancy in HEK2935xUAS cells expressing GAL4DBDCBX2.2 and DAXXMycHis, revealing poor correlation between enrichment levels (log2) of both proteins at TSSs. TSSs highlighted in red show enrichment with anti‐Myc antibody independently of GAL4DBDCBX2.2 occupancy.
- ChIP‐seq analysis of DAXXMycHis occupancy in HEK2935xUAS cells expressing DAXXMycHis (x‐axis) versus GAL4DBDCBX2.2 and DAXXMycHis (y‐axis) showing largely comparable enrichment (log2) for DAXXMycHis at TSS of few genes, irrespective whether CBX2.2 is expressed (y‐axis), indicating that CBX2.2 does not target DAXX to chromatin. TSSs highlighted in red show enrichment with anti‐Myc antibody independently of GAL4DBDCBX2.2 occupancy.
Source data are available online for this figure.
CBX2 mediates DAXX targeting genome‐wide
In HEK293 cells, endogenous CBX2 localizes to cPRC1 target genes (Gao et al, 2012). To address whether CBX2.1‐mediated DAXX targeting could represent a general mechanism, we performed ChIP‐sequencing analyses in HEK2935xUAS expressing both DAXXMycHis and GAL4DBDCBX2.1. We observed strong co‐occupancy for CBX2.1 and DAXX at cPRC1 target genes like CCND2 and RUNX1 (Fig 3E) which we confirmed by ChIP‐PCR (Fig EV2D). Further global analysis revealed uniform co‐occupancy of DAXXMycHis and GAL4DBDCBX2.1 at the TSS of many genes in a CBX2.1‐dependent manner (Figs 3F–H and EV2E). In contrast, TSS occupancy levels of the shorter splice variant GAL4DBDCBX2.2 protein were lower compared to those of the full‐length GAL4DBDCBX2.1 protein suggesting local stabilization of the CBX2.1 protein by interaction with other PRC1 components (Figs 3F and EV2F). Moreover, CBX2.2 failed to recruit DAXX to such targets (Fig EV2G).
We also observed enrichments of the anti‐MYC antibody in narrow peaks in the absence of exogenous CBX2.1 or CBX2.2 expression (red dots in Figs 3G and H, and EV2G and H). Further comparison to data from independent ChIP‐sequencing studies for the transcription factor MYC shows that such TSSs are bound by MYC in different cell types, suggesting reactivity of the anti‐MYC antibody to endogenously expressed MYC protein in HEK293 cells (ENCODE Project Consortium, 2012).
DAXX targeting to pat‐PCH requires its SUMO‐interacting motifs
DAXX contains two conserved SIMs, enabling binding to SUMOylated proteins, such as PML (Fig EV3A) (Lin et al, 2006; Santiago et al, 2009; Morozov et al, 2017). To study the role of SUMOylation in paternal heterochromatin formation, we performed IF for SUMO modifications in zygotes. While we failed to detect SUMO1 at PCH, we observed, in both early and late zygotes, enrichment for SUMO2/3 at pat‐PCH but not mat‐PCH. The SUMO2/3 signal co‐localized with CBX2 and ATRX (Figs 4A and EV3B). To investigate the relevance of SUMOylated protein recognition in DAXX targeting to pat‐PCH, we generated a DAXX mutant protein lacking both SIMs (DAXX ΔSIM1/2). As expected, this mutant did not localize to PML/SUMO2 foci in mouse ES cells compared to the wild‐type DAXX protein (Fig EV3C). When expressed in HEK2935xUAS cells, DAXXΔSIM1/2 binding to the 5xUAS site was strongly decreased compared to wild‐type DAXX, despite the presence of GAL4DBDCBX2.1 (Fig 4B). Since both wild‐type and mutant DAXX were expressed at similar levels (Fig EV3D), these results suggest that DAXX SIM domains are required for efficient chromatin targeting by CBX2‐containing cPRC1. Enrichment of DAXXΔSIM1/2 to canonical CBX2 target genes such as CCND2 and RUNX1 was also reduced, albeit to a lower extent possibly due to other interactions with endogenous and chromatin factors bound to these loci (Fig EV3E).
Figure EV3. SUMO‐dependent targeting of DAXX to subnuclear regions and PRC1 target genes, and characterization of Daxx maternally deficient zygotes.
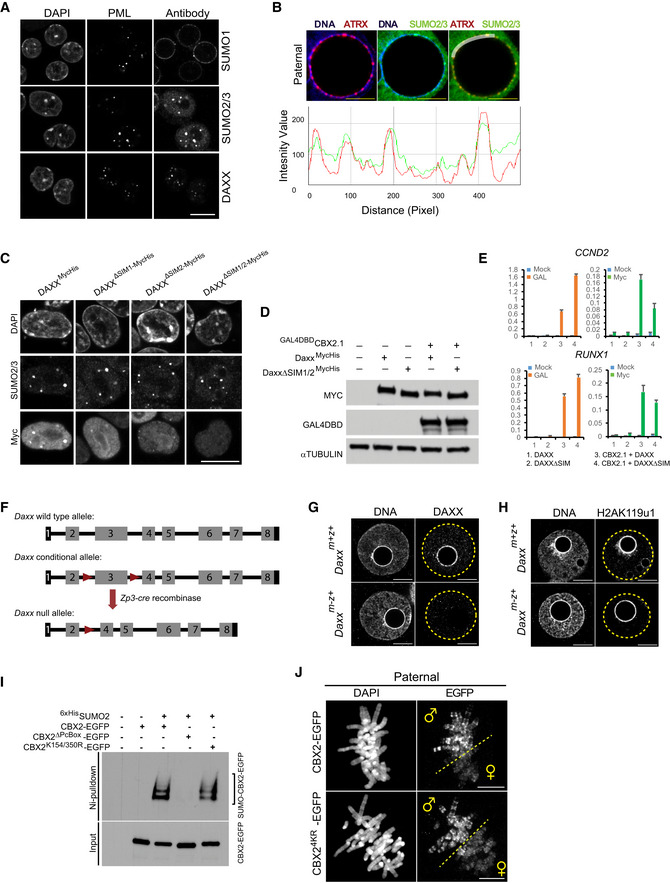
- IF co‐localization of DAXX and SUMO1 or SUMO2/3 at PML bodies in wild‐type mouse embryonic stem cells (mESCs).
- Top: IF co‐localization of SUMO2/3 and ATRX on pat‐PCH in WT PN5 zygotes (n = 14). Bottom: Fluorescence intensity profiles of SUMO2/3 and ATRX along white line in top panel at pat‐PCH of zygotes. Scale bar, 5 μm.
- IF detection of SUMO2/3 and wild‐type and mutant Myc‐tagged DAXX proteins in mESCs. Mutations in both SUMO‐interacting motifs (SIM) abrogate co‐localization of DAXX with SUMO2/3‐labeled PML bodies.
- ChIP‐qPCR analyses of chromatin isolated from HEK2935xUAS cells expressing either the full‐length DAXXMycHis or DAXXMycHis without SIM domains in combination with GAL4DBDCBX2.1 show that DAXX is efficiently recruited by CBX2.1 to the promoter of CCND2 and RUNX1, while DAXXΔSIM1/2 is inefficient. Data are means ± SEM (n = 3).
- Schematic diagram of Daxx wild‐type, floxed, and mutant alleles. Zp3‐cre‐mediated excision of exon 3 will induce a progressive depletion of DAXX protein in growing oocytes.
- IF detection of DAXX in paternal pronuclei of wild‐type (n = 16) and Daxx m−z+ zygotes (n = 19). Yellow dashed circles represent the contours of the pronuclei.
- IF detection of H2AK119 monoubiquitination (H2AK119ub1) in paternal pronuclei of wild‐type (n = 28) and Daxx m−z+ (n = 21) zygotes, demonstrating no change in PRC1‐catalyzed H2AK119ub1 at PCH (Tardat et al, 2015). Yellow dashed circles represent the contours of the pronuclei.
- Ni‐pulldown of 6xHisSUMO2‐conjugated proteins from HEK293 extracts transiently expressing either wild‐type, CBX2 with Polycomb box mutation (Pc‐Box) or CBX2.1 with K154R and K350R substitutions. CBX2 and SUMO2‐conjugated CBX2 were detected with an anti‐GFP antibody.
- IF detection of EGFP‐tagged proteins shows that CBX24KR‐EGFP binds to condensed paternal metaphase chromosomes during the first cleavage division in zygotes as CBX2‐EGFP does. The dashed line separates the chromosomes of paternal and maternal origins.
Figure 4. SUMOylation of CBX2 mediates DAXX targeting to pat‐PCH .
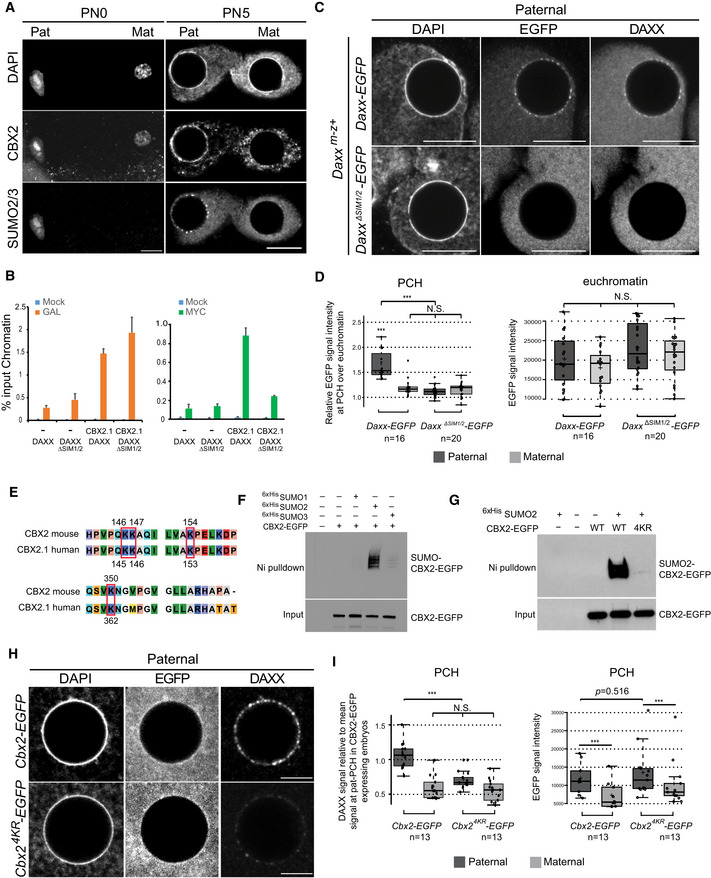
- IF of CBX2 and SUMO2/3 in PN0 (n = 10) and PN5 (n = 12) zygotes.
- ChIP‐qPCR analyses of HEK2935xUAS cells co‐expressing GAL4DBDCBX2.1 either with DAXXMycHis or DAXXΔSIM1/2MycHis. Data are means ± SEM (n = 3).
- IF of EGFP and DAXX in Daxx m−z+ PN5 zygotes microinjected with Daxx‐EGFP or DaxxΔSIM1/2‐EGFP mRNA (100 ng/μl).
- Left: Boxplot displaying EGFP signal intensities at PCH relative to euchromatin in Daxx m−z+ zygotes microinjected with Daxx‐EGFP or DaxxΔSIM1/2‐EGFP mRNA. Right: Boxplot displaying signal intensity of EGFP at euchromatin in same samples. In boxplots, the enter lines show the medians; box limits indicate the 25th and 75th percentiles as determined by R software; and whiskers extend 1.5 times the interquartile range from the 25th and 75th percentiles. Datapoints are indicated by circles. Experiments were replicated three times. ***P < 0.001, N.S.: no statistical difference, P > 0.05, t‐test.
- Sequence alignment of mouse and human CBX2 proteins with SUMO sites indicated.
- Ni‐pulldown of 6xHisSUMO1/2/3‐conjugated proteins from HEK293 extracts expressing 6xHis‐tagged SUMO1, SUMO2, or SUMO3 in combination with CBX2‐EGFP. CBX2 and SUMO‐conjugated CBX2 were detected with an anti‐GFP antibody.
- Ni‐pulldown of 6xHis‐SUMO2‐conjugated proteins from HEK293 extracts transiently co‐expressing 6xHis‐SUMO2 with CBX2‐EGFP or CBX24KR‐EGFP. Detection of CBX2 as in (F).
- IF of DAXX and EGFP in wild‐type PN5 zygotes, microinjected with Cbx2 or Cbx2 4KR ‐EGFP mRNA (100 ng/μl).
- Left: Boxplot displaying signal intensity of DAXX at PCH relative to mean intensity at pat‐PCH in wild‐type zygotes microinjected with Cbx2 or Cbx2 4KR ‐EGFP mRNA. Right: Absolute intensities of EGFP in same samples. In boxplots, the enter lines show the medians; box limits indicate the 25th and 75th percentiles as determined by R software; and whiskers extend 1.5 times the interquartile range from the 25th and 75th percentiles. Datapoints are indicated by circles. Experiments were replicated two times. ***P < 0.001, t‐test.
To determine whether the SIMs of DAXX are required for targeting to pat‐PCH in early embryo as well, we performed genetic complementation experiments in which we expressed exogenous DAXX or DAXXΔSIM1/2, translated from microinjected mRNAs, in newly generated Daxx conditionally deficient embryos, lacking maternal Daxx (Daxx m−z+) expression (Fig EV3F). While DAXX protein was not detectable in Daxx m−z+ zygotes, cPRC1‐catalyzed H2AK119ub1 levels at pat‐PCH were unaltered showing that Daxx m−z+ deficiency does not abrogate cPRC1 targeting and catalytic function (Fig EV3G and H). As expected, exogenously provided DAXX‐EGFP localized at pat‐PCH in Daxx m−z+ zygotes in a manner comparable to that of endogenous protein in wild‐type zygotes (Figs 1, 4C and EV1G). In contrast, DAXXΔSIM1/2‐EGFP failed to localize to pat‐PCH despite being properly expressed in zygotes (Fig 4C and D), arguing that SUMOylation of a pat‐PCH‐associated protein underlies DAXX recruitment.
SUMO2‐modification of CBX2 drives DAXX binding to pat‐PCH
CBX2 has been identified as a SUMO2‐modified protein in human cells (Hendriks et al, 2014; Lamoliatte et al, 2014; Tammsalu et al, 2014). Sequence comparison shows that lysines K146, K153, and K362, which are SUMOylated in human CBX2, are conserved in the mouse protein (Fig 4E). To study SUMOylation of mouse CBX2, we purified 6xHis‐tagged SUMO‐conjugated proteins from HEK293 cells co‐expressing mouse CBX2 fused to EGFP. We show that mouse CBX2‐EGFP is indeed conjugated to SUMO2, but not SUMO1 or SUMO3 (Fig 4F). In contrast, CBX2 lacking the Pc‐Box, required for the interaction of CBX2 with RNF2 and other cPRC1 components, failed to become SUMOylated (Fig EV3I), suggesting that incorporation of CBX2 in Polycomb complexes is required for its SUMOylation. Sequence analysis of mouse CBX2 using SUMOylation prediction software suggested additional putative SUMOylated sites (Fig 4E) (Zhao et al, 2014). Thus, we tested combinations of lysine to arginine point mutations at several predicted SUMOylated lysines in mouse full‐length CBX2. Mutation of at least four lysines (K146R, K147R, K154R, and K350R, referred to as CBX24KR) was required to reduce significantly SUMO2 levels on CBX2 in vitro (Figs 4G and EV3I).
In wild‐type zygotes, exogenously expressed CBX24KR‐EGFP was bound to pat‐PCH (Fig 4H and I) and along paternal mitotic chromosomes of the first cleavage division in a similar manner as CBX2‐EGFP (Fig EV3J) (Puschendorf et al, 2008), indicating that mutation of the four lysines did not impair CBX2 binding to paternal chromatin. In contrast, recruitment of endogenous DAXX to pat‐PCH was impaired in these conditions arguing for a dominant negative effect of exogenous CBX24KR‐EGFP over endogenous CBX2 in zygote embryos (Fig 4H and I). Together, these data demonstrate that (i) mouse full‐length CBX2 is a genuine SUMO2 substrate, (ii) SUMOylation of CBX2 requires its interaction with RNF2 and possibly other cPRC1 members, and (iii) SUMO2 on CBX2 mediates targeting of DAXX to pat‐PCH.
The H3K9me3/HP1 pathway prevents DAXX/CBX2‐PRC1 targeting at maternal PCH
When compared to pat‐PCH, DAXX is only weakly associated with mat‐PCH despite robust localization of ATRX (Fig 1B). This is surprising given the efficient recruitment of DAXX by ATRX to H3K9me3‐modified chromatin at satellite and telomeric sequences in somatic cells (Lewis et al, 2010; Hoelper et al, 2017). Previously, we demonstrated that maternal deficiency of Suv39h2 or Hp1β, causing a loss of H3K9me3 and/or of HP1β localization at mat‐PCH, resulted in the recruitment of the CBX2‐containing canonical PRC1 complex to mat‐PCH (Puschendorf et al, 2008; Tardat et al, 2015). Here, we show that DAXX becomes abundantly localized to mat‐PCH in late zygote embryos of both mouse mutants as well, mimicking the dotted “pearls on a string” pattern as seen at pat‐PCH in wild‐type zygotes, downstream of CBX2 recruitment (Fig 5A and B). Similarly, ATRX co‐localized with DAXX at mat‐PCH in the “pearls on a string” configuration in both mutants, suggesting DAXX‐dependent recruitment. Next, we tested the impact of the CBX2F12A‐EGFP mutant protein on DAXX localization (Tardat et al, 2015). The F12A mutation in the aromatic cage of the CD of CBX2 enables the neighboring AT hook to efficiently bind to AT‐rich major satellite sequences even in the presence of H3K9me3 and HP1β, thus overcoming the steric hinderance imposed by the CD of CBX2 (Tardat et al, 2015). Expression of CBX2F12A‐EGFP in wild‐type zygotes induced a strong enrichment of DAXX at mat‐PCH, also in a dotted pattern, despite the presence of HP1β (Fig 5C). Therefore, these results indicate that the CBX2/cPRC1 → SUMO2 → DAXX → ATRX recruitment pathway even functions in a H3K9me3/HP1β chromatin environment. It further indicates that DAXX recruitment via the H3K9me3/Hp1β → ATRX → DAXX pathway is inefficient in early embryos. These data argue for different modes of interactions between the ATRX and DAXX proteins and/or possible regulation thereof in the two pathways.
Figure 5. CBX2 and the Suv39h/Hp1 pathway control DAXX targeting to pat‐PCH in mouse zygotes.
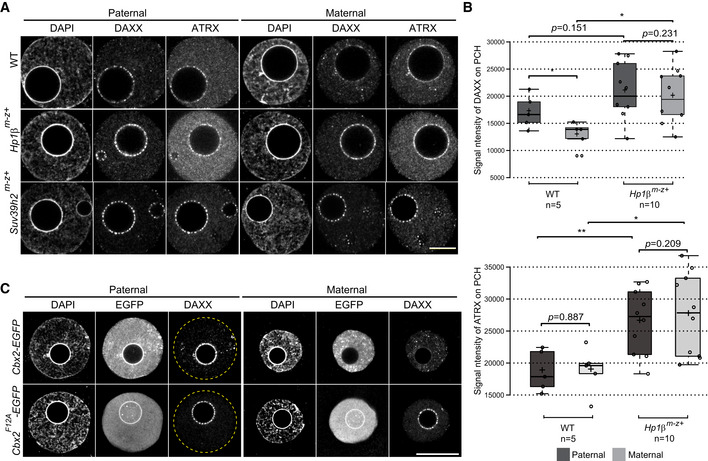
- IF of DAXX and ATRX in PN5 stage pronuclei of wild‐type (n = 19), Hp1β m−z+ (n = 10), and Suv39h2 m−z+ (n = 9) zygotes.
- Boxplots displaying signal intensities of DAXX or ATRX at pat‐ and mat‐PCH in wild‐type (n = 5) and Hp1β m−z+ (n = 10) mouse zygotes at PN5. In boxplots, the enter lines show the medians; box limits indicate the 25th and 75th percentiles as determined by R software; and whiskers extend 1.5 times the interquartile range from the 25th and 75th percentiles. Datapoints are indicated by circles. Experiments were replicated two times. *P < 0.05, **P < 0.01, t‐test.
- IF of DAXX in PN5 stage pronuclei of zygotes expressing CBX2‐EGFP (n = 9) or CBX2F12A‐EGFP (n = 17). mRNAs (100 ng/μl) were injected into mouse PN2 stage zygotes. Yellow dashed circles represent the contours of the pronuclei.
DAXX and CBX2‐PRC1 ensure stability of major satellite repeats of pat‐PCH
Daxx has been implicated in controlling expression of genes and repetitive sequences and in nuclear organization in ESCs and differentiated cells (Drane et al, 2010; Rapkin et al, 2015; Hoelper et al, 2017). To address the role of DAXX in early embryogenesis, we generated embryos lacking either maternal (Daxxm‐z+)or maternal and zygotic expression of Daxx (Daxx m−z−), by crossing conditional Daxx F/F; Zp3‐cre females with heterozygous Daxx +/− males (Fig EV3F) (Michod et al, 2012). Daxx m−z− deficiency resulted in major impairment of pre‐implantation development, starting at the 8‐cell stage and reducing the efficiency of blastocyst development by 50% (Fig 6A). The developmental impairment correlated well with major defects in chromosome segregation, cytokinesis, and occurrence of endo‐reduplication in Daxx m−z− morulae and blastocysts (Fig 6B and C). In contrast, Daxx m−z+ embryos developed normally to the blastocyst stage. This finding is consistent with an enrichment of DAXX at pericentromeric chromocenters in Daxx m−z+ 4‐cell stage embryos (Fig EV4A), arguing for a rescue of the developmental phenotype by expression of the paternal Daxx allele.
Figure 6. DAXX and PRC1 control nucleosome density and chromatin stability at pat‐PCH and chromosome segregation in early mouse embryos.
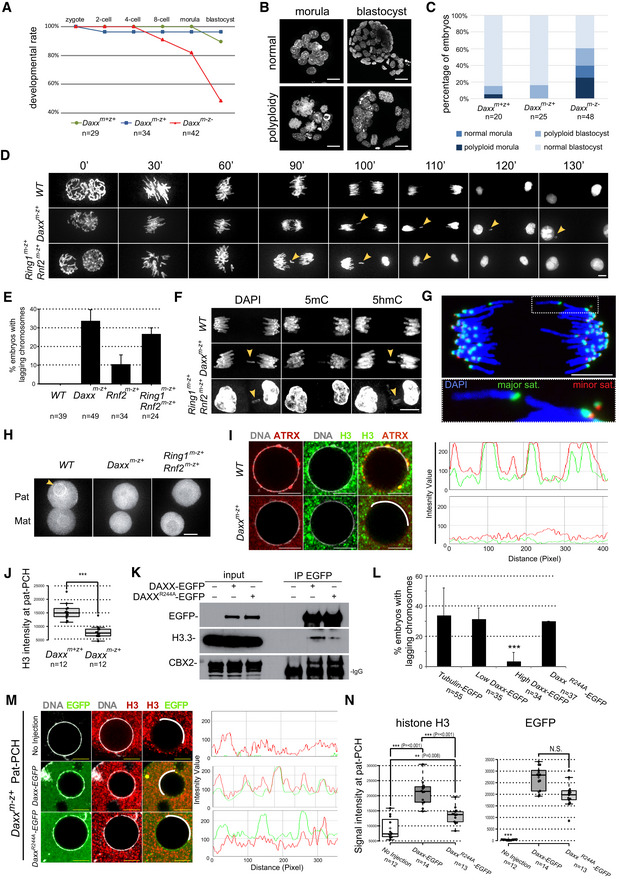
- Developmental progression of Daxx m+z+, Daxx m−z+, and Daxx m−z− early embryos.
- Examples of morula and blastocyst embryos with normal and large polyploid nuclei.
- Percentages of embryos with normal or polyploid nuclei.
- Still images of time‐lapse imaging of the first cleavage division in wild‐type and maternally deficient zygotes expressing H2B‐mCherry. Time points represent minutes after prometaphase. Lagging chromosomes and micronuclei are indicated by yellow arrowheads.
- Percentage of zygotes with lagging chromosomes during 1st cleavage division. Data represent mean ± SEM in n ≥ 3 replicate experiments.
- IF of 5‐methylcytosine and 5‐hydroxymethylcytosine staining of wild‐type (n = 42), Daxx m−z+ (n = 14) and Ring1 m−z+; Rnf2 m−z+ (n = 6) zygotes with lagging chromosomes. Yellow arrowheads indicate lagging chromosomes.
- DNA FISH for major (green) and minor (red) satellites on cleavage chromosomes of a Daxx m−z+ zygote with a chromosome broken within the major satellite region.
- H3.3‐EGFP live‐imaging signal in pat‐ and mat‐PCH of control Daxx m+z+ (n = 18), Daxx m−z+ (n = 8), and Ring1 m−z+; Rnf2 m−z+ (n = 12) zygotes. Scale bar, 10 μm.
- Left: IF of endogenous H3 and ATRX at pat‐PCH in control and Daxx m−z+ PN5 zygotes. Right: Fluorescence intensity profiles of H3 and ATRX along white line in left panel at pat‐PCH of zygotes. Scale bars, 5 μm.
- Boxplot displaying H3 signal intensity at pat‐PCH of Daxx m+z+ and Daxx m−z+ PN5 zygotes. In boxplots, the enter lines show the medians; box limits indicate the 25th and 75th percentiles as determined by R software; and whiskers extend 1.5 times the interquartile range from the 25th and 75th percentiles. Datapoints are indicated by circles. Experiments were replicated two times. ***P < 0.001, t‐test, n = 12 for both groups.
- IP of DAXX‐EGFP and DAXXR244A‐EGFP proteins with an anti‐GFP antibody from nuclear extract of HEK293 cells. Immunoblot detection was performed with antibodies recognizing GFP, histone variant H3.3 and CBX2.
- Percentage of Daxx m−z+ zygotes with lagging chromosomes following injection of Tubulin‐EGFP, Daxx‐EGFP, or Daxx R244A ‐EGFP mRNAs (20 or 100 ng/μl) at PN2/3 stage. Data represent mean ± SEM (n ≥ 2 injection experiments). ***P < 0.001 high Daxx‐EGFP versus other three groups; Fisher's exact test (on pooled embryos).
- Left: IF of EGFP and endogenous H3 at pat‐PCH in Daxx m−z+ PN5 zygotes expressing DAXX‐EGFP or DAXXR244A‐EGFP or nothing exogenously. Right: Fluorescence intensity profiles of H3 and EGFP along white lines in left panels at pat‐PCH of zygotes. Scale bars, 5 μm.
- Boxplot displaying 3D quantification of H3 signal intensity at pat‐PCH in Daxx m−z+ zygotes expressing exogenous DAXX‐EGFP (n = 14) or DAXXR244A‐EGFP (n = 13). In boxplots, the enter lines show the medians; box limits indicate the 25th and 75th percentiles as determined by R software; and whiskers extend 1.5 times the interquartile range from the 25th and 75th percentiles. Datapoints are indicated by circles. Experiments were replicated 2–3 times. ***P < 0.001 Daxx‐EGFP versus other two groups; t‐test.
Figure EV4. Maternally Daxx deficient embryos display genome instability.
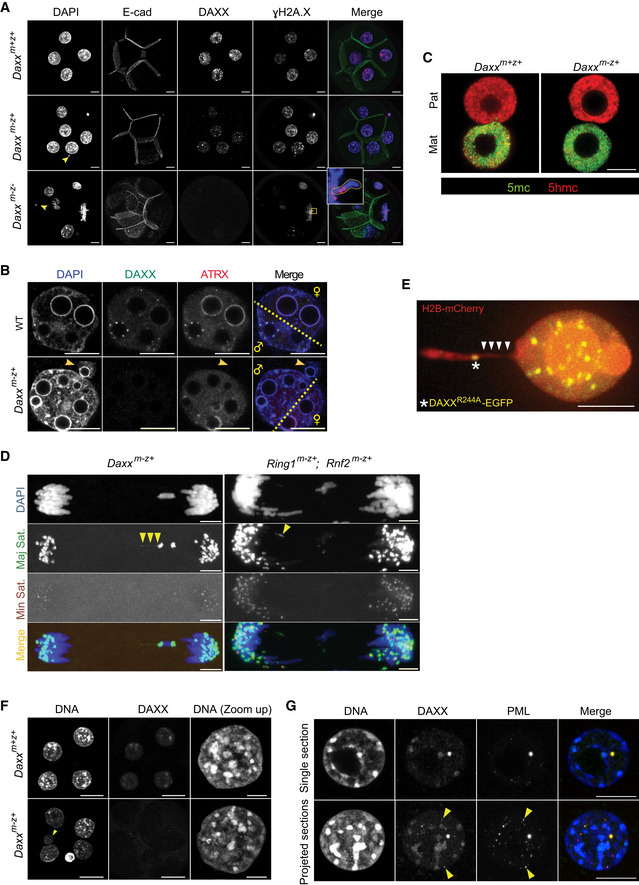
- IF detection of micronuclei and γH2A in Daxx m+z+ , Daxx m−z+, and Daxx m−z− embryos at the 4/8‐cell stage. A chromosome broken within the PCH region was stained by γH2A (yellow box). Arrowheads point to micronuclei.
- IF detection of DAXX and ATRX in wild‐type (n = 46) and Daxx m−z+ (n = 41) 2‐cell embryos showing differential localization of both proteins at pat‐ and mat‐PCH. A micronucleus in a Daxx m−z+ 2‐cell embryo lacks ATRX staining, illustrating its paternal origin (yellow arrowhead). The dashed line separates approximately the chromatin of paternal and maternal origins.
- IF detection of 5mC and 5hmC in Daxx m+z+ (n = 6) and Daxx m−z+ (n = 9) late zygotes.
- DNA FISH for major and minor satellites on cleavage chromosomes of Daxx m−z+ and Ring1 m−z+; Rnf2 m−z+ zygotes showing aberrant stretching of major satellite sequences (yellow arrowheads).
- Live imaging of Daxx m−z+ zygotes labeled with H2B‐mCherry showing stretching of proximal end of an acrocentric chromosome (white arrow heads) despite localization of exogenous DAXXR244A‐EGFP at pat‐PCH (white star).
- IF of DAXX protein in Daxx m+z+ (n = 19) and Daxx m−z+ (n = 45) 4‐cell embryos displaying normal chromocenter formation in the absence of DAXX protein. Arrowhead points to large micronucleus.
- IF staining of DAXX and PML proteins showing focal co‐localization in wt 8‐cell embryos (n = 15) (arrowheads). DAXX localizes to DAPI‐bright PCH as well.
Nonetheless, we noticed micronuclei in both Daxx m−z− and Daxx m−z+ 4‐cell embryos suggesting the occurrence of chromosomal segregation defects at earlier stages as well (Fig EV4B). To investigate the process and mechanism underlying micronuclei formation, we performed live‐imaging experiments on zygotes expressing H2B‐mCherry and Tubulin‐EGFP. We measured delays in segregation of one or more chromosomes during the first cleavage division in 33% of Daxx m−z+ embryos and 25% of Ring1 m−z+; Rnf2 m−z+ embryos lacking PRC1 expression (Fig 6D and E, Movie EV4). All lagging chromosomes or micronuclei were of paternal origin, as revealed by staining for 5‐methylcytosine and 5‐hydroxymethylcytosine as markers for parental identity (Inoue & Zhang, 2011) and by the absence of ATRX labeling at PCH in resulting micronuclei (Figs 6F and EV4B and C). To identify sequences subjected to instability, we probed by DNA fluorescence in situ hybridization (FISH) major and minor satellites demarcating pericentromeric and centromeric regions, respectively, during the metaphase‐to‐anaphase transition of the first cleavage division. All lagging chromosomes from anaphase Daxx m−z+ embryos marked for major satellites sequences lacked signals for minor satellites indicating breakage of proximal ends (Fig 6G). Both FISH and live imaging of these embryos showed indeed that major satellite sequences undergo stretching and breakage in the absence of DAXX or cPRC1 (Fig EV4D, Movie EV5). Consistently, we detected some mini‐chromosomes positive for FISH signals of major and minor satellites (Fig 6G). We also observed that lagging chromosomes and micronuclei from Daxx m−z+ embryos at the 1‐cell to 2‐cell transition stage lacked CREST staining. Altogether, these data argue that DAXX functions to ensure PCH stability of paternal chromosomes in zygotes.
DAXX controls H3.3 deposition at pat‐PCH in a PRC1‐dependent manner
Since DAXX functions as an H3.3 chaperone, we investigated whether H3.3 incorporation was altered in Daxx‐deficient embryos. Due to our inability to immuno‐label endogenous H3.3 in zygotes, we microinjected mRNA encoding for H3.3‐EGFP in both wild‐type and maternally deficient Daxx m−z+ embryos and assayed its incorporation at PCH localized around nucleolar precursor bodies in paternal pronuclei via live imaging. We observed a clear reduction of H3.3‐EGFP fluorescence signal at such sites in embryos maternally deficient for Daxx or for Ring1 and Rnf2 (Fig 6H; [Link], [Link], [Link]). These data show that DAXX mediates H3.3 incorporation at pat‐PCH in a PRC1‐dependent manner.
DAXX‐mediated H3.3 chaperone function safeguards nucleosome density and chromosomal stability of pat‐PCH domains
Since H3.3 is the predominant histone variant deposited at pat‐PCH in early zygotes (Fig 1A) (Akiyama et al, 2011), we hypothesized that nucleosome density at pat‐PCH would be impaired in Daxx m−z+ embryos lacking local H3.3 incorporation. Indeed, we measured reduced levels of H3 and ATRX signals at pat‐PCH in Daxx m−z+ late zygote embryos compared to their wild‐type counterparts (Fig 6I and J), arguing that DAXX‐mediated H3.3 deposition is required to control nucleosome density at pat‐PCH.
To assess for a direct role of H3.3 deposition in maintaining genome integrity, we generated the R244A substitution mutation in the histone‐binding domain of mouse DAXX, which reduces its binding capacity for H3.3 (Elsasser et al, 2012). Relative to wild‐type DAXX‐EGFP, we co‐immunoprecipitated reduced amounts of endogenous H3.3 with the DAXXR244A‐EGFP mutant from HEK293 cell extracts (Fig 6K). Next, we expressed DAXX‐EGFP and DAXXR244A‐EGFP at different levels in Daxx m−z+ embryos from DNA replication onwards by microinjection of corresponding mRNAs and measured the impact on chromosome segregation. While injection of Tubulin‐EGFP or low levels of Daxx‐EGFP mRNA failed to rescue the segregation defects in the first cleavage division of Daxx m−z+ embryos, higher levels of Daxx‐EGFP were sufficient to do so. In contrast, high expression of DAXXR244A‐EGFP, despite being recruited to pat‐PCH normally, did not rescue the segregation defects (Figs 6L–N and EV4E). Quantification of total H3 IF signals revealed significantly higher levels at pat‐PCH when expressing wild‐type DAXX compared to the DAXXR244A mutant in Daxx m−z+ embryos (Fig 6M and N). We therefore conclude that DAXX‐mediated H3.3 incorporation into chromatin is essential for maintaining nucleosome density at pat‐PCH and ensuring stability of the underlying major satellite sequences during early embryonic divisions.
DAXX deficiency abrogates forward and reverse expression of major satellites
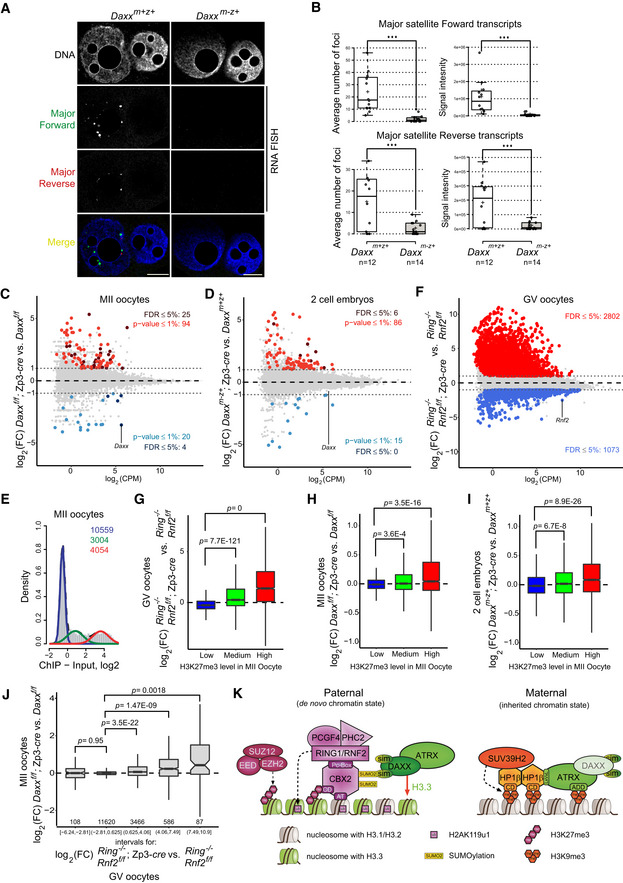
As we reported previously, PRC1 represses nascent transcription of major satellite at pat‐PCH in mouse zygotes (Puschendorf et al, 2008). To assess the role of DAXX in forward and reverse transcription of major satellites (Probst et al, 2009; Casanova et al, 2013), we performed RNA FISH with strand‐specific probes in late zygotes. Surprisingly, expression of both strands was majorly downregulated in Daxx m−z+ embryos (Fig 7A and B), showing a crucial function for DAXX and/or H3.3 deposition in enabling major satellite transcription and/or transcript retention at pat‐PCH. Moreover, these data argue for a dominant role of PRC1 and possibly H2AK119 ubiquitination over DAXX in transcriptional repression of major satellites repetitive sequences.
Figure 7. DAXX and PRC1 control nucleosome density and chromatin stability at PCH in early mouse embryos.
-
ARNA FISH of forward and reverse strand major satellite sequences in Daxx m+z+ and Daxx m−z+ PN5 zygotes. Scale bars, 10 μm.
-
BBox plots indicating the foci number (left) and total intensity (right) of forward (top) and reverse (bottom) transcription as measured by RNA FISH on 3D paternal pronuclei in Daxx m+z+ and Daxx m−z+ PN5 zygotes. In boxplots, the center lines show the medians; box limits indicate the 25th and 75th percentiles as determined by R software; and whiskers extend 1.5 times the interquartile range from the 25th and 75th percentiles. Datapoints are indicated by circles. Experiments were replicated three times. ***P < 0.001; t‐test.
-
C, DMA‐plots showing fold change (FC) (in log2) in gene expression between indicated samples as a function of averaged expression across all samples. Dotted lines indicated log2 (FC) of 1.
-
EHistogram showing classification of genes into three groups according to distribution of ChIP enrichment (log2) of H3K27me3 around TSS in MII oocytes (Liu et al, 2016).
-
FMA‐plot showing FC (in log2) in gene expression between indicated samples as a function of averaged expression across all samples. Dotted lines indicated log2(FC) of 1.
-
G–IBoxplots showing FC (log2) in gene expression between indicated samples for three groups of genes classified according to H3K27me3 enrichments (as shown in E). Lower hinge, central line, and upper hinge represent 25th, 50th (median), and 75th percentiles, respectively. Upper/lower whiskers extend to the largest/smallest values no further than 1.5*IQR from the upper/lower hinge, where IQR is interquartile range or distance between 25th and 75th percentiles. Outliers are not displayed. The notches extend 1.5*IQR/√n where n is a number of genes in each H3K27me3 class. A number of genes (n) in “Low”, “Medium”, and “High” H3K27me3 class used for boxplots are 9,824, 2,311, and 2,647, respectively. Expression changes were estimated using two or three biological replicates for each condition. Statistical significance was estimated using two‐sided t‐tests.
-
JBoxplot showing FC (log2) in gene expression between Daxx‐deficient and control MII oocytes for five groups of genes classified according to FC (log2) in gene expression between Ring1 Rnf2‐deficient and control GV oocytes. Boxplots were created similarly to (G–I), and the number of genes used for each boxplot is displayed below. Expression changes were estimated using three biological replicates for each condition. Statistical significance was estimated using two‐sided t‐tests.
-
KSchematic diagram showing molecular pathways controlling repression and chromatin integrity at paternal and maternal major satellite sequences in mouse early pre‐implantation embryos.
Source data are available online for this figure.
DAXX contributes to PRC1‐mediated gene repression in oocytes and 2‐cell embryos
To determine whether DAXX regulates gene expression during oocyte growth and zygotic genome activation in early embryos, we performed RNA sequencing on Daxx deficient and control MII oocytes as well as Daxx m−z+ and control 2‐cell embryos (Fig EV5A). Compared to control oocytes, Daxx transcripts levels were over 10‐fold reduced in Daxx mutant oocytes, with > 65% of residual transcripts lacking the floxed exon 3, showing an efficient depletion of Daxx expression. In contrast, Daxx mRNA levels were only < 2‐fold reduced in maternally deficient 2‐cell embryos, with > 65% being full length, indicating early and potent transcriptional activation of the paternal allele in Daxx m−z+ embryos (Fig EV5B), which relates to immuno‐detectable DAXX protein from the four‐cell stage onwards (Fig EV4A and B).
Figure EV5. DAXX contributes to PRC1‐ but not to Setdb1‐mediated gene repression in mouse oocytes.
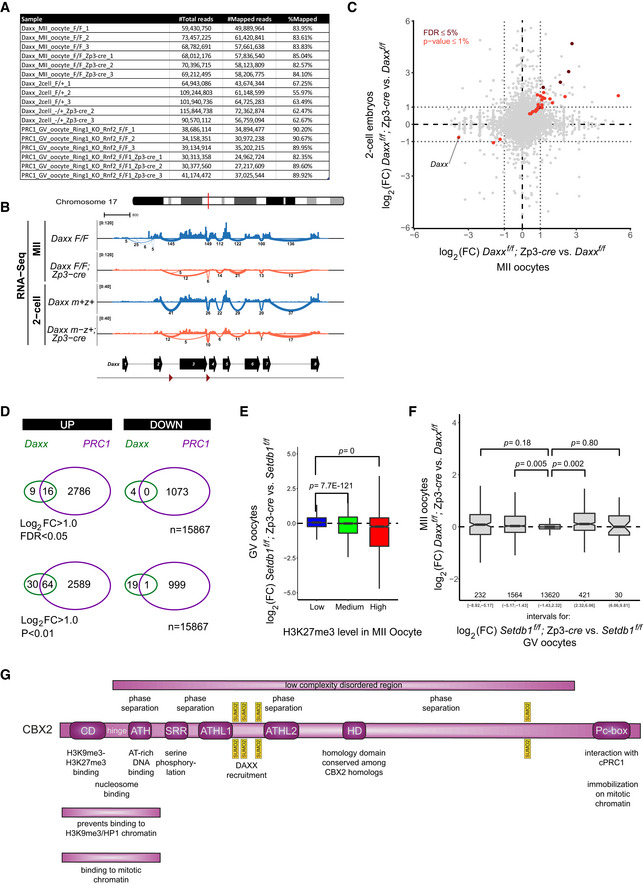
- RNA sequencing information of data presented in this study.
- Overview of RNA‐Seq datasets at the Daxx genomic locus. A genomic snapshot shows abundance of RNA‐Seq read ends summarized for genomic bins of 10 bp and normalized by total number of mapped reads in each library. Splice junctions are visualized using sashimi plots below each track where the widths of the lines correspond to normalized read counts supporting each splice junction and numbers below each line represent raw (not normalized) read counts supporting each splice junction in each sample. Splice junctions supported by less than 5 reads are not shown. Biological replicates were merged. The cartoon below the tracks illustrates the longest transcript of Daxx. The triangles below indicate the position of the loxP sites flanking exon 3 of the corresponding floxed Daxx gene allele.
- Scatter plot showing fold change (FC) (in log2) in gene expression between indicated samples. Dotted lines indicated log2 (FC) of 1.
- Venn diagrams showing overlap in genes up‐ or downregulated in Daxx‐deficient versus control MII oocytes in comparison with genes up‐ or downregulated in Ring1; Rnf2 double deficient versus control GV oocytes. Comparisons are given for two different statistical criteria.
- Boxplots showing FC (log2) in gene expression between Setdb1‐deficient versus control GV oocytes for three groups of genes classified according to H3K27me3 enrichments in WT MII oocytes (as shown in Fig 7E). Lower hinge, central line, and upper hinge represent 25th, 50th (median), and 75th percentiles, respectively. Upper/lower whiskers extend to the largest/smallest values no further than 1.5*IQR from the upper/lower hinge, where IQR is interquartile range or distance between 25th and 75th percentiles. Outliers are not displayed. The notches extend 1.5*IQR/√n where n is a number of genes in each H3K27me3 class. A number of genes (n) in “Low”, “Medium”, and “High” H3K27me3 class used for boxplots are 9824, 2311, and 2647, respectively. Expression changes were estimated using three biological replicates for each condition. Statistical significance was estimated using two‐sided t‐tests.
- Boxplot showing FC (log2) in gene expression between Setdb1‐deficient and control GV oocytes for five groups of genes classified according to FC (log2) in gene expression between Ring1 Rnf2‐deficient and control GV oocytes. Boxplots are created similarly to (E), and the number of genes used for each boxplot is displayed below. Expression changes were estimated using three biological replicates. Statistical significance was estimated using two‐sided t‐tests.
- Schematic diagram of the mouse CBX2 protein illustrating the sequence domains and their associated chromatin functions. For further explanations, see end of discussion of manuscript.
In Daxx mutant oocytes, 25 and four genes were at least twofold up‐ or downregulated, respectively (minlogFC = 1; FDR < 0.05; Figs 7C and EV5C, Table EV1). In Daxx m−z+ 2‐cell embryos, only six genes were upregulated, which may relate to clear paternal Daxx expression (minlogFC = 1; FDR < 0.05; Figs 7D and EV5B and C). Four of these genes were also upregulated in mutant oocytes, suggesting inheritance of some aberrantly expressed maternal mRNAs (Fig EV5C). To investigate whether aberrant gene expression could contribute to the chromosome instability observed in Daxx m−z+ embryos, we performed gene ontology analyses for genes differentially expressed in oocytes and embryos as identified using slightly more relaxed significance criteria (minlogFC = 1; P < 0.01; Fig 7C and D; Table EV2). We did not observe any enrichment for biological process or molecular function terms related to genome instability, chromosome segregation failure, or cell cycle for up‐ or downregulated genes. These data argue against a potential indirect transcriptional effect and support the model that maternal DAXX maintains pat‐PCH stability in embryos directly, by controlling local nucleosome density and chromatin configuration.
Intriguingly, GO terms related to development and differentiation were over‐represented among differentially expressed genes (Table EV2), possibly hinting to a function of DAXX in PRC1‐mediated gene regulation. To investigate this notion further, we calculated the occupancy of H3K27me3 around transcriptional start sites of genes in wild‐type oocytes, and classified genes as being lowly, mediumly, or highly trimethylated at H3K27 (Fig 7E) (Liu et al, 2016). As anticipated, benchmarking this chromatin classification to the transcriptional response of genes to Ring1; Rnf2 double deficiency (dko) in GV oocytes revealed a clear positive relation (Fig 7F and G) (Posfai et al, 2012). While H3K27me3 highly marked genes were majorly upregulated in PRC1 dko oocytes, H3K27me3 lowly marked genes were not (Fig 7G). Importantly, we observed a significant, positive association between upregulated gene expression in Daxx‐deficient oocytes and embryos and H3K27me3 levels in wild‐type oocytes as well, indicating a regulatory role for DAXX in Polycomb‐mediated gene repression (Fig 7H and I). Indeed, direct comparison of differential expression in Daxx‐deficient versus control MII oocytes relative to Ring1; Rnf2 dko versus control GV oocytes showed significant positive associations (Fig 7J). Genes upregulated in Ring1; Rnf2 dko oocytes were generally upregulated in Daxx mutant oocytes (Fig 7J) and vice versa (Fig EV5D) and include various transcription and signaling factors such as Ascl1, Bex3, Dlx5, Dmrt2, Lhx6, Jun, Klf12, Lmo4, Myb, Notch1, Sox2, Sox6, Tbx2, Tbx18, Tcf19, Tfec, Tle3, and Zbtb7c. Together, these results indicate that DAXX contributes to gene repression by PRC1 complexes in oocytes, plausibly by interacting with CBX2 and controlling DAXX‐mediated nucleosome deposition at PRC1‐target genes during oocyte development.
Discussion
In this study, we identify and characterize a novel chromatin pathway required for maintaining genome integrity at major satellite tandem repeats in mouse early embryos. Our work elucidates a modular “plug and play” principle in chromatin biology in which SUMOylation functions as a molecular glue that drives interactions between components of the H3K9 methylation and Polycomb pathways that to date have been considered to function separately. We demonstrate that chromatin of major satellite sequences becomes modified by SUMO2/3 shortly after fertilization and throughout the first cell cycle, in a parent‐of‐origin‐specific manner only at the paternal genome. Our biochemical and molecular genetic experiments show that CBX2, as part of canonical PRC1, is the major and functionally relevant substrate of SUMOylation at pat‐PCH. CBX2 SUMOylation drives recruitment of DAXX via its SUMO‐interacting domains (SIMs). DAXX enables H3.3 incorporation at pat‐PCH marked by cPRC1, independently or possibly in conjunction with ATRX. We unambiguously show that H3.3 deposition is essential for maintaining nucleosomal density and DNA stability at pat‐PCH. We also demonstrate that DAXX contributes to repression of genes silenced by PRC1 in oocytes and 2‐cell embryos. These data suggest a modulatory function of the novel CBX2/cPRC1 → SUMO2 → DAXX → H3.3 deposition module in Polycomb gene silencing (Fig 7K).
The asymmetry in heterochromatic states at pat‐PCH and mat‐PCH within one cell is remarkable. While on the maternal genome a H3K9me3 state is inherited from the oocyte and maintained in the embryo, a canonical PRC1 state linked to DAXX‐mediated H3.3 deposition is newly formed at pat‐PCH due to the absence of H3K9me3 in sperm‐derived chromatin (Puschendorf et al, 2008; Tardat et al, 2015). Here, cPRC1 is initially recruited via the binding of CBX2 to AT‐rich major satellite sequences (Tardat et al, 2015). This interaction is further strengthened via the interaction of CBX2 with de novo PRC2‐mediated H3K27me3 established during the S and G2 phases of the zygote cell cycle (Albert & Peters, 2009; Tardat et al, 2015). Though lysine 27 of H3.3 and its methylation was suggested to be directly required for heterochromatin formation in early embryos (Santenard et al, 2010), we show here that PRC2 and therefore de novo H3K27me3 at pat‐PCH are not critical to DAXX recruitment (and thus H3.3 deposition) to pat‐PCH. PRC2 is also superfluous for PRC1 recruitment to pat‐PCH (Puschendorf et al, 2008). The developmental defects induced by exogenous H3.3K27R (Santenard et al, 2010) likely relate to the interference of other H3.3K27 functions, such as regulating genome activation by lysine 27 acetylation (Dahl et al, 2016).
It remains to be determined which factors control the target specificity of SUMOylation at paternal and maternal PCH in early embryos. The basic machinery for this is available as the genes encoding SUMO E1‐activating enzymes Uba2 and Sae1, the E2‐conjugating enzyme Ube2i (encoding for UBC9), and three Sumo1, Sumo2, and Sumo3 and several sentrin/SUMO‐specific proteases (Senp), removing SUMOylation, are expressed in oocytes and early embryos (Fig EV1D) (Kang et al, 2010). The identity of the E3 ligase for CBX2 is unclear. It is highly unlikely to be the Polycomb protein Pc2 (CBX4), a paralog of CBX2 and E3 SUMO1 ligase for the transcriptional repressor CtBP and the kinase HIPK2 (Kagey et al, 2003), since Cbx4 is not expressed during oogenesis and in zygote stage embryos (Fig EV1D). In contrast, four E3 SUMO ligases belonging to the Pias gene family are all expressed at these stages (Fig EV1D). Importantly, in mouse fibroblasts the H3K9me3 HMT SUV39H1 (but not its paralog SUV39H2), functioning as an E3 SUMO1 ligase for HP1 proteins, and the SUMO protease SENP7 regulate HP1α targeting to canonical H3K9me3/HP1 constitutive heterochromatin (Maison et al, 2011, 2012, 2016; Romeo et al, 2015). In early embryos, however, we did not detect SUMO1 staining at mat‐PCH indicating that this pathway is dysfunctional at this early stage of development. This may be due to that Suv39h2 is more prominently expressed than Suv39h1 in zygotes. Moreover, HP1α (CBX5), though expressed, is not localized to chromatin in zygotes (Tardat et al, 2015). Finally, Senp7 is not expressed in oocytes and zygotes, possibly explaining the absence of HP1α in early embryonic chromatin.
At pat‐PCH, the order of DAXX and ATRX recruitment to chromatin is inversed relative to mat‐PCH in embryos and to PCH in somatic cells. In mouse fibroblasts, ATRX is constitutively localized at PCH via its interactions with H3K9me3‐/HP1‐modified chromatin. The SIMs of DAXX drive the association of DAXX and ATRX at SUMOylated PML bodies in G1‐, early S‐, and G2‐phase cells (Ishov et al, 2004; Shastrula et al, 2019). At the end of S phase, however, DAXX and ATRX are released from SUMOylated PML bodies and DAXX is transiently recruited to PCH, already marked by ATRX. The S phase restricted accumulation of DAXX at PCH is inhibited by roscovitine treatment, blocking CDK2‐mediated phosphorylation of ATRX and possibly other proteins (Ishov et al, 2004). Biochemically, the N‐terminal four‐helix bundle domain (4HB) of DAXX interacts directly with a short evolutionary highly conserved fragment of ATRX (Hoelper et al, 2017). It will be important to study whether DAXX and ATRX at pat‐PCH and mat‐PCH in zygotes are differentially modified by post‐translational modifications, explaining the parent‐of‐origin‐specific targeting dependencies and cell cycle kinetics of PCH enrichments. Intriguingly, DAXX and ATRX co‐localize at multiple foci in euchromatin of zygotes, particularly in maternal pronuclei (Fig 1). At such foci, the co‐localization is dependent on Daxx but not Atrx suggesting that DAXX may define the chromatin state at other sequences in the genome similarly as at pat‐PCH.
We demonstrate that DAXX recruitment to pat‐PCH is required for maintaining nucleosome density at major satellite sequences. The absence of DAXX in Daxx‐deficient or Ring1; Rnf2 dko embryos leads to chromatin unfolding and DNA breakage at major satellites when paternally inherited chromosomes segregate to opposite poles during the first cleavage divisions. This phenotype is suppressed by expressing DAXX from S phase onwards suggesting that the timing of function of the CBX2/cPRC1 → SUMO2 → DAXX → H3.3 deposition pathway during late S phase and/or G2 is sufficient. This timing within the embryonic cell cycle is similar to the reported relocation of DAXX to PCH in fibroblasts during late S phase (Ishov et al, 2004). Nonetheless, DAXX was also shown to deposit H3.3 nucleosomes onto major satellites prior to S phase in fibroblast (Drane et al, 2010). Thus, given its localization in pat‐PCH of early zygotes (Fig 2), DAXX may also deposit H3.3 during sperm decondensation and pronuclear formation. Together, our data underscore the relevance of the H3.3‐H4 chaperone function of DAXX for controlling embryonic chromatin integrity.
In mouse early embryos, major satellites are predominantly expressed from the forward strand in paternal genomes, while the reverse strands are expressed in both genomes in a developmentally coordinated manner (Probst et al, 2010). In Daxx m−z+ zygotes, transcripts from both strands were undetectable by RNA FISH suggesting that DAXX is generally required for transcription of major satellites (Fig 7). Indeed, reduced major satellite expression has also been observed in Daxx‐deficient fibroblasts (Drane et al, 2010). In strong contrast, maternal deficiency of cPRC1 enhances major satellite expression pat‐PCH (Puschendorf et al, 2008). Thus, though working in the same pathway, DAXX and cPRC1 serve opposing roles in balancing expression of the major satellite tandem repeats. Since mitotic stability of pat‐PCH is affected in Daxx m−z+ as in Ring1 m−z+; Rnf2 m−z+ embryos, it is likely that the derailment of transcription of major satellites does not cause heterochromatin destabilization at pat‐PCH.
By exposing embryos to LNA‐DNA gapmers from the zygote stage onwards, knockdown of reverse but not of forward strand major satellite transcripts has been shown to impair the development of regular and parthenote embryos beyond the two‐cell stage (Probst et al, 2010; Casanova et al, 2013). Moreover, the LNA‐DNA gapmer treatment of specifically reverse transcripts interferes with the clustering of major satellites into chromocenters normally occurring in 2‐ and 4‐cell embryos (Probst et al, 2010; Casanova et al, 2013). These studies underscore the developmental importance of certain transcriptional and chromatin reprogramming events occurring at mat‐PCH. In Daxx m−z+ embryos, however, neither zygotic expression of major satellites at mat‐PCH, nor the two‐ to four‐cell transition or the formation of chromocenters was altered (Fig EV4F). In contrast, maternally provided ATRX has been implicated in suppressing major satellite expression at mat‐PCH (De La Fuente et al, 2015). Moreover, reduction of maternal Atrx induces mitotic recombination at centromeric minor satellite sequences and chromosome instability in mouse early embryos (De La Fuente et al, 2015). Unfortunately, it is unclear whether these instability phenotypes are restricted to the maternal genome or apply to the paternal genome as well. Even so, we did not observe defects in major satellite stability and segregation of maternal chromosomes in Daxx m−z+ embryos, supporting the notion that the low DAXX levels and absence of H3.3 deposition at mat‐PCH do not compromise H3K9me3/HP1 heterochromatin integrity. Our results also suggest that ATRX functions independently of DAXX at mat‐PCH.
In 2004, Ishov et al reported that ~ 10% of Daxx deficient embryonic fibroblasts contained two nuclei, a level threefold higher than in wild‐type cells. We observed that lack of maternal and paternal Daxx expression severely impaired progression of embryos toward the blastocyst stage. Notably, ~ 45% of Daxx m−z− morula and blastocysts contained large polyploid nuclei compared to 18% of wild‐type and Daxx m−z+ embryos, pointing to major defects in chromosome segregation and/or cytokinesis in the absence of DAXX expression later in development (Fig 6). The more dramatic ploidy phenotype in later stages suggests a different molecular role for DAXX in maintaining genome integrity. Interestingly, the canonical H3K9me3/HP1 state as present at mat‐PCH is de novo established at pat‐PCH at the 8‐cell stage and co‐localizes with DAXX (Puschendorf et al, 2008). Likewise, we detected PML bodies from the 8‐cell stage onwards as well, which co‐localize with DAXX (Fig EV4G). Interestingly, morpholino‐mediated depletion of total H3.3 protein showed that H3.3 sustains proper chromosome segregation throughout pre‐implantation development. Moreover, H3.3 maintains a decondensed chromatin state, in part by directing MOF‐mediated H4K16 acetylation and counteracting H1 incorporation, and which is required for development beyond the morula stage (Lin et al, 2013). To understand the possibly multiple mechanisms underlying the developmental and cytokinesis defects observed in Daxx m−z− embryos, it will thus be important to assess the impact of Daxx deficiency on general mitotic chromatin structure as well as on gene expression during late pre‐implantation development.
Our study in HEK293 cells shows that exogenous CBX2 can recruit DAXX to and drive H3.3 deposition at a heterologous gene target in a cPRC1‐dependent manner (Fig 4). The recruitment is likely mediated via SUMOylation given that it depends on the SIM domains of DAXX. Our genome‐wide analysis shows that exogenous CBX2 recruits DAXX to transcriptional start sites of many genes in HEK293 cells. To identify a potential role of this interaction in a physiologically relevant setting, we compared differential gene expression in Daxx‐deficient versus Ring1; Rnf2 double deficient oocytes and 2‐cell embryos where CBX2 is naturally highly expressed. These analyses revealed many commonly upregulated, but not downregulated genes (Fig 7). Moreover, showing further specificity of the correlation, we did not observe any correspondence in derailed gene expression in oocytes deficient for Daxx versus Setdb1, a well‐known histone H3 lysine 9 methyltransferase and SUMOylated interaction partner of DAXX in mouse ESCs (Fig EV5E and F) (Hendriks et al, 2014; Eymery et al, 2016).
Cbx2 is one of five mammalian orthologues (Cbx2, 4, 6, 7, 8) of the Drosophila Polycomb Pc gene. In post‐implantation embryos, it is expressed in most tissues and serves non‐redundant gene regulatory functions (Schoorlemmer et al, 1997; Lau et al, 2017). For example, Cbx2 is required for proper axial patterning of the skeleton, for limb development (Core et al, 1997) as well as for male sex determination in mice and men (Katoh‐Fukui et al, 1998; Biason‐Lauber et al, 2009). In developing oocytes, Cbx2 is the only Pc orthologue that is highly expressed (Fig EV1D) (Puschendorf et al, 2008). Accordingly, a high level of maternal Cbx2 transcripts is contributed from the egg to the embryo (Puschendorf et al, 2008). The other orthologs become progressively activated during development toward the blastocyst stage (Fig EV1D). Our data demonstrate that DAXX specifically contributes to PRC1‐mediated gene repression in oocytes and early embryos suggesting an unique role for CBX2 in cPRC1 function at the onset of embryogenesis.
CBX2 integrates many functions that are served by different domains of the protein (Fig EV5G). While the N‐terminal CD confers binding to H3K27 and H3K9 trimethylated nucleosomes (Bernstein et al, 2006), the neighboring AT hook (ATH) controls binding to AT‐rich DNA (Tardat et al, 2015). The linker sequence between CD and ATH contributes to nucleosome binding (Tardat et al, 2015). Importantly, phosphorylation of the N‐terminal serine‐rich region (SRR) prevents binding of the adjacent ATH to major satellite double‐stranded DNA and single‐stranded RNA, while it promotes CD binding to H3K27me3‐modified nucleosomes (Kawaguchi et al, 2017). Interestingly, the CD‐ATH domain was shown to prevent binding to H3K9me3‐modified chromatin containing HP1 protein, presumably via steric hindrance requiring the linker sequence and the ability of the CD to bind to methylated histones (Tardat et al, 2015). The CD‐ATH domain also enables CBX2 binding to mitotic chromatin, independent of H3K27me3, PRC2, or other cPRC1 components (Fig EV5G) (Zhen et al, 2014). For immobilization along mitotic chromosomes, however, the C‐terminal Pc‐box is needed (Zhen et al, 2014) which drives interactions with cPRC1 components and mediates gene silencing (Schoorlemmer et al, 1997). The protein contains a large low complexity disordered region (LCDR) with several positively charged lysine residues which are required for biochemical chromatin compaction in vitro and axial patterning in vivo (Grau et al, 2011; Lau et al, 2017). Recently, CBX2 has been shown to undergo phase separation in vitro (Plys et al, 2019; Tatavosian et al, 2019). This phase separation is dependent on the positively charged lysine residues in the LCDR (Plys et al, 2019). Moreover, mutation of ATH, ATHL1 or 2, or of the SRR is sufficient to reduce or fully abrogate phase separation in vitro as well as the formation of CBX2‐containing foci in cells (Tatavosian et al, 2019). Interestingly, the major SUMOylation sites on CBX2 are located between the ATHL domains suggesting that SUMOylation could perturb charge‐based intra‐ and intermolecular interactions, thereby modulating phase separation, Polycomb body formation in vivo (Schoorlemmer et al, 1997; Bel et al, 1998) and possibly long range interactions (Schoenfelder et al, 2015). Indeed, in fly, Pc‐containing foci coagulate in larger aggregates in the absence of SUMO and demonstrate slower recovery of Pc‐GFP signal upon FRAP treatment. In contrast, genetic abrogation of the SUMO peptidase Veloren (Velo) function disperses Pc foci and reduces Pc occupancy on known PREs in wing imaginal disk cells (Gonzalez et al, 2014). Thus, given the presence of CBX2 foci at pat‐PCH and euchromatin in mouse pre‐implantation embryos (Puschendorf et al, 2008; Terranova et al, 2008; Tardat et al, 2015), the level of CBX2 SUMOylation may modulate its protein function. On the one hand, it may control interactions with SIM containing proteins like DAXX. On the other hand, it may fine‐tune the level of interactions between PRC1 complexes thereby determining gene repression and nuclear organization in early embryos, throughout development and in disease (Schoenfelder et al, 2015; Kundu et al, 2017; Lau et al, 2017; Sproll et al, 2018).
Materials and Methods
Animals
The generation of mice maternally deficient for Hp1β (Cbx1), Suv39h2, and Rnf2, or maternally doubly deficient for Ring1 and Rnf2 was performed as previously described (Puschendorf et al, 2008; Posfai et al, 2012; Tardat et al, 2015). Atrx flox mice (kind gift by D.R. Higgs and R.J. Gibbons (Garrick et al, 2006)) were crossed with Zp3‐cre transgenic mice to generate females producing oocytes maternally deficient for ATRX protein. Mice conditionally deficient for Daxx, in which exon 2 was flanked by loxP sites (Daxx flox), were purchased from The Jackson Laboratory (http://jaxmice.jax.org/strain/008669.html).
Oocytes and zygotes maternally deficient for Daxx were generated by crossing Daxx flox/flox; Zp3‐cre females with Daxx flox/flox males. Maternally and zygotically deficient embryos (Daxx m−z−) were generated by crossing Daxx flox/flox; Zp3‐cre females with Daxx flox/Δ males. Control embryos were generated by crossing Daxx flox/flox females with Daxx flox/flox males. Animal housing and experiments were performed in accordance with the Swiss animal protection laws and institutional guidelines.
Mouse embryo culture
Six‐ to eight‐week‐old female mice were superovulated by injection of pregnant mare serum gonadotropin (PMSG, 5U, MSD Cat#A207A01) and of human chorionic gonadotropin 48 h later (hCG, 5U, MSD Cat#A201A01). Mouse embryos were generated by natural fertilization. Fertilization occurred at 13–14 h after hCG injection, which was used as a reference time point for sub‐staging of zygotes and subsequent embryonic development (hours post‐hCG; hp‐hCG). Embryos were cultured in KSOM medium (Millipore Cat#MR‐106‐D) covered by paraffin oil (Sigma) at 37°C with 5% CO2 and 5% O2 air. Embryos were processed for further analyses at 18 hp‐hCG (PN0/1), 20 hp‐hCG (PN2/3), 24 hp‐hCG (PN4/5), 26 hp‐hCG (prometaphase), 36 hp‐hCG (early 2‐cell), 48 hp‐hCG (late 2‐cell), 58 hp‐hCG (4‐cell), 72 hp‐hCG (8‐cell), and 110 hp‐hCG (blastocysts).
Cell culture
HEK293T and HEK2935xUAS (Stielow et al, 2008) cells were grown in Dulbecco's modified Eagle medium (DMEM) with 10% (v/v) fetal bovine serum (FBS; Sigma) supplemented with penicillin and streptomycin. Cells were transiently transfected with the indicated constructs using Lipofectamine 3000 following the manufacturer's instructions (Thermo Fisher Scientific Cat#4309155).
Mouse ESCs were cultured in either DMEM with 4.5 g/l glucose (Gibco), 15% (v/v) FCS (fetal calf serum, Chemicon), penicillin, streptomycin, 2 mM l‐glutamine, 0.1 mM β‐mercaptoethanol, non‐essential amino acids, and 1 mM sodium pyruvate (Gibco) or with knockout serum replacement (Invitrogen) in the presence of GSK3β and MEK1 inhibitors (2i) (3 μM CHIR99021 and 0.8 μM PD184352, Axon Medchem).
Plasmids and mRNA generation
Plasmids encoding GAL4DBD‐tagged human full‐length CBX2.1 (NM_005189/NP_005180; 532 amino acids), truncated CBX2.2 (NM_032647/NP_116036; 211 amino acids), and CBX7 proteins were a gift from P. Angrand (INSERM, Villeneuve d'Ascq, France). Cbx2‐EGFP and GAL4DBD CBX2.1 point mutants and deletion constructs were generated with the Q5 Site‐Directed Mutagenesis Kit (New England Biolabs, Cat#E0554S) following the manufacturer's instructions. Primers were designed using the online NEBaseChanger.
Daxx MycHis was a gift from P. Leder (Addgene plasmid #1852; Ecsedy et al, 2003). Daxx‐EGFP was generated by PCR amplification of the Daxx ORF from Daxx MycHis, cloning this fragment into pCDNA3.1‐polyA (Yamagata et al, 2005) and subsequently cloning an EGFP ORF after the 3′end of the Daxx cDNA.
H3.3‐mCherry, H3.3‐EGFP, and H3.2‐EGFP constructs were generated by PCR amplification of H3.3 or H3.2 cDNAs (van der Heijden et al, 2007) and cloning into a pcDNA3.1‐polyA vector (Yamagata et al, 2005) followed by cloning of mCherry or EGFP ORFs behind the 3′ends of the histone cDNAs.
Daxx‐EGFP and H3.3‐EGFP constructs were subsequently subjected to mutagenesis using the Q5 Site‐Directed Mutagenesis Kit (New England Biolabs Cat#E0554S) to generate the H3‐binding‐deficient point mutant (Daxx‐HBD R244A) (Elsasser et al, 2012), the SUMO interaction motif mutants (Daxx ΔSIM1/2 ; SIM1: Δ3–17; SIM2: Δ731–740) (Santiago et al, 2009), and DAXX‐association‐deficient mutants H3.3G90M and H3.3A87S/I89V/G90M.
Expression vectors for 6xHis‐tagged SUMO1, SUMO2, and SUMO3 were a kind gift from L. Linares (Institut de Recherche et Cancerologie de Montpellier, France).
For mRNA generation, Daxx plasmids were first linearized with AgeI‐HF (New England Biolabs), and plasmids for H3.2, H3.3, and H3.3 mutations with XhoI (New England Biolabs), and subsequently subjected to in vitro transcription using the mMessage Machine T7 Kit (Thermo Fisher Scientific, Cat# AM1344).
siRNA microinjection and intracytoplasmic sperm injection
Fully grown GV oocytes were collected from ovaries of 8‐week‐old C57BL/6J female mice by puncturing ovarian follicles with needles (22G × 1 ¼”). The cumulus–oocytes complexes were transferred to M2 medium (Sigma) containing 2.5 mM milrinone (Sigma), and the cumulus cells were gently removed with a narrow‐bore glass pipette. The oocytes were then transferred to M16 medium (Sigma) containing 2.5 mM milrinone. The GV oocytes were injected with 10 μM siRNAs specific for Daxx (5′‐AUCGAACCUUGGCCAUGAA) or 10 μM control scrambled siRNA (5′‐ GAUCCAAGAAAUGGUUAGA) (all from Microsynth, Switzerland). Microinjection of siRNAs to GV oocytes was performed using an Olympus IX71 microscope equipped with micromanipulators (Eppendorf, NK2) and FemtoJet (Eppendorf). Two hours after injection, oocytes were incubated in milrinone‐free M16 medium at 37°C, 5% CO2 and 5% oxygen to induce in vitro meiotic maturation (IVM). Fourteen hours after IVM, matured MII oocytes containing the first polar body were selected for ICSI.
ICSI was carried out according to the piezo‐assisted micromanipulation method as described previously (Yoshida & Perry, 2007). In brief, MII oocytes were placed into a 10 μl “micromanipulation droplet” of M2 medium containing 5 μg/ml of cytochalasin B (Sigma). Micromanipulation droplets were covered by mineral oil and placed on the stage of a microscope (Olympus X71) equipped with a micromanipulator (Narishige) and a PiezoXpert (Eppendorf). A sperm head was aspirated into the tip of an injection pipette, with a 10 μm internal diameter, and then deposited into the cytoplasm of a MII oocyte by applying a pulse of piezo to penetrate the zona pellucida and plasma membrane of the oocyte. ICSI‐generated zygotes were cultured in M16 medium at 37°C, 5% CO2, and 5% oxygen. Following 4–5 h of culture, two pronuclei were visible in fertilized zygotes.
Immunofluorescence staining and microscopy
IF of oocytes and embryos was performed as previously described (Liu et al, 2012a). In brief, oocytes or embryos were fixed in 4% paraformaldehyde (PFA, Electron Microscopy Sciences Cat#15713) in PBS for 20 min and permeabilized with 0.5% Triton X‐100 in PBS for 30 min at room temperature (RT). Fixed samples were then blocked for 1 h in PBS containing 2% bovine serum albumin (BSA, Sigma‐Aldrich Cat#A9647). Oocytes and embryos were incubated with primary antibodies at suitable concentration overnight at 4°C. All primary (anti‐5mC antibody, Eurogentec Cat#0100; anti‐5hmC antibody, Active Motif Cat#39769; anti‐ATRX antibody was a gift from D.R. Higgs and R.J. Gibbons in University of Oxford; anti‐GFP antibody, Roche Cat#11814460001; anti‐HP1β antibody, Serotec Cat# MCA1946; anti‐DAXX(M‐112) antibody, Santa Cruz Cat#Sc‐7152; anti‐EZH2 antibody, Leica Cat# NCL‐L‐EZH2; anti‐H2AK119ub1 antibody, Cell Signaling Cat#8240; anti‐H3 antibody, Abcam Cat#ab1791; anti‐PML antibody, Millipore Cat#MAB3738; anti‐RNF2 antibody, Active Motif Cat#39663; and anti‐SUMO2/3 antibody, Abcam Cat#Ab3742) and secondary antibodies (donkey anti‐mouse IgG, Thermo Fisher, Cat#A21202; goat anti‐rabbit IgG, Thermo Fisher, Cat#A11034; and goat anti‐rat IgG, Thermo Fisher, Cat#A21208) were diluted in PBS with 2% BSA. After two rinses with PBS, samples were incubated with secondary antibodies for 1 h at RT. After two rinses with PBS, samples were directly deposited on glass slides (Thermo Scientific), mounted with Vectashield medium containing DAPI (Vector Laboratories Cat#H‐1200), and covered by coverslips.
For ESC staining, transiently transfected ESCs were seeded after approximately 16 h of culture on poly‐l‐lysine‐coated coverslips prior to fixation with 2% PFA in PBS. After the immunolabeling with the indicated antibodies, slides were mounted in Vectashield containing DAPI (Vector).
Image acquisition was performed with a Zeiss LSM 700 confocal microscope equipped with a 63 × Plan‐Apochromat objective (N.A. 1.4). Z‐stacks were acquired using a frame size of 512 × 512 pixels, a pixel depth of 16 bits, and 0.33 μm z‐step, with sequential single track scanning using 639, 555, 488, and 405 nm wavelengths of lasers.
3D DNA fluorescence in situ hybridization
3D DNA FISH was performed according to previously described protocols with modifications (Maalouf et al, 2009; Liu et al, 2012b). Unless otherwise specified, steps were performed at room temperature. The embryos at anaphase stage were regularly monitored and handled using a stereo‐microscope (Leica, MZ16) from 26 hp‐hCG onwards. Following disappearance of the nuclear membrane, the embryos were separated to individual M16 droplets and cultured for an additional 2 h before fixation. The zona pellucida of embryos was removed by acidic tyrode (Sigma) prior to fixation with 4% PFA in PBS. The embryos were washed in PBS and deposited on glass slides to allow adherence. They were re‐fixed with 4% PFA in PBS for 10 min and permeabilized for another 30 min in 0.5% Triton X‐100 in PBS. Following two 5‐min washes in 2× saline sodium citrate (SSC), pH 6.3, embryos were incubated in 2× SSC containing 200 μg/ml RNase (Microsynth) for 30 min at 37°C. After a rinse in 2× SSC, the slide was equilibrated in the hybridization buffer (50% formamide, SSC 2×, Denhardt 1×, 40 mM NaH2PO4, 10% dextran sulfate) overnight at RT. The DNA probes were denatured in hybridization buffer solution at 85°C for 10 min and incubated at 37°C for 30 min. Embryos were denatured in hybridization buffer solution at 85°C for 10 min and incubated with denatured DNA probes for 24 h at 37°C in a humidified chamber for hybridization. After two times 5‐min washes with 2× SSC at 42°C, slides were directly mounted in Vectashield medium containing DAPI (H‐1200, Vector Laboratories). Probes for major and minor satellites were amplified from Daxx f/f genomic DNA by PCR (Table EV3) and labeled with Cy3 and Cy5, respectively, using the random priming procedure (Invitrogen, Ref 18095‐011).
RNA FISH
Wash buffer A and hybridization buffer containing probes were freshly prepared before performing RNA FISH. For wash buffer A, 2 ml Stellaris RNA FISH Wash Buffer A (Biosearch Technologies Cat# SMF‐WA1‐60), 7 ml nuclease‐free water, and 1 ml deionized formamide were mixed together with gentle vortexing. Hybridization buffer contained 450 μl Stellaris RNA FISH Hybridization Buffer (Biosearch Technologies Cat# SMF‐HB1‐10) and 50 μl deionized formamide. A mixture of mouse major satellite RNA probes labeled directly by Quasar 570 (forward) and Quasar 670 (reverse) (Biosearch Technologies) was added to 500 μl hybridization buffer (final working concentration of each probe was 125 nM). The zona pellucida of zygotes at G2 phase was removed by protease before fixation (Sigma, P5147‐1 G, 5 mg/ml in M2 medium) for 10 min at 37°C prior to fixation. Embryos were fixed in 4% paraformaldehyde in PBS (pH 7.2) for 15 min at RT and permeabilized for another 5 min in 0.5% Triton X‐100/PBS (RNase‐free). The embryos were washed in PBS twice and deposited on glass slides to allow adherence. Following two times 5‐min washes in wash buffer A, 50 μl hybridization buffer containing probe was added to embryos and they were incubated in a humidified chamber overnight at 37°C. Following aspiration of hybridization buffer embryos were washed three times 10 min in wash buffer A at 37°C. After washing two times with wash buffer B (Biosearch Technologies Cat# SMF‐WB1‐20) at room temperature, embryos were directly mounted in Vectashield medium containing DAPI (H‐1200, Vector Laboratories). Each individual transcription signal was detected and quantified in 3D by the ForciPicker algorithm from ImageJ software (Liu et al, 2012b).
mRNA microinjection and live‐cell imaging
For microinjection, constructs were linearized and transcribed in vitro using the mMessage mMachine T7/T3 kit (Ambion). After purification using the RNeasy Mini Kit (Qiagen), the synthesized mRNA was diluted using nuclease‐free water (Ambion). To image of 1st mitosis of embryos, we microinjected 3–5 pl in vitro‐transcribed RNAs encoding H2B‐mCherry (20 ng/μl) and Tubulin‐EGFP (100 ng/μg) into zygotes as described above and cultured in incubator for at least 2 h to allow maturation of fluorescent protein. We started live confocal imaging around 26 hp‐hCG. To image zygotes from PN0 to PN5 stage, we microinjected 3–5 picoliter mRNAs encoding H3.3‐mCherry and H3.2‐EGFP or DAXX‐EGFP (20 ng/μl each) into MII oocytes. Following 3 h in vitro culture, MII oocytes were fertilized by ICSI and processed for live imaging immediately.
For imaging, 10–20 embryos were cultured in 50 μl M16 medium without phenol red (Millipore) covered by mineral oil in a multi‐well μ‐slide (Ibidi, 81506) designed for high end live‐cell microscopy. We imaged embryonic development with a spinning‐disk multipoint confocal (Olympus IX81) equipped with the Yokogawa CSU‐X1 scanhead, 491‐ and 561‐nm laser, and a 40× silicon immersion objective lens (Olympus, UplanSApo, N.A. 1.25). The Ibidi slides were enclosed in a temperature and humidity controlled environment set at 37°C and 5% CO2 (Life Cell imaging, Basel). Fifteen z‐axis confocal sections (every 2 μm) of 512 × 512 pixels images were acquired every 10 min. for monitoring the 1st mitosis and every 20 min to monitor development from PN0 to PN5. We reconstructed the images in 3D using ImageJ.
3D image processing and quantitative analysis
To quantify the level of fluorescence signals within distinct nuclear compartments such as pericentromeric heterochromatin (PCH) regions in mouse early embryos, we developed a new image processing approach that enables automated identification of compartments in paternal and maternal pronuclei and quantification of different fluorescence signals representing, e.g., various chromatin proteins and modifications in wild‐type and genetically modified embryos. The method couples supervised learning‐based segmentation to an automated iterative rule‐based watershed merger that corrects for over‐segmentation produced in classical watershed algorithms. The separation of parental pronuclei and identification of their parental origin (maternal or paternal) is based on measured features, such as pronuclear size and intensity distribution of the fluorescent DNA dye DAPI. In detail, raw 4D microscope data (xyz and color channel) are converted into a new 3D data stack with isotropic resolution along xyz using an ImageJ‐based macro, working recursively along experiment folders. The macro also extracts and saves separately the DAPI channel for subsequent pixel classification. Next, supervised learning 3D pixel classification is used to generate prediction maps for the different nuclear compartments using several key features, such as the intensity of the DAPI fluorophore, the local DAPI gradients, and the structure tensor. Training is realized with the interactive learning and classification toolkit Ilastik (Sommer & Gerlich, 2013). Finally, each prediction map is morphologically filtered and binarized to define masks for separate nuclear compartments. Quantification of different fluorophore channels relative to the distinct nuclear compartments including PCH is realized by summing up the intensities over the corresponding masks. Such volume normalized read outs are referred to as signal intensities in boxplot figures, which were generated using the online “http://shiny.chemgrid.org/boxplotr/” tool.
Immunoprecipitation and immunoblotting
Cells were transiently transfected with the appropriated constructs and harvested 24 h later. Lysate preparation and subsequent immunoprecipitation were performed as described previously with minor changes (Tardat et al, 2015). Briefly, the lysates were cleared by centrifugation before pre‐clearing with 50 μl of mouse IgG agarose beads (Sigma) for at least 1 h at 4°C with rotation. After centrifugation, 25 μl of mouse anti‐Flag M2 agarose beads (Sigma) were added to the supernatant and allowed to precipitate overnight at 4°C with rotation. Beads were pelleted by centrifugation, washed three times, and resuspended in SDS buffer. For the analysis of immunoprecipitation, the proteins were separated by SDS–PAGE and detected with the following antibodies: anti‐Flag (Sigma, Cat#F1804), anti‐GFP (Roche, Cat#11814460001), anti‐Histone H3.3 (Millipore, Cat#09‐838), anti‐H3K27me3 (Cell Signaling, Cat#9733), anti‐Myc Tag (Abcam, Cat#Ab9132), and anti‐RNF2 (Active Motif, Cat#39663). For immunoblots, anti‐αTubulin (Sigma, Cat#T9026) was used as a loading control.
SUMOylation assay
HEK293 cells were co‐transfected with expression vectors of either 6xHis‐tagged SUMO1, SUMO2, or SUMO3 with pcDNA3.1‐Cbx2‐EGFP wild‐type or mutant as indicated in the corresponding figures. After 24 h, cells were harvested followed by protein extraction under denaturing conditions (6 M guanidinium‐HCl, 0.5% (v/v) Triton, 10 mM imidazole, 20 mM Tris at pH 7.5, 0.5 mM DTT, and 0.5 mM Iodoacetamide). To prevent the loss of SUMO conjugation, 10 μM N‐Ethylmaleimide (NEM) was added to lysis and washing buffers. His‐SUMO‐conjugated proteins were purified by nickel chromatography (Qiagen) and separated by SDS–PAGE. Immunoblot was performed with the an anti‐GFP antibody (Roche, Cat#11814460001).
Chromatin immunoprecipitation, ChIP‐Sequencing, and quantitative PCR
HEK2935xUAS cells were transfected twice with Lipofectamine 3000 with the appropriate constructs and fixed 24 h later with 1% (v/v) formaldehyde (Sigma) for 10 min at room temperature before quenching of the cross‐linker with 125 mM glycine. Preparation of chromatin was performed as described previously (Tardat et al, 2015). Chromatin was sheared with a Bioruptor apparatus (Diagenode) to obtain DNA fragments with size between 200 and 800 bp. The lysates were incubated overnight at 4°C with Dynabeads protein G (Invitrogen) coupled to the appropriate antibody: GAL4 DNA‐binding domain (Millipore, Cat#06‐262), Myc‐tag (Abcam, Cat#Ab9132), RNF2 (Active Motif, Cat#39663), Histone variant H3.3 (Millipore, 09‐838), and Histone H3 (Abcam, Cat#1791). Recovered DNA was purified using the MinElute PCR purification kit (Qiagen Cat#28006) following the manufacturer's instructions. For Sequencing, the libraries were prepared with the ChIP‐Seq NEB Ultra Kit (New England Biolabs Cat# E6200) and sequenced with the Illumina Hiseq (50 cycles and single‐end reads). Quantitative PCR analyses of immunoprecipitated DNA were performed in triplicate using a Fast SYBR Green Master Mix (Thermo Fisher Scientific Cat#4309155) on an ABI 7500 Fast Real‐Time PCR System (Applied Biosystems). The primer pairs used are indicated in Table EV3.
Alignment of RNA‐Seq data
Spliced alignment of single‐end (Ring1; Rnf2 samples; Setdb1 samples) and paired‐end RNA‐Seq (samples for Daxx in MII oocyte; samples for Daxx m−z+ in 2‐cell embryos) data to a custom genome containing the Mus musculus genome assembly (GRCm38/mm10 Dec. 2011) and ERCC92 sequences was done using STAR (Dobin et al, 2013) with parameters “‐outFilterMultimapNmax 300 ‐outMultimapperOrder Random ‐outSAMmultNmax 1 ‐alignIntronMin 20 ‐alignIntronMax 1000000”, allowing multimappers with up to 300 matches in the genome and choosing positions for multimappers randomly.
Potential PCR duplicates were removed from libraries which were generated using SoLo NuGEN RNA‐Seq protocol by merging BAM files for technical replicates and deduplicating resulting BAM files using UMIs and python script nudup.py from NuGEN Technologies (version 2.2).
Expression quantification
Expression quantification for genes was done using Bioconductor annotation package TxDb.Mmusculus.UCSC.mm10.knownGene (version 3.4.0) and qCount function from QuasR R package (Gaidatzis et al, 2015) selecting only uniquely mapped reads (parameter mapqMin = 255).
Differential expression and Gene Ontology analyses of RNA‐Seq data for Ring1; Rnf2 DKO GV oocytes; Daxx KO MII oocytes and Daxx m−z+ 2‐cell embryos
Analysis of differential expression was performed using the generalized linear model functionality of the edgeR package (McCarthy et al, 2012) by creating a model matrix of the form “~0 + stage.genotype”, where “stage” reflects a corresponding cell type for which RNA‐Seq samples were generated (“GV oocyte”, “MII oocyte”, “2‐cell embryos”) and “genotype” reflects a corresponding genotype (“Ring1 −/− ; Rnf2 f/f ; Zp3‐cre”, “Ring1 −/− ; Rnf2 f/f ”, “Daxx f/f ”, “Daxx f/f ; Zp3‐cre”, “Daxx f/f ; m+z+ ”; “Daxx f/f ; Zp3‐cre; m−z+ ”). Genes with expression higher than 1 CPM in at least two samples were used for the analysis. Statistical significance was estimated using log‐likelihood tests, and the Benjamini–Hochberg method was used to correct for multiple testing.
Gene Ontology analysis was performed using R package topGO with parameters “method = weight01; statistic = fisher”. GO annotation for genes was taken from Bioconductor annotation package org.Mm.eg.db.
Differential expression analysis of RNA‐Seq data for Setdb1 KO GV oocytes
Analysis was done as described previously (Eymery et al, 2016). Briefly, differentially expressed genes were identified by fitting a two‐factor model of the form “cre + genotype”, with cre corresponding to expression status of the Zp3 cre‐recombinase (“expressed” or “not expressed”), and genotype to the Setdb1 genotype (“+/−” or “−/−”). Statistical significance of differential expression was estimated using log‐likelihood tests, and Benjamini–Hochberg method was used to correct for multiple testing.
Processing and analysis of H3K27me3 ChIP‐Seq data
A published H3K27me3 ChIP‐Seq dataset (Liu et al, 2016) for pre‐implantation embryos was downloaded from NCBI GEO repository (GSE73952). Illumina adapters were removed using trim_galore tool (Krueger, 2015) with parameters “–illumina –paired –stringency 5”. After adapter removal, reads were aligned to M.musculus genome assembly (mm10) using STAR with parameters “‐alignIntronMin 1 ‐alignIntronMax 1 ‐alignEndsType EndToEnd ‐alignMatesGapMax 1000 ‐outFilterMatchNminOverLread 0.85 ‐outFilterMultimapNmax 300 ‐outMultimapperOrder Random ‐outSAMmultNmax 1” and possible PCR duplicates were removed using SAMtools (Li et al, 2009). Reads for ChIP and input samples were counted for promoters (± 2.5 kb around TSS) using QuasR package selecting only uniquely mapped reads, and enrichments were calculated by subtracting corresponding input log2(RPKM) from ChIP log2(RPKM).
Classification of promoters into “Low”, “Medium”, and “High” classes with respect to H3K27me3 enrichments for each stage was done by fitting Gaussian mixture model with 3 components using mixtools R package (Benaglia et al, 2009). Promoters were classified as “Low H3K27me3” if posterior probability for belonging to the lowest Gaussian component was above 0.05, and the rest were classified as “Medium H3K27me3” or “High H3K27me3” choosing class with the highest posterior probability.
MycHis and GAL4DBD ChIP‐Seq data processing, analysis, and visualization
MycHis and GAL4DBD ChIP‐seq reads were aligned to the genome (BSgenome.Hsapiens.UCSC.hg19) using the QuasR::qAlign function; only uniquely mapping reads were considered. ChIP occupancy levels were quantified using the QuasR::qCount function at all mappable TSS ± 1 kb. Counts were normalized by library size, using the number of reads mapping to the whole genome, excluding TSS regions (TSS ± 5 kb) as a normalizer. Enrichment values were obtained by subtracting corresponding input values from the same regions (in log2 scale). Genome browser tracks were generated in R using the Gviz package.
To understand the anti‐MYC enrichment at TSS regions in the absence of exogenous DAXXMycHis‐ protein expression, we analyzed ChIP‐seq data of transcription factors in multiple human cell lines, available at the UCSC browser as part of the “ENCODE Transcription Factor Binding Tracks” (“ENC TF Binding”) (ENCODE Project Consortium, 2012).
Quantification and statistical analysis
The number (n) of independent experimental replications, the definition of center and precisions measures are reported in the figure legends. Statistical analysis was performed using SigmaStat 3.5 statistical software. The two‐tailed t‐test or paired t‐test was used for statistical analysis except when specified in the figure legends. For all statistical analyses, a value of P < 0.05 was statistically significant. For box plots, whiskers extend to datapoints that are < 1.5 × interquartile range away from the 1st/3rd quartile.
Author contributions
ZL, MT, MEG, and AHFMP conceived and designed the experiments. ZL performed genetic and embryo manipulation experiments, 3D image acquisition, and live imaging. MT conducted biochemistry and ChIP experiments. MEG constructed plasmids for live imaging and genetic complementation experiments and provided advice on experiments. HR analyzed ChIP‐sequencing data. RT generated the program for automated 3D image quantification analyses. EAO performed RNA‐seq, ChIP‐seq, and statistical analyses. MT, ZL, and AHFMP wrote the manuscript. AHFMP coordinated the project. All authors commented on the manuscript.
Conflict of interest
The authors declare that they have no conflict of interest.
Supporting information
Appendix
Expanded View Figures PDF
Table EV1
Table EV2
Table EV3
Movie EV1
Movie EV2
Movie EV3
Movie EV4
Movie EV5
Movie EV6
Movie EV7
Movie EV8
Source Data for Expanded View
Review Process File
Source Data for Figure 1
Source Data for Figure 2
Source Data for Figure 3
Source Data for Figure 4
Source Data for Figure 5
Source Data for Figure 6
Source Data for Figure 7
Acknowledgements
We thank (i) D.R. Higgs and R.J. Gibbons (University of Oxford, Oxford, UK) for the ATRX antibody and Atrx floxed mice; (ii) T. Jenuwein (MPI, Freiburg, Germany) for the Ezh1 deficient mice; (iii) S. Orkin (Harvard Medical School, Boston, USA) for Ezh2 floxed mice; (iv) M. Vidal (CSIC, Madrid, Spain) for Ring1‐deficient mice; (v) M. v. Lohuizen (NKI, Amsterdam, the Netherlands) for Rnf2 floxed mice; and (vi) B. Knowles (JAX, Bar Harbor, USA) for Zp3‐cre transgenic mice. We thank E. Julien and L. Linares (IRCM, Montpellier, France) for the HEK2935xUAS cells and SUMO plasmids, respectively, and P. Angrand (INSERM, Villeneuve d'Ascq, France) for various GALDBD‐tagged CBX plasmids. We thank N. Beaujean (INSERM, Bron, France) for helpful discussions regarding DNA FISH. L. Gelman and S. Bourke (Facility for Advanced Imaging and Microscopy), S. Smallwood (Functional genomics) and the FMI animal facility provided excellent assistance. We thank X. Hou for experimental support. Research was supported by the Novartis Research Foundation and the Swiss National Science Foundation (406340_128131; 31003A‐146293). This work also received funding from the European Research Council (ERC) under the European Union’s Horizon 2020 research and innovation program grant agreement no. 695288 ‐ Totipotency. H.R. was funded by the Marie‐Curie FP7 program (FP7‐PEOPLE‐2013‐IEF 628705—nucleosome retention).
EMBO Journal (2020) 39: e103697
Data availability
The datasets produced in this study are available in the following databases:
RNA‐Seq data: Gene Expression Omnibus GSE137030 (https://www.ncbi.nlm.nih.gov/geo/query/acc.cgi?acc=GSE137030)
RNA‐Seq data: Gene Expression Omnibus GSE133442 (https://www.ncbi.nlm.nih.gov/geo/query/acc.cgi?acc=GSE133442)
ChIP‐Seq data: Gene Expression Omnibus GSE107348 (https://www.ncbi.nlm.nih.gov/geo/query/acc.cgi?acc=GSE107348).
References
- Ahmad K, Henikoff S (2002) The histone variant H3.3 marks active chromatin by replication‐independent nucleosome assembly. Mol Cell 9: 1191–1200 [DOI] [PubMed] [Google Scholar]
- Akiyama T, Suzuki O, Matsuda J, Aoki F (2011) Dynamic replacement of histone H3 variants reprograms epigenetic marks in early mouse embryos. PLoS Genet 7: e1002279 [DOI] [PMC free article] [PubMed] [Google Scholar]
- Alabert C, Jasencakova Z, Groth A (2017) Chromatin replication and histone dynamics. Adv Exp Med Biol 1042: 311–333 [DOI] [PubMed] [Google Scholar]
- Albert M, Peters AH (2009) Genetic and epigenetic control of early mouse development. Curr Opin Genet Dev 19: 113–121 [DOI] [PubMed] [Google Scholar]
- Allshire RC, Nimmo ER, Ekwall K, Javerzat JP, Cranston G (1995) Mutations derepressing silent centromeric domains in fission yeast disrupt chromosome segregation. Genes Dev 9: 218–233 [DOI] [PubMed] [Google Scholar]
- Arakawa T, Nakatani T, Oda M, Kimura Y, Sekita Y, Kimura T, Nakamura T, Nakano T (2015) Stella controls chromocenter formation through regulation of Daxx expression in 2‐cell embryos. Biochem Biophys Res Commun 466: 60–65 [DOI] [PubMed] [Google Scholar]
- Banaszynski LA, Wen D, Dewell S, Whitcomb SJ, Lin M, Diaz N, Elsasser SJ, Chapgier A, Goldberg AD, Canaani E et al (2013) Hira‐dependent histone H3.3 deposition facilitates PRC2 recruitment at developmental loci in ES cells. Cell 155: 107–120 [DOI] [PMC free article] [PubMed] [Google Scholar]
- Beisel C, Paro R (2011) Silencing chromatin: comparing modes and mechanisms. Nat Rev Genet 12: 123–135 [DOI] [PubMed] [Google Scholar]
- Bel S, Core N, Djabali M, Kieboom K, Van der Lugt N, Alkema MJ, Van Lohuizen M (1998) Genetic interactions and dosage effects of Polycomb group genes in mice. Development 125: 3543–3551 [DOI] [PubMed] [Google Scholar]
- Benaglia T, Chauveau D, Hunter DR, Young DS (2009) mixtools: an R package for analyzing finite mixture models. J Stat Softw 32: 1–29 [Google Scholar]
- Bernstein E, Duncan EM, Masui O, Gil J, Heard E, Allis CD (2006) Mouse polycomb proteins bind differentially to methylated histone H3 and RNA and are enriched in facultative heterochromatin. Mol Cell Biol 26: 2560–2569 [DOI] [PMC free article] [PubMed] [Google Scholar]
- Biason‐Lauber A, Konrad D, Meyer M, DeBeaufort C, Schoenle EJ (2009) Ovaries and female phenotype in a girl with 46, XY karyotype and mutations in the CBX2 gene. Am J Hum Genet 84: 658–663 [DOI] [PMC free article] [PubMed] [Google Scholar]
- Blackledge NP, Farcas AM, Kondo T, King HW, McGouran JF, Hanssen LL, Ito S, Cooper S, Kondo K, Koseki Y et al (2014) Variant PRC1 complex‐dependent H2A ubiquitylation drives PRC2 recruitment and polycomb domain formation. Cell 157: 1445–1459 [DOI] [PMC free article] [PubMed] [Google Scholar]
- Cao R, Wang L, Wang H, Xia L, Erdjument‐Bromage H, Tempst P, Jones RS, Zhang Y (2002) Role of histone H3 lysine 27 methylation in Polycomb‐group silencing. Science 298: 1039–1043 [DOI] [PubMed] [Google Scholar]
- Casanova M, Pasternak M, El Marjou F, Le Baccon P, Probst AV, Almouzni G (2013) Heterochromatin reorganization during early mouse development requires a single‐stranded noncoding transcript. Cell Rep 4: 1156–1167 [DOI] [PubMed] [Google Scholar]
- Cooper S, Dienstbier M, Hassan R, Schermelleh L, Sharif J, Blackledge NP, De Marco V, Elderkin S, Koseki H, Klose R et al (2014) Targeting polycomb to pericentric heterochromatin in embryonic stem cells reveals a role for H2AK119u1 in PRC2 recruitment. Cell Rep 7: 1456–1470 [DOI] [PMC free article] [PubMed] [Google Scholar]
- Cooper S, Grijzenhout A, Underwood E, Ancelin K, Zhang T, Nesterova TB, Anil‐Kirmizitas B, Bassett A, Kooistra SM, Agger K et al (2016) Jarid2 binds mono‐ubiquitylated H2A lysine 119 to mediate crosstalk between Polycomb complexes PRC1 and PRC2. Nat Commun 7: 13661 [DOI] [PMC free article] [PubMed] [Google Scholar]
- Core N, Bel S, Gaunt SJ, Aurrand‐Lions M, Pearce J, Fisher A, Djabali M (1997) Altered cellular proliferation and mesoderm patterning in Polycomb‐M33‐deficient mice. Development 124: 721–729 [DOI] [PubMed] [Google Scholar]
- Dahl JA, Jung I, Aanes H, Greggains GD, Manaf A, Lerdrup M, Li G, Kuan S, Li B, Lee AY et al (2016) Broad histone H3K4me3 domains in mouse oocytes modulate maternal‐to‐zygotic transition. Nature 537: 548–552 [DOI] [PMC free article] [PubMed] [Google Scholar]
- De La Fuente R, Baumann C, Viveiros MM (2015) ATRX contributes to epigenetic asymmetry and silencing of major satellite transcripts in the maternal genome of the mouse embryo. Development 142: 1806–1817 [DOI] [PMC free article] [PubMed] [Google Scholar]
- Dobin A, Davis CA, Schlesinger F, Drenkow J, Zaleski C, Jha S, Batut P, Chaisson M, Gingeras TR (2013) STAR: ultrafast universal RNA‐seq aligner. Bioinformatics 29: 15–21 [DOI] [PMC free article] [PubMed] [Google Scholar]
- Drane P, Ouararhni K, Depaux A, Shuaib M, Hamiche A (2010) The death‐associated protein DAXX is a novel histone chaperone involved in the replication‐independent deposition of H3.3. Genes Dev 24: 1253–1265 [DOI] [PMC free article] [PubMed] [Google Scholar]
- Ebert A, Schotta G, Lein S, Kubicek S, Krauss V, Jenuwein T, Reuter G (2004) Su(var) genes regulate the balance between euchromatin and heterochromatin in Drosophila . Genes Dev 18: 2973–2983 [DOI] [PMC free article] [PubMed] [Google Scholar]
- Ecsedy JA, Michaelson JS, Leder P (2003) Homeodomain‐interacting protein kinase 1 modulates Daxx localization, phosphorylation, and transcriptional activity. Mol Cell Biol 23: 950–960 [DOI] [PMC free article] [PubMed] [Google Scholar]
- Elsasser SJ, Huang H, Lewis PW, Chin JW, Allis CD, Patel DJ (2012) DAXX envelops a histone H3.3‐H4 dimer for H3.3‐specific recognition. Nature 491: 560–565 [DOI] [PMC free article] [PubMed] [Google Scholar]
- ENCODE Project Consortium (2012) An integrated encyclopedia of DNA elements in the human genome. Nature 489: 57–74 [DOI] [PMC free article] [PubMed] [Google Scholar]
- Eustermann S, Yang JC, Law MJ, Amos R, Chapman LM, Jelinska C, Garrick D, Clynes D, Gibbons RJ, Rhodes D et al (2011) Combinatorial readout of histone H3 modifications specifies localization of ATRX to heterochromatin. Nat Struct Mol Biol 18: 777–782 [DOI] [PubMed] [Google Scholar]
- Eymery A, Liu Z, Ozonov EA, Stadler MB, Peters AH (2016) The methyltransferase Setdb1 is essential for meiosis and mitosis in mouse oocytes and early embryos. Development 143: 2767–2779 [DOI] [PubMed] [Google Scholar]
- Fursova NA, Blackledge NP, Nakayama M, Ito S, Koseki Y, Farcas AM, King HW, Koseki H, Klose RJ (2019) Synergy between variant PRC1 complexes defines polycomb‐mediated gene repression. Mol Cell 74: 1020–1036.e1028 [DOI] [PMC free article] [PubMed] [Google Scholar]
- Gaidatzis D, Lerch A, Hahne F, Stadler MB (2015) QuasR: quantification and annotation of short reads in R. Bioinformatics 31: 1130–1132 [DOI] [PMC free article] [PubMed] [Google Scholar]
- Gao Z, Zhang J, Bonasio R, Strino F, Sawai A, Parisi F, Kluger Y, Reinberg D (2012) PCGF homologs, CBX proteins, and RYBP define functionally distinct PRC1 family complexes. Mol Cell 45: 344–356 [DOI] [PMC free article] [PubMed] [Google Scholar]
- Garcia E, Marcos‐Gutierrez C, del Mar Lorente M, Moreno JC, Vidal M (1999) RYBP, a new repressor protein that interacts with components of the mammalian Polycomb complex, and with the transcription factor YY1. EMBO J 18: 3404–3418 [DOI] [PMC free article] [PubMed] [Google Scholar]
- Garrick D, Sharpe JA, Arkell R, Dobbie L, Smith AJ, Wood WG, Higgs DR, Gibbons RJ (2006) Loss of Atrx affects trophoblast development and the pattern of X‐inactivation in extraembryonic tissues. PLoS Genet 2: e58 [DOI] [PMC free article] [PubMed] [Google Scholar]
- Gauchier M, Kan S, Barral A, Sauzet S, Agirre E, Bonnell E, Saksouk N, Barth TK, Ide S, Urbach S et al (2019) SETDB1‐dependent heterochromatin stimulates alternative lengthening of telomeres. Sci Adv 5: eaav3673 [DOI] [PMC free article] [PubMed] [Google Scholar]
- Gill ME, Erkek S, Peters AH (2012) Parental epigenetic control of embryogenesis: a balance between inheritance and reprogramming? Curr Opin Cell Biol 24: 387–396 [DOI] [PubMed] [Google Scholar]
- Goldberg AD, Banaszynski LA, Noh KM, Lewis PW, Elsaesser SJ, Stadler S, Dewell S, Law M, Guo X, Li X et al (2010) Distinct factors control histone variant H3.3 localization at specific genomic regions. Cell 140: 678–691 [DOI] [PMC free article] [PubMed] [Google Scholar]
- Gonzalez I, Mateos‐Langerak J, Thomas A, Cheutin T, Cavalli G (2014) Identification of regulators of the three‐dimensional polycomb organization by a microscopy‐based genome‐wide RNAi screen. Mol Cell 54: 485–499 [DOI] [PubMed] [Google Scholar]
- Grau DJ, Chapman BA, Garlick JD, Borowsky M, Francis NJ, Kingston RE (2011) Compaction of chromatin by diverse Polycomb group proteins requires localized regions of high charge. Genes Dev 25: 2210–2221 [DOI] [PMC free article] [PubMed] [Google Scholar]
- van der Heijden GW, Derijck AA, Posfai E, Giele M, Pelczar P, Ramos L, Wansink DG, van der Vlag J, Peters AH, de Boer P (2007) Chromosome‐wide nucleosome replacement and H3.3 incorporation during mammalian meiotic sex chromosome inactivation. Nat Genet 39: 251–258 [DOI] [PubMed] [Google Scholar]
- Hendriks IA, D'Souza RC, Yang B, Verlaan‐de Vries M, Mann M, Vertegaal AC (2014) Uncovering global SUMOylation signaling networks in a site‐specific manner. Nat Struct Mol Biol 21: 927–936 [DOI] [PMC free article] [PubMed] [Google Scholar]
- Hoelper D, Huang H, Jain AY, Patel DJ, Lewis PW (2017) Structural and mechanistic insights into ATRX‐dependent and ‐independent functions of the histone chaperone DAXX. Nat Commun 8: 1193 [DOI] [PMC free article] [PubMed] [Google Scholar]
- Inoue A, Zhang Y (2011) Replication‐dependent loss of 5‐hydroxymethylcytosine in mouse preimplantation embryos. Science 334: 194 [DOI] [PMC free article] [PubMed] [Google Scholar]
- Ishov AM, Vladimirova OV, Maul GG (2004) Heterochromatin and ND10 are cell‐cycle regulated and phosphorylation‐dependent alternate nuclear sites of the transcription repressor Daxx and SWI/SNF protein ATRX. J Cell Sci 117: 3807–3820 [DOI] [PubMed] [Google Scholar]
- Ivanauskiene K, Delbarre E, McGhie JD, Kuntziger T, Wong LH, Collas P (2014) The PML‐associated protein DEK regulates the balance of H3.3 loading on chromatin and is important for telomere integrity. Genome Res 24: 1584–1594 [DOI] [PMC free article] [PubMed] [Google Scholar]
- Iwase S, Xiang B, Ghosh S, Ren T, Lewis PW, Cochrane JC, Allis CD, Picketts DJ, Patel DJ, Li H et al (2011) ATRX ADD domain links an atypical histone methylation recognition mechanism to human mental‐retardation syndrome. Nat Struct Mol Biol 18: 769–776 [DOI] [PMC free article] [PubMed] [Google Scholar]
- Kagey MH, Melhuish TA, Wotton D (2003) The polycomb protein Pc2 is a SUMO E3. Cell 113: 127–137 [DOI] [PubMed] [Google Scholar]
- Kalb R, Latwiel S, Baymaz HI, Jansen PW, Muller CW, Vermeulen M, Muller J (2014) Histone H2A monoubiquitination promotes histone H3 methylation in Polycomb repression. Nat Struct Mol Biol 21: 569–571 [DOI] [PubMed] [Google Scholar]
- Kang X, Qi Y, Zuo Y, Wang Q, Zou Y, Schwartz RJ, Cheng J, Yeh ET (2010) SUMO‐specific protease 2 is essential for suppression of polycomb group protein‐mediated gene silencing during embryonic development. Mol Cell 38: 191–201 [DOI] [PMC free article] [PubMed] [Google Scholar]
- Katoh‐Fukui Y, Tsuchiya R, Shiroishi T, Nakahara Y, Hashimoto N, Noguchi K, Higashinakagawa T (1998) Male‐to‐female sex reversal in M33 mutant mice. Nature 393: 688–692 [DOI] [PubMed] [Google Scholar]
- Kawaguchi T, Machida S, Kurumizaka H, Tagami H, Nakayama JI (2017) Phosphorylation of CBX2 controls its nucleosome‐binding specificity. J Biochem 162: 343–355 [DOI] [PubMed] [Google Scholar]
- Krueger F (2015) Trim galore: a wrapper tool around cutadapt and FastQC to consistently apply quality and adapter trimming to FastQ files. http://www.bioinformatics.babraham.ac.uk/projects/trim_galore/
- Kundu S, Ji F, Sunwoo H, Jain G, Lee JT, Sadreyev RI, Dekker J, Kingston RE (2017) Polycomb repressive complex 1 generates discrete compacted domains that change during differentiation. Mol Cell 65: 432–446.e435 [DOI] [PMC free article] [PubMed] [Google Scholar]
- Lamoliatte F, Caron D, Durette C, Mahrouche L, Maroui MA, Caron‐Lizotte O, Bonneil E, Chelbi‐Alix MK, Thibault P (2014) Large‐scale analysis of lysine SUMOylation by SUMO remnant immunoaffinity profiling. Nat Commun 5: 5409 [DOI] [PubMed] [Google Scholar]
- Lau MS, Schwartz MG, Kundu S, Savol AJ, Wang PI, Marr SK, Grau DJ, Schorderet P, Sadreyev RI, Tabin CJ et al (2017) Mutation of a nucleosome compaction region disrupts Polycomb‐mediated axial patterning. Science 355: 1081–1084 [DOI] [PMC free article] [PubMed] [Google Scholar]
- Lewis PW, Elsaesser SJ, Noh KM, Stadler SC, Allis CD (2010) Daxx is an H3.3‐specific histone chaperone and cooperates with ATRX in replication‐independent chromatin assembly at telomeres. Proc Natl Acad Sci USA 107: 14075–14080 [DOI] [PMC free article] [PubMed] [Google Scholar]
- Li H, Handsaker B, Wysoker A, Fennell T, Ruan J, Homer N, Marth G, Abecasis G, Durbin R, Proc GPD (2009) The sequence alignment/map format and SAMtools. Bioinformatics 25: 2078–2079 [DOI] [PMC free article] [PubMed] [Google Scholar]
- Li CJ, Conti M, Ramalho‐Santos M (2013) Histone variant H3.3 maintains a decondensed chromatin state essential for mouse preimplantation development. Development 140: 3624–3634 [DOI] [PMC free article] [PubMed] [Google Scholar]
- Lin D‐Y, Huang Y‐S, Jeng J‐C, Kuo H‐Y, Chang C‐C, Chao T‐T, Ho C‐C, Chen Y‐C, Lin T‐P, Fang H‐I et al (2006) Role of SUMO‐interacting motif in Daxx SUMO modification, subnuclear localization, and repression of sumoylated transcription factors. Mol Cell 24: 341–354 [DOI] [PubMed] [Google Scholar]
- Lin CJ, Koh FM, Wong P, Conti M, Ramalho‐Santos M (2014) Hira‐mediated H3.3 incorporation is required for DNA replication and ribosomal RNA transcription in the mouse zygote. Dev Cell 30: 268–279 [DOI] [PMC free article] [PubMed] [Google Scholar]
- Liu X, Wang C, Liu W, Li J, Li C, Kou X, Chen J, Zhao Y, Gao H, Wang H et al (2016) Distinct features of H3K4me3 and H3K27me3 chromatin domains in pre‐implantation embryos. Nature 537: 558–562 [DOI] [PubMed] [Google Scholar]
- Liu Z, Hai T, Dai X, Zhao X, Wang Y, Brochard V, Zhou S, Wan H, Zhang H, Wang L et al (2012a) Early patterning of cloned mouse embryos contributes to post‐implantation development. Dev Biol 368: 304–311 [DOI] [PubMed] [Google Scholar]
- Liu Z, Wan H, Wang E, Zhao X, Ding C, Zhou S, Li T, Shuai L, Feng C, Yu Y et al (2012b) Induced pluripotent stem‐induced cells show better constitutive heterochromatin remodeling and developmental potential after nuclear transfer than their parental cells. Stem Cells Dev 21: 3001–3009 [DOI] [PubMed] [Google Scholar]
- Loppin B, Bonnefoy E, Anselme C, Laurencon A, Karr TL, Couble P (2005) The histone H3.3 chaperone HIRA is essential for chromatin assembly in the male pronucleus. Nature 437: 1386–1390 [DOI] [PubMed] [Google Scholar]
- Maalouf WE, Liu Z, Brochard V, Renard JP, Debey P, Beaujean N, Zink D (2009) Trichostatin A treatment of cloned mouse embryos improves constitutive heterochromatin remodeling as well as developmental potential to term. BMC Dev Biol 9: 11 [DOI] [PMC free article] [PubMed] [Google Scholar]
- Maison C, Bailly D, Roche D, Montes de Oca R, Probst AV, Vassias I, Dingli F, Lombard B, Loew D, Quivy JP et al (2011) SUMOylation promotes de novo targeting of HP1alpha to pericentric heterochromatin. Nat Genet 43: 220–227 [DOI] [PubMed] [Google Scholar]
- Maison C, Romeo K, Bailly D, Dubarry M, Quivy JP, Almouzni G (2012) The SUMO protease SENP7 is a critical component to ensure HP1 enrichment at pericentric heterochromatin. Nat Struct Mol Biol 19: 458–460 [DOI] [PubMed] [Google Scholar]
- Maison C, Bailly D, Quivy JP, Almouzni G (2016) The methyltransferase Suv39 h1 links the SUMO pathway to HP1alpha marking at pericentric heterochromatin. Nat Commun 7: 12224 [DOI] [PMC free article] [PubMed] [Google Scholar]
- Martire S, Gogate AA, Whitmill A, Tafessu A, Nguyen J, Teng YC, Tastemel M, Banaszynski LA (2019) Phosphorylation of histone H3.3 at serine 31 promotes p300 activity and enhancer acetylation. Nat Genet 51: 941–946 [DOI] [PMC free article] [PubMed] [Google Scholar]
- McCarthy DJ, Chen Y, Smyth GK (2012) Differential expression analysis of multifactor RNA‐Seq experiments with respect to biological variation. Nucleic Acids Res 40: 4288–4297 [DOI] [PMC free article] [PubMed] [Google Scholar]
- Mendiratta S, Gatto A, Almouzni G (2019) Histone supply: multitiered regulation ensures chromatin dynamics throughout the cell cycle. J Cell Biol 218: 39–54 [DOI] [PMC free article] [PubMed] [Google Scholar]
- Michod D, Bartesaghi S, Khelifi A, Bellodi C, Berliocchi L, Nicotera P, Salomoni P (2012) Calcium‐dependent dephosphorylation of the histone chaperone DAXX regulates H3.3 loading and transcription upon neuronal activation. Neuron 74: 122–135 [DOI] [PMC free article] [PubMed] [Google Scholar]
- Morozov VM, Giovinazzi S, Ishov AM (2017) CENP‐B protects centromere chromatin integrity by facilitating histone deposition via the H3.3‐specific chaperone Daxx. Epigenetics Chromatin 10: 63 [DOI] [PMC free article] [PubMed] [Google Scholar]
- Moussa HF, Bsteh D, Yelagandula R, Pribitzer C, Stecher K, Bartalska K, Michetti L, Wang J, Zepeda‐Martinez JA, Elling U et al (2019) Canonical PRC1 controls sequence‐independent propagation of Polycomb‐mediated gene silencing. Nat Commun 10: 1931 [DOI] [PMC free article] [PubMed] [Google Scholar]
- Nacerddine K, Lehembre F, Bhaumik M, Artus J, Cohen‐Tannoudji M, Babinet C, Pandolfi PP, Dejean A (2005) The SUMO pathway is essential for nuclear integrity and chromosome segregation in mice. Dev Cell 9: 769–779 [DOI] [PubMed] [Google Scholar]
- de Napoles M, Mermoud JE, Wakao R, Tang YA, Endoh M, Appanah R, Nesterova TB, Silva J, Otte AP, Vidal M et al (2004) Polycomb group proteins Ring1A/B link ubiquitylation of histone H2A to heritable gene silencing and X inactivation. Dev Cell 7: 663–676 [DOI] [PubMed] [Google Scholar]
- Park SJ, Komata M, Inoue F, Yamada K, Nakai K, Ohsugi M, Shirahige K (2013) Inferring the choreography of parental genomes during fertilization from ultralarge‐scale whole‐transcriptome analysis. Genes Dev 27: 2736–2748 [DOI] [PMC free article] [PubMed] [Google Scholar]
- Peters AH, O'Carroll D, Scherthan H, Mechtler K, Sauer S, Schofer C, Weipoltshammer K, Pagani M, Lachner M, Kohlmaier A et al (2001) Loss of the Suv39 h histone methyltransferases impairs mammalian heterochromatin and genome stability. Cell 107: 323–337 [DOI] [PubMed] [Google Scholar]
- Peters AH, Kubicek S, Mechtler K, O'Sullivan RJ, Derijck AA, Perez‐Burgos L, Kohlmaier A, Opravil S, Tachibana M, Shinkai Y et al (2003) Partitioning and plasticity of repressive histone methylation states in mammalian chromatin. Mol Cell 12: 1577–1589 [DOI] [PubMed] [Google Scholar]
- Plys AJ, Davis CP, Kim J, Rizki G, Keenen MM, Marr SK, Kingston RE (2019) Phase separation of Polycomb‐repressive complex 1 is governed by a charged disordered region of CBX2. Genes Dev 33: 799–813 [DOI] [PMC free article] [PubMed] [Google Scholar]
- Posfai E, Kunzmann R, Brochard V, Salvaing J, Cabuy E, Roloff TC, Liu Z, Tardat M, van Lohuizen M, Vidal M et al (2012) Polycomb function during oogenesis is required for mouse embryonic development. Genes Dev 26: 920–932 [DOI] [PMC free article] [PubMed] [Google Scholar]
- Probst AV, Dunleavy E, Almouzni G (2009) Epigenetic inheritance during the cell cycle. Nat Rev Mol Cell Biol 10: 192–206 [DOI] [PubMed] [Google Scholar]
- Probst AV, Okamoto I, Casanova M, El Marjou F, Le Baccon P, Almouzni G (2010) A strand‐specific burst in transcription of pericentric satellites is required for chromocenter formation and early mouse development. Dev Cell 19: 625–638 [DOI] [PubMed] [Google Scholar]
- Puschendorf M, Terranova R, Boutsma E, Mao X, Isono K, Brykczynska U, Kolb C, Otte AP, Koseki H, Orkin SH et al (2008) PRC1 and Suv39 h specify parental asymmetry at constitutive heterochromatin in early mouse embryos. Nat Genet 40: 411–420 [DOI] [PubMed] [Google Scholar]
- Rapkin LM, Ahmed K, Dulev S, Li R, Kimura H, Ishov AM, Bazett‐Jones DP (2015) The histone chaperone DAXX maintains the structural organization of heterochromatin domains. Epigenetics Chromatin 8: 44 [DOI] [PMC free article] [PubMed] [Google Scholar]
- Ricketts MD, Frederick B, Hoff H, Tang Y, Schultz DC, Singh Rai T, Grazia Vizioli M, Adams PD, Marmorstein R (2015) Ubinuclein‐1 confers histone H3.3‐specific‐binding by the HIRA histone chaperone complex. Nat Commun 6: 7711 [DOI] [PMC free article] [PubMed] [Google Scholar]
- Romeo K, Louault Y, Cantaloube S, Loiodice I, Almouzni G, Quivy JP (2015) The SENP7 SUMO‐protease presents a module of two HP1 interaction motifs that locks HP1 protein at pericentric heterochromatin. Cell Rep 10: 771–782 [DOI] [PubMed] [Google Scholar]
- Saksouk N, Barth TK, Ziegler‐Birling C, Olova N, Nowak A, Rey E, Mateos‐Langerak J, Urbach S, Reik W, Torres‐Padilla ME et al (2014) Redundant mechanisms to form silent chromatin at pericentromeric regions rely on BEND3 and DNA methylation. Mol Cell 56: 580–594 [DOI] [PubMed] [Google Scholar]
- Santenard A, Ziegler‐Birling C, Koch M, Tora L, Bannister AJ, Torres‐Padilla ME (2010) Heterochromatin formation in the mouse embryo requires critical residues of the histone variant H3.3. Nat Cell Biol 12: 853–862 [DOI] [PMC free article] [PubMed] [Google Scholar]
- Santiago A, Godsey AC, Hossain J, Zhao LY, Liao D (2009) Identification of two independent SUMO‐interacting motifs in Daxx: evolutionary conservation from Drosophila to humans and their biochemical functions. Cell Cycle 8: 76–87 [DOI] [PubMed] [Google Scholar]
- Santos F, Peters AH, Otte AP, Reik W, Dean W (2005) Dynamic chromatin modifications characterise the first cell cycle in mouse embryos. Dev Biol 280: 225–236 [DOI] [PubMed] [Google Scholar]
- Scelfo A, Fernandez‐Perez D, Tamburri S, Zanotti M, Lavarone E, Soldi M, Bonaldi T, Ferrari KJ, Pasini D (2019) Functional landscape of PCGF proteins reveals both RING1A/B‐dependent‐and RING1A/B‐independent‐specific activities. Mol Cell 74: 1037–1052.e1037 [DOI] [PMC free article] [PubMed] [Google Scholar]
- Schoenfelder S, Sugar R, Dimond A, Javierre BM, Armstrong H, Mifsud B, Dimitrova E, Matheson L, Tavares‐Cadete F, Furlan‐Magaril M et al (2015) Polycomb repressive complex PRC1 spatially constrains the mouse embryonic stem cell genome. Nat Genet 47: 1179–1186 [DOI] [PMC free article] [PubMed] [Google Scholar]
- Schoorlemmer J, Marcos‐Gutierrez C, Were F, Martinez R, Garcia E, Satijn DP, Otte AP, Vidal M (1997) Ring1A is a transcriptional repressor that interacts with the Polycomb‐M33 protein and is expressed at rhombomere boundaries in the mouse hindbrain. EMBO J 16: 5930–5942 [DOI] [PMC free article] [PubMed] [Google Scholar]
- Shastrula PK, Sierra I, Deng Z, Keeney F, Hayden JE, Lieberman PM, Janicki SM (2019) PML is recruited to heterochromatin during S phase and represses DAXX‐mediated histone H3.3 chromatin assembly. J Cell Sci 132: jcs220970 [DOI] [PMC free article] [PubMed] [Google Scholar]
- Sommer C, Gerlich DW (2013) Machine learning in cell biology ‐ teaching computers to recognize phenotypes. J Cell Sci 126: 5529–5539 [DOI] [PubMed] [Google Scholar]
- Sproll P, Eid W, Gomes CR, Mendonca BB, Gomes NL, Costa EM, Biason‐Lauber A (2018) Assembling the jigsaw puzzle: CBX2 isoform 2 and its targets in disorders/differences of sex development. Mol Genet Genomic Med 6: 785–795 [DOI] [PMC free article] [PubMed] [Google Scholar]
- Stielow B, Sapetschnig A, Wink C, Kruger I, Suske G (2008) SUMO‐modified Sp3 represses transcription by provoking local heterochromatic gene silencing. EMBO Rep 9: 899–906 [DOI] [PMC free article] [PubMed] [Google Scholar]
- Szenker E, Ray‐Gallet D, Almouzni G (2011) The double face of the histone variant H3.3. Cell Res 21: 421–434 [DOI] [PMC free article] [PubMed] [Google Scholar]
- Tammsalu T, Matic I, Jaffray EG, Ibrahim AFM, Tatham MH, Hay RT (2014) Proteome‐wide identification of SUMO2 modification sites. Sci Signal 7: rs2 [DOI] [PMC free article] [PubMed] [Google Scholar]
- Tang J, Wu S, Liu H, Stratt R, Barak OG, Shiekhattar R, Picketts DJ, Yang X (2004) A novel transcription regulatory complex containing death domain‐associated protein and the ATR‐X syndrome protein. J Biol Chem 279: 20369–20377 [DOI] [PubMed] [Google Scholar]
- Tardat M, Albert M, Kunzmann R, Liu Z, Kaustov L, Thierry R, Duan S, Brykczynska U, Arrowsmith CH, Peters AH (2015) Cbx2 targets PRC1 to constitutive heterochromatin in mouse zygotes in a parent‐of‐origin‐dependent manner. Mol Cell 58: 157–171 [DOI] [PubMed] [Google Scholar]
- Tatavosian R, Kent S, Brown K, Yao T, Duc HN, Huynh TN, Zhen CY, Ma B, Wang H, Ren X (2019) Nuclear condensates of the Polycomb protein chromobox 2 (CBX2) assemble through phase separation. J Biol Chem 294: 1451–1463 [DOI] [PMC free article] [PubMed] [Google Scholar]
- Terranova R, Yokobayashi S, Stadler MB, Otte AP, van Lohuizen M, Orkin SH, Peters AH (2008) Polycomb group proteins Ezh2 and Rnf2 direct genomic contraction and imprinted repression in early mouse embryos. Dev Cell 15: 668–679 [DOI] [PubMed] [Google Scholar]
- Völkel P, Le Faou P, Vandamme J, Pira D, Angrand P‐O (2012) A human Polycomb isoform lacking the Pc box does not participate to PRC1 complexes but forms protein assemblies and represses transcription. Epigenetics 7: 482–491 [DOI] [PubMed] [Google Scholar]
- Walter M, Teissandier A, Perez‐Palacios R, Bourc'his D (2016) An epigenetic switch ensures transposon repression upon dynamic loss of DNA methylation in embryonic stem cells. Elife 5: e11418 [DOI] [PMC free article] [PubMed] [Google Scholar]
- Yamagata K, Yamazaki T, Yamashita M, Hara Y, Ogonuki N, Ogura A (2005) Noninvasive visualization of molecular events in the mammalian zygote. Genesis 43: 71–79 [DOI] [PubMed] [Google Scholar]
- Yoshida N, Perry AC (2007) Piezo‐actuated mouse intracytoplasmic sperm injection (ICSI). Nat Protoc 2: 296–304 [DOI] [PubMed] [Google Scholar]
- Zhao Q, Xie Y, Zheng Y, Jiang S, Liu W, Mu W, Liu Z, Zhao Y, Xue Y, Ren J (2014) GPS‐SUMO: a tool for the prediction of sumoylation sites and SUMO‐interaction motifs. Nucleic Acids Res 42: W325–W330 [DOI] [PMC free article] [PubMed] [Google Scholar]
- Zhen CY, Duc HN, Kokotovic M, Phiel CJ, Ren X (2014) Cbx2 stably associates with mitotic chromosomes via a PRC2‐ or PRC1‐independent mechanism and is needed for recruiting PRC1 complex to mitotic chromosomes. Mol Biol Cell 25: 3726–3739 [DOI] [PMC free article] [PubMed] [Google Scholar]
Associated Data
This section collects any data citations, data availability statements, or supplementary materials included in this article.
Supplementary Materials
Appendix
Expanded View Figures PDF
Table EV1
Table EV2
Table EV3
Movie EV1
Movie EV2
Movie EV3
Movie EV4
Movie EV5
Movie EV6
Movie EV7
Movie EV8
Source Data for Expanded View
Review Process File
Source Data for Figure 1
Source Data for Figure 2
Source Data for Figure 3
Source Data for Figure 4
Source Data for Figure 5
Source Data for Figure 6
Source Data for Figure 7
Data Availability Statement
The datasets produced in this study are available in the following databases:
RNA‐Seq data: Gene Expression Omnibus GSE137030 (https://www.ncbi.nlm.nih.gov/geo/query/acc.cgi?acc=GSE137030)
RNA‐Seq data: Gene Expression Omnibus GSE133442 (https://www.ncbi.nlm.nih.gov/geo/query/acc.cgi?acc=GSE133442)
ChIP‐Seq data: Gene Expression Omnibus GSE107348 (https://www.ncbi.nlm.nih.gov/geo/query/acc.cgi?acc=GSE107348).