Abstract
The mitochondria are essential regulators of cellular energy and metabolism and they play a critical role in sustaining growth and survival of cancer cells. A central process of the mitochondria is the synthesis of ATP through oxidative phosphorylation (OXPHOS) known as bioenergetics. The mitochondria maintain OXPHOS by creating a membrane potential gradient (ΔΨ) that is generated by the electron transport chain (ETC) in order to drive ATP synthesis1. Mitochondria are essential for tumor initiation and maintenance of tumor cell growth in cell culture and xenografts2,3. However, our understanding of oxidative mitochondrial metabolism in cancer is limited because the majority of studies have been performed in vitro in cell culture models. This has left a large gap in our knowledge of how oxidative mitochondrial metabolism supports tumor growth and highlights a need for in vivo studies. Therefore we sought to measure mitochondrial ΔΨ in vivo in non-small cell lung cancer (NSCLC) using a voltage sensitive, positron emission tomography (PET) tracer known as 4-[18F]fluorobenzyl triphenylphosphonium (18FBnTP)4. We used 18FBnTP PET imaging to profile mitochondrial ΔΨ in autochthonous mouse models of lung cancer and discovered distinct functional mitochondrial heterogeneity within NSCLC tumor subtypes. The use of 18FBnTP PET imaging enabled us to functionally profile mitochondrial ΔΨ in live tumors.
Keywords: mitochondria, 18FBnTP, membrane potential, bioenergetics, OXPHOS, non-small cell lung cancer, Kras, Lkb1, tumor heterogeneity
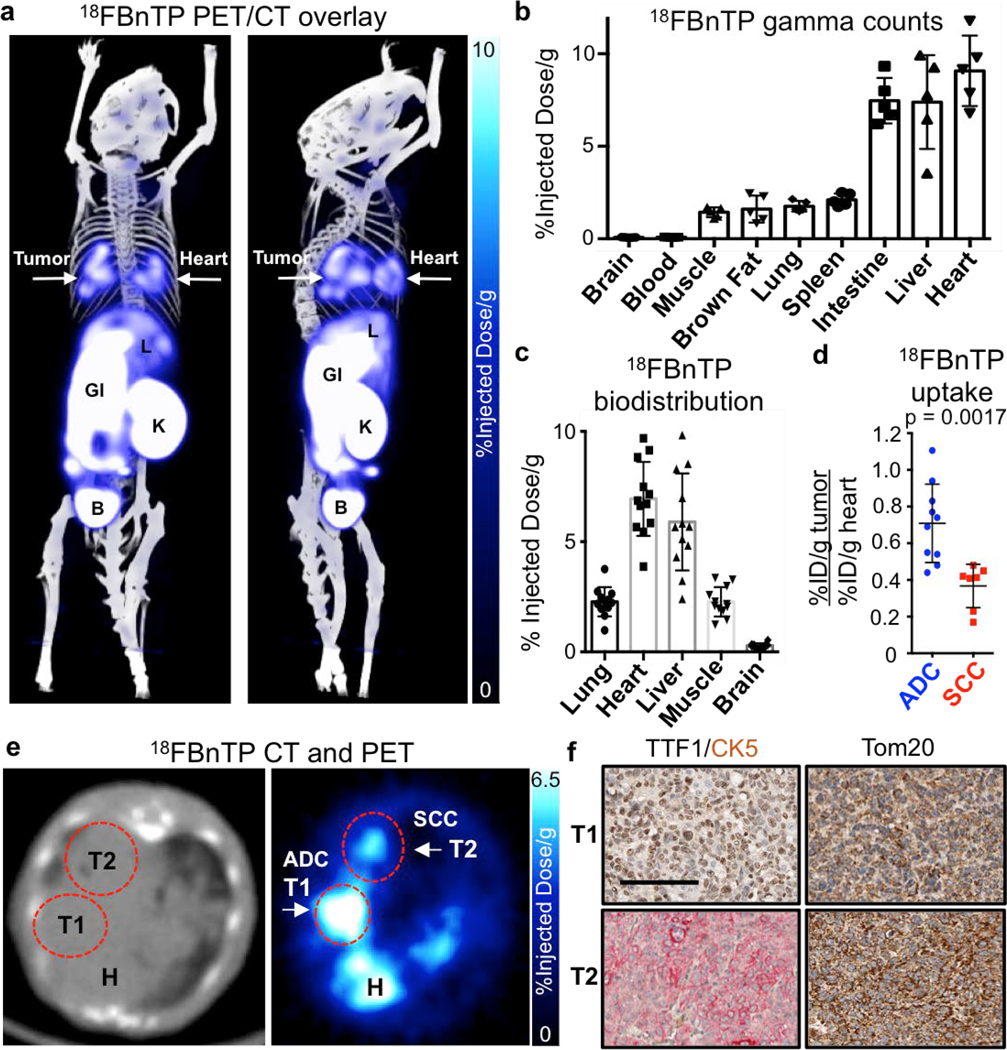
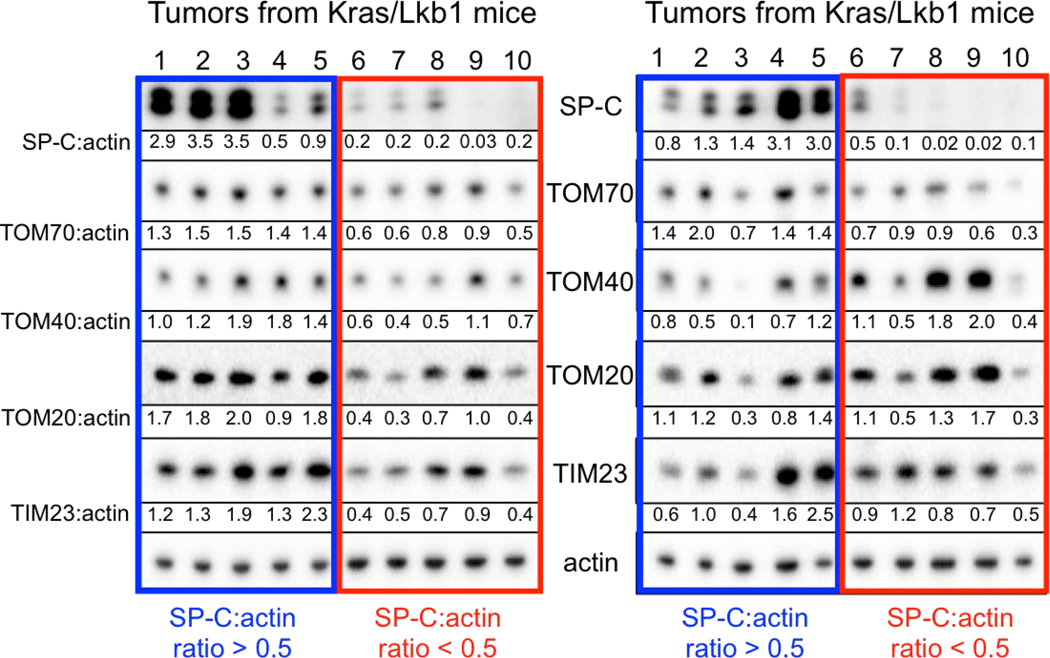
Mitochondria are required for lung tumorigenesis as was shown in a KrasG12D driven genetically engineered mouse models (GEMM) of lung cancer5. Therefore we used KrasG12D mutant, Lkb1 deficient (KL) GEMMs to perform 18FBnTP PET imaging on lung tumors in vivo6,7. 18FBnTP is a positively charged lipophilic cation that localizes to the negatively charged mitochondrial inner membrane in a voltage-dependent manner8,9. 18FBnTP has been studied in rodent and canine myocardium to detect myocardial infarction4,10 and in tumor xenografts as a surrogate marker of apoptosis following chemotherapy treatment11. While mass spectroscopy based approaches have been used to study ΔΨ12, no study to date has used 18FBnTP PET to measure mitochondrial ΔΨ using autochthonous murine models of lung cancer. We first synthesized 18FBnTP as previously described13 and performed PET imaging on lung tumors in KL mice ten weeks post tumor induction. We identified both 18FBnTP positive lung tumors and heart (Figure 1a). We performed biodistribution analysis of tissues by either measuring gamma counts or percent injected dose per gram (%ID/g) and confirmed high uptake of the tracer in the heart, liver and intestine as well as low uptake in normal lung, skeletal muscle and brain (Figures 1b,c). Analysis of 18FBnTP PET imaged KL mice identified two distinct populations of lung tumors distinguished by either high or low 18FBnTP uptake (Figure 1d,e). Interestingly, we confirmed that tumors with high 18FBnTP avidity segregated with lung adenocarcinomas (ADCs) while lung squamous cell carcinomas (SCC) tumors had uniformly lower avidity for 18FBnTP (Figures 1d). We confirmed lung tumor histology by staining tumors for cytokeratin 5 (CK5) to mark SCC and thyroid transcription factor 1 (TTF1) or surfactant protein C (SP-C) to identify ADCs (Figure 1f; Extended Data Figure 1). We suspected low mitochondrial content in lung SCC may have explained the reduced ΔΨ and 18FBnTP uptake. Therefore, we stained tumors for the pan mitochondrial marker Tom20 and confirmed similar staining intensities for both lung ADC and SCC (Figure 1f). We performed additional analysis of the mitochondrial membrane proteins Tom20, 40, 70 and Tim23 in lung ADC and SCC from KL mice and showed that ADCs (SP-C:actin ratio >0.5) had no discernable difference in expression of these proteins as compared to SCC (SP-C:actin ratio <0.5) (Extended Data Figure 1). These results demonstrate that both tumor subtypes have similar mitochondrial content but a two-fold difference in 18FBnTP affinity (Figure 1d).
Figure 1. 18FBnTP PET imaging and biodistribution analysis of KL lung tumors identified differential uptake between lung adenocarcinomas (ADC) and squamous cell carcinomas (SCC).
a, PET/CT overlay of a KL mouse with lung tumors, imaged with 18FBnTP. Right panel is rotated 90° compared to left panel. Heart (H) and tumor (T) are indicated by arrows. L – liver; GI – gastrointestinal tract; K – Kidney; B – Bladder. b, Biodistribution of 18FBnTP probe in tissue from wild type FVB mice measured by gamma counter ex vivo after 1 hr uptake (n = 5 mice). c, Biodistribution of the 18FBnTP probe in normal tissue of KL mice measured by % injected dose/gram after 1 hr uptake (n = 12 mice). d, 18FBnTP uptake in lung ADC and SCC from KL mice (n = 5 mice, n = 10 ADC tumors, n = 7 SCC tumors). e, Representative transverse image of the heart and lungs of a KL mouse imaged with CT (left panel) and 18FBnTP (right panel). H – heart, T1 – adenocarcinoma (ADC), T2 – squamous cell carcinoma (SCC). f, IHC staining of T1 and T2 tumors from panel e. TTF1 – thyroid transcription factor 1; CK5 – keratin 5; Tom20 – translocase of outer membrane 20. Scale bar = 100 μm. The data are represented as the mean +/− SD. Statistical significance was calculated using unpaired two-tailed t-test. Experiments in b, c were done once. Data in a, d, e, f are representative of experiments repeated thrice, with similar results obtained.
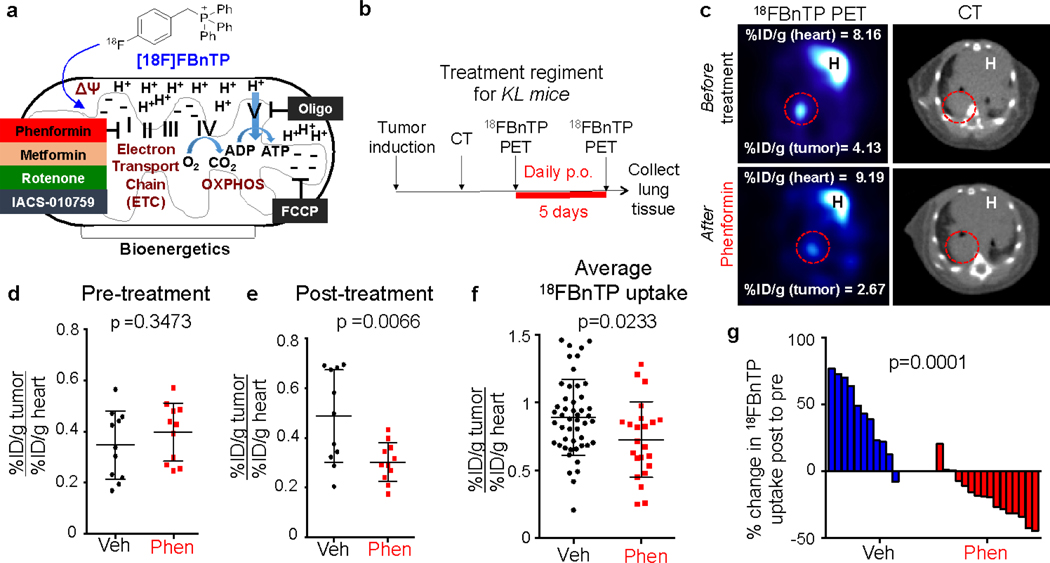
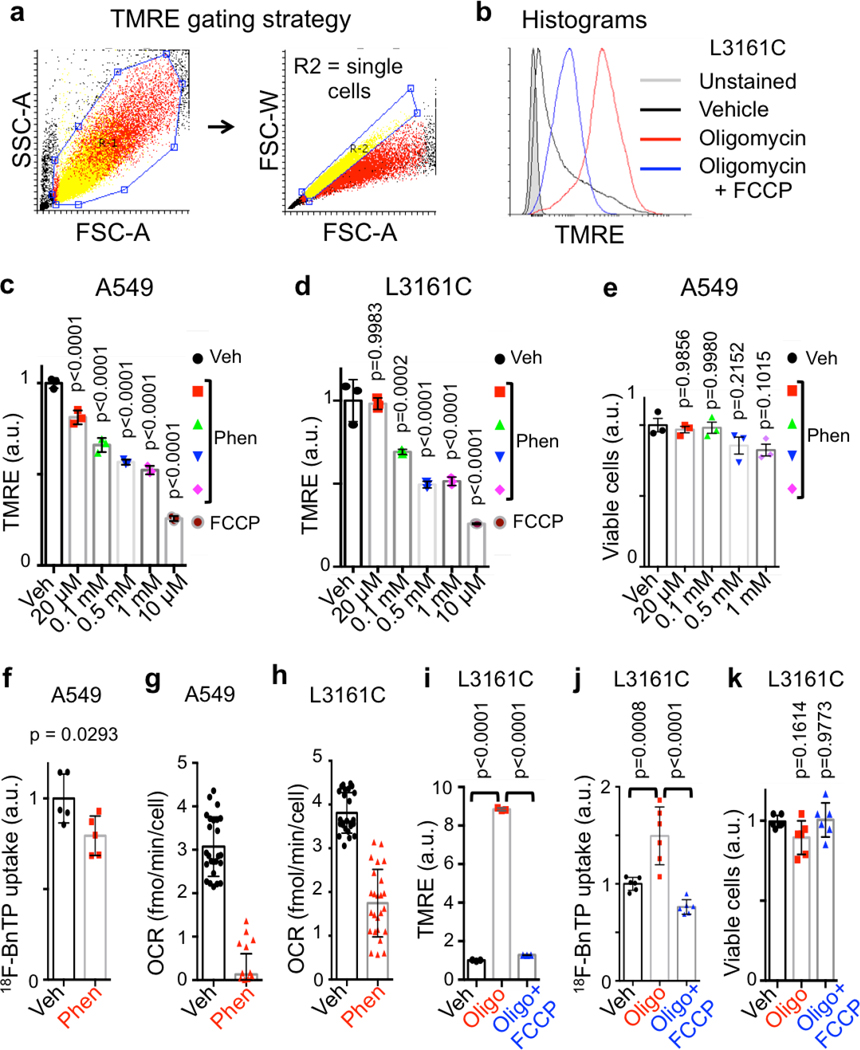
We next sought to validate 18FBnTP as a voltage sensitive marker of both ΔΨ and OXPHOS by treating cells with mitochondrial complex I inhibitor phenformin, which dissipates ΔΨ and inhibits OXPHOS14 (Figure 2a). Short-term phenformin treatment of the human lung ADC cell line A549 or the mouse lung ADC line L3161C (derived from a KrasG12D;p53−/−;Lkb1−/− mouse) significantly reduced ΔΨ in a dose dependent manner but did not affect cell viability (Extended Data Figures 2a–e). Likewise, acute treatment of A549 cells with phenformin significantly reduced 18FBnTP uptake similar to results with TMRE staining (Extended Data Figure 2f). Phenformin also resulted in a significant reduction of cellular OXPHOS in both A549 and L3161C cells as measured by respirometry (Extended Data Figures 2g, h). Lastly, we treated L3161C cells with oligomycin, a complex V ATPase inhibitor, which induces increased ΔΨ. We detected a significant increase in TMRE and 18FBnTP uptake following oligomycin treatment while ΔΨ was significantly reduced following the addition of the mitochondrial uncoupler FCCP (Extended Data Figures 2i, j) matching a response equal to the MitoClick probe12. Oligomycin +/− FCCP did not significantly affect cell viability (Extended Data Figure 2k).
Figure 2. Treatment of KL mice with the complex I inhibitor phenformin suppresses 18FBnTP uptake in lung tumors.
a, Schematic drawing representing voltage dependent uptake of 18FBnTP into the mitochondria. Bioenergetics driven by electron transport chain (ETC), and oxidative phosphorylation (OXPHOS) are shown. b, Schematic drawing of imaging and treatment regiments for KL mice treated with 125 mg/kg/day Phenformin. c, Representative images from a KL mouse before (top panel) and after (bottom panel) treatment for 5 days with 125 mg/kg/day Phenformin. Values for maximum percent injected dose (%ID/g) for the heart and tumor are indicated. H – heart. c, Quantification of maximum percent injected dose (%ID/g) for tumors in Vehicle (Veh) and Phenformin (Phen) groups before treatment (Pre-treatment). Each dot represents an individual tumor; n = 11 tumors for Vehicle and Phenformin groups. d, Quantification of maximum 18FBnTP uptake for tumors in Vehicle and Phenformin groups after treatment (Post-treatment) with 125 mg/kg/day Phenformin for 5 days. Each dot represents an individual tumor; n = 11 tumors for Vehicle and Phenformin groups. e, Average 18FBnTP uptake in KL mice after 5 day treatment with Vehicle (n = 48 tumors; 10 mice) or Phenformin (n = 23 tumors; 10 mice). Each dot represents an individual tumor. f, Waterfall plot for % change in probe uptake post-treatment to pre-treatment for mice treated with Vehicle or Phenformin for 5 days. Each bar represents an individual tumor. The data are represented as the mean +/− SD. Statistical significance was calculated using unpaired two-tailed t-test. Data in d, e, f are from two separate mouse experiments. Data in g are from three individual mouse experiments.
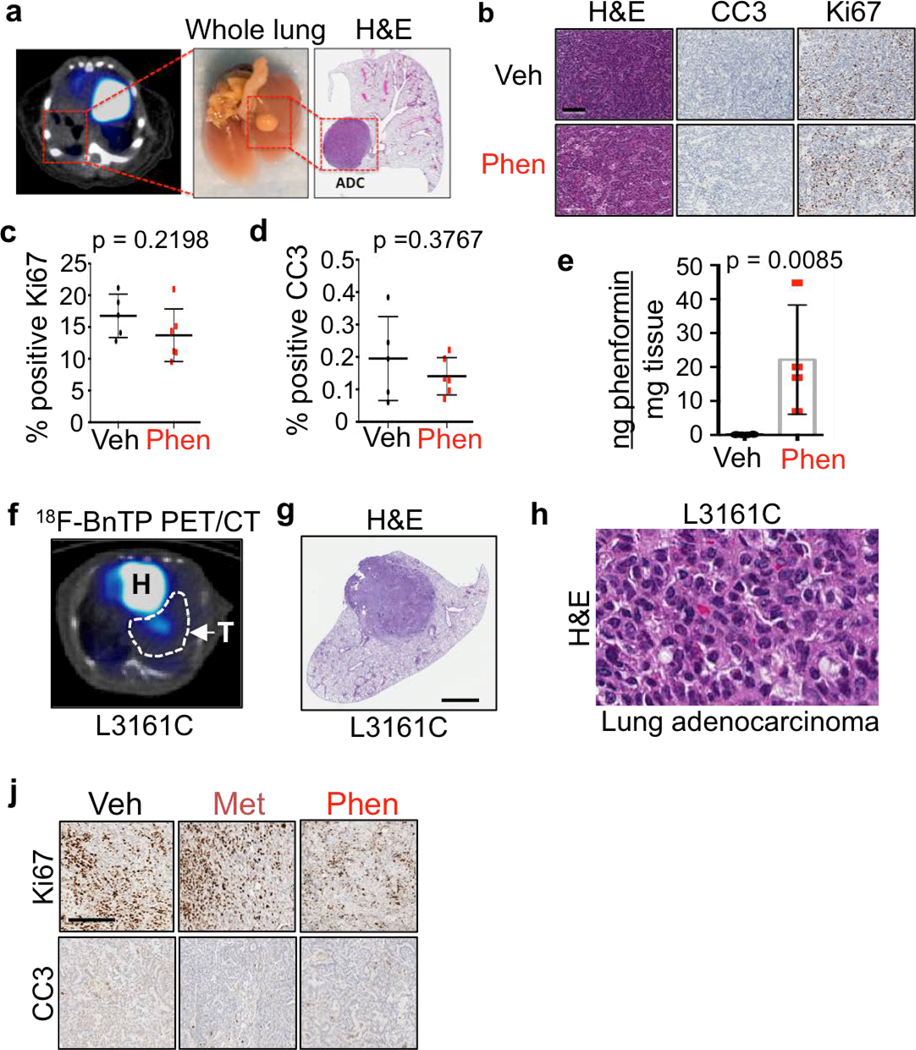
We next measured 18FBnTP uptake in lung tumors of KL mice before and after phenformin or vehicle (saline) treatment (Figure 2b). Representative PET images show reduced 18FBnTP uptake in phenformin treated lung tumors (Figure 2c). Treatment groups showed no significant difference in 18FBnTP uptake values before start of the treatment (Figure 2d) but showed a significant reduction in 18FBnTP uptake in the mice that received phenformin (Figure 2e). Three independent experiments were performed on KL mice that demonstrated a significant reduction in 18FBnTP uptake in phenformin treated lung tumors as compared to vehicle (Figure 2f). We further quantified the percent change in 18FBnTP uptake following treatment and showed that phenformin induced a significant drop in tracer uptake compared to vehicle treated mice (Figure 2g). KL lung ADCs are sensitive to phenformin,7 therefore it was possible that reduced 18FBnTP uptake was due to phenformin induced cell death. Cleaved Caspase 3 (CC3) and Ki67 staining showed no evidence of phenformin induced apoptosis or reduced cell viability (Extended Data Figures 3a–d) agreeing with previously published studies that showed longer duration of phenformin treatment induced cellular apoptosis7,15. Mass spectrometry analysis of phenformin treated KL lung tumors showed a significant increase in intra-tumoral phenformin as compared to vehicle treated tumors (Extended Data Figure 3e). Collectively, results in Figure 2 demonstrate that 18FBnTP is a voltage sensitive probe that detected changes in ΔΨ and OXPHOS in vitro and in vivo in lung tumor cells.
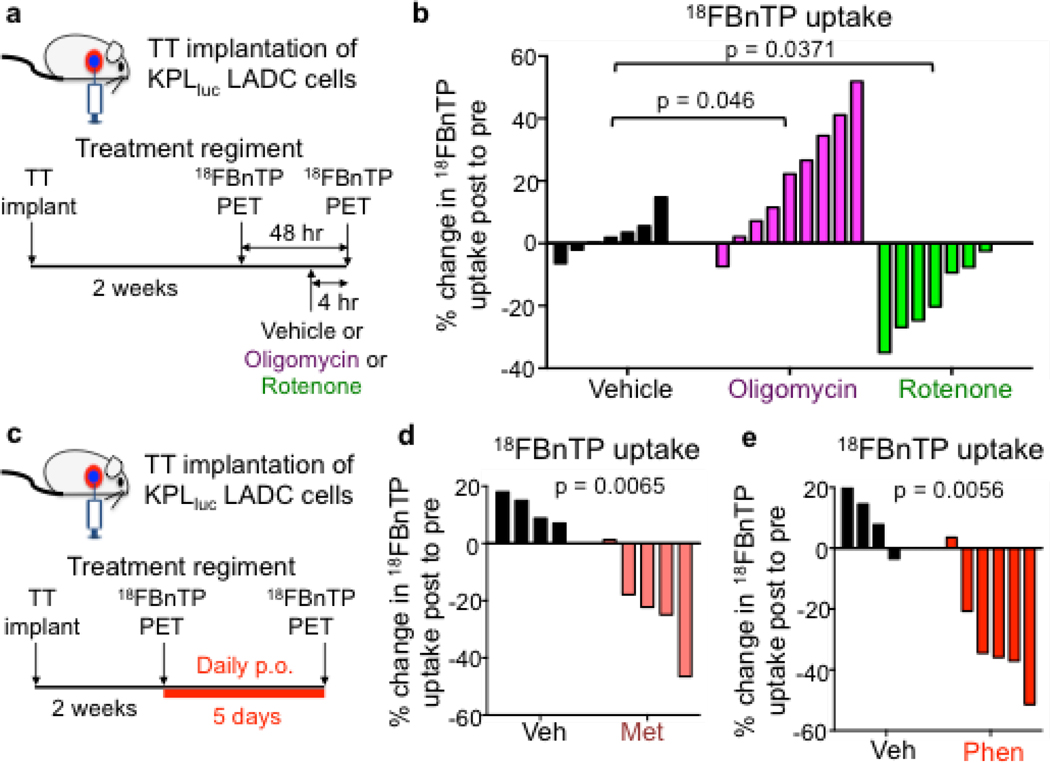
We then investigated whether 18FBnTP could selectively measure changes in ΔΨ and OXPHOS in vivo following treatment with a broader panel of ETC inhibitors. The complex I inhibitors included metformin, phenformin, or rotenone, which all reduce ΔΨ and suppress OXPHOS7,14,16 as well as the complex V inhibitor oligomycin, which induces an increase in ΔΨ. We utilized an orthotopic mouse model in which we transthoracically (TT) implanted L3161C lung tumor cells into the left lobe of syngeneic recipient mice (Figure 3a) to profile ΔΨ in lung tumors. Importantly, this enabled us to spatially localize a single lung tumor in the left lobe of the mouse and perform 18FBnTP PET imaging on mouse lung ADC tumors (Extended Data Figures 3f–h). We then measured 18FBnTP uptake in syngeneic mice TT implanted with L3161C cells following acute 4 hour treatment with either oligomycin or rotenone17 (Figure 3a). We used a safely tolerated dose of rotenone (0.5 mg/kg) or oligomycin (0.25 mg/kg) below the toxic dose range18. We show that 18FBnTP uptake in lung tumors was significantly increased after delivery of oligomycin whereas rotenone treatment significantly reduced 18FBnTP uptake (Figure 3b). Our results demonstrate that 18FBnTP PET detected acute changes in ΔΨ in lung tumors following inhibition of respiratory complexes I or V.
Figure 3. 18FBnTP detects mitochondrial complex I inhibition in vivo.
a, Schematic drawing of the transthoracic (TT) implantation of KPL lung adenocarcinoma (ADC) cells into syngeneic recipient mouse, imaging and treatment regiments. b, Waterfall plot for % change in 18FBnTP uptake post-treatment to pre-treatment for mice treated with a single dose of Vehicle (n = 7 mice) or 0.25 mg/kg Oligomycin (n = 9 mice) or 0.5 mg/kg Rotenone (n = 7 mice). Statistical significance was calculated using one way ANOVA. c, Schematic drawing of the treatment and imaging regiment for syngeneic mice implanted transthoracically with KPL lung ADC cells and treated with Vehicle or Complex I inhibitor for the indicated time. d, Waterfall plot for % change in 18FBnTP uptake post-treatment to pre-treatment for mice treated with Vehicle (n = 4 mice) or 500 mg/kg Metformin (n = 5 mice) for 5 days. e, Waterfall plot for % change in 18FBnTP uptake post-treatment to pre-treatment for mice treated with Vehicle (n = 4 mice) or 125 mg/kg Phenformin (n = 6 mice) for 5 days. Experiments in b, d, and e were performed once. Statistical significance for d and e was calculated using unpaired two-tailed t-test.
At a cellular level metformin, like phenformin, inhibits mitochondrial complex I resulting in reduced OXPHOS19–21, and is broadly used world wide to clinically manage type 2 diabetes22. We therefore sought to determine if 18FBnTP PET could measure direct changes in the ΔΨ and complex I activity of lung tumors in vivo following systemic treatment of mice with metformin (Figure 3c). Our results show that 18FBnTP uptake in lung tumors was significantly reduced in the mice that received metformin compared to the vehicle treated mice (Figure 3d). As expected it had slightly less inhibition of 18FBnTP uptake than its more potent analog phenformin (Figures 3d and 3e). Similar to phenformin, metformin did not induce apoptosis, cell death or significantly alter tumor growth as measured by CC3 and Ki67, respectively (Extended Data Figure 3j). These results confirm that 18FBnTP imaging can accurately detect a loss of ΔΨ following delivery of metformin.
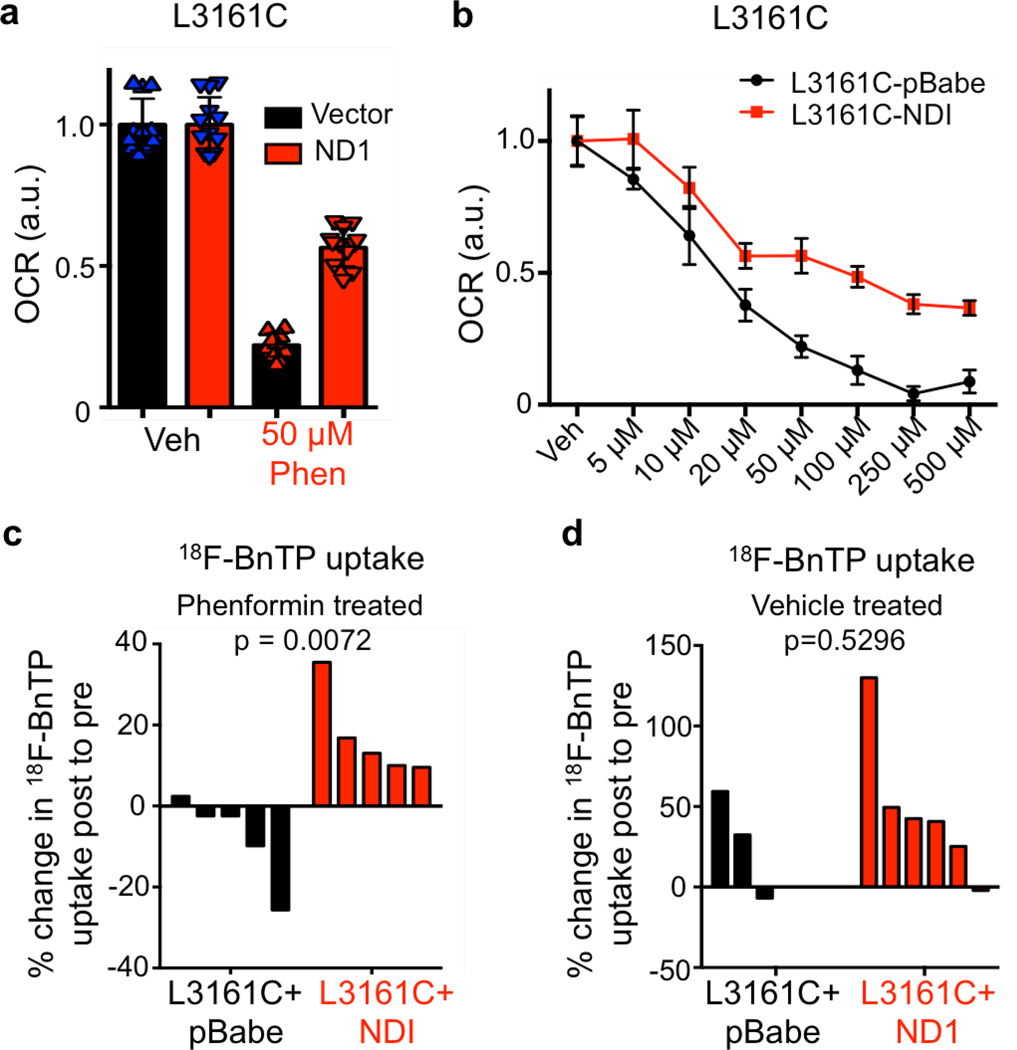
We next tested whether expression of the Saccharomyces cerevisiae NADH dehydrogenase (ND1), which oxidizes NADH similar to mammalian mitochondrial complex I, would render lung tumor cells insensitive to biguanides and prevent loss of 18FBnTP uptake following complex I inhibition21,23. Expression of ND1 in L3161C lung tumor cells (L3161C-ND1) conferred resistance to phenformin as L3161C-ND1 cells maintained higher OXPHOS following phenformin treatment as compared to cells expressing the vector alone (Extended Data Figures 4a, b). 18FBnTP PET imaging identified that L3161C-ND1 tumors were resistant to phenformin and showed no loss of 18FBnTP uptake as compared to vector expressing L3161C tumors (Extended Data Figure 4c) while vehicle treated L3161C-ND1 and vector tumors were both positive for 18FBnTP uptake (Extended Data Figure 4d). Our results demonstrate that 18FBnTP imaging is sensitive to functional changes in complex I activity.
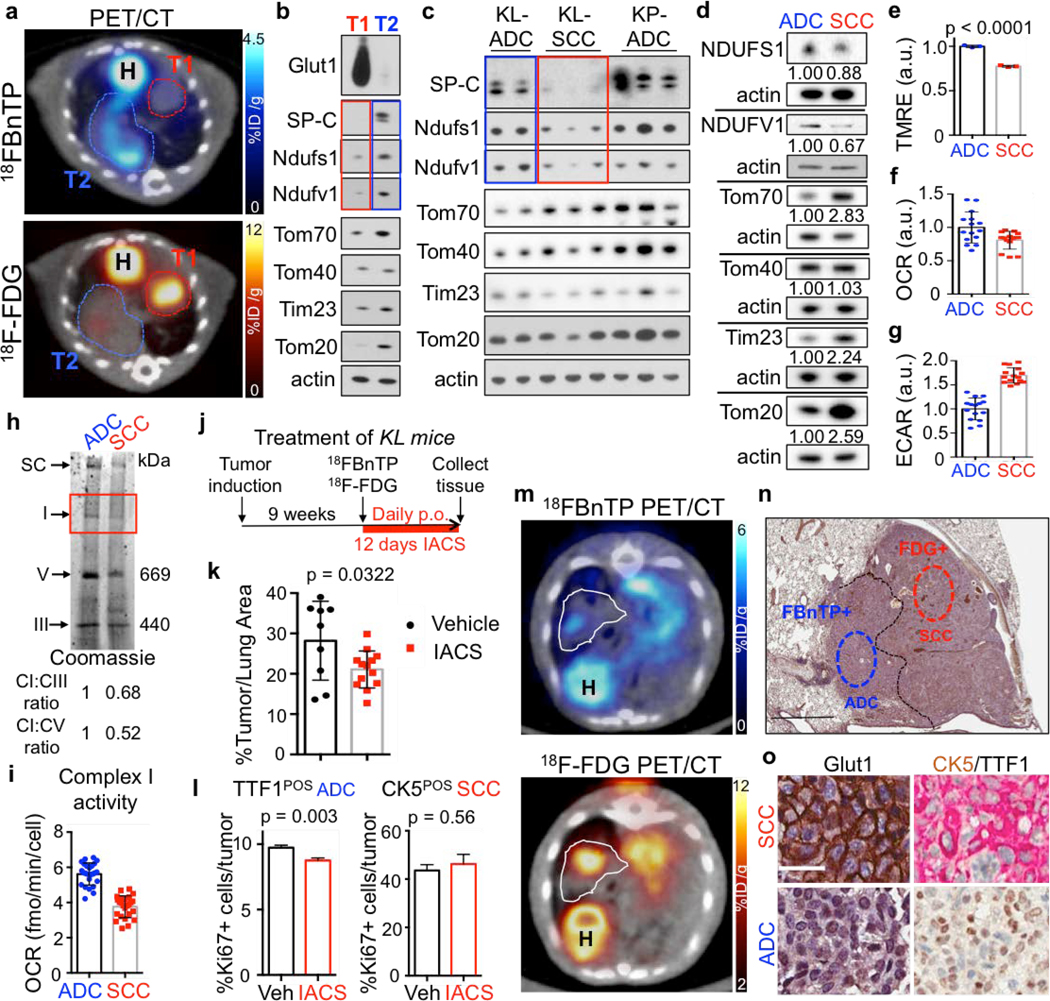
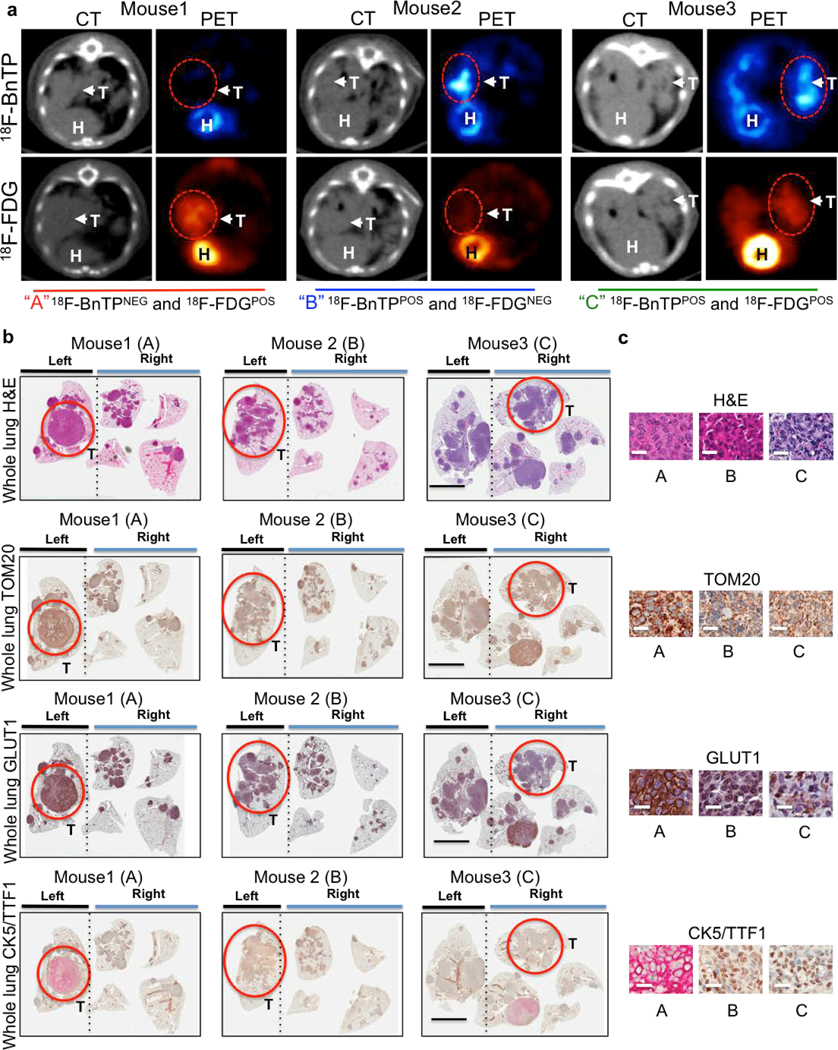
NSCLC is marked by genetic, metabolic and histological heterogeneity in tumors24–26. We next sought to perform multi-tracer PET imaging on KL mice using both 18FBnTP and [18F]Fluoro-2-deoxyglucose (18F-FDG) PET tracers as a means to non-invasively profile glucose metabolism with 18F-FDG and mitochondrial ΔΨ with 18FBnTP. Multi-tracer PET imaging of KL lung tumors revealed distinct metabolic heterogeneity between lung tumors in which we identified three distinct tumor populations – glycolytic 18F-FDGPOS/18FBnTPNEG tumors, oxidative 18FBnTPPOS/18F-FDGNEG tumors and those with increased uptake of both tracers (Extended Data Figure 5a). Histological analysis of PET imaged lung tumors revealed that 18F-FDGPOS/18FBnTPNEG tumors tumors were SCC marked by positive CK5-TTF1staining and 18FBnTPPOS/18F-FDGNEG tumors were positive for TTF1 and absent of CK5 staining confirming ADC histology (Extended Data Figures 5b,c).
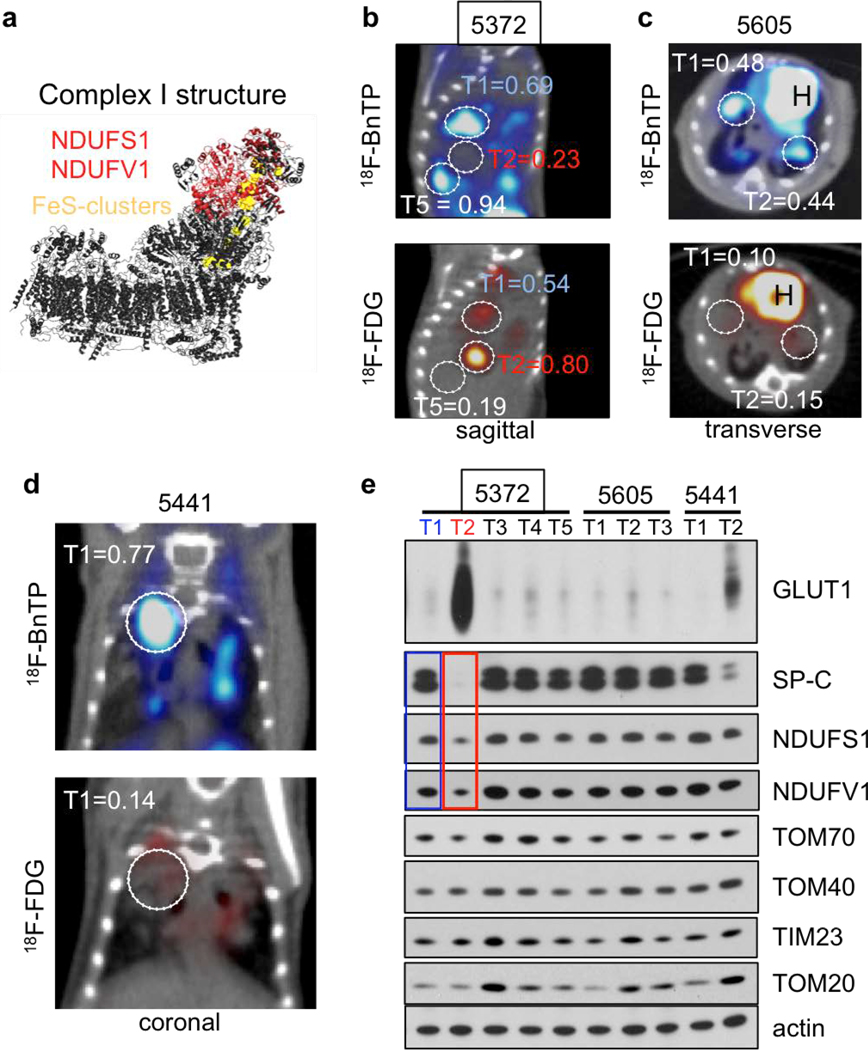
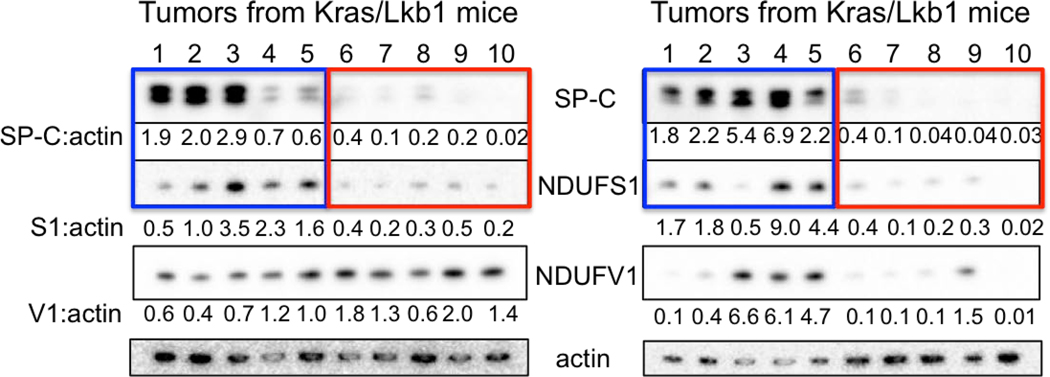
Both lung ADC and SCC showed distinct 18FBnTP and 18F-FDG profiles suggesting these tumor subtypes may have distinct bioenergetic profiles. Previous studies have shown that lung SCC tumors from KL mice are refractory to phenformin, which suggested that lung SCC tumors may harbor intrinsic defects in complex I that modulate response to complex I inhibition15,27. Supporting this, a study of mitochondrial proteins in human NSCLC identified that late stage lung carcinomas have reduced expression of NDUFS1 and NDUFV128, which are complex I subunits involved in the transfer of electrons from NADH (Extended Data Figure 6a). We performed a PET guided biochemical analysis of Ndufs1 and Ndufv1 in lung ADCs and SCCs in KL mice. We identified that 18FBnTPNEG/18F-FDGPOS SCC tumors (shown in red) had a marked reduction in Ndfus1 and Ndufv1 proteins as compared to 18FBnTPPOS/18F-FDGNEG ADCs (shown in blue) (Figures 4a,b; Extended Data Figures 6b–d). We analyzed Ndfus1 and Ndufv1 proteins in lung ADC and SCC tumors from KL mice across three independent experiments and discovered that SCCs (red boxes) had a consistent reduction in Ndfus1 as compared to ADCs (blue boxes) (Figure 4c; Extended Data Figures 6e and 7). Lung ADC and SCC were distinguished by the levels of SP-C protein. Additionally, immunoblots for Tom20, Tom40, Tom70 or Tim23 showed similar distribution of mitochondrial content between SCC and ADC tumors (Figures 4b,c; Extended Data Figure 1).
Figure 4. Multi-tracer PET imaging of KL lung tumors with 18FBnTP and 18F-FDG.
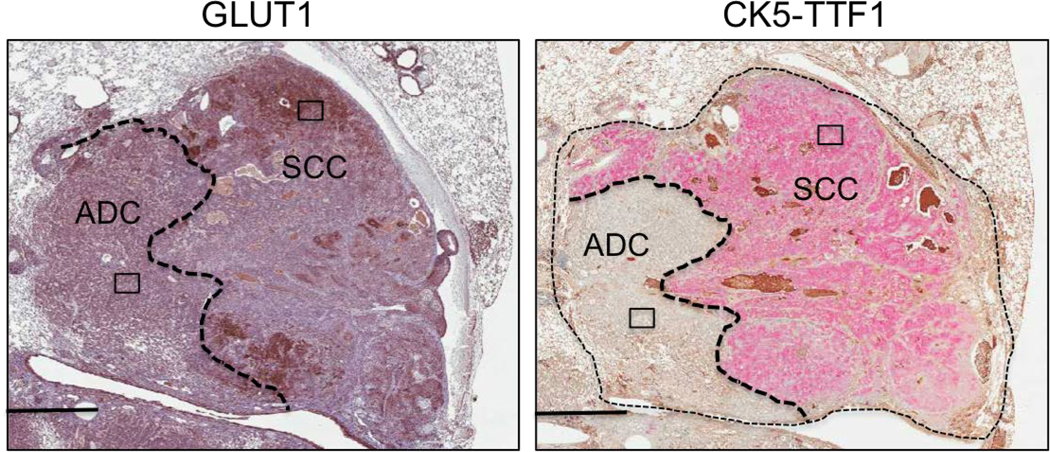
a, PET/CT images of a KL mouse with two tumors, T1 and T2. Top panel – 18FBnTP/CT overlay, bottom panel – 18F-FDG/CT overlay. H – heart. b, Western blot of T1 and T2 isolated from mouse imaged in a and probed with indicated antibodies. c, Western blot of tumors isolated from KL or KP mice and probed with indicated antibodies. d-i, Experiments performed on A549 (ADC) and RH2 (SCC) cell lines. d, Western blot probed with indicated antibodies. Loading control (β-actin) is shown for each blot; intensity of bands relative to actin is indicated. e, TMRE measurement (n = 3 biological replicates). f, Basal oxygen consumption rate (OCR) (n = technical 15 replicates). g, Extracellular acidification rate (ECAR) (n = technical 15 replicates). h, Coomassie staining of mitochondria isolated from A549 and RH2 cells separated on blue native gel. SC – supercomplex, I – complex I, V – complex V, III – complex III. Densitometry of the CI band corresponding to CV and CIII is indicated. i, Complex I activity in A549 and RH2 cells (n = technical 25 replicates). j, Schematic of the treatment regiment for KL mice. k, Percent of lung area occupied by tumors in KL mice treated with Vehicle or 15 mg/kg IACS-010759. N = 9 mice (Vehicle), n = 13 mice (IACS). l, Percent of Ki67 positive cells per tumor area quantified for TTF1 positive tumors (TTF1POS) for KL mice treated as indicated in j (left panel; n=861 [Vehicle]; n=1068 [IACS]) and CK5 positive tumors (CK5POS) tumors (right panel; n=31 [Vehicle]; n=26 [IACS]). The data are shown as the mean +/− SEM. m, Transverse view of a KL mouse imaged with 18FBnTP PET/CT (top panel) and 18F-FDG PET/CT (bottom panel). H – heart; tumor is outlined. n, H&E stain of the PET imaged tumor. Tumor histology is indicated. Scale bar = 1.0 mm. o, Representative images of Glut1 (left panel) and CK5/TTF1 (right panel) stained tumor. Scale bar = 25 μm. The data are represented as the mean +/− SD. Statistical significance was calculated using unpaired two-tailed t-test. Experiments in a, b, c, d-h were done twice with similar results. Experiments in i, k, l were done once. Data in m-o are representative of three independent mouse experiments.
We then examined the NDUFS1 and NDUFV1 proteins in the human lung ADC cell line A549 and lung SCC line RH2. Identical to mouse lung tumors, we identified a decrease in both the NDUFS1 and NDUFV1 proteins in RH2 cells compared to A549 cells (Figure 4d). Functional analysis of mitochondrial ΔΨ in human and mouse ADC and SCC cell lines demonstrated that the SCC tumor cells had a significantly reduced ΔΨ to that of ADC cells (Figure 4e; Extended Data Figure 8a). RH2 cells had a reduced oxygen consumption rate and an increased extracellular acidification rate compared to A549 cells (Figures 4f,g). Analysis of complex I in coomassie stained blue native gels showed that RH2 cells had lower complex I levels than A549 (Figure 4h). In addition, RH2 cells had reduced complex I activity as compared to A549 cells (Figure 4i). These results suggest that ΔΨ and complex I activity may be predictive of response to complex I inhibitors in which 18FBnTPPOS lung ADCs are predicted to have increased sensitivity compared to 18FBnTPNEG lung SCCs.
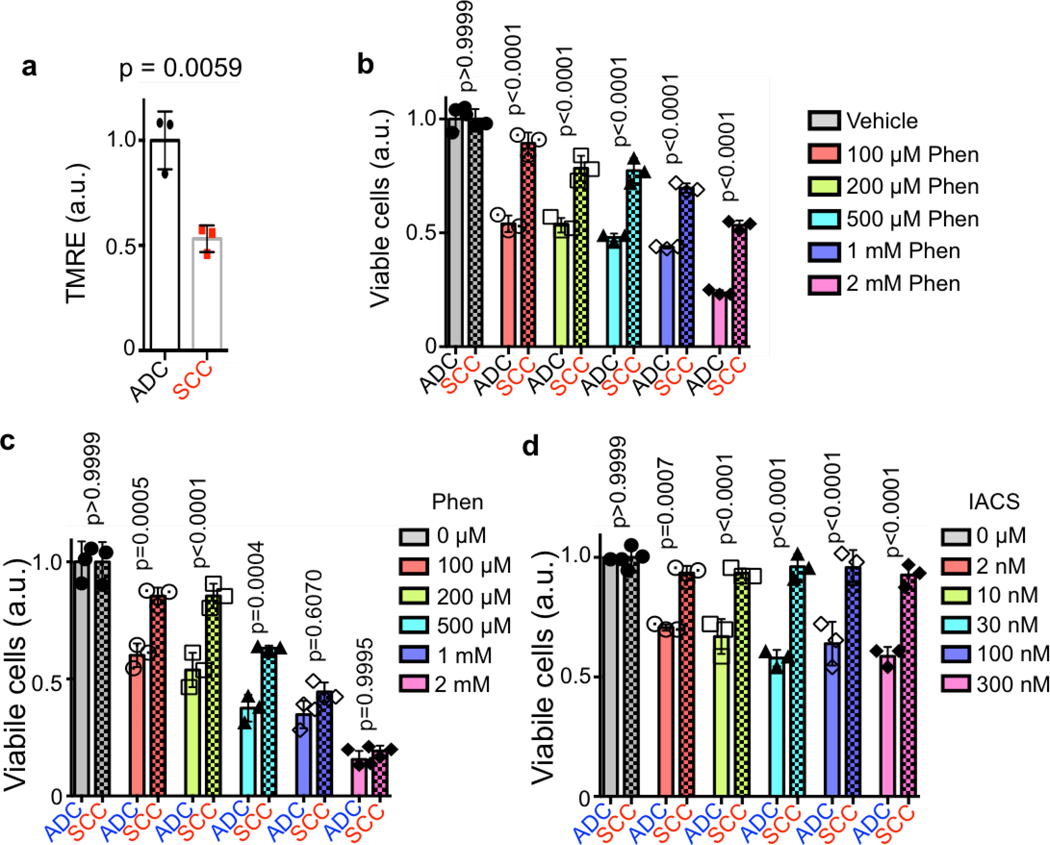
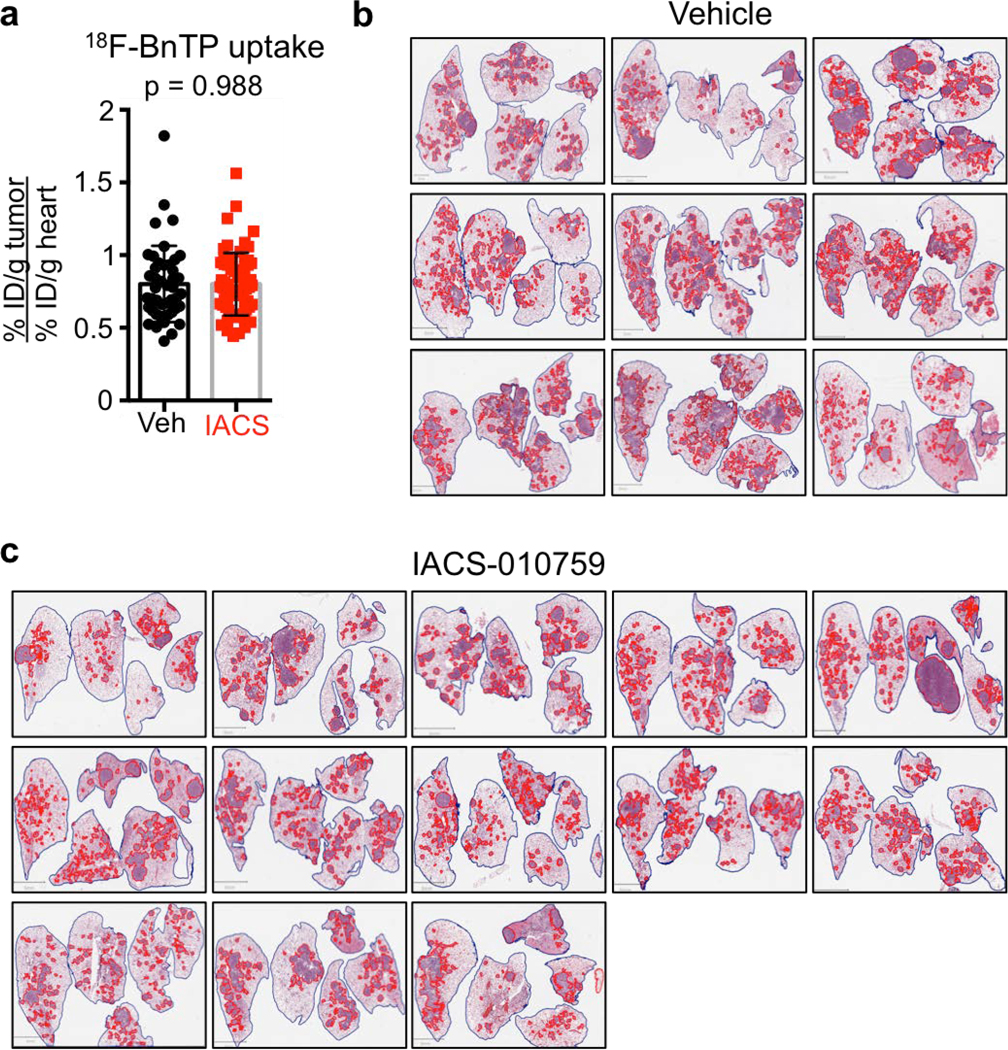
We next demonstrated that both human and mouse lung ADC cell lines were more sensitive to complex I inhibitors phenformin and IACS-01075929 at low doses compared to lung SCCs lines (Extended Data Figure 8b–d). We next tested IACS-010759 in vivo on KL mice and determined that 18FBnTPPOS tumors were sensitive to the complex I inhibition. KL mice were imaged by 18FBnTP and 18F-FDG PET before treatment to confirm the presence of 18FBnTPPOS tumors and binned into equal groups based on 18FBnTP uptake in tumors (Figure 4j; Extended Data Figure 9a). Mice receiving IACS-010759 showed a significant reduction in tumor burden compared to those receiving vehicle (Figure 4k; Extended Data Figure 9b,c). Our data predicted that 18FBnTPPOS ADCs would show increased sensitivity to IACS-010759 compared to 18FBnTPNEG SCCs. Analysis of tumor cell proliferation showed a significant reduction in Ki67 positive cells in TTF1+ ADCs treated with IACS-010759 while CK5+ SCCs were refractory to IACS-010759 (Figure 4l).
We next asked whether 18FBnTP/18F-FDG PET imaging could detect metabolic heterogeneity within individual lung tumors. We identified heterogeneous uptake of both 18FBnTP and 18F-FDG within single lung nodules from KL mice as represented in Figures 4m. Histological analysis revealed squamous cell differentiation in the 18F-FDGPOS/18FBnTPNEG region marked by positive staining for CK5 and Glut1. In contrast, the 18FBnTPPOS/18F-FDGNEG tumor region was ADC marked by positive TTF1 staining low expression of Glut1 (Figure 4m–o; Extended Data Figure 10). These results demonstrate that multi-tracer PET imaging with 18FBnTP and 18F-FDG was able to identify distinct mitochondrial and metabolic heterogeneity within individual lung tumors. Our study represents a novel and non-invasive approach to using 18FBnTP PET imaging to profile mitochondrial ΔΨ and functional mitochondrial heterogeneity within NSCLC. We detected distinct mitochondrial ΔΨ and complex I activity profiles in lung SCC and ADCs tumors that were predictive of response to complex I inhibitors. Our results suggest 18FBnTP may function as a noninvasive biomarker to guide the delivery of complex I inhibitors in cancer. 18FBnTP PET imaging represents a valuable resource not only to the field of cancer metabolism but one that can be extended to other fields actively investigating mitochondrial activity in aging, physiology and disease.
Methods
Cell culture
Cells were maintained at 37°C in a humidified incubator with 5% CO2. A549 cells were obtained from ATCC. The RH2 lung cancer cell line was previously established in our laboratories. All cell lines were routinely tested and confirmed to be free of Mycoplasma using the LookOut Mycoplasma PCR Detection Kit (Sigma). Cells were grown in Dulbecco’s modified Eagle’s medium (DMEM) plus 5% fetal bovine serum (Hyclone/Gemini) and 1% penicillin/streptomycin (Gibco).
Studies in GEMMs
We performed studies with the genetically engineered mouse model of lung cancer using Kras-Lox-Stop-Lox-G12D; Lkb1 Lox/Lox; Rosa26-Lox-Stop-Lox-Luc mice (KL) as described previously27. Briefly, lung tumors were induced by intranasal administration of 5 × 10⁵ transduction units of Lenti-PGK-Cre (Cat. # FCT071, Kerafast,) and developed nearly 100% lung adenocarcinomas as previously described7,27. KL mice that were inhaled with LentiCre were used in studies with Phenformin treatment. For studies where mice were imaged with both 18FBnTP and 18F-FDG probes, KL mice were inhaled with Adenoviral Cre which leads to development of both ADC and SCC tumors. For all treatments, KL mice were imaged with 18FBnTP and sorted into two groups based on tumor maximum percent injected dose per gram (%ID/g) values, so that two groups would have similar matched maximum %ID/g values. Treatment was initiated on the same day or on the following day after 18FBnTP imaging. Mice were treated with 125 mg/kg/day phenformin for 5 days or 15 mg/kg/day IACS-010759 for 12 days. The drugs were delivered by oral gavage. All experimental procedures that were performed on mice were approved by the UCLA Animal Research Committee (ARC). Mice were euthanized before the ARC approved endpoints were reached; none of the tumors exceeded maximum ARC defined volumes. Both male and female mice were used in all experiments and no preference in mouse gender was given for any of the studies.
Studies in syngeneic mice
We established the L3161C mouse cell line from a lung tumor dissected from a Kras;Lkb1;p53 (KPL) mouse. Following resection, the tumor was minced and incubated in collagenase/dispase (Cat. # 10269638001, Sigma) for 3 hr. Cells were filtered using a 70 μm strainer, centrifuged, resuspended in DMEM with 5% FBS and plated in a 6 cm dish. The following day media was changed and cells that attached were cultured. We confirmed that the L3161C cell line was adenocarcinoma by implanting cells in syngeneic mice, detecting lung tumors and staining tumor with H&E and CK5/TTF1. For imaging studies, 1×10⁵ L3161C cells suspended in 20 μl PBS were implanted into the left lung lobe via transthoracic injection. Two weeks after injections, mice were imaged by CT. Mice with similar sized tumors were used for 18FBnTP imaging. For treatment studies, syngeneic mice were imaged with 18FBnTP, and split into two groups (three groups for Fig 3b) based on tumor maximum %ID/g, such that maximum %ID/g of tumors in both groups would be similar. Treatment was then initiated for the specified time. Mice were treated with a single dose of 0.25 mg/kg Oligomycin or 0.5 mg/kg Rotenone; both drugs were delivered by i.p. injection. For other studies mice were treated with 125 mg/kg/day phenformin or 500 mg/kg/day metformin for 5 days; both drugs were delivered by oral gavage in the morning. Following imaging, mice were euthanized and tissue was harvested. For some experiments, lungs were fixed with 10% NBF overnight; for other experiments lung tumor nodules were rapidly dissected, snap frozen in liquid nitrogen and stored in −80°C freezer.
18FBnTP synthesis
We performed synthesis of the radio-tracer 18FBnTP as previously described13. The three-pot, four-step synthesis of [18F]FBnTP was performed using the automated radiochemical synthesizer ELIXYS FLEX/CHEM (Sofie Biosciences). The no-carrier-added [18F]fluoride was produced from the (p,n) reaction of [18O]H2O with an RDS-112 11 MeV cyclotron (Siemens) in a 1-ml tantalum target with Havar foil. [18F]Fluoride in water was pushed through a strong cation exchange (SCX) cartridge and trapped on a QMA cartridge. [18F]Fluoride was then eluted with a solution of Kryptofix 222 (10 mg, 27 μmol) and K2CO3 (1 mg, 7 μmol) in an acetonitrile/water (3:5, 0.8 ml) mixture. Azeotropic evaporation was performed at 110 °C under a stream of nitrogen (7 psi) to remove excess water using acetonitrile. The 4-trimethylammoniumbenzaldehyde trifluoromethansulfonate (5 mg) precursor was solvated in DMSO (0.8 ml), added to the reactor vial containing the dried [18F]fluoride and allowed to react at 90 °C for 5 min with stirring. The resulting 4-[18F]fluorobenzaldehyde mixture was diluted with water containing 1% (w/v) Na-ascorbate solution (5 ml total) and passed through an Oasis WCX cartridge (6 psi) for 1.5 min.. The WCX cartridge was dried with nitrogen (20 psi) for 1 min and eluted with DCM (3 ml). The mixture was passed through a glass column containing NaBH4 · (Al2O3)x (350 mg) on the top half portion and K2CO3 (2 g) on the bottom half portion for a flow through reduction of 4-[18F]fluorobenzaldehyde ([18F]FBA) to 4-[18F]fluorobenzyl alcohol ([18F]FBnOH), which was directed to the second reactor vial (3 psi). A subsequent elution and rinsing of the column was performed using DCM (1 ml, containing 0.2 % (v/v) of water) (3 psi). The mixture containing [18F]FBnOH was reacted with Ph3PBr2 (100 mg) in DCM (1.1 ml) at 35 °C for 10 min resulting in the formation of 4-[18F]fluorobenzyl bromide ([18F]FBnBr). The resulting mixture was passed through a silica cartridge and directed towards the third reactor vial (2 psi). A solution of PPh3 (3 mg) in EtOH (0.6 ml) was added, followed by removal of most of the DCM under vacuum and a stream of nitrogen (3 psi) at 45 °C for 6.5 min while stirring. EtOH (1 ml) was added and the mixture was evaporated to approximately 0.5 ml under vacuum and a stream of nitrogen (7 psi) at 80 °C for 2.5 min while stirring. The mixture was reacted at 160 °C for 5 min in a sealed position, which converted the [18F]FBnBr to the desired [18F]FBnTP. The reaction vial was cooled to 35 °C and diluted with water (3 ml) while stirring. The mixture was passed through a Sep-Pak Plus Accell CM cartridge (8 psi) and the cartridge was washed with EtOH (20 ml). The product was released with 2% EtOH in saline + 0.5% (w/v) Na-ascorbate (10 ml) and passed through a sterile filter into a vented sterile vial. Under optimized conditions, the resulting [18F]FBnTP PET tracer was obtained in AY of 1.4—2.2 GBq starting from 9.4 to 12.0 GBq [18F]fluoride in 90–92 min (RCY = 28.6 ± 5.1% with n = 3). Molar activities ranged from 80 to 99 GBq/μmol (EOS) and radiochemical purity was >99%.
PET/CT imaging studies
All PET/CT imaging was performed on KL mice or syngeneic mice TT implanted with L3161C using either single tracer imaging with 18FBnTP or dual radio-tracer imaging with 18FBnTP and 18F-FDG as previously described26,27. In order to reduce variability between mice imaged with 18FBnTP, maximum percent injected dose per gram (%ID/g) for each tumor was normalized to maximum %ID/g of heart as indicated in the figures. For waterfall plots in Figure 2g, 3b, 3d, 3e and extended data figures 4c–4d, we calculated % change in the uptake of the 18FBnTP probe post-treatment relative to pre-treatment using maximum %ID/g of the tumor that was normalized to maximum %ID/g of the heart for each mouse.
Respirometry Analysis
Experiments were conducted on a Seahorse XF96 Extracellular Flux Analyzer (Agilent Technologies) in order to measure oxygen consumption rate (OCR) and extracellular acidification rate (ECAR). L3161C, A549 or RH2 cells were seeded into an XF96 microplate at density of 12,000–15,000 cells per well. Cells were plated in growth medium and maintained overnight in a tissue culture incubator (37°C; 5% CO2). On the day of the experiment, assay medium (Seahorse XF Base Medium supplemented with 2 mM L-glutamine, 1mM Pyruvate and 10 mM glucose) was freshly prepared. The cells were washed twice with assay medium and brought to a final volume of 175 μL per well. The XF96 plate was placed in a 37°C incubator without CO2 for 30 minutes prior to loading the plate into the instrument. Injection of compounds during the assay included: the mitochondrial ATP Synthase inhibitor oligomycin (final concentration of 2 μM); the chemical uncoupler, FCCP (final concentration of 1 μM); and the Complex I inhibitors rotenone (final concentrations 2 μM) and phenformin (final concentration 1 mM) and Complex III inhibitor antimycin A (final concentrations of 2 μM). At the conclusion of the assay, the cells were fixed with 4% paraformaldehyde, stained with Hoechst, and cell number per well was determine based on nuclei number using an Operetta High-Content Imaging System (PerkinElmer). Oxygen consumption rates were normalized to cell number per well. Activity of complex I was measured in permeabilized cells using XF PMP assay where complex I dependent OCR was measured by determining OCR in the presence of pyruvate and malate (as substrates for complex I) before and after addition of rotenone (complex I inhibitor).
Measurement of mitochondrial membrane potential (ΔΨ)
Experiments were conducted by analyzing TMRE fluorescence using flow cytometry. A549 and L3161C cells were harvested on the day of the assay and 500,000 cells were aliquoted into a microfuge tube. Cells were resuspended in 0.5 ml DMEM with 5% FBS containing different concentrations of phenformin or oligomycin or FCCP as indicated in figure legends. Cells were incubated in a tissue culture incubator (37°C, 5% CO2) for 2 hr. After 2 hr incubation, media with TMRE was added to tubes, such that final concentration of TMRE was 7 nM and concentrations of phenformin, oligomycin and FCCP were constant. Cells were incubated for an additional 1 hr in a tissue culture incubator (37°C, 5% CO2). Cells were washed twice in phenol red free DMEM and cellular fluorescence was acquired with a BD LSRII analyzer at UCLA Flow Cytometry Core. Data was analyzed with Flowing Software.
In vitro 18FBnTP uptake assay
On the day of the assay, cells were trypsinized, collected in DMEM with 5% FBS and counted. 1,000,000 cells were aliquoted into a microfuge tube, resuspended in 0.5 ml media containing DMEM with 5% FBS and either Vehicle, 1 mM phenformin, 8 μM Oligomycin or 8 μM Oligomycin with 4 μM FCCP. Cells were incubated in a tissue culture incubator (37°C, 5% CO2) for 2 hr. After 2 hr incubation, 0.5 ml of media with 18FBnTP was added to tubes, such that final concentration of 18FBnTP was 10 μCi/ml and concentrations of phenformin, oligomycin and FCCP were constant. Cells were incubated for an additional 1 hr in a tissue culture incubator (37°C, 5% CO2). The uptake was terminated by centrifugation at 4°C (1200 rpm, 5 min). Cells were washed twice with cold media. After the final wash, cell pellet was resuspended in 500 μl of media, and 300 μl was used in a gamma counter, while 100 μl was used to count viable cells using ViCell counter (Beckman). Counts per minute were normalized to viable cells.
Immunohistochemistry
After the fixation step in 10% neutral buffered formalin overnight, lungs were transferred to 70% ethanol and further processing and embedding was done by the TPCL at UCLA. The following antibodies were used: anti-CK5 (EP1601Y) (abcam, ab52635 1:100), anti-TTF1 (8G7G3/1) (Dako, 1:1000), anti-Ki67 (SP6) (Thermo-Scientific, RM-9106-S1 1:200), anti-Glut1 (alpha-diagnostic, GT11-A, 1:400), anti-Cleaved Caspase 3 (CST, #9664, 1:1000). Slides were scanned onto a ScanScope AT (Aperio Technlogies Inc.). Digital slides were analyzed with Definiens and QuPath software.
Western blot analysis
Whole cell lysates from lung tumors isolated from mice were prepared as previously described7. Briefly, tumors were homogenized in buffer containing phosphatase and protease inhibitors (20 mM Tris pH 7.5, 150 mM NaCl, 1% Triton X-100, 50 mM sodium fluoride, 1 mM EDTA, 1 mM EGTA, 2.5 mM pyrophosphate, 1 mM sodium orthovanadate, protease inhibitor tablet), centrifuged and supernatant was normalized, aliquoted and stored in −80°C freezer. Lysates were separated on 4–12% Bis-Tris protein gels (Thermo), transferred to PVDF membrane and probed with the following antibodies: SP-C (1:5000, AB3786 Milipore); Glut1 (1:2000, GT11-A, Alpha Diagnostic); Ndufs1 (1:2000, ab169540, abcam); Ndufs1 (1:2000, sc-271510, Santa Cruz); Ndusv1 (1:500, 11283–1-AP, Proteintech), Ndufv2 (1:2000, sc-271620, Santa Cruz), Tom20 (1:10000, FL-145, Santa Cruz), Tom40 (1:2000, 18409–1-AP, Proteintech); Tom70 (1:2000, 14528–1-AP, Proteintech); Tim23 (1:2000, 11123–1-AP, Proteintech); actin (1:8000, #4970 and #3700, Cell Signaling Technology). Intensity of bands was quantified using Image J.
Blue Native Gel
Blue Native (BN)-PAGE was performed based on the method of Schagger and colleagues30 with minor modifications. Briefly, mitochondria (100 μg protein) were solubilized for 15 min with digitonin using a 6g/g digitonin/protein ratio. Insoluble material was removed by centrifugation at 21,000 g for 30 min at 4 °C, the soluble component was combined with BN–PAGE loading dye and separated on a 3–13% acrylamide–bisacrylamide precast BN-PAGE gel. For separation, cathode buffer (15 mM bis-Tris [pH 7.0] and 50 mM tricine) containing 0.02% (w/v) Coomassie Blue G was used until the dye front had reached approximately one-third of the way through the gel before exchange with cathode buffer lacking Coomassie Blue G. Anode buffer contained 50 mM bis-Tris (pH 7.0). Native complexes were separated at 4 °C at 110V for 1 hour, followed by 12mA constant current. Thyroglobulin (669 kDa), ferritin (440 kDa), Catalase (232 kDa), Lactate dehydrogenase (140 kDa), and bovine serum albumin (BSA 67 kDa) were used as markers (GE Healthcare).
Liquid chromatography/Mass spectroscopy
Tumors were homogenized with a Tissue Master (Omni international) in 1 ml chilled 80% Methanol. Tumor suspensions were spun down at 4°C for 5 min at 17,000g, and the top layer taken as extracted metabolites. The volume equivalent of 1 mg of tumor was transferred into glass vials and the samples were dried with a EZ2-Elite lyophilizer (Genevac). Dried metabolites were re-suspended in 100 μl of 50%:50% acetonitrile (ACN):dH20 solution; 10 μl of these suspensions were injected per analysis. Samples were run on a Vanquish (Thermo Scientific) UHPLC system with mobile phase A (5 mM NH4AcO, pH 9.9) and mobile phase B (ACN). Separation was achieved at a 200 μl/min flow rate on a Luna 3mm NH2 100A (150 × 2.0 mm) at 40°C with a gradient going from 15% A to 95% A in 18 min followed by an 11 minute isocratic step. The UHPLC was coupled to a Q-Exactive (Thermo Scientific) mass analyzer running in positive mode at 3.5kV with an MS1 resolution of 70,000. Metabolites were identified using exact mass (MS1), retention time, and fragmentation patterns (MS2) at normalized collision energy (NCE) 35. Quantification was performed via area under the curve (AUC) integration of MS1 ion chromatograms with the MZmine 2 software package. For the quantification of absolute moles of phenformin, one tumor from the vehicle group was selected to provide a representative tumor small molecular matrix. The volume equivalent of 1 mg of this tumor was distributed into several glass vials and 10 μl of pure aqueous phenformin standards (0.1mM − 0.5mM) was added to these samples to span the possible range of phenformin concentrations. From this point on these samples were treated as described above. AUC values from the phenformin standards were used to fit a linear regression model that related MS1 AUC to the moles of phenformin present. The linear regression equation was used to convert MS1 AUC to moles of phenformin in all tumor samples and expressed relative to the tissue mass of each tumor.
Statistical Analysis
The in vivo experiments were analyzed utilizing analysis of variance (ANOVA) models to evaluate the main effects of the two treatment types on the various quantitative outcome measures. Categorical outcomes were compared between groups with Fisher’s exact test. The sample size of 7–10 KL mice per group provided a 99% power to detect differences in the outcomes of % cleaved caspase 3, Ki67 and 18FBnTP %ID/g positivity based on the observed results previously described 7, assuming a two-sample t-test (a simplification of the ANOVA analysis plan) with a two-sided 0.05 significance level.
Mouse experiments involving imaging of KL mice with 18FBnTP were repeated with 3 separate cohorts several months apart. For imaging studies with both GEMMs and syngeneic mice, after basal 18FBnTP imaging, mice were split into two groups (3 cohorts for Fig. 3b) based on maximum %ID/g values, such that maximum %ID/g values of tumors in both groups would be similar after normalization to the maximum probe uptake in the heart. Variation is indicated using standard deviation or standard error of the mean as described in the figure legends. Differences between groups were determined using unpaired two-tailed t-test or one-way ANOVA if more than two groups were compared. Western blot analysis of mitochondrial markers was completed on lung nodules isolated from three separate cohorts of mice.
Extended Data
Extended data Figure 1. Mitochondrial markers in KL mouse lung tumors.
Whole cell lysates from lung tumors isolated from KL mice were immunoblotted with indicated antibodies. Tumors with high levels of surfactant protein C (SP-C:actin ratio > 0.5) were defined as adenocarcinomas (blue box), while tumors with low SP-C (SP-C:actin ratio < 0.5) were defined as squamous cell carcinomas (red box). Each lane represents individual tumor isolated from KL mice. This Western blot was done on 20 individual tumors isolated from KL mice from three independent experiments.
Extended data Figure 2. Measuring mitochondrial membrane potential in vitro in A549 and L3161C cells.
a, Gating strategy used for quantification of TMRE signal. R2 – region representing single cells was used for quantification of the TMRE signal. b, Overlay histogram showing shifts in TMRE staining in L3161C cells strained with Vehicle, 8 μM Oligomycin, and 8 μM Oligomycin + 4 μM FCCP. c, TMRE measurements in A549 cells treated with indicated concentrations of Phenformin or FCCP for 3 hr (n = 3 biological replicates). d, TMRE measurements in mouse cell line L3161C treated with indicated concentrations of Phenformin or FCCP for 3 hr (n = 3 biological replicates). e, Viability of A549 cells treated with indicated concentrations of Phenformin for 3 hr (n = 3 biological replicates). f, Uptake of 18FBnTP probe measured by gamma counter in A549 cells treated with 1 mM Phenformin for 3 hr (n = 5 biological replicates). g, Oxygen consumption rate (OCR) per cell measured in A549 cells treated acutely with 1 mM Phenformin (n = 25 technical replicates). h, OCR per cell measured in mouse cell line L3161C treated acutely with 1 mM Phenformin (n = 25 technical replicates). i, TMRE measurements in mouse cell line L3161C treated with Vehicle, 8 μM Oligomycin, or 8 μM Oligomycin with 4 μM FCCP for 3 hr (n = 3 biological replicates). j, Uptake of 18FBnTP probe measured by gamma counter in mouse cell line L3161C treated with Vehicle, 8 μM Oligomycin, or 8 μM Oligomycin with 4 μM FCCP for 3 hr (n = 6 biological replicates). k, Viability of L3161C cells treated as in j (n = 6 biological replicates). Data are shown as mean +/− SD. Experiments in c-i, were repeated twice with similar results. Experiments in j and k were done once.
Extended Data Figure 3. Short-term treatment with phenformin does not lead to changes in proliferation or apoptosis.
a, Transverse 18FBnTP/CT overlay (left panel) of mouse lung (middle panel) after treatment with phenformin. H&E of a lung lobe with associated adenocarcinoma (ADC) tumor (right panel). b, Representative slides stained with H&E (left panel), Cleaved Caspase 3 (middle panel), and Ki67 (right panel) from tumors from KL mice treated with Vehicle (top panel) or Phenformin (bottom panel). This experiment was done once on slides from n = 5 mouse lungs (Vehicle) and n = 6 mouse lungs (Phenformin). c, Quantification of staining for Ki67 and d, Cleaved Caspase 3 for tumors from KL mice treated with Vehicle (n = 5 mice) or Phenformin (n = 6 mice). This experiment was done once. e, Phenformin in lung tumors isolated form KL mice was quantified using liquid chromatography/mass spectroscopy. Tumors were isolated from mice treated with Vehicle (n = 6) or 100 mg/kg (n = 2) or 200 mg/kg Phenformin (n = 2) for 5 days. This experiment was done once. f, Representative 18FBnTP PET/CT overlay of a tumor formed by transthoracically implanted L3161C cell line. H – heart, T – tumor. This image is representative of at least 20 PET/CT images. g, H&E slide of a tumor formed by transthoracically implanted L3161C cell line imaged in f. h, H&E staining of tumor formed by L3161C mouse cell line. j, Representative slides stained with Ki67 (top panel), and Cleaved Caspase 3 (bottom panel) from tumors formed by transthoracically transplanted L3161C cells that were treated with Vehicle, Metformin, Phenformin. This experiment was done once on slides from n = 8 tumors (Vehicle), n = 5 tumors (Metformin), n = 6 tumors (Phenformin). The data are represented as the mean +/− SD. Statistical significance was calculated using unpaired two-tailed t-test.
Extended Data Figure 4. Expressing ND1 in mouse L3161C lung adenocarcinoma cell line reduces sensitivity of mitochondrial membrane potential to Phenformin in vitro and in vivo.
a, Basal OCR rate per cell for L3161C-pBabe (black) (n = 12 technical replicates) and L3161C-ND1 cells (red) (n = 12 technical replicates) treated with 50 μM Phenformin for 24 hr. b, Basal OCR rate per cell for L3161C-pBabe (black) (n = 12 technical replicates for all conditions, except n = 6 for 250 μM Phen and n = 9 for 500 μM Phen) and L3161C-ND1 cells (red) (n = 12 technical replicates) treated with indicated concentrations of Phenformin for 24 hr. This experiment was repeated once. The data are represented as the mean +/− SD. c, Waterfall plot for % change in maximum uptake of 18FBnTP post-treatment to pre-treatment for mice transthoracically implanted with L3161C cells expressing empty vector (L3161C+pBabe) (n = 5 mice) or expressing ND1 (L3161C+ND1) (n = 5 mice) and treated with 125 mg/kg Phenformin for 5 days. e, Waterfall plot of % change in maximum uptake of 18FBnTP in tumors formed by transthoracically implanted L3161C-pBabe (n = 3 mice) or L3161C-ND1 cells (n = 5 mice) that were treated with Vehicle for 5 days. Experiments in a-d were preformed once. Statistical significance was calculated using unpaired two-tailed t-test.
Extended Data Figure 5. Multi-tracer imaging and IHC markers in lung tumors from KL mice.
a, Representative PET images of KL mice imaged with 18FBnTP and 18F-FDG on sequential days. Top panel shows CT and 18FBnTP image and bottom panel shows CT and 18F-FDG image. H - heart, T - tumor; tumors are indicated by arrows and circled. b, Whole lung slides stained with H&E, Tom20, Glut1, and CK5/TTF1 from Mouse 1, Mouse 2 and Mouse 3. Scale bar = 5 mm. c, Higher magnification of representative images from tumor circled in b form mouse 1, mouse 2, mouse 3 and that were stained with H&E, Tom20, Glut1, CK5 and TTF1. Scale bar = 25 μm. This data is representative of three independent mouse experiments.
Extended Data Figure 6. PET/CT and biochemical analysis of KL tumors.
a, Crystal structure of complex I (PDB: 5lc5) is shown with NDUFS1 and NDUFV1 subunits is red and FeS clusters in yellow. b-c, PET/CT images from three KL mice that were imaged on sequential days with 18FBnTP (top panel) and 18F-FDG (bottom panel). Tumors are circled, H – heart. Maximum uptake value for each tumor after normalization to maximum uptake of the heart is indicated. e, Western blot analysis from lung nodules that were isolated from mice imaged in b-d. Two lung tumors from mouse 5372 (imaged in b) are shown – T1 in blue (low 18F-FDG and Glut1 levels; high 18FBnTP and high Ndufs1 and Ndufv1 levels); and T2 in red (high 18F-FDG and Glut1 levels; low 18FBnTP and low Ndufs1 and Ndufv1 levels). Experiments in b-d are representative of three independent mouse experiments. Experiment in e was done once.
Extended Data Figure 7. Levels of Ndufs1 and Ndufv1 in KL tumors.
Whole cell lysates from lung tumors isolated from KL mice were immunoblotted with indicated antibodies. This Western blot was done on 20 individual tumors isolated from KL mice from three independent experiments.
Extended Data Figure 8. Sensitivity of mouse and human lung cancer cell lines to complex I inhibitors phenformin and IACS-010759.
a, TMRE measurement comparing mouse adenocarcinoma cell line (n = 3 biological replicates) and mouse squamous cell carcinoma (n = 3 biological replicates) cell lines. b, Cell viability of mouse adenocarcinoma cell line (n = 3 biological replicates) and mouse squamous cell carcinoma cell line (n = 3 biological replicates) cells was measured in the presence of indicated concentrations of Phenformin for 48 hr. c, Cell viability of human ADC cell line (A549) (n = 3 biological replicates) and human SCC cell line (RH2) (n = 3 biological replicates) cells was measured in the presence of indicated concentrations of Phenformin for 48 hr. d, Cell viability of human ADC cell line (A549) (n = 3 biological replicates) and human SCC cell line (RH2) (n = 3 biological replicates) cells was measured in the presence of indicated concentrations of IACS-010759 for 48 hr. The data are represented as the mean +/− SD. Statistical significance was calculated using unpaired two-tailed t-test or one-way ANOVA (for b-d). Experiments were repeated twice with similar results.
Extended Data Figure 9. Characteristics of tumors from KL mice treated with Vehicle or IACS-010759.
a, 18FBnTP uptake in tumors in KL mice before the start of the treatment with Vehicle or 15 mg/kg IACS-010759. Each dot represents a tumor; n = 44 (Vehicle), n = 66 (IACS). b and c, Images from H&E stained lung sections from KL mice treated with Vehicle (b) or 15 mg/kg IACS-010759 (c) for 12 days with tumors delineated with red lines. Quantification of this data is shown in Figure 4l. This experiment was done once.
Extended Data Figure 10. Intra-tumoral heterogeneity in KL mice.
Higher magnification of tumor shown in Figure 4n, and Figure 4o with Glut1 staining (left panel) and CK5/TTF1 staining (right panel). Areas corresponding to ADC and SCC are indicated, with rectangular boxes corresponding to zoomed in images shown in Figure 4n. This data is representative of three independent mouse experiments.
Supplementary Material
Acknowledgements
We would like to thank Charles Zamilpa, Dishan Abeydeera, Waldemar Ladno, Olga Sergeeva, Darin Williams, Tove Olafsen, at UCLA’s Crump Imaging Technology Center for assistance with PET/CT imaging of the mice. We thank Marianne Cilluffo, Robert McMickle, Vishaka Muhunthan, Mingqi Han and Essam Assali for laboratory assistance. We thank the Translational Pathology Core Laboratory at UCLA’s DGSOM for assistance with tumor sample preparation and processing. This research was supported by the NIH National Center for Advancing Translational Science (NCATS) UCLA CTSI Grant number UL1TR001881. D.B.S. was supported by the UCLA CTSI KL2 Translational Science Award grant numbers KL2TR001882 at the UCLA David Geffen School of Medicine, the UCLA Jonsson Comprehensive Cancer Center grant P30 CA016042, the Department of Defense LCRP grant number W81XWH-13-1-0459 and the NIH/NCI R01 CA208642-01. S.T.B. was supported by an NIH T32 training grant HL072752. A.J. was supported by a USHHS Ruth L. Kirschstein Institutional National Research Service Award # T32 CA009056. G.A. and A.G. were supported by an NIH/NCI R01 CA208642-01 diversity supplement. J.T.L. was supported by NIH/NCI P30 CA016042. This research was supported by the Joyce and Saul Brandman Fund for Medical Research. We thank the Scott Family and the Carrie Strong Foundation as well as Barry and Donna Goldfarb for their generous support.
Footnotes
Data availability
Source data for Western blots are provided with the paper as Supplementary Figure 1. Source data for Figures 1b–d; Figures 2d–g; Figures 3b, 3d, 3e; ED Figures 3c–e; ED Figures 4c, 4d; ED Figure 9a are provided with the paper.
The data that support the findings of this study are available from the corresponding author upon reasonable request.
Competing financial interests
Steven M. Dubinett is an advisory board member for EarlyDx Inc., T-Cure Bioscience Inc., Cynvenio Biosystems Inc. and the Johnson and Johnson Lung Cancer Initiative. D.B.S., M.M. and S.S. have filed a provisional patent U.S. 62/901,947 and are listed as inventors. The patent proposes the use of 18FBnTP PET to guide use of complex I inhibitors for the treatment of lung cancer.
References
- 1.Mitchell P & Moyle J Evidence discriminating between the chemical and the chemiosmotic mechanisms of electron transport phosphorylation. Nature 208, 1205–1206 (1965). [DOI] [PubMed] [Google Scholar]
- 2.Morais R et al. Tumor-forming ability in athymic nude mice of human cell lines devoid of mitochondrial DNA. Cancer Res 54, 3889–3896 (1994). [PubMed] [Google Scholar]
- 3.Cavalli LR, Varella-Garcia M & Liang BC Diminished tumorigenic phenotype after depletion of mitochondrial DNA. Cell Growth Differ 8, 1189–1198 (1997). [PubMed] [Google Scholar]
- 4.Madar I et al. Characterization of uptake of the new PET imaging compound 18F-fluorobenzyl triphenyl phosphonium in dog myocardium. J Nucl Med 47, 1359–1366 (2006). [PubMed] [Google Scholar]
- 5.Weinberg F et al. Mitochondrial metabolism and ROS generation are essential for Kras-mediated tumorigenicity. Proc Natl Acad Sci U S A 107, 8788–8793, doi:1003428107 [pii] 10.1073/pnas.1003428107 (2010). [DOI] [PMC free article] [PubMed] [Google Scholar]
- 6.Ji H et al. LKB1 modulates lung cancer differentiation and metastasis. Nature 448, 807–810 (2007). [DOI] [PubMed] [Google Scholar]
- 7.Shackelford DB et al. LKB1 inactivation dictates therapeutic response of non-small cell lung cancer to the metabolism drug phenformin. Cancer Cell 23, 143–158, doi: 10.1016/j.ccr.2012.12.008 (2013). [DOI] [PMC free article] [PubMed] [Google Scholar]
- 8.Madar I et al. Characterization of membrane potential-dependent uptake of the novel PET tracer 18F-fluorobenzyl triphenylphosphonium cation. Eur J Nucl Med Mol Imaging 34, 2057–2065, doi: 10.1007/s00259-007-0500-8 (2007). [DOI] [PubMed] [Google Scholar]
- 9.Smith RA, Hartley RC & Murphy MP Mitochondria-targeted small molecule therapeutics and probes. Antioxidants & redox signaling 15, 3021–3038, doi: 10.1089/ars.2011.3969 (2011). [DOI] [PubMed] [Google Scholar]
- 10.Kim DY et al. Evaluation of a mitochondrial voltage sensor, (18F-fluoropentyl)triphenylphosphonium cation, in a rat myocardial infarction model. J Nucl Med 53, 1779–1785, doi: 10.2967/jnumed.111.102657 (2012). [DOI] [PubMed] [Google Scholar]
- 11.Madar I et al. Detection and quantification of the evolution dynamics of apoptosis using the PET voltage sensor 18F-fluorobenzyl triphenyl phosphonium. J Nucl Med 50, 774–780, doi: 10.2967/jnumed.108.061283 (2009). [DOI] [PubMed] [Google Scholar]
- 12.Logan A et al. Assessing the Mitochondrial Membrane Potential in Cells and In Vivo using Targeted Click Chemistry and Mass Spectrometry. Cell Metab 23, 379–385, doi: 10.1016/j.cmet.2015.11.014 (2016). [DOI] [PMC free article] [PubMed] [Google Scholar]
- 13.Waldmann CM et al. An Automated Multidose Synthesis of the Potentiometric PET Probe 4-[(18)F]Fluorobenzyl-Triphenylphosphonium ([(18)F]FBnTP). Mol Imaging Biol, doi: 10.1007/s11307-017-1119-1 (2017). [DOI] [PMC free article] [PubMed] [Google Scholar]
- 14.Dykens JA et al. Biguanide-induced mitochondrial dysfunction yields increased lactate production and cytotoxicity of aerobically-poised HepG2 cells and human hepatocytes in vitro. Toxicol Appl Pharmacol 233, 203–210, doi:S0041–008X(08)00361-X [pii] 10.1016/j.taap.2008.08.013 (2008). [DOI] [PubMed] [Google Scholar]
- 15.Li F et al. LKB1 Inactivation Elicits a Redox Imbalance to Modulate Non-small Cell Lung Cancer Plasticity and Therapeutic Response. Cancer Cell 27, 698–711, doi: 10.1016/j.ccell.2015.04.001 (2015). [DOI] [PMC free article] [PubMed] [Google Scholar]
- 16.Giordano S, Lee J, Darley-Usmar VM & Zhang J Distinct effects of rotenone, 1-methyl-4-phenylpyridinium and 6-hydroxydopamine on cellular bioenergetics and cell death. PLoS One 7, e44610, doi: 10.1371/journal.pone.0044610 (2012). [DOI] [PMC free article] [PubMed] [Google Scholar]
- 17.Singer TP & Ramsay RR The reaction sites of rotenone and ubiquinone with mitochondrial NADH dehydrogenase. Biochim Biophys Acta 1187, 198–202 (1994). [DOI] [PubMed] [Google Scholar]
- 18.Caboni P et al. Rotenone, deguelin, their metabolites, and the rat model of Parkinson’s disease. Chem Res Toxicol 17, 1540–1548, doi: 10.1021/tx049867r (2004). [DOI] [PubMed] [Google Scholar]
- 19.Bridges HR, Jones AJ, Pollak MN & Hirst J Effects of metformin and other biguanides on oxidative phosphorylation in mitochondria. Biochem J 462, 475–487, doi: 10.1042/BJ20140620 (2014). [DOI] [PMC free article] [PubMed] [Google Scholar]
- 20.Owen MR, Doran E & Halestrap AP Evidence that metformin exerts its anti-diabetic effects through inhibition of complex 1 of the mitochondrial respiratory chain. Biochem J 348 Pt 3, 607–614 (2000). [PMC free article] [PubMed] [Google Scholar]
- 21.Wheaton WW et al. Metformin inhibits mitochondrial complex I of cancer cells to reduce tumorigenesis. Elife 3, e02242, doi: 10.7554/eLife.02242 (2014). [DOI] [PMC free article] [PubMed] [Google Scholar]
- 22.Sanchez-Rangel E & Inzucchi SE Metformin: clinical use in type 2 diabetes. Diabetologia 60, 1586–1593, doi: 10.1007/s00125-017-4336-x (2017). [DOI] [PubMed] [Google Scholar]
- 23.Birsoy K et al. Metabolic determinants of cancer cell sensitivity to glucose limitation and biguanides. Nature 508, 108–112, doi: 10.1038/nature13110 (2014). [DOI] [PMC free article] [PubMed] [Google Scholar]
- 24.Hensley CT et al. Metabolic Heterogeneity in Human Lung Tumors. Cell 164, 681–694, doi: 10.1016/j.cell.2015.12.034 (2016). [DOI] [PMC free article] [PubMed] [Google Scholar]
- 25.de Bruin EC et al. Spatial and temporal diversity in genomic instability processes defines lung cancer evolution. Science 346, 251–256, doi: 10.1126/science.1253462 (2014). [DOI] [PMC free article] [PubMed] [Google Scholar]
- 26.Momcilovic M et al. The GSK3 Signaling Axis Regulates Adaptive Glutamine Metabolism in Lung Squamous Cell Carcinoma. Cancer Cell 33, 905–921 e905, doi: 10.1016/j.ccell.2018.04.002 (2018). [DOI] [PMC free article] [PubMed] [Google Scholar]
- 27.Momcilovic M et al. Heightening Energetic Stress Selectively Targets LKB1-Deficient Non-Small Cell Lung Cancers. Cancer Res 75, 4910–4922, doi: 10.1158/0008-5472.CAN-15-0797 (2015). [DOI] [PMC free article] [PubMed] [Google Scholar]
- 28.Su CY, Chang YC, Yang CJ, Huang MS & Hsiao M The opposite prognostic effect of NDUFS1 and NDUFS8 in lung cancer reflects the oncojanus role of mitochondrial complex I. Sci Rep 6, 31357, doi: 10.1038/srep31357 (2016). [DOI] [PMC free article] [PubMed] [Google Scholar]
- 29.Molina JR et al. An inhibitor of oxidative phosphorylation exploits cancer vulnerability. Nat Med 24, 1036–1046, doi: 10.1038/s41591-018-0052-4 (2018). [DOI] [PubMed] [Google Scholar]
- 30.Wittig I, Braun HP & Schagger H Blue native PAGE. Nat Protoc 1, 418–428, doi: 10.1038/nprot.2006.62 (2006). [DOI] [PubMed] [Google Scholar]
Associated Data
This section collects any data citations, data availability statements, or supplementary materials included in this article.


