

ABSTRACT
Satellite cells (SC) are muscle stem cells that can regenerate adult muscles upon injury. Most SC originate from PAX7+ myogenic precursors set aside during development. Although myogenesis has been studied in mouse and chicken embryos, little is known about human muscle development. Here, we report the generation of human induced pluripotent stem cell (iPSC) reporter lines in which fluorescent proteins have been introduced into the PAX7 and MYOG loci. We use single cell RNA sequencing to analyze the developmental trajectory of the iPSC-derived PAX7+ myogenic precursors. We show that the PAX7+ cells generated in culture can produce myofibers and self-renew in vitro and in vivo. Together, we demonstrate that cells exhibiting characteristics of human fetal satellite cells can be produced in vitro from iPSC, opening interesting avenues for muscular dystrophy cell therapy. This work provides significant insights into the development of the human myogenic lineage.
KEY WORDS: PAX7, Skeletal muscle, Human development, Pluripotent stem cell, Satellite cell
Highlighted Article: Characterization of human skeletal muscle development in vitro using scRNA-seq of a FACS-sorted PAX7-YFP iPSC reporter line shows the developmental stages of the PAX7+ precursors and their myogenic potential.
INTRODUCTION
Adult skeletal muscles are endowed with significant regenerative capacity upon injury. This is made possible thanks to a small subpopulation of quiescent adult stem cells called satellite cells (SC) (Brack and Rando, 2012; Dumont et al., 2015). Most SC express the transcription factor paired box 7 (Pax7) and lie under the basal lamina of muscle fibers. Upon muscle damage, the SC become activated, proliferate and generate new fibers to reconstitute a healthy muscle. SC are also able to self-renew to recreate a quiescent muscle stem cell compartment. The mouse Pax7+ population is heterogeneous, with different populations of cells exhibiting different regenerative capacities (Cornelison, 2018; Tierney and Sacco, 2016). Whether this heterogeneity reflects distinct subpopulations or different maturation stages of the same lineage is presently unknown.
SC derive from the paraxial mesoderm, the embryonic tissue that forms the vertebral column and skeletal muscles (Chal and Pourquié, 2017; Gros et al., 2005; Hutcheson et al., 2009; Kassar-Duchossoy et al., 2005; Lepper and Fan, 2010; Relaix et al., 2005; Schienda et al., 2006). Pax3+ myogenic precursors arise from the dorsal epithelial compartment of the somite called the dermomyotome. Pax3+ cells of the dermomyotome lips activate Myf5, then downregulate Pax3 and delaminate and differentiate into elongated post-mitotic myocytes expressing myogenin (Myog) to form the first embryonic muscles called myotomes (Chal and Pourquié, 2017). At the same time, Pax3+ myogenic precursors delaminate from the lateral edge of the dermomyotome and migrate to the lateral plate to form the rudiments of the limbs, girdles, tongue and diaphragm muscles. This early phase of myogenesis, called embryonic or primary myogenesis, generates a first set of muscle fibers that serves as a scaffold for the secondary or fetal myogenesis (Biressi et al., 2007a; Chal and Pourquié, 2017). This next phase is initiated in the mouse embryo by a population of Pax7-expressing myogenic precursors originating from the dermomyotomal Pax3+ precursors (Hutcheson et al., 2009). These highly proliferative Pax7+ myogenic precursors are first found intermingled with primary muscle fibers (Gros et al., 2005; Hutcheson et al., 2009). Some of the Pax7+ cells activate Myf5 to become proliferative myoblasts, which eventually express Myog and exit the cell cycle to form myocytes, which fuse to form the fetal muscle fibers (Chal and Pourquié, 2017; Kassar-Duchossoy et al., 2005; Relaix et al., 2005). The Pax7+ cells become enclosed in the basal lamina of myofibers around embryonic day (E)16.5 to E18 in mouse (Ontell and Kozeka, 1984; Relaix et al., 2005). They then continue to proliferate, and many of the Pax7+ cells fuse with the developing fibers, increasing their number of nuclei (White et al., 2010). The myonuclear accretion of SC considerably slows down after birth and the SC that are left remain associated with the myofibers, which continue to grow by hypertrophy. Lineage tracing experiments show that incorporation of Pax7+ cells into mature muscle fibers proceeds throughout adult life, even in the absence of regeneration (Keefe et al., 2015; Pawlikowski et al., 2015).
We and others have established differentiation protocols recapitulating myogenesis in vitro from mouse pluripotent stem cells (PSC) such as embryonic stem cells (ESC) or reprogrammed stem cells (induced pluripotent stem cells, iPSC) (Chal et al., 2018; Magli and Perlingeiro, 2017). In mouse, epiblast-like cells can be efficiently induced to a presomitic mesoderm fate characterized by Msgn1 and Pax3 expression by Wnt activation, in combination with BMP inhibition (Chal et al., 2015; Diaz-Cuadros et al., 2020). When exposed to myogenic growth factors, these cells downregulate Pax3 and activate Pax7 as observed in mouse myogenic precursors in vivo (Chal et al., 2018, 2015; Hutcheson et al., 2009; Relaix et al., 2005). Long striated and multinucleated myofibers exhibiting characteristics of perinatal myofibers form after 3-4 weeks in vitro (Chal et al., 2015). Such cultures recapitulate mouse embryonic and fetal skeletal myogenesis in vitro (Chal et al., 2015). These cultures also generate Pax7+ myogenic precursors/fetal SC (Chal et al., 2018, 2015). In cultures of a mouse Pax7GFP ESC reporter line, GFP expression appears around day 9 and peaks around 20% at 2-3 weeks (Chal et al., 2018, 2015). After 3 weeks in vitro, fast myosin heavy chain (MyHC)-positive (MyHC+) fibers are interspersed with a population of small cells expressing Pax7. These cells are sometimes found enclosed in the basal lamina, resembling SC positioning in vivo (Chal et al., 2015; Relaix et al., 2005; Sambasivan and Tajbakhsh, 2007). These dynamics of Pax7+ cell production in vitro is strikingly similar to that reported in the developing mouse (Hutcheson et al., 2009; Relaix et al., 2005; Sambasivan and Tajbakhsh, 2007). The Pax7+ cells produced in vitro can engraft in adult mouse muscles in vivo and contribute Pax7+ satellite-like cells located under the basal lamina of myofibers (Chal et al., 2018, 2015). Thus, the mouse myogenic cultures spontaneously recreate a niche, allowing the differentiation of Pax7+ cells exhibiting a similar regenerative potential to endogenous SC.
SC showing similar features to those of mice have been identified in humans (Barruet et al., 2020; Charville et al., 2015; Xu et al., 2015). However, their origin and embryonic development is largely unknown. Owing to the difficulty in accessing human embryonic tissue, very few studies have analyzed human myogenesis at the molecular and cellular level (Belle et al., 2017; Hicks et al., 2018; Xi et al., 2017). Early electron microscopy studies of the developing gastrocnemius of human embryos have shown that a transition resembling the switch from embryonic to fetal muscles of rodents begins around gestational week 10 (Ishikawa, 1966). Recently, studies in cleared human embryos ranging from 8 to 14 weeks of gestation demonstrated abundant expression of PAX7, MYOG and MyHC in developing muscles (Belle et al., 2017). MyHC was detected at week 8 in muscles that were colonized with motoneuron axons (Belle et al., 2017). Thus, although the data suggests that aspects of the prenatal stages of muscle development in humans resemble those of mice, our understanding of human myogenesis remains extremely limited.
Transposition of the protocols developed for mouse to human ESC/iPSC has demonstrated that long striated myofibers and PAX7+ cells can also be produced in vitro from PSC (Chal et al., 2015; Hicks et al., 2018). Such cultures offer an excellent proxy to study the development of the human myogenic lineage. Here, we report a detailed characterization of the development of human skeletal muscle in vitro using two human iPSC reporter lines (PAX7Venus and MYOGVenus), which identify subpopulations of the differentiating myogenic lineage. Using single cell RNA sequencing (scRNA-seq) of fluorescence-activated cell sorting (FACS)-sorted PAX7Venus+ populations, we characterize the developmental stages of the PAX7+ precursors produced in vitro. We also demonstrate the myogenic potential of the human PAX7+ cells in vivo and in vitro. Our analysis demonstrates that these cells exhibit characteristics of the fetal SC lineage, which could be used for the development of cell therapy approaches for muscle degenerative diseases such as Duchenne Muscular Dystrophy.
RESULTS AND DISCUSSION
To study the differentiation of human iPSC towards the SC lineage, we targeted a Venus (a YFP derivative; Nagai et al., 2002) reporter cassette into exon 1 of the human PAX7 gene in the human NCRM1 iPSC line. The fluorescent protein was introduced by homologous recombination using CRISPR-Cas9 to produce a knock-in allele expressing a 2A peptide fused to a nuclear NLS-Venus fluorescent protein in frame with exon 1. This allows for a fusion transcript but distinct protein products (Fig. S1A). We next differentiated the targeted cells according to an established myogenic differentiation protocol (Chal et al., 2016) (Fig. 1A). The Venus nuclear signal first appeared after 2 weeks of differentiation in a subpopulation of mononuclear cells (Fig. 1B). After 21 days of primary differentiation and after replating and secondary differentiation in vitro, the reporter cells generated long striated myofibers (>1 mm) intermingled with PAX7Venus+ mononucleated cells (Fig. 1A,C,D). Using anti-GFP and anti-PAX7 antibodies, we showed that Venus expression largely overlaps with that of PAX7 (Fig. 1E-G). From 20 to 30 days, Venus+ cells constitute ∼20-25% of the mononucleated cell population in the culture, as shown by FACS analysis (Fig. 1B,H). Moreover, when the Venus+ fraction was FACS-sorted from 21-day cultures, the PAX7 transcript was exclusively detected in the Venus+ fraction, validating the reporter specificity (Fig. 1I). The percentage of Venus+ cells decreased after 3 weeks, consistent with the dynamics of PAX7+ cells in vivo (Fig. 1B). When 3-4 week cultures were dissociated and replated in proliferation medium (SkGM) for 1-2 days before transferring into differentiation medium for a week (secondary differentiation, Fig. 1A), 20-25% of the mononucleated cell fraction was Venus+ (Fig. 1B). These results contrast with the recently reported differentiation of a human PAX7/MYF5 ESC reporter line in a different medium in which the peak of PAX7 expression was observed at day 4 in vitro (Wu et al., 2018). Our detailed scRNA-seq analysis of early myogenic cultures shows that at day 4, cells of the myogenic lineage are still at the presomitic mesoderm stage, significantly earlier than the first activation of Pax7 in mouse myogenic precursors (Chal et al., 2018; Diaz-Cuadros et al., 2020; Hutcheson et al., 2009). This suggests that the PAX7+ cells differentiating early in this study (Wu et al., 2018) more likely correspond to neural crest cells rather than to myogenic precursors.
Fig. 1.

Generation of human reporter iPSC lines. (A) Schematics of the differentiation protocol highlighting key factors and time scale of primary and secondary (following dissociation and replating) differentiation of myogenic progenitors from iPSC, as previously described (Chal et al., 2016). C, CHIR99021; d, day in culture; F, FGF-2; H, HGF; I, IGF; K, KSR; L, LDN193189. (B) FACS analysis showing the percentage of PAX7Venus+ and MYOGVenus+ cells in the mononucleated fraction during primary differentiation and after 7 days of secondary differentiation (SD7). (C-G) PAX7Venus reporter cells at SD7 stained with antibodies against GFP and α-actinin (C,D) or with anti-GFP and anti-PAX7 antibodies (E-G). (H) Flow cytometry analysis of PAX7Venus cultures. PAX7Venus reporter cells were differentiated as described above for primary differentiation. Cultures were dissociated after 3 weeks and FACS sorted. (I) RT-qPCR analysis for Venus and PAX7 in undifferentiated human iPSC (PSC) and PAX7Venus+ FACS-sorted cells from 3-week-old primary cultures. (J-N) MYOGVenus reporter cultures at SD7 stained with antibodies against GFP and α-actinin (J,K) or with anti-GFP and anti-MYOG antibodies (L-N). Nuclei were counterstained with DAPI. (O) Flow cytometry analysis of MYOGVenus cultures. MYOGVenus reporter cells were differentiated for 2 weeks in primary differentiation, dissociated and FACS sorted. (P) RT-qPCR analysis for Venus and MYOG in undifferentiated human iPSC and FACS-sorted MYOGVenus+ cells isolated from 3-week-old primary cultures. (Q) Schematic recapitulating the differentiation timeline of human iPSC differentiating to skeletal muscle in vitro. Green bars represent expression windows of the fluorescent reporter lines. NMP, neuro-mesodermal precursors; PSM, presomitic mesoderm. Scale bars: 100 µm.
We next compared the transcriptome of the PAX7Venus+ cells generated after 3 weeks (day 21) of myogenic differentiation in vitro with that of undifferentiated reporter iPSC. PAX7Venus+ cells upregulated several known markers of quiescent SCs, such as the vascular cell adhesion molecule 1 (VCAM1), M-cadherin (CDH15), MYF5, NFIA, PAX7 and NOTCH3 (Charville et al., 2015; Fukada et al., 2007; Liu et al., 2013; Pietrosemoli et al., 2017) (Table S1). Some genes coding for sarcomeric proteins, such as myosin light chain 1 (MYL1), which are normally associated with later stages of myogenic differentiation, were also upregulated, suggesting that more differentiated cells could be included in the PAX7Venus+ population due to the stability of the Venus protein. We also compared the transcriptome of human PAX7Venus+ myogenic progenitors from 3-week-old cultures with mouse Pax7GFP+ cells from FACS-sorted age-matched in vitro cultures (Chal et al., 2015). As observed for human cells, mouse Pax7+ cells upregulated well-known satellite cell markers, including Myf5, Cdh15, Nfia, Itga7 and Cd56 (Ncam1) (Tables S1 and S2). Thus, this analysis shows that the human PAX7Venus+ cells differentiated in vitro share a common transcriptional signature with the mouse ESC-derived Pax7GFP+ myogenic precursor cells. Together, our data indicate that expression of the PAX7Venus reporter allows tracking of the endogenous expression of PAX7 protein in human myogenic precursors/fetal SC differentiating in vitro.
To analyze the commitment of differentiating human iPSC toward the skeletal muscle fate in vitro, we also generated a MYOG-Venus reporter line by targeting a 2A peptide-NLS-Venus-reporter cassette into the stop codon located in exon 3 of MYOG (Fig. S1B). When these reporter cells were differentiated in myogenic conditions (Chal et al., 2016), we detected Venus+ myocytes as early as 10 days in culture (Fig. 1B), i.e. before PAX7 but after PAX3 expression (Chal et al., 2016). These cells likely correspond to myogenic cells generated during the equivalent of the primary or embryonic phase from PAX3+ precursors (Chal et al., 2016; Hutcheson et al., 2009). The MYOGVenus+ cells progressively fused to produce long myotubes expressing sarcomeric proteins such as α-actinin (ACTA2) (Fig. 1J,K). Venus protein expression overlapped extensively with the MYOG protein (Fig. 1L-N). After 3 weeks of differentiation in vitro, Venus+ cells peaked to 12-15% of the mononucleated cell fraction (Fig. 1B,O). The MYOG transcript was only detected in the Venus+ population in FACS-sorted cells, thus supporting the specificity of the reporter (Fig. 1P). Thus at 3-4 weeks of differentiation, the proportion of myogenic cells (PAX7+ and MYOG+) in the mononucleated fraction of the culture is ∼30%. The remaining fraction appears to be mostly composed of fibroblastic populations.
We next compared the transcriptome of the MYOGVenus+ cells with that of undifferentiated reporter iPSC. In contrast to the PAX7Venus+ cells, the FACS-sorted MYOGVenus+ progenitors from 27-day cultures showed a clear myogenic identity. They expressed muscle-specific transcription factors such as MYOG, MYOD1 and MEF2C, as well as sarcomeric proteins, including the myosin light (MYL) and heavy (MYH) chain isoforms MYL1, MYL4, MYH3 (embryonic), MYH8 (perinatal), troponin C type 2 (TNNC2) and titin (TTN), and many muscle-specific proteins such as muscle creatine kinase (CKM) (Table S3). Thus, the MYOGVenus reporter line allows tracking of the differentiation of human myocytes in vitro.
We next performed a Gene Ontology (GO) analysis of the genes differentially expressed between the PAX7Venus+ and the MYOGVenus+ cells. This identified distinct over-represented pathways between the two populations. The MYOGVenus+ cells showed enrichment in GO categories such as muscle protein, muscle filament sliding, Z disc or muscle organ development, whereas extracellular matrix (ECM) organization was in the top GO categories for the PAX7Venus+ cells (Tables S1 and S3). Several genes coding for ECM proteins such as lumican (LUM), decorin (DCN), and COL3A1 were among the most strongly upregulated genes in PAX7Venus+ compared with undifferentiated iPSC (Tables S1 and S3). Tenascin-C (TNC), previously described as one of the most highly upregulated genes in mouse fetal SC when compared with adult SC (Tierney et al., 2016), was also highly upregulated in PAX7Venus+ cells. Together, these data show that the MYOGVenus+ cells represent a more differentiated population of myogenic cells compared with the PAX7Venus+ cells.
To analyze the heterogeneity of the differentiating human PAX7 cell population in vitro, we performed scRNA-seq of the PAX7Venus+ cell population from 30-day-old myogenic cultures. We analyzed 1427 FACS-sorted PAX7Venus+ cells from two different myogenic cultures using the inDrops platform (Klein et al., 2015). Both myogenic cultures revealed similar patterns of heterogeneity and clustering (Fig. S2A). The Louvain-based unsupervised clustering analysis identified four different clusters (Fig. 2A, Table S4). The clusters are organized as a continuum, arguing for limited heterogeneity among the different populations composing the PAX7Venus+ fraction.
Fig. 2.

Single cell analysis of PAX7Venus+ cells. (A) ForceAtlas2 force-directed layout (k=10, 30 PC dimensions, 1427 cells) of single cell transcriptomes from 30-day-old FACS-sorted PAX7Venus+ cells from primary cultures. Colors indicate Louvain cluster IDs. (B) Genes indicative of cluster 2 (PAX7, MYF5), cluster 1 (MKI67), cluster 3 (MYOG, MYMX) and cluster 4 (MYH3), as well as markers of human myogenic precursors (MYOD1, CD82, NGFR, ERBB3) shown in ForceAtlas2 layouts colored by log-normalized transcript counts. (C) Pseudo-temporal ordering of PAX7Venus+ cells along a path towards a differentiated state. Top bar, colors indicate Louvain IDs. Bottom, heatmap of selected markers showing gene changes along PAGA path (root=cluster 1). (D) Coarse-grained layout of PAX7Venus+ cells using Partition-based graph abstraction (PAGA).
Two of the clusters are characterized by expression of PAX7 transcripts and lack of MYOG expression (Fig. 2B). A first cluster (cluster 1) representing 18% of the PAX7Venus+ cells formed a distinct cluster of cycling cells that expressed genes involved in cell division such as MKI67 or PCNA (green; Fig. 2A,B, Fig. S3). A second cluster (cluster 2) contains the largest number of PAX7+ cells (60%) (blue; Fig. 2A,B, Fig. S2). We could not identify markers strictly specific for this cluster. The most specific markers such as MYF5 or CXCR4 were also shared with the cluster of cycling cells (Fig. 2B, Fig. S3). Gene signatures specific for mouse and human SC, including VCAM1, MYF5, NFIA, ITGA7 and CAV1 were enriched in these two clusters (Barruet et al., 2020; Charville et al., 2015; Fukada et al., 2007; Liu et al., 2013) (Fig. 2B, Fig. S3). These cells were also enriched in genes coding for ECM proteins such as COL6A1, COL3A1, TNC, DCN and GPC3, and for effectors of cell signaling (Figs S2B and S3). Members of the TGFβ pathway (such as TGFBI and TGFBR1/2), which is involved in the control of myogenesis, were upregulated in these two clusters (Biressi et al., 2007b; Hicks et al., 2018) (Fig. S3) along with targets of the FGF (SPRY1) and YAP pathway (CYR61; also known as CCN1) (Fig. S3) (Chakkalakal et al., 2012; Esteves de Lima et al., 2016; Flanagan-Steet et al., 2000).
A third cluster (cluster 3) includes cells expressing both PAX7 and MYOG (13% of total cells; orange; Fig. 2A,C). Genes enriched in this cluster include several genes associated with muscle differentiation and fusion, such as the SC marker SOX8 (Schmidt et al., 2003), the transcription factor HES6 (Gao et al., 2001), creatine kinase B (CKB) (Simionescu-Bankston et al., 2015), CDH15 (Marti et al., 2013) and the small fusogenic peptide myomixer (MYMX), which in mouse peaks in skeletal muscles at E14.5 (Bi et al., 2017) (Figs S2 and S3). This cluster was located between the PAX7+MYOG− clusters and a fourth cluster (cluster 4) characterized by lack of PAX7 and expression of MYOG (8% total cells; red; Fig. 2A,C), suggesting that cluster 3 represents a transition state between PAX7+MYOG− and PAX7−MYOG+ cells. We also detected expression of the markers of human myogenic progenitors/fetal SC NGFR, ERBB3 and CD82 in virtually all PAX7+ cells (Alexander et al., 2016; Hicks et al., 2018) (Fig. 2B).
Cells of cluster 4 lack PAX7 and express myocyte markers such as MYOG or MEF2C as well as sarcomeric proteins usually expressed by post-mitotic myogenic cells such as ACTA1, TTN, TNNC2, MYL1 or MYH8, indicating the differentiated status of these cells (Fig. 2B, Fig. S3). The temporal stability of the Venus protein likely explains why cells that have downregulated PAX7 mRNA to start their myogenic differentiation are captured as part of the PAX7Venus+ population (Relaix et al., 2005). Cells of the two MYOG+ clusters organized along a gradient of differentiation, with cells progressing from expressing the determination and signaling genes associated with muscle maturation and fusion described above to structural genes found in post-mitotic myocytes such as MYH3 (embryonic MHC) and MYH8 (fetal MHC) (Fig. 2B, Fig. S3).
This analysis suggests that the PAX7+MYOG− cells gives rise to a population of PAX7+MYOG+ cells, which differentiate into PAX7−MYOG+ fetal myocytes. This developmental trajectory is supported by PAGA graph analysis (Wolf et al., 2019) (Fig. 2C,D). Interestingly, both PAX7+MYOG− clusters are directly linked by an edge to the PAX7+MYOG+ cluster, suggesting that they could both directly contribute to this fate. This trajectory is reminiscent of the differentiation sequence reported for chicken and mouse myogenesis (Esteves de Lima et al., 2014; Kassar-Duchossoy et al., 2005; Manceau et al., 2008; Murphy and Kardon, 2011; Relaix et al., 2005; Zalc et al., 2014).
We next used scRNA-seq data to analyze the cell cycle status of the PAX7Venus+ cells (Kowalczyk et al., 2015). Based on this analysis, ∼68% of the cells were in G0/G1 state and the remaining cells were in G2/M and S phase (Fig. 3A,B). We confirmed this data with an analysis of DNA content of FACS-sorted PAX7Venus+ cells by flow cytometry. This identified around 70% cells in the G0/G1 state (Fig. 3C,D). Approximately 6% of cells were in S phase and 14% had increased their DNA content, suggesting they were in G2/M phase. To further characterize the proliferating cells in the PAX7Venus+ fraction, we labeled 21-day primary PAX7Venus reporter cell cultures with EdU for 40 h and FACS-sorted the cells based on Venus expression. Immunohistochemistry with an anti-PAX7 antibody showed that ∼98% of the sorted cells expressed the PAX7 protein (Fig. 3F). Among the fraction of cells expressing the PAX7 protein, ∼80% of the cells also expressed EdU indicating that they are actively proliferating (Fig. 3F). We next performed cell cycle scoring and regressing out of the genes pertaining to S and G2/M phase from the cluster of PAX7+ MYOG− cyclic cells. This resulted in cells of cluster 1 becoming mostly incorporated into cluster 2 (Fig. 3G,H). Thus, the two PAX7+MYOG− cell clusters represent cells of similar identity but in different phases of the cell cycle. Our data is consistent with most PAX7+MYOG− cells representing a single population of slow cycling cells with a long G1 phase.
Fig. 3.

Cell cycle analysis of PAX7Venus+ cells. (A,B) Cell cycle analysis of the PAX7Venus+ fraction by scRNA-seq. PCA plot showing distribution of cell cycle states in PAX7Venus+ cells identified based on scRNA-seq (A). Quantification of cells in different cell cycle states (1427 cells, mean±s.d., n=2) (B). (C,D) Cell cycle analysis of the PAX7Venus+ fraction by DNA content analysis using propidium iodide. (C) Representative frequency histogram showing distribution of cells with different DNA content. (D) Quantification of PAX7Venus+ cells in different cell cycle phases using DNA propidium iodide staining. (E) Force Atlas2 layouts colored by log-normalized transcript counts of CDKN1C. (F) Percent of PAX7Venus+ cells expressing the PAX7 protein (left). Quantification of PAX7 protein expressing cells labeled by EdU after 40 h (right) (mean±s.d., n=3). (G) ForceAtlas2 layout and Louvain clustering after performing the regression of cell cycle genes. Colors indicate Louvain cluster IDs. (H) After cell cycle regression cycling cells collapse with cluster 1 (MYF5). Cell cycle indicator MKI67 and other genes shown in ForceAtlas2 layouts colored by log-normalized transcript counts.
One-fifth of the PAX7+ cells did not incorporate EdU, suggesting that they are either quiescent or post-mitotic. These cells likely include cluster 3 cells which express MYOG (a gene expressed mostly in post-mitotic cells) and account for ∼13% of the PAX7Venus+ cells. Cluster 3 (and cluster 4) cells also upregulate CDKN1C (p57kip2), which controls exit from the cell cycle in myogenic cells in parallel with MYOG (Zhang et al., 1999) (Fig. 3E). This supports the conclusion that clusters 3 and 4 (representing 21% of the PAX7Venus+ total population) are composed of post-mitotic cells committed to myogenic differentiation. Cell cycle analysis of mouse myogenesis has shown that myogenic precursors exit the cell cycle in the G1 phase (Esteves de Lima et al., 2014). This therefore supports the idea that PAX7+ precursors activate MYOG and exit G1 phase to become post-mitotic and downregulate PAX7.
Notch signaling plays an important role in maintaining the pool of Pax7 cells in mouse, controlling the balance between progenitors and their post-mitotic descendants and maintaining the quiescence of adult SC (Bröhl et al., 2012; Low et al., 2018; Mourikis and Tajbakhsh, 2014). During fetal myogenesis, Notch signaling is activated in Pax7 precursors by ligands such as Dll1 presented by post-mitotic cells (Schuster-Gossler et al., 2007). This leads to expression of the transcription factors Hes1 and Hey1, which are important to prevent exit from the cell cycle of the Pax7 cells and thus maintain the progenitor pool (Zalc et al., 2014). We observed a very similar situation in differentiating human iPSC, with strong expression of the Notch receptors NOTCH2 and NOTCH3 (and to a lesser extent NOTCH1) and their targets HEY1 and HES1 (Bröhl et al., 2012; Mourikis and Tajbakhsh, 2014) in the PAX7+/MYOG− clusters. The ligand DLL1 is expressed by the differentiated MYOG+ cells (Fig. 4A). This suggests that, as observed during development, Notch is activated in immature myogenic precursors in response to ligands presented by differentiating myocytes. Moreover, Notch signaling has been shown to repress CDKN1C in muscle progenitor cells in mouse (Zalc et al., 2014), which is in line with our observation that its mRNA expression is lower in the PAX7+MYOG− clusters 1 and 2 (Fig. 3E). To directly test the effect of Notch signaling on the differentiation of human PAX7 precursors in vitro, we treated replated cultures of the PAX7 reporter line in differentiation medium with the drug DAPT, which inhibits Notch cleavage. When compared with control, we could not detect any PAX7Venus+ cells in the treated cultures (Fig. 4B-G). These cultures presented large α-actinin-positive myofibers. Together, these data argue that Notch signaling is required for the maintenance of the pool of PAX7 progenitors. Thus, our data showing that Notch signaling inhibition is incompatible with the maintenance of the SC pool in vitro, raises concerns about the use of DAPT when differentiating myogenic cells from ESC/iPSC in culture (Choi et al., 2016; Selvaraj et al., 2019).
Fig. 4.

Notch signaling is required for the maintenance of the PAX7Venus+ cells in vitro. (A) Distribution and expression of the Notch receptors (NOTCH1, NOTCH2 and NOTCH3), the ligand DLL1, and the targets (HEY1 and HES1) in the PAX7+/MYOG− clusters. (B-G) Effect of Notch signaling on the differentiation of human PAX7 precursors in vitro. PAX7Venus+ cells were FACS-sorted after 3 weeks of primary differentiation, replated as described and differentiated for 1 week in KC differentiation medium in the absence or presence of the γ-secretase inhibitor DAPT (25 µM) that blocks Notch signaling. Cells were fixed and stained with α-actinin and GFP antibodies. Scale bars: 1000 µm in B-E; 100 µm in F,G.
To determine their myogenic potential, we FACS-sorted 3-week-old human PAX7Venus+ cells generated in vitro followed by replating in SkGM medium for 1-2 days to allow cells to reach 80-90% confluency (Figs 1A and 5A). Cells were then transferred to differentiation medium, in which they soon acquired an elongated shape indicating their differentiation into myoblasts. Cell fusion was observed after 2 days, resulting in the formation of millimeter-long myofibers after 7 days. These fibers expressed fast MyHC, displayed typical striations (Fig. 5B,C) and showed spontaneous twitching, indicating a mature contractile apparatus (Movie 1). These striated myofibers were interspersed with mononucleated cells expressing PAX7-Venus (Fig. 5C), suggesting that the PAX7Venus+ cells are able to differentiate into myofibers and to self-renew in vitro. Similar observations were made with mouse Pax7GFP+ FACS-sorted progenitors from 3-week old cultures, which were also able to differentiate into striated multi-nucleated fibers when cultured in the same conditions (Fig. 5D-F). Serial sorting and differentiation of human PAX7Venus+ cells showed that this population can be maintained over repeated sorting and replating rounds, further supporting the existence of a self-renewing population in the PAX7Venus+ cells (Fig. 5G).
Fig. 5.

Myogenic potential of iPSC-derived PAX7-Venus. (A-F) Myogenic potential of purified human (A-C) PAX7Venus+ and mouse (D-F) Pax7GFP+ cells in vitro. Human iPSC and mouse ESC were differentiated for 3 weeks as previously described (Chal et al., 2016) and fluorescent cells were FACS-isolated and replated in SkGM medium for 1-2 days (A,D) to allow 80-90% confluency. Cells were then induced for differentiation and immunostained for GFP and FAST MyHC (B,C,E,F). Nuclei were counterstained with DAPI. (G) Serial sorting and differentiation of human PAX7Venus+ cells. PAX7Venus+ cells were differentiated as described for primary differentiation, dissociated at 3 weeks and FACS sorted (first round). FACS-sorted cells were then replated in SkGM medium for 1-2 days to allow 80-90% confluency and then differentiated for 1 week in a differentiation medium containing 1 µm CHIR99021 and 2% KSR. Cultures were then dissociated and FACS-sorted for Venus expression (second round). Replating and sorting experiments were repeated as indicated. The percentage of PAX7Venus+ cells is shown at each round (n=3). (H-O) Transplantation of human PAX7Venus+ cells in immune-deficient mice: 105 FACS-sorted PAX7Venus+ cells were injected into the TA of cardiotoxin-injured Rag2B6 WT (H) or NOD-Rag1−/− Dmdmdx-5cv mice (I,J). In vivo contribution of the transplanted PAX7Venus+ human cells to muscle fibers is visualized on transverse sections of the grafted TA muscle. Sections were stained with a combination of human-specific anti-spectrin (green)/laminA/C (green) (H), which detect human fibers and human nuclei, respectively, but not mouse myofibers, and with anti-dystrophin (red) and lamin B2 (green) antibodies (I) that co-detect dystrophin+ myofibers and human-derived nuclei, respectively. J shows a transverse section of TA muscle grafted with FACS-sorted CD82+/CD56+ primary fetal human myogenic precursor cells and stained with anti-dystrophin and anti-human lamin B2. (K-O) Higher magnification of grafted TA section showing a human PAX7Venus+ cell (white arrowhead) expressing the PAX7 protein (L) and human specific lamin A/C (M) localized under the laminin+ basal lamina (N) (chicken anti-laminin antibody). Nuclei are labeled with DAPI (O). Red arrow shows a human laminA/C+ PAX7− myofiber nucleus. Scale bars: 200 µm in A,D,C,F; 1000 µm in B,E; 100 µm in H-J; 50 µm in K-O.
To determine the myogenic potential of the human PAX7Venus+ cells in vivo, we transplanted 105 FACS-sorted PAX7Venus+ cells from 3-week-old myogenic cultures into the tibialis anterior (TA) muscle of NOD; Rag1−/−; Dmdmdx-5Cv or RagB6 immunodeficient mice. Cardiotoxin treatment was performed 24 h before transplantation to induce myofiber injury but no X-irradiation of the TA muscles was performed before transplantation. Thus, endogenous mouse SC were also able to contribute to myofiber repair in vivo and potentially compete with the exogenous human PAX7Venus+ cells. Mice were sacrificed after 6-8 weeks. Human-derived myofibers and mononucleated cells were identified using species-specific antibodies for human spectrin, lamin B2 or lamin A/C, a combination of markers that simultaneously identifies human muscle fibers and human nuclei (Alexander et al., 2016). Most spectrin-positive myofibers contained at least one human lamin A/C-positive nucleus within the section analyzed, demonstrating that cells of human origin had successfully engrafted (Fig. 5H). Six weeks after transplantation, clusters of human-derived fibers expressing dystrophin and lamin B2 or spectrin and lamin A/C (Fig. 5I) were identified on sections along most of the length of the transplanted TA in the NOD; Rag1−/−; Dmdmdx-5Cv mice. Dystrophin+ muscle fibers were of varying diameter and often contained both peripheral and central human nuclei. Dystrophin expression most likely derives from the grafted human cells, as this strain of mdx mice exhibit very few revertants (Danko et al., 1992), and thus the probability of detecting such a revertant harboring a human nucleus is extremely low. FACS-sorted CD82+/CD56+ human fetal myogenic precursor cells were injected as a positive control and analyzed using similar antibody combinations (Alexander et al., 2016; Rozkalne et al., 2014). Up to 45 human fibers were identified in sections of PAX7Venus+ injected TA (34.81±11.52; mean±s.d.). A comparable number of engrafted fibers were identified when CD82+/CD56+ human fetal myogenic cells were injected (49.85±19.30), indicating that PAX7Venus+ cells show a comparable regenerative potential to these cells (Fig. 5J). These ratios of human fibers/injected cells are similar to those obtained when human iPSC differentiated to a myogenic fate are sorted based on ERBB3 or NGFR expression before injection in vivo (Hicks et al., 2018). Importantly, some human cells (human lamin A/C+) located underneath the myofiber basal lamina were also observed to express PAX7, indicating that human PAX7Venus+ transplanted cells can contribute to the SC pool (arrows, Fig. 5K-O). Therefore, the human PAX7Venus+ cells generated in vitro exhibit similar regenerative properties to mouse and human myogenic precursors/fetal SC (Chal et al., 2015; Tierney et al., 2016).
Conclusion
Here, we dissected the progression of human myogenesis in vitro using reporter iPSC lines expressing fluorescent proteins driven by the myogenic genes PAX7 and MYOG. We particularly focused on the differentiation of the PAX7-expressing lineage, which gives rise to adult muscle stem cells (SC) (Brack and Rando, 2012; Dumont et al., 2015). We previously reported that, in these culture conditions, a population of human PAX3+ cells is detected after 1 week of differentiation. This population subsequently expands during the second week in culture (Fig. 1Q) (Chal et al., 2016). Here, we observed that MYOG is first expressed in the myogenic cultures around day 10-12, before PAX7, which only appears at day 14. This is consistent with the existence of a first phase of primary or embryonic myogenesis initiated by PAX3+/PAX7− precursors as demonstrated for mouse in vivo and in vitro (Fig. 1Q) (Biressi et al., 2007b; Hutcheson et al., 2009; Kassar-Duchossoy et al., 2005; Relaix et al., 2005). This phase would be followed by a second phase of secondary or fetal myogenesis, during which myofibers form from PAX7+ mononucleated cells, which are also able to self-renew (Hutcheson et al., 2009).
We also demonstrate using scRNA-seq, that our differentiation conditions can yield a pure myogenic human PAX7+ cell population free of neural contaminants (Kim et al., 2017). These cells express bona fide markers of fetal myogenic precursors/SC such as CD82, VCAM1, ITGA7, TNC and CAV1, and they can generate myofibers and self-renew both in vivo and in vitro, which are features of fetal SC in mouse (Alexander et al., 2016; Barruet et al., 2020; Biressi et al., 2007b; Tierney et al., 2016).
Analysis of the scRNA-seq data allowed us to characterize the developmental trajectory of the human PAX7 myogenic lineage in vitro. We have identified a large population of cycling PAX7+ myogenic precursors characterized by a long G1 phase. These PAX7+ cells subsequently activate MYOG and start expressing genes involved in the control of fusion, such as MYMX (Sampath et al., 2018) or CKB (Simionescu-Bankston et al., 2015). They eventually downregulate PAX7 and activate genes coding for sarcomeric proteins expressed in post-mitotic myocytes.
Together, our data demonstrate that myogenic commitment of human iPSC in vitro occurs through a sequence of stages resembling muscle development of mouse and chicken embryos in vivo (Esteves de Lima et al., 2014; Kassar-Duchossoy et al., 2005; Manceau et al., 2008; Murphy and Kardon, 2011; Picard and Marcelle, 2013; Relaix et al., 2005; Zalc et al., 2014). The PAX7+ cells produced in these cultures exhibit characteristics of fetal SC. In mouse, these cells exhibit a higher regenerative capacity compared with adult SC, although their ability to colonize the adult SC niche is reduced (Tierney et al., 2016). Therefore, these human PAX7+ cells produced in vitro could constitute an ideal substrate for the development of cell therapies targeting muscular dystrophies or volumetric muscle injuries.
MATERIALS AND METHODS
sgRNA design and Cas9 vector assembly
Cas9 target sites were identified using the online CRISPR design tool (http://tools.genome-engineering.org). Briefly, DNA sequences flanking the start codon (human PAX7) or the stop codon (MYOG) were used for designing the sgRNAs. Several pairs of sgRNAs targeting either the Watson or the Crick strand of genomic DNA were selected and tested. For each target, a specific Cas9 vector was made. Briefly, the Cas9 vector pSpCas9 (BB)-2A-GFP (pX458; Addgene plasmid 48138) was digested using BbsI, and a pair of phosphorylated and annealed oligos (20 bp target sequences) were cloned into the guide RNA locus as previously described (Ran et al., 2013). All vectors were sequenced to ensure the presence of the right sequence. gRNA pairs were tested for their efficiency using the SURVEYOR assay as previously described (Ran et al., 2013).
Targeting vector design and construction
MYOG-Venus
The 5′-homology arm of 1 kb containing exons 2 and 3 was amplified using the primers forward 5′-CGCGGATCCGGAAGCCAGGAAGGCCTGGAAGCAGGGCCT-3′ and reverse 5′-CTGAAGTTGGTTGCTCCGCTGCCCATGTTGGGCATGGTTT-3′ and then inserted in the pBSKS-2A-NLS-Venus Neomycin vector by ligation-recombination. The vector was then digested with BsrGI and ClaI in order to remove the selection cassette. The 3′-homology arm of 0.6 kb was amplified with the primers forward 5′-GCGGTGTACAAGTAAATCGATGATTGTCTTCCAAGCCGGGCATCCTTGCG-3′ and reverse 5′-ACGCGTCGACCACAGGAGACCTTGGTCGGATGGCAG-3′ and then inserted in the construction with the 5′-homology arm after being digested with BsrG1 and SalI.
PAX7-Venus
The vector was constructed in two steps. First, the 5′-homology arm of PAX7 (2 kb amplicon) was amplified by PCR using the primers forward 5′-GCGCAGATCTGTCACATGCTGCAAGGGGCAAAGGTCACAG-3′ and reverse 5′-GAACAGCTCCTCGCCCTTGCTCACCATTCTTGCGCACGCCGGGGACGAATCCAAA-3′. The PCR amplicon was digested with BgIII and cloned by ligation/recombination into the pBSKS-2A-NLS-Venus Neomycin vector linearized with BamHI. The 3′-homology arm of PAX7 (1 kb amplicon) was amplified using the primers forward 5′’CCCATCGATGCGGCCCTTCCCGGCACGGTACCGAGAAT-3′ and reverse 5′-ACGCATCGATGTCGACCCCAAGGGAGCTCCTCCCGGATCGCAGGCT 3′. The PCR amplicon was then digested with ClaI and SalI and ligated into the vector containing the 5′-homology arm after being digested with ClaI and SalI.
In a second step, a fragment containing exon 1 of PAX7 as well as the Neomycin selection cassette was excised using BsrG1/SaII restriction enzymes. Then by two successive PCRs, a 1.2 kb amplicon containing the 2A, PAX7 exon 1 (without the ATG) and the 3′-homology arm, were amplified using the 5′-AAGCAGGCAGGCGACGTGGAGGAGAACCCAGGACCAGCGGCCCTTCCCGGCACGGTACCGAGA-3′, 5′-GAGAACTGTACAAGGGCAGCGGAGCAACCAACTTCAGCCTGCTGAAGCAGGCAGGCGACGTGGAGGAG-3′ and 5′-ACGCATCGATGTCGACCCCAAGGGAGCTCCTCCCGGATCGCAGGCT-3′ primers. The amplicon was digested with BsrGI and SaII and ligated into the vector containing the 5′-homology arm and NLS-Venus, resulting in a construction of 2A-NLS-Venus in frame with exon 1 of PAX7 without the Neomycin selection cassette.
Generation of reporter human iPSC clones and validation
Generation
The NCRM1 human iPSC line (RUCDR, Rutgers University) was used for the generation of human reporter clones. Human iPSC were expanded on Matrigel in mTesR1 medium (Stemcell Technologies) for few days. Cells were dissociated using Accutase (Stemcell Technologies) and 8×10⁵ cells were electroporated using 5 μg of total DNA (ratio 1:1) and the Amaxa Nucleofector kit as previously described (Ran et al., 2013). Then, 24 h after transfection, cells were dissociated and FACS-sorted for Cas9-GFP+ and expanded clonally at low densities. Later, clones were picked up for PCR screening and expansion.
Validation
PCR primers were designed outside the 5′- and the 3′-homology arms and in the insertion Cherry/Venus region to ensure proper site-specific targeting. All amplicons were sequenced to ensure in-frame positioning of the reporter/selection fragment and to rule out the presence of indels at the recombination site.
iPSC maintenance and differentiation
Maintenance
Human iPSC were cultured as previously described (Chal et al., 2016, 2015). Briefly, cells were cultured on Matrigel-coated dishes (Corning, 354277) in mTesR1 medium. Cells were passaged as aggregates or as single cells. The NCRM1 human iPSC line and its engineered derivatives were tested and found to be mycoplasma-free.
Differentiation
Serum-free myogenic primary differentiation of human iPSC lines was performed as previously described (Chal et al., 2016, 2015). For FACS analysis and secondary differentiation purposes, 3-week-old primary myogenic cultures generated from hiPSC were dissociated as described and myogenic progenitors were replated at a density of 35-40 k/cm2 onto Matrigel-coated (Corning, 354277) dishes in skeletal muscle growth medium (SkGM-2, Lonza, CC-3245) with 10 µM ROCK inhibitor. After 24 h, medium was changed to SkGM-2 medium without ROCK inhibitor. Cultures were allowed to proliferate for 1-2 days, at which point cultures reached ∼90% confluence. Cultures were then induced for myogenic differentiation with DMEM/F12 supplemented with 2% knock-out serum replacement (Invitrogen, 10828028), 1 µM Chiron (Tocris Bioscience, 4423), 0.2% Pen/Strep (Life Technologies, 15140122) and 1× ITS (Life Technologies, 41400045). Following induction, differentiation medium was changed on days 1 and 2 and was then refreshed every other day for 1 week. To inhibit Notch signaling, 25 µM DAPT (Sigma-Aldrich, D5942) was added to KC medium for 1 week.
Flow cytometry analysis and FACS
Sorting and analysis
Cells were purified by FACS from differentiated cultures using an Aria (BD Biosciences) or an S3 cell sorter (Bio-Rad). Gating was determined for each reporter line using corresponding undifferentiated culture as a baseline control. Sorted populations were processed either for replating, transplantation experiments, microarray or RNA-seq experiments. Biological triplicates were generated.
Microarrays generation and analysis
Microarrays
Biotinylated cRNA targets were prepared from total RNA using a double amplification protocol according to the GeneChip Expression Analysis Technical Manual: Two-Cycle Target Labeling Assay (P/N 701021 Rev.5, Affymetrix). Following fragmentation, cRNAs were hybridized on GeneChip Human Gene 2.0ST Arrays. Each microarray was then washed and stained on a GeneChip fluidics station 450 and further scanned with a GeneChip Scanner 3000 7G. Finally, raw data (CEL Intensity files) were extracted from the scanned images using the Affymetrix GeneChip Command Console (AGCC) version 1.4.1.46.
Microarray data analysis
Initial filtering and preprocessing, including background correction, quantile normalization and summarization, was performed using both RMA and MAS with the R Bioconductor package (R version 2.12.1, Bioconductor version 2.8). Expression sets were then filtered according to Calls information. Probe sets expression fold changes between conditions (biological triplicates) were calculated using the ‘Comparative Marker Selection’ module of GenePattern (Reich et al., 2006). Volcano and FcFc scatter plots were generated using the Multiplot application of GenePattern. Histogram expression profiles of gene probe sets were generated from MAS values. Further analysis was performed using the Manteia database (Tassy and Pourquié, 2014) and DAVID Functional Annotation tools (Huang et al., 2009). Hierarchical clustering was performed on Microarray RMA data. Clustering was computed with an Average linkage method and Euclidean distances. A frequency histogram was used to determine the cell cycle state. For 10% of the cells, cell cycle phase could not be determined. Both approximately unbiased (AU) and bootstrap probability (BP) P-values were calculated (pvclust, R package). GEO accession code for the microarray data is GSE149057.
Cell preparation and transplantation into TA muscles
Cultures of 3-week-old differentiated PAX7Venus hiPSC were dissociated using a mix of collagenase IV (Thermo Fisher Scientific, 17104019) and Trypsin-EDTA (Thermo Fisher Scientific, 25200-056) as previously described (Chal et al., 2015). Cell preparations were filtered through 70 μm and then 30 μm cell strainers and Venus+ cells were FACS-sorted. Target cells were resuspended in phosphate-buffered saline (PBS) with tracking fluorescent beads (Molecular Probes). One day before transplantation, 10 µl of Cardiotoxin (Sigma-Aldrich, 40 ng/ml) was injected in both TA muscles of 3- to 4-month-old Rag2−/−γc−/− or NOD; Rag1−/−; Dmdmdx-5Cv males. Then 15 μl of cell preparation containing 105 cells was injected into TA muscles of 3- to 4-month-old mice. Injections were carried out under general anesthesia. Grafted TA muscles were collected 6-8 weeks after transplantation and processed for cryosection and immunofluorescence analyses. Experiments on mice were carried out according to local regulations (Boston Children's Hospital, Brigham and Women's Hospital, Institute of Genetics and Molecular and Cellular Biology), in agreement with national and international guidelines.
Human fetal muscle cell isolation
Human de-identified, discarded fetal tissue was collected under a protocol approved by the Committee of Clinical Investigation at Boston Children's Hospital (IRB-P00020286). Primary tissue was dissociated into mononuclear cells, then cells were frozen and stored in an ultralow freezer at −140°C as previously described (Pakula et al., 2019). For purification of myogenic cells, frozen cells were thawed and plated overnight in DMEM-high glucose (4.5 g) media supplemented with 20% fetal bovine serum (FBS) and antibiotics. Cells were purified using FACS as described in Pakula et al. (2019) using APC anti-human CD56 antibody, Clone HCD56 (BioLegend, 318310) and PE anti-human CD82 antibody, Clone ASL-24 (BioLegend, 342103). Antibodies were added at a concentration of 5 µl antibody per million cells, as recommended by the manufacturer. Double-positive (CD56+CD82+ sorted cells were plated overnight in DMEM high glucose media before injection in animals. For injections, sorted human fetal cells were trypsinized and resuspended in physiological-grade saline at a concentration of 100,000 cells/15 µl.
qRT-PCR
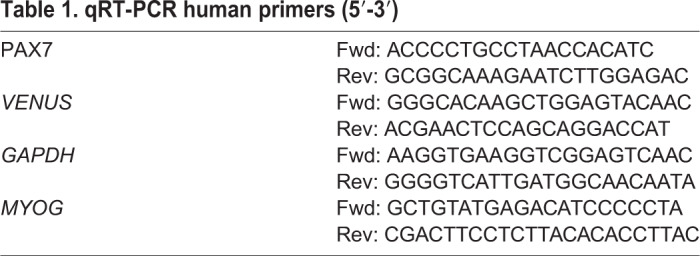
RNA was extracted from cells using Trizol (Invitrogen) or the NucleoSpin RNA XS RNeasy Mini Kit (Macherey-Nagel). RT-PCR was performed on total RNA using QuantiFast SYBR Green RTPCR kit (Qiagen) and gene-specific primers (Primer-BLAST and Qiagen; Table 1) and run on a LightCycler 480II (Roche). Human GAPDH was used as a gene of reference and relative changes were calculated according the ΔΔCt method.
Table 1.
qRT-PCR human primers (5′-3′)
Immunohistochemistry
Cell cultures were fixed for 20 min in 4% paraformaldehyde (PFA). Cultures were rinsed three times in PBS, followed by blocking buffer composed of Tris-buffered saline (TBS) supplemented with 10% FBS and 0.1% Triton X-100. Primary antibodies were diluted in blocking buffer and incubated overnight at 4°C. Cultures were then washed three times with TBST (TBS supplemented with 0.5% Tween-20) and incubated with secondary antibodies (1:500) and DAPI (5 μg/ml) in blocking buffer for 1 h at room temperature. Cultures were ultimately washed with TBST followed by PBS, before analysis. Dissected TA muscles were prepared for cryosections (10 μm) as previously described (Mathew et al., 2011). Slides were fixed in 4% PFA in PBS for 15 min at room temperature followed by 3 min of permeabilization with 0.5% Triton X-100. After fixation, slides were washed twice with PBS and blocked in 10% FBS-PBS-0.1% Triton X-100 for 30 min at room temperature. Slides were incubated with primary antibodies diluted in blocking buffer at 4°C overnight. They were then washed three times for 5 min in PBST (PBS and Tween 0.1%), and the corresponding secondary antibodies were applied for 2 h at room temperature. Sections were mounted with SouthernBiotech mounting medium (0100-01).
Antibodies used in this study are rabbit anti-myogenin (Santa Cruz Biotechnology, M-225, 1:200), mouse anti-myogenin (Developmental Studies Hybridoma Bank, F5D, 1:200), mouse anti-Pax7 (Developmental Studies Hybridoma Bank, Clone Pax7, 1:100), chicken anti-laminin (LSBio, LS-C96142, 1:500), chicken anti-GFP (Abcam, ab13970, 1:800), mouse anti-Fast MyHC (Sigma-Aldrich, MY-32, 1:500), mouse anti-human spectrin (Leica, NCL-SPEC1, 1:100), mouse anti-dystrophin (Leica, NCL-DYS1, 1:20), rabbit anti-human lamin A/C (Abcam, ab108595, 1:50) and rabbit anti-human lamin B2 (Cell Signaling Technology, 12255S, 1:50). The secondary antibodies used in this study are donkey anti-mouse IgG Alexa Fluor 488 conjugate (Thermo Fisher Scientific, R37114, 1:1000), goat anti-chicken IgY (H+L) Alexa Fluor 647 (Thermo Fisher Scientific, A-21449, 1:500), anti-mouse Dylight 549 (Jackson Immunoresearch, 1:500) and anti-rabbit Alexa fluor-488 diluted (Jackson Immunoresearch, 1:500).
Image acquisition and processing
Live or fixed bright-field and fluorescent images were acquired on either a Zeiss Axiovert, Evos FL or a Zeiss LSM780. Images were processed using Adobe Photoshop/Illustrator, and quantification and measurements were carried out using the Fiji software (Schindelin et al., 2012).
DNA content analysis
hiPSC-derived primary muscle cultures were dissociated using collagenase and trypsin as described above. PAX7Venus+ cells were isolated using flow cytometry. Propidium iodide staining was performed as previously described (Kim and Sederstrom, 2015). In brief, isolated PAX7Venus+ cells were fixed in ice-cold 70% ethanol followed by incubation at −20°C for 2 h. Cells were washed twice with PBS supplemented with 2% FBS and 1 mM EDTA. Cells were then stained in 50 μg/ml propidium iodide (ReadiDrop, Bio-Rad, 1351102) supplemented with 100 μg/ml RNase and 2 mM MgCl2 for 20 min. Propidium iodide-stained cells were analyzed using flow cytometry (S3e™ Cell Sorter, Bio-Rad). Three independent experiments were performed and mean±s.d. was calculated.
EdU staining
Cultures of 19-day-old myogenic PAX7-Venus cells were incubated with 10 μM EdU in the culture medium for 40 h. On day 21 cells were dissociated and PAX7Venus+ cells were sorted using flow cytometry (S3e™ Cell Sorter, Bio-Rad). The sorted cells were plated in DMEM supplemented with Rock inhibitor (Tocris Bioscience, 1254) and after 30 min cells were fixed with 3.7% PFA (Electron Microscopy Sciences, 15710) for 15 min at room temperature. EdU staining was performed using the Click-iT® EdU Imaging Kit (Invitrogen, C10340) following the manufacturer's instructions. After EdU staining, cells were stained with PAX7 antibody (Abcam, ab34360, 1:200) and Hoechst 33342 (Thermo Fisher Scientific, H3570) using immunostaining as described above. The number of PAX7 and EdU double-positive cells was determined using Fiji (Schindelin et al., 2012). Three independent experiments were performed and mean±s.d. was calculated.
scRNA-seq
Preparation of single cell suspensions for scRNA-seq
The PAX7-Venus reporter line was differentiated according to our previously published method (Chal et al., 2016). On day 30, cells were dissociated using 2.5 mg/ml collagenase, (Type IV, Thermo Fisher Scientific, 17104019) and 0.05% Trypsin EDTA (Thermo Fisher Scientific, 25200-056) in PBS. The enzymes were neutralized by 5% FBS in DMEM (Thermo Fisher Scientific, 11965-118). Dissociated cells were passed through a 70 µm nylon cell strainer (Celltreat, 229483), spun down at 300 g for 5 min and resuspended in 0.1% FBS in PBS. PAX7-Venus+ cells were then passed through a 30 µm filter (Falcon, 352235) and sorted using flow cytometry (S3e™ Cell Sorter, Bio-Rad). Sorted cells were spun down and resuspended in 0.1% BSA in PBS. Cell density was quantified manually and was adjusted to 150,000 cells/ml for encapsulation. The dissociation method and flow cytometry were optimized to achieve >90% viable cells and minimize cell doublets. Cells were collected from two independent experiments and 1100 cells were encapsulated from each experiment. Sequencing data from the replicates were combined for data analysis.
Barcoding and sequencing
PAX7-Venus+ single cells were encapsulated and barcoded using inDrops (Klein et al., 2015) as previously reported (Zilionis et al., 2017), using ‘V3’ sequencing adapters. The encapsulation and library preparation were performed by the Harvard Single Cell Core as described in Zilionis et al. (2017). inDrops libraries were sequenced on an Illumina NextSeq 500 using the NextSeq 75 High Output Kits. Standard Illumina sequencing primers were used: 61 cycles for Read1, 14 cycles for Read2, and eight cycles each for IndexRead1 and IndexRead2.
Mapping, processing and clustering of single cell transcriptomes
Raw sequencing data were processed using the inDrops.py bioinformatics pipeline available at github.com/indrops/indrops. Single cell transcriptome libraries were mapped to a human reference transcriptome built from the GRCh38.p12 (GCF_000001405.38) genome assembly. Bowtie version 1.2.2 was used with maximum permitted total of quality values of 200 at all mismatched read positions throughout the entire alignment (–e 200).
A weighted histogram of transcript counts per cell barcode versus cell barcode abundance was used to identify transcripts originating from abundant cell barcodes. Only transcript counts originating from abundant cell barcodes were included in downstream analysis. Basic filtering parameters were used to exclude cells expressing <250 genes and genes expressed in less than three cells. The filtered counts were normalized by the total number of counts for each biological sample. The top 2000 variable genes were identified according to Satija et al. (2015). For each cell, the fraction of counts due to mitochondrial genes was determined and cells with >0.2 fraction were filtered out. Any source of variation between the libraries were regressed out using Seurat's regressout function (Satija et al., 2015). We further analyzed 1427 cells that passed the filtering criteria.
Single cell data were projected into a low dimensional space by principal component analysis (PCA). The nearest-neighbor graph (k=10) used Euclidean distance and 30 PCA dimensions. UMAP (Becht et al., 2018) and Force-directed graph (Jacomy et al., 2014) were used to embed the neighborhood graph. Cell clusters were identified using the Louvain graph-clustering method (community detection based on optimizing modularity) (Blondel et al., 2008). The top 500 differentially expressed genes were identified using a Wilcoxon rank-sum test by comparing cells of each cluster with cells of all the other clusters. The table of differentially expressed genes reports top-ranking differentially expressed genes, ranked by FDR-adjusted P-values (Table S4).
The cell cycle was scored as in Kowalczyk et al. (2015). Each cell was given a cell cycle score based on the expression of G2/M and S phase markers. The cells not expressing the markers from G2/M and S phase were identified to be in G0/G1 stage.
Coarse-grained layout of the data was generated using PAGA (threshold=0.05) (Wolf et al., 2019). Pseudotemporal orderings were constructed by selecting dividing PAX7+ cells as root. Diffusion pseudotime was calculated for all the remaining cells relative to the root. Cellular trajectories were assembled for paths through specified clusters, with cells ordered by DPT values (Wolf et al., 2019).
Supplementary Material
Acknowledgements
We are thankful to the Pourquie lab, Christophe Marcelle and Stephane Vincent for their feedback and comments. We thank Amélie Freismuth, Marion Humbert and Betty Heller from the Institute of Genetics and Molecular and Cellular Biology (IGBMC) cell culture service for hiPSC culture assistance. We thank the IGBMC cell sorting facility, the microarray-sequencing platform and DANA Farber Molecular Biology Core Facilities. We thank Marie Knockaert, Tania Knauer-Meyer, Hannah Nelson, Lai Ding and Caroline Mursch for their help.
Footnotes
Competing interests
Olivier Pourquie is a founder and shareholder of Anagenesis Biotechnologies.
Author contributions
Conceptualization: Z.A.T., O.P., J.R., E.G.; Methodology: Z.A.T., O.P., J.R.; Software: O.T., J.R.; Validation: J.R., E.W., E.G.; Formal analysis: O.P., B.G.; Investigation: J.R., B.G., S.G., J.-M.G., A. Hick, A. Hall; Resources: O.P.; Writing - original draft: Z.A.T., O.P., J.R.; Writing - review & editing: O.P., J.R., E.G.; Supervision: O.P.; Project administration: O.P.; Funding acquisition: O.P.
Funding
This work was supported by an advanced grant from the European Research Council to O.P., by the European Union's Seventh Framework Programme grant PluriMes (agreement no. 602423), by the Human Frontier Science Program (RGP0052/2018), by a strategic grant from the French Muscular Dystrophy Association (AFM) to O.P. and by a National Institutes of Health research grant (R01 AR074526) to O.P. and E.G. Deposited in PMC for release after 12 months.
Data availability
Microarray data have been deposited in GEO under accession number GSE149057. Single cell RNA-sequencing data have been deposited in GEO under accession number GSE149451.
Supplementary information
Supplementary information available online at https://dev.biologists.org/lookup/doi/10.1242/dev.187344.supplemental
Peer review history
The peer review history is available online at https://dev.biologists.org/lookup/doi/10.1242/dev.187344.reviewer-comments.pdf
References
- Alexander M. S., Rozkalne A., Colletta A., Spinazzola J. M., Johnson S., Rahimov F., Meng H., Lawlor M. W., Estrella E., Kunkel L. M. et al. (2016). CD82 is a marker for prospective isolation of human muscle satellite cells and is linked to muscular dystrophies. Cell Stem Cell 19, 800-807. 10.1016/j.stem.2016.08.006 [DOI] [PMC free article] [PubMed] [Google Scholar]
- Barruet E., Garcia S. M., Striedinger K., Wu J., Lee S., Byrnes L., Wong A., Xuefeng S., Tamaki S., Brack A. S. et al. (2020). Functionally heterogeneous human satellite cells identified by single cell RNA sequencing. eLife 9, e51576 10.7554/elife.51576 [DOI] [PMC free article] [PubMed] [Google Scholar]
- Becht E., McInnes L., Healy J., Dutertre C.-A., Kwok I. W. H., Ng L. G., Ginhoux F. and Newell E. W. (2018). Dimensionality reduction for visualizing single-cell data using UMAP. Nat. Biotechnol. 37, 38-44. 10.1038/nbt.4314 [DOI] [PubMed] [Google Scholar]
- Belle M., Godefroy D., Couly G., Malone S. A., Collier F., Giacobini P. and Chédotal A. (2017). Tridimensional visualization and analysis of early human development. Cell 169, 161-173.e12. 10.1016/j.cell.2017.03.008 [DOI] [PubMed] [Google Scholar]
- Bi P., Ramirez-Martinez A., Li H., Cannavino J., McAnally J. R., Shelton J. M., Sánchez-Ortiz E., Bassel-Duby R. and Olson E. N. (2017). Control of muscle formation by the fusogenic micropeptide myomixer. Science 356, 323-327. 10.1126/science.aam9361 [DOI] [PMC free article] [PubMed] [Google Scholar]
- Biressi S., Molinaro M. and Cossu G. (2007a). Cellular heterogeneity during vertebrate skeletal muscle development. Dev. Biol. 308, 281-293. 10.1016/j.ydbio.2007.06.006 [DOI] [PubMed] [Google Scholar]
- Biressi S., Tagliafico E., Lamorte G., Monteverde S., Tenedini E., Roncaglia E., Ferrari S., Ferrari S., Cusella-De Angelis M. G., Tajbakhsh S. et al. (2007b). Intrinsic phenotypic diversity of embryonic and fetal myoblasts is revealed by genome-wide gene expression analysis on purified cells. Dev. Biol. 304, 633-651. 10.1016/j.ydbio.2007.01.016 [DOI] [PubMed] [Google Scholar]
- Blondel V. D., Guillaume J.-L., Hendrickx J. M., de Kerchove C. and Lambiotte R. (2008). Local leaders in random networks. Phys. Rev. 77, 036114 10.1103/physreve.77.036114 [DOI] [PubMed] [Google Scholar]
- Brack A. S. and Rando T. A. (2012). Tissue-specific stem cells: lessons from the skeletal muscle satellite cell. Cell Stem Cell 10, 504-514. 10.1016/j.stem.2012.04.001 [DOI] [PMC free article] [PubMed] [Google Scholar]
- Bröhl D., Vasyutina E., Czajkowski M. T., Griger J., Rassek C., Rahn H.-P., Purfürst B., Wende H. and Birchmeier C. (2012). Colonization of the satellite cell niche by skeletal muscle progenitor cells depends on Notch signals. Dev. Cell 23, 469-481. 10.1016/j.devcel.2012.07.014 [DOI] [PubMed] [Google Scholar]
- Chakkalakal J. V., Jones K. M., Basson M. A. and Brack A. S. (2012). The aged niche disrupts muscle stem cell quiescence. Nature 490, 355-360. 10.1038/nature11438 [DOI] [PMC free article] [PubMed] [Google Scholar]
- Chal J. and Pourquié O. (2017). Making muscle: skeletal myogenesis in vivo and in vitro. Development 144, 2104-2122. 10.1242/dev.151035 [DOI] [PubMed] [Google Scholar]
- Chal J., Oginuma M., Al Tanoury Z., Gobert B., Sumara O., Hick A., Bousson F., Zidouni Y., Mursch C., Moncuquet P. et al. (2015). Differentiation of pluripotent stem cells to muscle fiber to model Duchenne muscular dystrophy. Nat. Biotechnol. 33, 962-969. 10.1038/nbt.3297 [DOI] [PubMed] [Google Scholar]
- Chal J., Al Tanoury Z., Hestin M., Gobert B., Aivio S., Hick A., Cherrier T., Nesmith A. P., Parker K. K. and Pourquié O. (2016). Generation of human muscle fibers and satellite-like cells from human pluripotent stem cells in vitro. Nat. Protoc. 11, 1833-1850. 10.1038/nprot.2016.110 [DOI] [PubMed] [Google Scholar]
- Chal J., Al Tanoury Z., Oginuma M., Moncuquet P., Gobert B., Miyanari A., Tassy O., Guevara G., Hubaud A., Bera A. et al. (2018). Recapitulating early development of mouse musculoskeletal precursors of the paraxial mesoderm in vitro. Development 145, dev157339 10.1242/dev.157339 [DOI] [PubMed] [Google Scholar]
- Charville G. W., Cheung T. H., Yoo B., Santos P. J., Lee G. K., Shrager J. B. and Rando T. A. (2015). Ex vivo expansion and in vivo self-renewal of human muscle stem cells. Stem Cell Rep. 5, 621-632. 10.1016/j.stemcr.2015.08.004 [DOI] [PMC free article] [PubMed] [Google Scholar]
- Choi I. Y., Lim H., Estrellas K., Mula J., Cohen T. V., Zhang Y., Donnelly C. J., Richard J.-P., Kim Y. J., Kim H. et al. (2016). Concordant but varied phenotypes among duchenne muscular dystrophy patient-specific myoblasts derived using a human iPSC-based model. Cell Rep. 15, 2301-2312. 10.1016/j.celrep.2016.05.016 [DOI] [PubMed] [Google Scholar]
- Cornelison D. D. W. (2018). Known unknowns: current questions in muscle satellite cell biology. Curr. Top. Dev. Biol. 126, 205-233. 10.1016/bs.ctdb.2017.08.006 [DOI] [PubMed] [Google Scholar]
- Danko I., Chapman V. and Wolff J. A. (1992). The frequency of revertants in mdx mouse genetic models for Duchenne muscular dystrophy. Pediatr. Res. 32, 128-131. 10.1203/00006450-199207000-00025 [DOI] [PubMed] [Google Scholar]
- Diaz-Cuadros M., Wagner D. E., Budjan C., Hubaud A., Tarazona O. A., Donelly S., Michaut A., Al Tanoury Z., Yoshioka-Kobayashi K., Niino Y. et al. (2020). In vitro characterization of the human segmentation clock. Nature 580, 113-118. 10.1038/s41586-019-1885-9 [DOI] [PMC free article] [PubMed] [Google Scholar]
- Dumont N. A., Wang Y. X. and Rudnicki M. A. (2015). Intrinsic and extrinsic mechanisms regulating satellite cell function. Development 142, 1572-1581. 10.1242/dev.114223 [DOI] [PMC free article] [PubMed] [Google Scholar]
- Esteves de Lima J., Bonnin M.-A., Bourgeois A., Parisi A., Le Grand F. and Duprez D. (2014). Specific pattern of cell cycle during limb fetal myogenesis. Dev. Biol. 392, 308-323. 10.1016/j.ydbio.2014.05.015 [DOI] [PubMed] [Google Scholar]
- Esteves de Lima J., Bonnin M. A., Birchmeier C. and Duprez D. (2016). Muscle contraction is required to maintain the pool of muscle progenitors via YAP and NOTCH during fetal myogenesis. eLife 5, e15593 10.7554/elife.15593 [DOI] [PMC free article] [PubMed] [Google Scholar]
- Flanagan-Steet H., Hannon K., McAvoy M. J., Hullinger R. and Olwin B. B. (2000). Loss of FGF receptor 1 signaling reduces skeletal muscle mass and disrupts myofiber organization in the developing limb. Dev. Biol. 218, 21-37. 10.1006/dbio.1999.9535 [DOI] [PubMed] [Google Scholar]
- Fukada S.-I., Uezumi A., Ikemoto M., Masuda S., Segawa M., Tanimura N., Yamamoto H., Miyagoe-Suzuki Y. and Takeda S. (2007). Molecular signature of quiescent satellite cells in adult skeletal muscle. Stem Cells 25, 2448-2459. 10.1634/stemcells.2007-0019 [DOI] [PubMed] [Google Scholar]
- Gao X., Chandra T., Gratton M.-O., Quélo I., Prud'homme J., Stifani S. and St-Arnaud R. (2001). HES6 acts as a transcriptional repressor in myoblasts and can induce the myogenic differentiation program. J. Cell Biol. 154, 1161-1172. 10.1083/jcb.200104058 [DOI] [PMC free article] [PubMed] [Google Scholar]
- Gros J., Manceau M., Thomé V. and Marcelle C. (2005). A common somitic origin for embryonic muscle progenitors and satellite cells. Nature 435, 954-958. 10.1038/nature03572 [DOI] [PubMed] [Google Scholar]
- Hicks M. R., Hiserodt J., Paras K., Fujiwara W., Eskin A., Jan M., Xi H., Young C. S., Evseenko D., Nelson S. F. et al. (2018). ERBB3 and NGFR mark a distinct skeletal muscle progenitor cell in human development and hPSCs. Nat. Cell Biol. 20, 46-57. 10.1038/s41556-017-0010-2 [DOI] [PMC free article] [PubMed] [Google Scholar]
- Huang D. W., Sherman B. T. and Lempicki R. A. (2009). Systematic and integrative analysis of large gene lists using DAVID bioinformatics resources. Nat. Protoc. 4, 44-57. 10.1038/nprot.2008.211 [DOI] [PubMed] [Google Scholar]
- Hutcheson D. A., Zhao J., Merrell A., Haldar M. and Kardon G. (2009). Embryonic and fetal limb myogenic cells are derived from developmentally distinct progenitors and have different requirements for beta-catenin. Genes Dev. 23, 997-1013. 10.1101/gad.1769009 [DOI] [PMC free article] [PubMed] [Google Scholar]
- Ishikawa H. (1966). Electron microscopic observations of satellite cells with special reference to the development of mammalian skeletal muscles. Z. Anat. Entwicklungsgesch. 125, 43-63. 10.1007/BF00521974 [DOI] [PubMed] [Google Scholar]
- Jacomy M., Venturini T., Heymann S. and Bastian M. (2014). ForceAtlas2, a continuous graph layout algorithm for handy network visualization designed for the Gephi software. PLoS ONE 9, e98679 10.1371/journal.pone.0098679 [DOI] [PMC free article] [PubMed] [Google Scholar]
- Kassar-Duchossoy L., Giacone E., Gayraud-Morel B., Jory A., Gomes D. and Tajbakhsh S. (2005). Pax3/Pax7 mark a novel population of primitive myogenic cells during development. Genes Dev. 19, 1426-1431. 10.1101/gad.345505 [DOI] [PMC free article] [PubMed] [Google Scholar]
- Keefe A. C., Lawson J. A., Flygare S. D., Fox Z. D., Colasanto M. P., Mathew S. J., Yandell M. and Kardon G. (2015). Muscle stem cells contribute to myofibres in sedentary adult mice. Nat. Commun. 6, 7087 10.1038/ncomms8087 [DOI] [PMC free article] [PubMed] [Google Scholar]
- Kim K. H. and Sederstrom J. M. (2015). Assaying cell cycle status using flow cytometry. Curr. Protoc. Mol. Biol. 111, 28.6.1-28.6.11. 10.1002/0471142727.mb2806s111 [DOI] [PMC free article] [PubMed] [Google Scholar]
- Kim J., Magli A., Chan S. S. K., Oliveira V. K. P., Wu J., Darabi R., Kyba M. and Perlingeiro R. C. R. (2017). Expansion and purification are critical for the therapeutic application of pluripotent stem cell-derived myogenic progenitors. Stem Cell Rep. 9, 12-22. 10.1016/j.stemcr.2017.04.022 [DOI] [PMC free article] [PubMed] [Google Scholar]
- Klein A. M., Mazutis L., Akartuna I., Tallapragada N., Veres A., Li V., Peshkin L., Weitz D. A. and Kirschner M. W. (2015). Droplet barcoding for single-cell transcriptomics applied to embryonic stem cells. Cell 161, 1187-1201. 10.1016/j.cell.2015.04.044 [DOI] [PMC free article] [PubMed] [Google Scholar]
- Kowalczyk M. S., Tirosh I., Heckl D., Rao T. N., Dixit A., Haas B. J., Schneider R. K., Wagers A. J., Ebert B. L. and Regev A. (2015). Single-cell RNA-seq reveals changes in cell cycle and differentiation programs upon aging of hematopoietic stem cells. Genome Res. 25, 1860-1872. 10.1101/gr.192237.115 [DOI] [PMC free article] [PubMed] [Google Scholar]
- Lepper C. and Fan C.-M. (2010). Inducible lineage tracing of Pax7-descendant cells reveals embryonic origin of adult satellite cells. Genesis 48, 424-436. 10.1002/dvg.20630 [DOI] [PMC free article] [PubMed] [Google Scholar]
- Liu L., Cheung T. H., Charville G. W., Hurgo B. M. C., Leavitt T., Shih J., Brunet A. and Rando T. A. (2013). Chromatin modifications as determinants of muscle stem cell quiescence and chronological aging. Cell Rep. 4, 189-204. 10.1016/j.celrep.2013.05.043 [DOI] [PMC free article] [PubMed] [Google Scholar]
- Low S. H., Barnes J. L., Zammit P. S. and Beauchamp J. R. (2018). Delta-like 4 activates Notch 3 to regulate self-renewal in skeletal muscle stem cells. Stem Cells 36, 458-466. 10.1002/stem.2757 [DOI] [PubMed] [Google Scholar]
- Magli A. and Perlingeiro R. R. C. (2017). Myogenic progenitor specification from pluripotent stem cells. Semin. Cell Dev. Biol. 72, 87-98. 10.1016/j.semcdb.2017.10.031 [DOI] [PMC free article] [PubMed] [Google Scholar]
- Manceau M., Gros J., Savage K., Thome V., McPherron A., Paterson B. and Marcelle C. (2008). Myostatin promotes the terminal differentiation of embryonic muscle progenitors. Genes Dev. 22, 668-681. 10.1101/gad.454408 [DOI] [PMC free article] [PubMed] [Google Scholar]
- Marti M., Montserrat N., Pardo C., Mulero L., Miquel-Serra L., Rodrigues A. M., Andres Vaquero J., Kuebler B., Morera C., Barrero M. J. et al. (2013). M-cadherin-mediated intercellular interactions activate satellite cell division. J. Cell Sci. 126, 5116-5131. 10.1242/jcs.123562 [DOI] [PubMed] [Google Scholar]
- Mathew S. J., Hansen J. M., Merrell A. J., Murphy M. M., Lawson J. A., Hutcheson D. A., Hansen M. S., Angus-Hill M. and Kardon G. (2011). Connective tissue fibroblasts and Tcf4 regulate myogenesis. Development 138, 371-384. 10.1242/dev.057463 [DOI] [PMC free article] [PubMed] [Google Scholar]
- Mourikis P. and Tajbakhsh S. (2014). Distinct contextual roles for Notch signalling in skeletal muscle stem cells. BMC Dev. Biol. 14, 2 10.1186/1471-213X-14-2 [DOI] [PMC free article] [PubMed] [Google Scholar]
- Murphy M. and Kardon G. (2011). Origin of vertebrate limb muscle: the role of progenitor and myoblast populations. Curr. Top. Dev. Biol. 96, 1-32. 10.1016/B978-0-12-385940-2.00001-2 [DOI] [PMC free article] [PubMed] [Google Scholar]
- Nagai T., Ibata K., Park E. S., Kubota M., Mikoshiba K. and Miyawaki A. (2002). A variant of yellow fluorescent protein with fast and efficient maturation for cell-biological applications. Nat. Biotechnol. 20, 87-90. 10.1038/nbt0102-87 [DOI] [PubMed] [Google Scholar]
- Ontell M. and Kozeka K. (1984). The organogenesis of murine striated muscle: a cytoarchitectural study. Am. J. Anat. 171, 133-148. 10.1002/aja.1001710202 [DOI] [PubMed] [Google Scholar]
- Pakula A., Spinazzola J. M. and Gussoni E. (2019). Purification of myogenic progenitors from human muscle using fluorescence-activated cell sorting (FACS). Methods Mol. Biol. 1889, 1-15. 10.1007/978-1-4939-8897-6_1 [DOI] [PMC free article] [PubMed] [Google Scholar]
- Pawlikowski B., Pulliam C., Betta N. D., Kardon G. and Olwin B. B. (2015). Pervasive satellite cell contribution to uninjured adult muscle fibers. Skeletal Muscle 5, 42 10.1186/s13395-015-0067-1 [DOI] [PMC free article] [PubMed] [Google Scholar]
- Picard C. A. and Marcelle C. (2013). Two distinct muscle progenitor populations coexist throughout amniote development. Dev. Biol. 373, 141-148. 10.1016/j.ydbio.2012.10.018 [DOI] [PubMed] [Google Scholar]
- Pietrosemoli N., Mella S., Yennek S., Baghdadi M. B., Sakai H., Sambasivan R., Pala F., Di Girolamo D. and Tajbakhsh S. (2017). Comparison of multiple transcriptomes exposes unified and divergent features of quiescent and activated skeletal muscle stem cells. Skelet. Muscle 7, 28 10.1186/s13395-017-0144-8 [DOI] [PMC free article] [PubMed] [Google Scholar]
- Ran F. A., Hsu P. D., Wright J., Agarwala V., Scott D. A. and Zhang F. (2013). Genome engineering using the CRISPR-Cas9 system. Nat. Protoc. 8, 2281-2308. 10.1038/nprot.2013.143 [DOI] [PMC free article] [PubMed] [Google Scholar]
- Reich M., Liefeld T., Gould J., Lerner J., Tamayo P. and Mesirov J. P. (2006). GenePattern 2.0. Nat. Genet. 38, 500-501. 10.1038/ng0506-500 [DOI] [PubMed] [Google Scholar]
- Relaix F., Rocancourt D., Mansouri A. and Buckingham M. (2005). A Pax3/Pax7-dependent population of skeletal muscle progenitor cells. Nature 435, 948-953. 10.1038/nature03594 [DOI] [PubMed] [Google Scholar]
- Rozkalne A., Adkin C., Meng J., Lapan A., Morgan J. E. and Gussoni E. (2014). Mouse regenerating myofibers detected as false-positive donor myofibers with anti-human spectrin. Hum. Gene. Ther. 25, 73-81. 10.1089/hum.2013.126 [DOI] [PMC free article] [PubMed] [Google Scholar]
- Sambasivan R. and Tajbakhsh S. (2007). Skeletal muscle stem cell birth and properties. Semin. Cell Dev. Biol. 18, 870-882. 10.1016/j.semcdb.2007.09.013 [DOI] [PubMed] [Google Scholar]
- Sampath S. C., Sampath S. C. and Millay D. P. (2018). Myoblast fusion confusion: the resolution begins. Skelet. Muscle 8, 3 10.1186/s13395-017-0149-3 [DOI] [PMC free article] [PubMed] [Google Scholar]
- Satija R., Farrell J. A., Gennert D., Schier A. F. and Regev A. (2015). Spatial reconstruction of single-cell gene expression data. Nat. Biotechnol. 33, 495-502. 10.1038/nbt.3192 [DOI] [PMC free article] [PubMed] [Google Scholar]
- Schienda J., Engleka K. A., Jun S., Hansen M. S., Epstein J. A., Tabin C. J., Kunkel L. M. and Kardon G. (2006). Somitic origin of limb muscle satellite and side population cells. Proc. Natl. Acad. Sci. USA 103, 945-950. 10.1073/pnas.0510164103 [DOI] [PMC free article] [PubMed] [Google Scholar]
- Schindelin J., Arganda-Carreras I., Frise E., Kaynig V., Longair M., Pietzsch T., Preibisch S., Rueden C., Saalfeld S., Schmid B. et al. (2012). Fiji: an open-source platform for biological-image analysis. Nat. Methods 9, 676-682. 10.1038/nmeth.2019 [DOI] [PMC free article] [PubMed] [Google Scholar]
- Schmidt K., Glaser G., Wernig A., Wegner M. and Rosorius O. (2003). Sox8 is a specific marker for muscle satellite cells and inhibits myogenesis. J. Biol. Chem. 278, 29769-29775. 10.1074/jbc.M301539200 [DOI] [PubMed] [Google Scholar]
- Schuster-Gossler K., Cordes R. and Gossler A. (2007). Premature myogenic differentiation and depletion of progenitor cells cause severe muscle hypotrophy in Delta1 mutants. Proc. Natl. Acad. Sci. USA 104, 537-542. 10.1073/pnas.0608281104 [DOI] [PMC free article] [PubMed] [Google Scholar]
- Selvaraj S., Mondragon-Gonzalez R., Xu B., Magli A., Kim H., Lainé J., Kiley J., McKee H., Rinaldi F., Aho J. et al. (2019). Screening identifies small molecules that enhance the maturation of human pluripotent stem cell-derived myotubes. eLife 8, e47970 10.7554/elife.47970 [DOI] [PMC free article] [PubMed] [Google Scholar]
- Simionescu-Bankston A., Pichavant C., Canner J. P., Apponi L. H., Wang Y., Steeds C., Olthoff J. T., Belanto J. J., Ervasti J. M. and Pavlath G. K. (2015). Creatine kinase B is necessary to limit myoblast fusion during myogenesis. Am. J. Physiol. 308, C919-C931. 10.1152/ajpcell.00029.2015 [DOI] [PMC free article] [PubMed] [Google Scholar]
- Tassy O. and Pourquié O. (2014). Manteia, a predictive data mining system for vertebrate genes and its applications to human genetic diseases. Nucleic Acids Res. 42, D882-D891. 10.1093/nar/gkt807 [DOI] [PMC free article] [PubMed] [Google Scholar]
- Tierney M. T. and Sacco A. (2016). Satellite cell heterogeneity in skeletal muscle homeostasis. Trends Cell Biol. 26, 434-444. 10.1016/j.tcb.2016.02.004 [DOI] [PMC free article] [PubMed] [Google Scholar]
- Tierney M. T., Gromova A., Boscolo Sesillo F., Sala D., Spenlé C., Orend G. and Sacco A. (2016). Autonomous extracellular matrix remodeling controls a progressive adaptation in muscle stem cell regenerative capacity during development. Cell Rep. 14, 1940-1952. 10.1016/j.celrep.2016.01.072 [DOI] [PMC free article] [PubMed] [Google Scholar]
- White R. B., Biérinx A.-S., Gnocchi V. F. and Zammit P. S. (2010). Dynamics of muscle fibre growth during postnatal mouse development. BMC Dev. Biol. 10, 21 10.1186/1471-213X-10-21 [DOI] [PMC free article] [PubMed] [Google Scholar]
- Wolf F. A., Hamey F. K., Plass M., Solana J., Dahlin J. S., Göttgens B., Rajewsky N., Simon L. and Theis F. J. (2019). PAGA: graph abstraction reconciles clustering with trajectory inference through a topology preserving map of single cells. Genome Biol. 20, 59 10.1186/s13059-019-1663-x [DOI] [PMC free article] [PubMed] [Google Scholar]
- Wu J., Matthias N., Lo J., Ortiz-Vitali J. L., Shieh A. W., Wang S. H. and Darabi R. (2018). A myogenic double-reporter human pluripotent stem cell line allows prospective isolation of skeletal muscle progenitors. Cell Rep. 25, 1966-1981.e4. 10.1016/j.celrep.2018.10.067 [DOI] [PMC free article] [PubMed] [Google Scholar]
- Xi H., Fujiwara W., Gonzalez K., Jan M., Liebscher S., Van Handel B., Schenke-Layland K. and Pyle A. D. (2017). In vivo human somitogenesis guides somite development from hPSCs. Cell Rep. 18, 1573-1585. 10.1016/j.celrep.2017.01.040 [DOI] [PMC free article] [PubMed] [Google Scholar]
- Xu X., Wilschut K. J., Kouklis G., Tian H., Hesse R., Garland C., Sbitany H., Hansen S., Seth R., Knott P. D. et al. (2015). Human satellite cell transplantation and regeneration from diverse skeletal muscles. Stem Cell Rep. 5, 419-434. 10.1016/j.stemcr.2015.07.016 [DOI] [PMC free article] [PubMed] [Google Scholar]
- Zalc A., Hayashi S., Auradé F., Bröhl D., Chang T., Mademtzoglou D., Mourikis P., Yao Z., Cao Y., Birchmeier C. et al. (2014). Antagonistic regulation of p57kip2 by Hes/Hey downstream of Notch signaling and muscle regulatory factors regulates skeletal muscle growth arrest. Development 141, 2780-2790. 10.1242/dev.110155 [DOI] [PubMed] [Google Scholar]
- Zhang P., Wong C., Liu D., Finegold M., Harper J. W. and Elledge S. J. (1999). p21CIP1 and p57KIP2 control muscle differentiation at the myogenin step. Genes Dev. 13, 213-224. 10.1101/gad.13.2.213 [DOI] [PMC free article] [PubMed] [Google Scholar]
- Zilionis R., Nainys J., Veres A., Savova V., Zemmour D., Klein A. M. and Mazutis L. (2017). Single-cell barcoding and sequencing using droplet microfluidics. Nat. Protoc. 12, 44-73. 10.1038/nprot.2016.154 [DOI] [PubMed] [Google Scholar]
Associated Data
This section collects any data citations, data availability statements, or supplementary materials included in this article.