

Abstract
Introduction:
Sepsis is defined as a life-threatening organ dysfunction caused by a dysregulated host response to infection. Mortality rates are high, exceeding 50% in patients with septic shock. The sepsis severity score (SSS) was developed to determine the severity of sepsis and as a prognostic model. The aim of this study was to externally validate the SSS model.
Methods:
Calibration and discrimination of the SSS were retrospectively evaluated using data from a single-center sepsis registry.
Results:
Data from 156 septic patients were recorded; 56% of them had septic shock, 94% of patients required mechanical ventilation. The observed hospital mortality was 60.3%. The mean SSS value was 94.4 (95% CI 90.5–98.3). The SSS presented excellent discrimination with an area under the receiver operating characteristic curve (AUC) of 0.806 (95% CI 0.734–0.866). The pairwise comparison of APACHE II (AUC = 0.789; 95% CI 0.715–0.851) with SSS and 1st day SOFA (AUC = 0.75; 95% CI 0.673–0.817) with SSS revealed no significant differences in discrimination between the models. The calibration of the SSS was good with the Hosmer-Lemeshow goodness-of-fit H test 9.59, P > 0.05. Analyses of calibration curve show absence of accurate predictions in lower deciles of lower risk (2nd and 4th).
Conclusion:
The SSS demonstrated excellent discrimination. The calibration evaluation gave conflicting results; the H-L test result indicated a good calibration, while the visual analysis of the calibration curve suggested the opposite. The SSS requires further evaluation before it can be safely recommended as an outcome prediction model.
Keywords: humans, hospital mortality, prognosis, sepsis/mortality, survival analysis
Introduction
Sepsis and septic shock, which are the most severe manifestations of acute infection, present a major public health challenge. The exact global burden of sepsis is unknown. Worldwide hospital-treated sepsis incidence was recently estimated at 31.5 million cases annually. This estimation, performed by the World Health Organization, is significantly underestimated, since it is based on data from seven developed countries and 87% of the world population was not included in this estimation.1 However, regardless of the criteria used to identify sepsis from administrative data, various authors are reporting a rise in the incidence of sepsis.2–6 A second common pattern that has emerged from sepsis epidemiological research is that there has been an annual decrease in mortality.7–9 The absence of sepsis mortality data based on the Polish population makes benchmarking more difficult and hinders quality improvement. Lacking comparative data for observed hospital mortality, we decided to use a modern severity score to compare predicted outcomes with observed outcomes. This procedure, called external validation, could provide valuable results. If predictions based on the model are accurate, then the model’s prediction utility will be confirmed, while also confirming that severity-adjusted outcomes are similar to the outcomes that were observed in the dataset used to develop the severity score. This pragmatic way of obtaining benchmarking data has proven to be effective in view of the extreme variability in reported sepsis mortality.10–15 The sepsis severity score (SSS) was developed using an international database created over a 5-year observation period on 27,836 patients (2005–2009). The SSS consists of 34 strictly defined predictor variables that were chosen while developing the model.16 The aim of this study was to externally validate the SSS in a European intensive care unit.
Methods
The SSS was calculated retrospectively based on data prospectively entered into a sepsis registry database. The database contains the clinical and demographic data of patients treated in a 20-bed mixed intensive care unit which provides critical care service for the 1013-bed University Hospital in Wroclaw, Poland. When collecting data in the sepsis registry database, we used the SEPSIS-II definition, which was the most current at that time.17 After the publication of the SEPSIS-III criteria, we retrospectively applied the new definitions.18 In our database, all patients meeting the SEPSIS-II criteria also met the SEPSIS-III criteria (the minimum 1st-day SOFA score was 2 pts.). According to the SEPSIS-III definition, sepsis was defined as life-threatening organ dysfunction caused by a dysregulated host response to infection with a sequential organ failure assessment (SOFA) score of at least 2 pts. Septic shock was defined as sepsis with persistent hypotension requiring vasoactive agents to maintain a mean arterial pressure of at least 65 mmHg and having a serum lactate > 2 mmol/L. The study was approved by the local ethics committee from the Wroclaw Medical University, approval number KB 23/2015. The need for informed consent was waived because of the retrospective, observational nature of the study.
Inclusion criteria: all consecutive adult patients (over 18 years of age) diagnosed with sepsis were recorded in the sepsis registry database for the 12-month period from 1st of January to 31st of December 2014.
Exclusion criteria: patients who suffered from multiple sepsis episodes during a single ICU stay, had only the first episode analyzed in the study and data recorded for subsequent sepsis episodes were excluded from the final analysis.
All predictor variables required for the SSS calculation were available in the sepsis database or hospital medical records. All data necessary for the SSS calculations were available. The SSS was generated by summing the individual point values based on all patient clinical characteristics and whether patients had any goal-directed therapies. The SSS calculation formula from source publications with supplementary material was used.16,19 The SSS has not been previously validated or recalibrated for the Polish population. The SSS is calculated from 0 to 164 points; a higher score on the scale corresponds to a worse clinical condition of the patient.
In addition, variables for calculating the APACHE II and SOFA score were collected. The calculation was performed according to the original publications; there was no missing data for either score.20,21 APACHE II and SOFA scores have recently been externally validated in a single-center Polish study; recalibration was not performed.22 Preliminary data from the Silesian registry of intensive care units showed a standardized mortality ratio for APACHE II of 0.93. No formal discrimination or calibration test was presented.23 For the calculation of the SSS, APACHE II, and SOFA score the most abnormal values during the first 24h of ICU treatment were recorded. The type and number of organ dysfunctions were also registered. Organ dysfunction definitions provided by 2001 SCCM/ESICM/ACCP/ATS/SIS International Sepsis Definitions Conference were employed.17
Quantitative data were summarized as a mean with 95% confidence intervals. Qualitative data were summarized as a percentage distribution and count. The normality of distribution was evaluated with the Shapiro-Wilk test. As the distributions were not normal, non-parametric tests were used for analysis. Quantitative data were compared with the Mann–Whitney U test. Qualitative data were compared with cross-tabulation tables and the Chi-square or Fisher’s exact test when appropriate.24 The performance of severity scores was evaluated by two parameters: calibration and discrimination. Discrimination defines the score’s ability to distinguish between survivors and non-survivors. This parameter was evaluated with the area under the receiver operating characteristic curve (ROC), according to the method used by Hanley and McNeil.25 The discrimination of the model ranged from acceptable, if 0.7 ⩽ AUC < 0.8, excellent, if 0.8 ⩽ AUC < 0.9, to outstanding, if AUC ⩾ 0.9. Discrimination below the AUROC of 0.7 was not acceptable by the severity model authors.26,27 We hypothesized that, in terms of discrimination, the SSS would outperform the 1st day SOFA. Based on the AUROC values from studies by Khwannimit et al.28 (SSS AUROC 0.846) and Raith et al.29 (1st day SOFA AUROC 0.75), we predicted the difference in the AUROC at 0.096 in favor of the SSS. At 80% power and 5% type I error, the minimum of sample size was 156 cases.
The DeLong method was used to perform a pairwise comparison of the ROC curves.30 Calibration was referenced to the degree of agreement between the mortality predicted by the model and the observed mortality across all risk strata. The calibration was evaluated by the Hosmer-Lemeshow (H-L) goodness-of-fit test.31 The calibration curve for the SSS was created by comparing predicted mortality versus observed morality in 10% increments. Medcalc software was used for power calculation and Delong’s test calculation. Microsoft Excel was used for the Hosmer-Lemeshow test calculation and STATISTICA 12 (StatSoft, Inc.) was used to perform other statistical analyses.
Results
Detailed patient characteristics stratified by hospital outcome are presented in Table 1. Data from 156 septic patients were recorded in the sepsis registry for 12 months of observation. Among these patients, 62 survived and 94 died. The observed ICU mortality was 47.4% and the observed hospital mortality was 60.3%. Sepsis and septic shock were diagnosed in 69 (44%) and 87 (56%) cases, respectively. Pneumonia (49%) and intraabdominal infection (35%) were the two most frequent causes of sepsis and septic shock, followed by urinary tract infection (7%), intravascular catheter associated infections (2%), device associated infection (2%), and other infections (15%). Sources of ICU admissions were as follows: general wards (48%), operating theater (38%), Emergency Department (7%), transfer from other hospital (6%), and high dependency unit (1%). The clinical condition of the patients was already critical on admission to the ICU, with a mean value of the SOFA score of 11.9 points in non-survivors and 8.1 points in survivors. More than half the patients (51%) had failure of four or more organs during the first 24 h of the ICU stay. Hospital mortality in this subgroup was very high (81%). 20% of patients had three failing organs on admission and mortality in this subgroup was 50%. In the subgroup of patients with two failing organs (19%) the mortality rate was 31% and in patients with one failing organ 8%. The most common type of organ failure was respiratory (87%), followed by cardiovascular (86%), and then renal (57%), metabolic (38%), hematologic (26%), liver (22%), and CNS (23%). A majority of patients (94%) required mechanical ventilation. 89% of patients received vasopressor infusion, with noradrenalin being the most commonly used drug (88%); 29% of patients also received adrenaline infusion. Renal replacement therapy was utilized in 44% of patients. 51% of patients received low dose corticosteroids (up to 200 mg of hydrocortisone / 24 h, 50 mg bolus every 6 h). Blood products were given to 51% of patients.
Table 1.
Patient characteristics on admission to the ICU.
| Survivors (n = 62) | Non-survivors (n = 94) | p | |
|---|---|---|---|
| Age (years) | 62 (95% CI: 58–67) | 68 (95% CI: 65–71) | 0.03 |
| Sex (F/M) n (%) | 25 (40) / 37 (60) | 29 (31) / 65 (69) | 0.22 |
| Hospital stay (days) | 59 (95% CI: 48–69) | 27 (95% CI: 21–34) | < 0.001 |
| SSS (points) | 80.5 (95% CI: 74.9 – 86.1) | 103.7 (95% CI: 98.8 – 108.5) | < 0.001 |
| APACHE II (points) | 16.5 (95% CI: 14.9–18) | 25.9 (95% CI: 23.2–26.6) | < 0.001 |
| 1st day SOFA (points) | 8.1 (95% CI: 7,2 – 9) | 11.9 (95% CI: 11 – 12,8) | < 0.001 |
| Number of organ dysfunction n (%) | |||
| 1 | 10 (16.1) | 2 (2.1) | 0.001 |
| 2 | 20 (32.3) | 9 (9.6) | < 0.001 |
| 3 | 16 (25.8) | 16 (17) | 0.18 |
| 4 or more | 15 (24.2) | 64 (68) | < 0.001 |
| Type of organ dysfunction n (%) | |||
| Cardiovascular | 50 (80.6) | 84 (89.4) | 0.05 |
| Respiratory | 51 (82.2) | 84 (89.4) | 0.09 |
| Hematology | 13 (21) | 27 (28.7) | < 0.001 |
| Renal | 24 (38.7) | 65 (69.1) | < 0.001 |
| Hepatic | 8 (12.9) | 26 (27.6) | 0.03 |
| Metabolic | 11 (17.7) | 51 (54.3) | < 0.001 |
| CNS | 6 (9.7) | 29 (30.9) | 0.002 |
| Type of admission to the ICU n (%) | |||
| Surgical | 28 (45) | 48 (51) | 0.29 |
| Medical | 29 (47) | 43 (46) | 0.51 |
| Treatment, n (%) | |||
| IV fluid resuscitation | 44 (73) | 83 (89) | 0.01 |
| Mechanical ventilation | 56 (90) | 92 (98) | 0.06 |
| Renal replacement therapy | 16 (26) | 52 (55) | 0.003 |
| Vasopressor infusion | 51 (82) | 88 (94) | 0.06 |
| Nutrition, n (%) | |||
| Enteral | 31 (50) | 31 (33) | 0.03 |
| Parenteral | 26 (42) | 24 (26) | 0.03 |
| Heparin LMW, n (%) | 53 (85) | 42 (45) | < 0.001 |
| Heparin unfractioned, n (%) | 16 (26) | 35 (37) | 0.17 |
| Blood products, n (%) PBC | 22 (36) | 36 (38) | 0.43 |
| FFP | 22 (36) | 37 (39) | 0.75 |
| Platelet | 9 (15) | 10 (11) | 0.31 |
| Surgery during ICU stay, n (%) | 22 (36) | 28 (30) | 0.29 |
SSS: sepsis severity score; SOFA: sequential organ failure assessment; PBC: packed blood cells; FFP: fresh frozen plasma; LMW: low-molecular weight.
The SSS was calculated based on data from 156 patients and the usefulness of the score for predicting mortality was evaluated based on the whole group. The mean SSS was 94.4 (95% CI 90.5–98.3), the mean 1st day SOFA was 10.4 (95% CI 9.7–11.1), the mean APACHE II was 21.5 (95% CI 20.1–22.8). The detailed group characteristics using the SSS variables are presented in Table 2. The mean SSS value in survivors was 80.5 points and was significantly lower (p < .001) than in non-survivors (103 points). The group was uniform in terms of geographical region, and all patients came from Europe. Factors present more frequently in the group of non-survivors were dysfunction of the cardiovascular system, unresponsive hypotension, and impaired organ perfusion, indicated by an elevation in the lactate level.
Table 2.
Sepsis severity score parameters by hospital outcome.
| Parameter | Survivors (n = 62), n (%) | Non-survivors (n = 94), n (%) | p |
|---|---|---|---|
| Sepsis origin | |||
| Emergency Department | 5 (8) | 6 (6) | 0.76 |
| Ward | 55 (89) | 88 (94) | 0.376 |
| ICU | 2 (1) | 0 | 0.276 |
| Geographic region | |||
| Europe | 62 (100) | 94 (100) | |
| North America | 0 | 0 | |
| South America | 0 | 0 | |
| Cardiovascular OF | 50 (81) | 89 (95) | 0.007 |
| Lactate > 4 mmol/L | 11 (18) | 64 (68) | < 0.001 |
| No hypotension | 12 (19) | 6 (6) | 0.02 |
| Unresponsive hypotension | 41 (66) | 83 (88) | < 0.001 |
| Responsive hypotension | 9 (15) | 5 (5) | 0.049 |
| Received ⩾ 20 ml/kg crystalloid or equivalent | 40 (65) | 79 (84) | 0.005 |
| Received vasopressors | 82 (51) | 88 (94) | 0.026 |
| Pneumonia | 29 (47) | 48 (51) | 0.599 |
| Urinary tract infection | 6 (10) | 5 (5) | 0.298 |
| Abdominal | 21 (34) | 34 (36) | 0.769 |
| Meningitis | 0 | 2 (2) | 0.248 |
| Catheter | 2 (1) | 2 (2) | 0.65 |
| Device | 2 (1) | 1 (1) | 0.563 |
| Other infection | 6 (10) | 17 (18) | 0.147 |
| Renal OF | 22 (36) | 70 (75) | < 0.001 |
| Hepatic OF | 17 (27) | 32 (34) | 0.383 |
| Hematologic OF | 13 (21) | 38 (40) | 0.011 |
| No MV and no pulmonary OF | 1 (2) | 0 | 0.397 |
| No MV and pulmonary OF | 5 (8) | 2 (2) | 0.115 |
| MV with plateau pressure < 30 cm H2O and no pulmonary OF |
14 (23) | 11 (12) | 0.078 |
| MV with plateau pressure < 30 cm H2O and pulmonary OF |
41 (66) | 74 (79) | 0.08 |
| MV with plateau pressure ⩾ 30 cm H2O independent of pulmonary OF |
1 (2) | 7 (7) | 0.146 |
| Hyperthermia (> 38.3°C) | 13 (21) | 22 (24) | 0.721 |
| Hypothermia (< 36°C) | 2 (3) | 18 (19) | 0.003 |
| Chills with rigor | 1 (2) | 2 (2) | 1.00 |
| Tachypnea (beats/min > 20) | 16 (26) | 32 (34) | 0.275 |
| Leukopenia (WBC count < 4,000/μL) | 5 (8) | 9 (10) | 0.747 |
| Hyperglycemia (plasma glucose > 120 mg/dL) | 50 (81) | 80 (85) | 0.464 |
| Acutely alter mental status | 6 (10) | 29 (31) | 0.002 |
The discrimination of the score’s ability to distinguish between survivors and non-survivors was evaluated with the area under the ROC curve. Using the DeLong method, a pairwise comparison of the ROC curves was performed. There was no significant difference in predictive validity between the SSS (AUROC = 0.806; 95% CI, 0.734–0.866) and the 1st day SOFA (AUROC = 0.750; 95% CI, 0.673–0.817) with a difference in the AUROC of 0.056 (95% CI, –0.019–0.131, P = 0.142). There was also no difference in predictive validity between the SSS and APACHE II (AUROC = 0.789; 95% CI, 0.715–0.851) with the difference in the AUROC of 0.017 (95% CI, –0.055–0.09, P = 0.641). ROC curves for prediction of the likelihood of death in patients with sepsis and septic shock are presented in Figure 1 and the cut-off points are presented in Table 3. The Hosmer-Lemeshow H-L statistic was 9.59, with a P value greater than 0.05 (P = 0.29). A calibration curve was also created (Figure 2).
Figure 1.
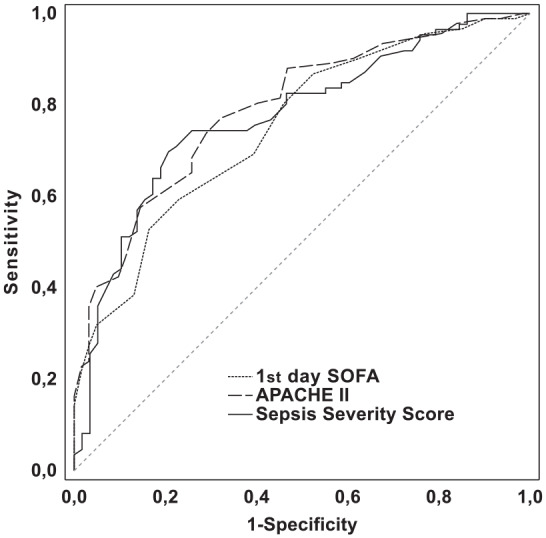
Receiver operating characteristic curves for prediction of the likelihood of death in patients with sepsis and septic shock. Sepsis severity score, APACHE II score, and 1st day SOFA score had areas under the ROC curve of 0.8060, 0.789, and 0.750, respectively.
Table 3.
SSS, APACHE II, and 1st day SOFA discrimination for hospital mortality.
| Cut-off point | Sensitivity | Specificity | PPV | NPV | AUC ± SE (95% CI) | |
|---|---|---|---|---|---|---|
| SSS | 93 | 0.698 | 0.793 | 0.833 | 0.639 | 0.806 ± 0.036 (0.734–0.866) |
| APACHE II | 19 | 0.772 | 0.677 | 0.780 | 0.677 | 0.789 ± 0.036 (0.715–0.851) |
| 1st day SOFA | 11 | 0.593 | 0.770 | 0.794 | 0.560 | 0.750 ± 0.039 (0.673–0.817) |
Figure 2.

The SSS calibration curve. The comparison of observed versus predicted mortality in the deciles of predicted mortality.
Discussion
To our knowledge, this study is the first external validation of the SSS for predicting hospital mortality in septic patients performed in a European ICU. Visual analysis of the calibration curve (Figure 2) might suggest an absence of accurate predictions in the 3rd and 4th risk deciles. However, the number of patients in these deciles was low, that is, 7 and 6 respectively. An analysis of the results in the 5th, 6th, 7th, and 9th risk deciles, with a much higher number of patients, showed more accurate predictions. These findings were difficult to interpret, because calibration curve analyses are not accompanied by any information of statistical significance; this is an intrinsic drawback of calibration curve analysis.32 Therefore, we performed the Hosmer-Lemeshow test, which showed that in our group of patients the difference in predicted and observed mortality was not statistically significant across 10 risk groups. The obtained H-L test result indicated good calibration of the SSS model in the studied population. There are, however, serious limitations to this conclusion. First, the H-L test tends to confirm good calibration in a small sample size. Second, all validation tests are sensitive to sample size, which was confirmed using a random sampling procedure from a large Dutch ICU database.33 Therefore, our result should be interpreted with caution and as an argument for further evaluation of the SSS model, not as a definitive confirmation of good calibration.
The discrimination of the SSS model, assessed by the area under the ROC curve, was above 0.8, which is considered excellent. The 1st day SOFA showed lower discrimination compared to the SSS model, but the difference was not significant. The SOFA score is considered to be a good tool for monitoring a patient’s clinical condition in sepsis; however, there is no clear consensus on how to use SOFA for predicting mortality. Admission SOFA, maximal SOFA, mean SOFA, delta SOFA, and other solutions have been studied, but no clear recommendations have been made yet.34 Therefore, we believe that, if our results are reproducible, the SSS model could be applied to patients with sepsis and septic shock.
In our study, the APACHE II based model presented with discrimination, slightly lower than the SSS. The extensive use of the APACHE II scale by ICU researchers makes it possible to compare the severity of the clinical status of patients reported for large, multicentre studies with local data and single-center studies. However, due to differences in the case-mix, the APACHE II score has lost its ability to accurately predict mortality in the modern ICU setting.35–38 As demonstrated for other general severity scores, a first-level recalibration could be the solution to this issue.39,40 Employing severity scores designed specifically for sepsis patients was suggested as another solution to predict outcome in a narrow group of patients.16,41 In this study, we evaluated a second solution using the SSS.
Predicting mortality risk in ICU patients has numerous applications. It is an essential part of quality benchmarking. Risk-adjusted mortality is the most commonly used ICU quality-of-care indicator utilized by quality improvement initiatives in many European countries such as Austria, the Netherlands, Scotland, Sweden, and the United Kingdom. Mortality risk assessment is also used in clinical trials for case-mix comparison and description. Predicting outcome is pragmatically used to allocate resources and assess individual ICU performance.42,43
The SSS was previously described by Osborne et al. as a severity model for predicting outcome in septic patients.16 The model in this study was based on the Surviving Sepsis Campaign database, containing records from 23,438 ICU patients from Europe, North America, and South America. The model was developed based on 90% of the dataset (n = 21085, random sample). The final model was comprised of 34 categorical variables. The validation group included data from the remaining 10% of cases. The reported AUC value was 0.701 in the validation group and 0.736 in the development group and the calibration was determined to be “good” (H-L goodness-of-fit, P = .58).
Recently, Khwannimit et al. published results of a study comparing the performance of the SSS with the APACHE II-IV, Simplified Acute Physiology Score 2 (SAPS 2), and SAPS 3 scores for predicting hospital outcome in septic patients. It was a retrospective analysis of the performance of the SSS, using a dataset collected prospectively from an Asian ICU population between 2011 and 2015. The database contained the characteristics of 913 medical patients more than 15 years old with sepsis or septic shock. Sepsis and septic shock were defined following the criteria of the Third International Consensus Definitions for sepsis and septic shock (Sepsis-3). The reported hospital mortality was 43.9% and the mean SSS value was 82 points. Calibration of the model was evaluated with the Hosmer-Lemeshow goodness-of-fit H test and all analyzed scores (SSS, APACHE II-IV, SAPS 2, SAPS 3) failed to accurately predict mortality risk, with the P value for H-L < 0.001 for all tested scores. However, the SSS was able to correctly predict mortality in the subgroup of patients with severe sepsis (P value for H-L test = 0.1); Sepsis-2 criteria were employed to select this subgroup.17 This result might suggest that the failure to predict mortality with the SSS in Khwannimit’s study could be linked to differences in the sepsis criteria. The Sepsis-2 criteria were used by Osborn in the first SSS development dataset and Khwannimit used Sepsis-3 criteria to externally validate the model. Differences in datasets are also visible, as the SSS lacks a point value for Asia as a geographic region. This precluded the use of some SSS variables in the Khwannimit’s study and could have influenced the analysis of calibration and discrimination.28
The performance of the SSS was also evaluated in a cohort of patients presented to the Emergency Department who were presumed to have an infection. To predict mortality, Williams et al. used models based on the APACHE II and SAPS II scores and compared them with the SSS based model.44 The discrimination of the SSS based model, reported by the authors, was good (AUC = 0.82), but the calibration of the SSS model was poor. There might be two reasons for the poor calibration result. Williams et al. enrolled 8871 emergency patients, but only 15% (1325 patients) were diagnosed with severe sepsis or septic shock. It should be noted that this discrepancy between the number of patients enrolled and the number of those diagnosed with severe sepsis or septic shock was significant in Williams’s study. For comparison, the SSS was first developed using a large cohort (n = 23,438) who were all diagnosed with severe sepsis or septic shock. A second disparity in Williams’s study was related to the applied endpoint. The SSS was originally developed to predict hospital mortality, while Williams used 30-day mortality as the endpoint. The differences in group characteristics and endpoints were probably responsible for the poor calibration of the SSS model in Williams et al.44
The high hospital mortality observed in our study (60.3%) is in contrast to the mortality results reported in some sepsis studies. Recently, researchers involved in the ANDROMEDA-SHOCK trial reported hospital mortality of 34.9% in the septic shock group.45 Mortality in the ADRENAL trial was similarly low; the 90-day survival rate in septic shock patients that received 200 mg of hydrocortisone was 62.1%.46 In another study, Annane et al.47 reported a 90-day mortality of septic shock patients who had received hydrocortisone and fludrocortisone of 43%. However, the inclusion and exclusion criteria used in these randomized clinical trials were different, and for this reason the mortality rates cannot be compared with a registry-based observation. For example, a nationwide registry database collected in Germany allowed for a more pragmatic comparison.48 In this database, the hospital mortality of patients diagnosed with septic shock was 57% in 2014 and was comparable to the results obtained in our study. The use of the SSS allowed us to compare the severity of the clinical condition of patients in this study population with the cohort assessed for the development of the SSS model. In an international cohort used by Osborn et al., the mean SSS was 56.3 points. The mean SSS observed in our study was much higher and amounted to 94.4 points (95% CI 90.5–98.3), indicating a significantly worse clinical condition of patients at the time of ICU admission. The high percentage of patients admitted with septic shock (56%) also reflected the serious clinical condition of the patients. However, the data obtained do not give a clear explanation as to why such a high mortality was observed. Recently, Weigl et al.,49 after analyzing the national Polish ICU outcome database, reported a high observed ICU mortality of 43.5%. Grochla et al.50 hypothesized an explanation that the absence of clear futile therapy legislation, the unpopularity of advanced directives, the insufficiency of rapid response team implementation, the fear of legal consequences in cases of refusing ICU admission, the extreme pressure on ICU admissions due to the poor development of intermediate care, and the lack of funding for patients with a lower TISS-28 score (< 19 pts.) are responsible for this high mortality rate. In our opinion, those factors were, to varying degrees, responsible for the high hospital mortality also observed in this study.
There are limitations of our study. This is a single-center observation, with a small sample size, in a hospital with a relatively low availability of ICU beds. The type of admission (usually the transfer of a patient from another hospital ward), ICU discharge criteria, case-mix, and the standard of care may be different than in better financed healthcare systems. The excellent discrimination obtained in our study was similar to that obtained in other SSS external validation studies.51,28 The calibration evaluation gave conflicting results; the H-L test result indicated a good calibration, while the visual analysis of the calibration curve suggested the opposite. Therefore, we cannot definitely conclude that the model has been adequately calibrated. Our observation is in line with the consensus that the performance of severity scores in predicting the outcome is poor outside of the cohort used for the development of the model.52,53 Our findings could also be affected by the susceptibility of the Hosmer-Lemeshow test to confirm good calibration for smaller sample sizes.54 Therefore, our result should be interpreted with caution and as an argument for further evaluation of the SSS model, not as a definitive confirmation of good calibration.
Conclusion
The SSS demonstrated excellent discrimination. Calibration examination results were conflicting, with HL-test confirming good calibration and calibration curve analysis suggesting the opposite. The SSS requires further evaluation, before it can be safely recommended as an outcome of prediction model.
Footnotes
Declaration of conflicting interests: The author(s) declared no potential conflicts of interest with respect to the research, authorship, and/or publication of this article.
Ethical approval: Ethical approval for this study was obtained from Bioethics Committee, Wrocław Medical University, Approval id: KB 23/2015
Funding: The author(s) disclosed receipt of the following financial support for the research, authorship, and/or publication of this article: The authors received funding support from Medical University Piastów Slaskich in Wroclaw (Grant id PBmn.149).
Informed consent: The need for informed consent was waived because of the retrospective, observational retrospective nature of the study.
ORCID iD: Marek Wełna  https://orcid.org/0000-0002-2778-1092
References
- 1. Fleischmann C, Scherag A, Adhikari NKJ, et al. (2016) Assessment of global incidence and mortality of hospital-treated sepsis. Current Estimates and Limitations. The American Journal of Respiratory and Critical Care Medicine 193: 259–272. [DOI] [PubMed] [Google Scholar]
- 2. Dombrovskiy VY, Martin AA, Sunderram J, et al. (2005) Facing the challenge: Decreasing case fatality rates in severe sepsis despite increasing hospitalizations. Critical Care Medicine 33(11): 2555–2562. [DOI] [PubMed] [Google Scholar]
- 3. Melamed A, Sorvillo FJ. (2009) The burden of sepsis-associated mortality in the United States from1999 to 2005: An analysis of multiple-cause data. Critical Care 13: R28. [DOI] [PMC free article] [PubMed] [Google Scholar]
- 4. Martin GS, Mannino DM, Eaton S, et al. (2003) The epidemiology of sepsis in the United States from 1979 through 2000. The New England Journal of Medicine 348: 1546–1554. [DOI] [PubMed] [Google Scholar]
- 5. Stoller J, Halpin L, Weis M, et al. (2016) Epidemiology of severe sepsis: 2008-2012. Journal of Critical Care 31(1): 58–62. [DOI] [PubMed] [Google Scholar]
- 6. Bouza C, López-Cuadrado T, Saz-Parkinson Z, et al. (2014) Epidemiology and recent trends of severe sepsis in Spain: A nationwide population-based analysis (2006-2011). BMC Infectious Diseases 14(1):717. [DOI] [PMC free article] [PubMed] [Google Scholar]
- 7. Stevenson EK, Rubenstein AR, Radin GT, et al. (2014) Two decades of mortality trends among patients with severe sepsis: A comparative meta-analysis*. Critical Care Medicine 42(3): 625–631. [DOI] [PMC free article] [PubMed] [Google Scholar]
- 8. Kaukonen K-M, Bailey M, Suzuki S, et al. (2014) Mortality related to severe sepsis and septic shock among critically Ill patients in Australia and New Zealand, 2000-2012. JAMA The Journal of the American Medical Association 311: 1308. [DOI] [PubMed] [Google Scholar]
- 9. Fleischmann C, Thomas– Rueddel DO, Hartmann M, et al. (2016) Hospital Incidence and Mortality Rates of Sepsis: An Analysis of Hospital Episode (DRG) Statistics in Germany From 2007 to 2013. Deutsches Arzteblatt International 113: 159–166. [DOI] [PMC free article] [PubMed] [Google Scholar]
- 10. Kübler A, Adamik B, Durek G, et al. (2015) Results of the severe sepsis registry in intensive care units in Poland from 2003−2009. Anaesthesiology Intensive Therapy 47(1): 7–13. [DOI] [PubMed] [Google Scholar]
- 11. Beale R, Reinhart K, Brunkhorst FM, et al. (2009) Promoting global research excellence in severe sepsis (PROGRESS): Lessons from an international sepsis registry. Infection 37(3): 222–232. [DOI] [PubMed] [Google Scholar]
- 12. Ullah AR, Hussain A, Ali I, et al. (2016) A prospective observational study assessing the outcome of sepsis in intensive care unit of a tertiary care hospital, Peshawar. Pakistan Journal of Medical Sciences 32(3): 688–693. [DOI] [PMC free article] [PubMed] [Google Scholar]
- 13. Quintano Neira RA, Hamacher S, Japiassú AM. (2018) Epidemiology of sepsis in Brazil: Incidence, lethality, costs, and other indicators for Brazilian unified health system hospitalizations from 2006 to 2015. PLoS One 13: e0195873. [DOI] [PMC free article] [PubMed] [Google Scholar]
- 14. Rodriguez F, Barrera L, De La Rosa G, et al. (2011) The epidemiology of sepsis in Colombia: A prospective multicenter cohort study in ten university hospitals*. Critical Care Medicine 39(7): 1675–1682. [DOI] [PubMed] [Google Scholar]
- 15. Kübler A, Adamik B, Ciszewicz-Adamiczka B, et al. (2015) Ciężka sepsa na oddziałach intensywnej terapii w Polsce — badanie chorobowości punktowej w latach 2012 i 2013. Anestezjologia Intensywna Terapia 47: 315–319.26401737 [Google Scholar]
- 16. Osborn TM, Phillips G, Lemeshow S, et al. (2014) Sepsis severity score: An internationally derived scoring system from the surviving sepsis campaign database*. Critical Care Medicine 42(9): 1969–1976. [DOI] [PubMed] [Google Scholar]
- 17. Levy MM, Fink MP, Marshall JC, et al. (2003) 2001 SCCM/ESICM/ACCP/ATS/SIS international sepsis definitions conference. Critical Care Medicine 31: 1250–1256. [DOI] [PubMed] [Google Scholar]
- 18. Singer M, Deutschman CS, Seymour CW, et al. (2016) The third international consensus definitions for sepsis and septic shock (Sepsis-3). JAMA The Journal of the American Medical Association 315: 801–810. [DOI] [PMC free article] [PubMed] [Google Scholar]
- 19. http://links.lww.com/CCM/A970
- 20. Knaus WA, Draper EA, Wagner DP, et al. (1985) APACHE II: A severity of disease classification system. Critical Care Medicine 13: 818–829. [PubMed] [Google Scholar]
- 21. Vincent J-L, Moreno R, Takala J, et al. (1996) The SOFA (Sepsis-related Organ Failure Assessment) score to describe organ dysfunction/failure. Intensive Care Medicine 22(7): 707–710. [DOI] [PubMed] [Google Scholar]
- 22. Kądziołka I, Świstek R, Borowska K, et al. (2019) Validation of APACHE II and SAPS II scales at the intensive care unit along with assessment of SOFA scale at the admission as an isolated risk of death predictor. Anaesthesiology Intensive Therapy 51(2): 107–111. [DOI] [PubMed] [Google Scholar]
- 23. Knapik P, Krzych ŁJ, Weigl W, et al. (2017) Mortality rate in polish intensive care units is lower than predicted according to the APACHE II scoring system. Intensive Care Medicine 43(11): 1745–1746. [DOI] [PMC free article] [PubMed] [Google Scholar]
- 24. Zhang Z. (2016) Univariate description and bivariate statistical inference: The first step delving into data. Annals of Translational Medicine 4(5): 91–91. [DOI] [PMC free article] [PubMed] [Google Scholar]
- 25. Hanley JA, McNeil BJ. (1982) The meaning and use of the area under a receiver operating characteristic (ROC) curve. Radiology 143(1): 29–36. [DOI] [PubMed] [Google Scholar]
- 26. Lemeshow S. (1994) Modeling the severity of illness of ICU patients: A systems update. JAMA The Journal of the American Medical Association 272: 1049. [PubMed] [Google Scholar]
- 27. Hosmer DW, Sturdivant RX, Lemeshow S. (2000) Assessing the fit of the model. In: Shewhart WA, Wilks SS. (eds) Applied logistic regression. Hoboken, NJ: John Wiley & Sons Inc, pp. 143–202. [Google Scholar]
- 28. Khwannimit B, Bhurayanontachai R, Vattanavanit V. (2017) Validation of the sepsis severity score compared with updated severity scores in predicting hospital mortality in sepsis patients. Shock (Augusta, Ga.) 47(6): 720–725. [DOI] [PubMed] [Google Scholar]
- 29. Raith EP, Udy AA, Bailey M, et al. (2017) Prognostic accuracy of the SOFA score, SIRS criteria, and qSOFA score for in-hospital mortality among adults with suspected infection admitted to the intensive care unit. JAMA The Journal of the American Medical Association 317: 290–300. [DOI] [PubMed] [Google Scholar]
- 30. DeLong ER, DeLong DM, Clarke-Pearson DL. (1988) Comparing the areas under two or more correlated receiver operating characteristic curves: A nonparametric approach. Biometrics 44: 837–845. [PubMed] [Google Scholar]
- 31. Hosmer DW, Lemesbow S. (1980) Goodness of fit tests for the multiple logistic regression model. Communications in Statistics—Theory and Methods 9: 1043–1069. [Google Scholar]
- 32. Finazzi S, Poole D, Luciani D, et al. (2011) Calibration belt for quality-of-care assessment based on dichotomous outcomes. PLoS One 6: e16110. [DOI] [PMC free article] [PubMed] [Google Scholar]
- 33. Peek N, Arts DGT, Bosman RJ, et al. (2007) External validation of prognostic models for critically ill patients required substantial sample sizes. Journal of Clinical Epidemiology 60(5): 491–501. [DOI] [PubMed] [Google Scholar]
- 34. Minne L, Abu-Hanna A, de Jonge E. (2009) Evaluation of SOFA-based models for predicting mortality in the ICU: A systematic review. Critical Care 12: R161. [DOI] [PMC free article] [PubMed] [Google Scholar]
- 35. Nouira S, Belghith M, Elatrous S, et al. (1998) Predictive value of severity scoring systems: Comparison of four models in Tunisian adult intensive care units. Critical Care Medicine 26(5): 852–859. [DOI] [PubMed] [Google Scholar]
- 36. Beck DH, Smith GB, Pappachan JV, et al. (2003) External validation of the SAPS II, APACHE II and APACHE III prognostic models in South England: A multicentre study. Intensive Care Medicine 29(2): 249–256. [DOI] [PubMed] [Google Scholar]
- 37. Sakr Y, Krauss C, Amaral ACKB, et al. (2008) Comparison of the performance of SAPS II, SAPS 3, APACHE II, and their customized prognostic models in a surgical intensive care unit. British Journal of Anaesthesia 101(6): 798–803. [DOI] [PubMed] [Google Scholar]
- 38. Moreno RP. (2008) Outcome prediction in intensive care: Why we need to reinvent the wheel. Current Opinion in Critical Care 14: 483–484. [DOI] [PubMed] [Google Scholar]
- 39. Metnitz B, Schaden E, Moreno R, et al. (2009) Austrian validation and customization of the SAPS 3 admission score. Intensive Care Medicine 35(4): 616–622. [DOI] [PubMed] [Google Scholar]
- 40. Kuzniewicz MW, Vasilevskis EE, Lane R, et al. (2008) Variation in ICU risk-adjusted mortality. Chest 133(6): 1319–1327. [DOI] [PubMed] [Google Scholar]
- 41. Phillips GS, Osborn TM, Terry KM, et al. (2018) The New York sepsis severity score: Development of a risk-adjusted severity model for sepsis. Critical Care Medicine 46(5): 674–683. [DOI] [PubMed] [Google Scholar]
- 42. Power GS, Harrison DA. (2014) Why try to predict ICU outcomes. Current Opinion in Critical Care 20(5): 544–549. [DOI] [PubMed] [Google Scholar]
- 43. Flaatten H. (2012) The present use of quality indicators in the intensive care unit: Quality indicators in the ICU. Acta Anaesthesiologica Scandinavica 56: 1078–1083. [DOI] [PubMed] [Google Scholar]
- 44. Williams JM, Greenslade JH, Chu K, et al. (2016) Severity scores in emergency department patients with presumed infection: A prospective validation study*. Critical Care Medicine 44(3): 539–547. [DOI] [PubMed] [Google Scholar]
- 45. Hernández G, Ospina-Tascón GA, Damiani LP, et al. (2019) Effect of a resuscitation strategy targeting peripheral perfusion status vs serum lactate levels on 28-day mortality among patients with septic shock: The ANDROMEDA-SHOCK randomized clinical trial. JAMA The Journal of the American Medical Association 321: 654. [DOI] [PMC free article] [PubMed] [Google Scholar]
- 46. Venkatesh B, Finfer S, Cohen J, et al. (2018) Adjunctive clucocorticoid therapy in patients with septic shock. The New England Journal of Medicine 378: 797–808. [DOI] [PubMed] [Google Scholar]
- 47. Annane D, Sébille V, Charpentier C, et al. (2002) Effect of treatment with low doses of hydrocortisone and fludrocortisone on mortality in patients with septic shock. JAMA The Journal of the American Medical Association 288: 862–871. [DOI] [PubMed] [Google Scholar]
- 48. Schwarzkopf D, Fleischmann-Struzek C, Rüddel H, et al. (2018) A risk-model for hospital mortality among patients with severe sepsis or septic shock based on German national administrative claims data. PLoS One 13: e0194371. [DOI] [PMC free article] [PubMed] [Google Scholar]
- 49. Weigl W, Adamski J, Goryński P, et al. (2018) ICU mortality and variables associated with ICU survival in Poland: A nationwide database study. European Journal of Anaesthesiology 35(12): 949–954. [DOI] [PubMed] [Google Scholar]
- 50. Grochla M, Saucha W, Ciesla D, et al. (2020) Readmissions to general ICUs in a geographic area of Poland are seemingly associated with better outcomes. International Journal of Environmental Research and Public Health 17: 565. [DOI] [PMC free article] [PubMed] [Google Scholar]
- 51. Sathaporn N, Khwannimit B. (2019) Validation the performance of New York sepsis severity score compared with sepsis severity score in predicting hospital mortality among sepsis patients. Journal of Critical Care 53: 155–161. [DOI] [PubMed] [Google Scholar]
- 52. Zimmerman JE, Kramer AA. (2014) A history of outcome prediction in the ICU. Current Opinion in Critical Care 20(5): 550–556. [DOI] [PubMed] [Google Scholar]
- 53. Harrison DA, Brady AR, Parry GJ, et al. (2006) Recalibration of risk prediction models in a large multicenter cohort of admissions to adult, general critical care units in the United Kingdom*. Critical Care Medicine 34(5): 1378–1388. [DOI] [PubMed] [Google Scholar]
- 54. Paul P, Pennell ML, Lemeshow S. (2013) Standardizing the power of the Hosmer-Lemeshow goodness of fit test in large data sets. Statistics in Medicine 32: 67–80. [DOI] [PubMed] [Google Scholar]