Abstract
Purpose:
Arterial stiffness has predictive value for cardiovascular disease (CVD). Local artery stiffness can provide insight on CVD pathology and may be useful for diagnosis and prognosis. However, current methods are invasive, require real-time expertise for measurement, or are limited by arterial region. 4D Flow MRI can non-invasively measure local stiffness by estimating local pulse wave velocity (PWV). This technique can be applied to vascular regions, previously accessible only by invasive stiffness measurement methods. MRI PWV data can also be analyzed post-exam. However, 4D Flow MRI requires validation before it is used in-vivo to measure local PWV.
Methods:
PWV, calculated from 4D Flow MRI and a benchtop experiment, was compared with Petersons Elastic Modulus (PEM) of in-vitro models. PEM was calculated using high-speed camera images and pressure transducers. Three transit-time algorithms were analyzed for PWV measurement accuracy and precision.
Results:
PWV from 4D Flow MRI and reference benchtop experiments show strong correlation with PEM (R2 = 0.99). The cross correlation transit-time algorithm is the most accurate for these in-vitro models (4%-7% difference between 4D Flow MRI and benchtop), and the point to point of 50% upstroke algorithm was the most precise (transit-time vs. distance data average R2 = 0.845, maximum benchtop SD = 0.77m/s).
Conclusion:
4D Flow MRI is a valid method for estimating local PWV in simple in-vitro models and is a feasible tool for clinical analysis. In addition, choice in transit-time algorithm depends on flow waveform shape. This study provides a validation for 4D Flow MRI local PWV measurement in simple models, but requires validation in more complex models before it is used in-vivo.
Keywords: local pulse wave velocity, 4D Flow MRI, arterial stiffness, validation
INTRODUCTION
Cardiovascular disease (CVD) is a leading cause of mortality worldwide and accounts for 37% of premature deaths[1,2]. Arterial stiffness shows independent predictive value for CVD when adjusted for classical risk factors, and can be estimated using pulse wave velocity (PWV)[3-5]. PWV is defined as the speed at which the pressure or flow wave in blood traverses the vasculature. The speed of this wave is an estimation of stiffness in the vessel in which it is traveling. Regional PWV is the measure of aortic stiffness over a certain arterial length, and is most commonly acquired using applanation tonometry between the carotid and femoral arteries[6]. Many longitudinal studies show regional PWV as an independent risk factor of fatal and non-fatal cardiovascular outcomes in populations with conditions such as hypertension, diabetes, and end-stage renal disease[7-9]. Although proven to have predictive value, carotid-femoral PWV averages the heterogeneous stiffness properties of arteries effected by aging and disease [10,11]. In addition, the carotid-femoral region contains both muscular and elastic arteries which stiffen due to different mechanisms and may be associated with different cardiovascular outcomes[3,12].
To account for the loss of information inherent to regional PWV, local artery stiffness can be quantified using various “single location” indices, where data is obtained at a single point along an artery. Local stiffness may provide more information on how CVD affects various arterial regions and may have predictive information for CVD in different populations[12-14]. Peterson’s Elastic Modulus (PEM), a common index of local stiffness, is the ratio of pulse pressure to relative change in lumen diameter, and is the inverse of the distensibility coefficient (DC)[3,15]. Pressure is acquired using applanation tonometry and diameter change is acquired using ultrasound or magnetic resonance imaging (MRI). PEM represents local stiffness of the artery as a whole, including pressure in the vessel, and is recommended for local stiffness measurement[3]. However, acquiring the PEM requires a high level of expertise. In addition, non-invasive measurements of PEM are limited to areas in which the local pulse pressure can be acquired with applanation tonometry[3,15]. Therefore, there exists a need for a simpler, versatile method for determining local artery stiffness.
4D Flow MRI has recently been investigated for its feasibility in estimating local stiffness by measuring local PWV[16-19]. Local PWV is the speed of the propagative wave through a very short segment in an artery, and represents the stiffness at that location [20]. This technique overcomes the regional limitations of PEM because it does not require a pressure measurement. It can, therefore, be applied to regions of vasculature where the local pressure cannot be measured, providing stiffness information that was previously only accessible with invasive methods. PWV from 4D Flow MRI can also be calculated post-exam, eliminating the need for an expert for real-time PWV or PEM measurement. With these strengths, 4D Flow MRI can be used in clinical and research scenarios to determine local stiffness and explore pathologies of CVD. However, before it is clinically accepted, 4D Flow MRI must be validated as a reliable tool to estimate local PWV accurately. Previous attempts at validating 4D Flow MRI rely on in-vivo experiments where PWV was not compared with local vessel stiffness or invasive standards of PWV measurement[16,18]. In-vitro validation provides a unique opportunity to compare 4D Flow MRI PWV with highly accurate local stiffness measurements, and invasive PWV measurements.
In this study, 4D Flow MRI is validated for local PWV estimation in simple in-vitro models by (1) correlating 4D Flow MRI PWV to PEM and (2) comparing 4D Flow MRI PWV with an invasive reference PWV measured using a benchtop experiment. Although there are various indices that can be used to measure stiffness, PEM was used for comparison because it represents local artery stiffness as a whole, rather than just the elastic properties of the tube material[3]. In addition, the transit-time algorithm, which is not an inherent advantage of 4D Flow MRI, is analyzed for its effect on PWV. In-vitro validation is a necessary first step towards in-vivo implementation due to availability and control of experimental parameters. This study provides a basis and framework for validation of 4D Flow MRI for PWV estimation in anatomical in-vitro models and in-vivo blood vessels.
METHODS
In-Vitro Models
Four distensible tubes of varying stiffness were used for validation of 4D Flow MRI for local PWV calculation, as described in Table 1 (a 0.5 inch (12.7 mm) latex tube (Kent Elastomer Products, OH), a 0.625 inch (15.9 mm) penrose latex tube (Kent Elastomer Products, OH), a 0.75 inch (19.1 mm) tygon tube (MSC Industrial Supply, MO) and a 0.75 inch (19.1 mm) silicone tube (MSC Industrial Supply, MO)), based on previously reported studies where tygon, latex and silicone were considered for their similarity to stiffness of arterial segments [21]. In addition, MRI-based PWV studies have used latex tubing [22]. These tubes are uniform in dimension and material properties and should theoretically exhibit a constant PWV, allowing for accurate comparison between experimental methods.
Table 1.
Model Specifications
| Model | Material | Inner Diameter (mm) | Thickness (mm) |
|---|---|---|---|
| 1 | Latex | 15.90 | 0.30 |
| 2 | Latex | 12.70 | 0.30 |
| 3 | Tygon | 19.10 | 3.20 |
| 4 | Silicone | 19.10 | 3.20 |
PWV Transit-Time Algorithms
PWV calculations from both benchtop and MRI experiments were performed in Matlab (Mathworks, MA). Different values of PWV were calculated based on (a) cross correlation (XCOR [23]), (b) point to point of 50% upstroke (TTM [23]) and (c) intersecting tangent (TTF [24]) algorithms (Figure 1). Transit time differences have been found to significantly effect PWV values [25]. XCOR and TTF methods were selected due to their demonstrated stability in previous studies [17]. The TTM method was selected based on the initial quality of PWV results. In all three methods, flow waveforms were normalized by converting flow to intensity values between 0 and 1, where 0 represents minimum flow and 1 represents maximum flow. The XCOR algorithm estimates transit time by comparing the upstroke region of two normalized flow waveforms. Only the upstroke portion was used due to attenuation of flow amplitude. This technique shifts the distal upstroke waveform in time and calculates the cross correlation at each time shift. The transit-time is the time shift where the correlation is maximum. The TTM algorithm estimates transit-time by comparing the upstroke region of normalized flow, defined as a line fitted to data points between 20% and 80% of flow upstroke. The point of interest occurs when flow reaches 50% of its maximum during upstroke. The transit-time is the difference between the 50% upstroke for proximal and distal waveforms. The TTF algorithm computes the transit-time by taking the difference between the “foot” of proximal and distal normalized flow waveforms. The “foot” is defined as the intersection between a line fitted to data points between 20% and 80% of flow upstroke, and the minimum value of flow.
Fig. 1.
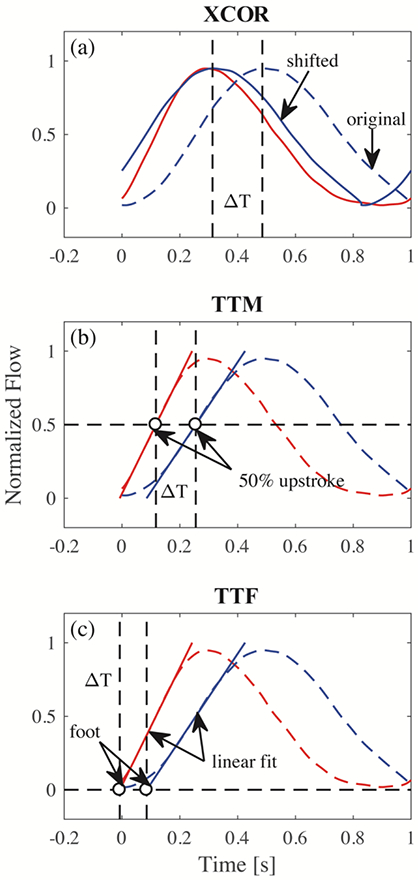
Three different transit-time algorithms for calculation of PWV. (a) XCOR transit-time is the difference between the original distal waveform and the shifted waveform; (b) TTM transit-time is the difference between 50% of the upstroke of proximal and distal waveforms; (c) TTF transit-time is the difference between the foot of proximal and distal waveforms
Optics Experiment for Wall Stiffness Calculation
PEM values were calculated for all four models using optical images from a high-speed camera. Each model was prepared by applying spray paint on the surface to enhance contrast for data acquisition. Figure 2 shows the experimental setup. Models were perfused with pulsatile flow using a positive displacement pump (PD-1100, BDC Laboratories, CO). A 1.5 L compliance chamber was placed at the pump outlet to adjust damping. A variable resistance valve was placed at the pump inlet to adjust the resistance of the system. Connected to the outlet of the compliance chamber were 25 ft of 0.75 inch PVC tubing (MSC Industrial Supply, MO), the in-vitro model test unit, and 25 ft of 0.75 inch PVC tubing connecting back to the pump. The in-vitro model test unit was comprised of 6 inch sections of 0.75 inch tygon tubing (MSC Industrial Supply, MO) connected to either end of the model with 0.75 inch coupler fittings. Tygon sections were required for the use of a clip-on transit time ultrasonic flow probe (16PXL, Transonic, NY), used in benchtop experiment data acquisitions. Wave reflections were minimized by the simplicity of the flow loop, with only the coupler fittings as flow junctions, and the pump inlet 25 ft from the model test unit. Single use luer-lock pressure transducers (PRESS-S-000, Pendotech, NJ) were connected in a T-fashion to both coupler fittings for pressure measurement. All components of the test unit were attached to an acrylic fixture that prevented fitting rotation during pumping. The pump was set to produce a 35% systole waveform at 60 BPM and 4 L/min. The pump piston displaces the fluid volume in the cylinder in 35% of the cycle period. These parameters are characteristic of physiological conditions. The compliance chamber and resistance valve were adjusted so the pressure immediately upstream of the model had a mean value of 70 mm Hg and amplitude of 80 mm Hg. These values were defined by analyzing the lowest standard deviation of PWV at different pump settings. Pressure data, before and after the model, were acquired during two cycles for quantification of pressures at peak systole and diastole (Figure 3D). The pressure pulse for PEM calculation was taken as the average of proximal and distal pulses. The in-vitro model test unit was fixed to a rigid structure and illuminated with LED lights. A high speed camera (Phantom v341, Vision Research, NJ), equipped with 60 mm f/2.8D lenses (Nikon Inc., NY), was used to image each model for two cycles at 200 Hz for a total of 400 images. Data gathered from image acquisition was exported to strain analysis software (StrainMaster, Lavision, MI) for quantification of diastolic and systolic diameters.
Fig. 2.
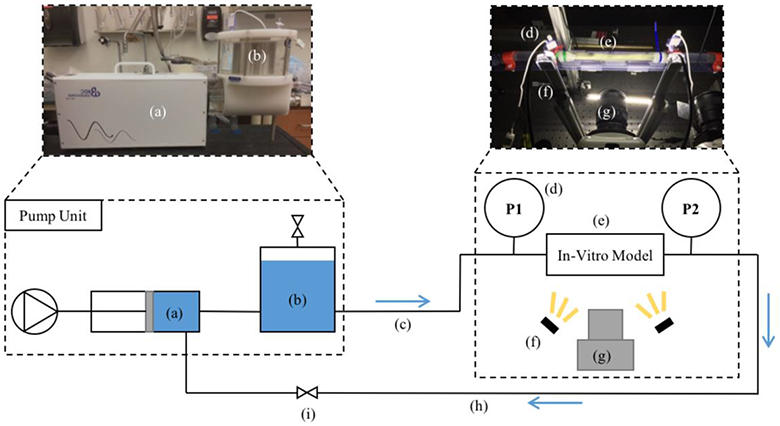
Optics experimental setup. (a) Pulsatile pump; (b) 1.5 L compliance chamber; (c) 25 ft PVC tubing; (d) luer-lock pressure transducer; (e) in-vitro model; (f) LED illumination; (g) high speed camera; (h) 25 ft PVC tubing; (i) resistance valve
Fig. 3.
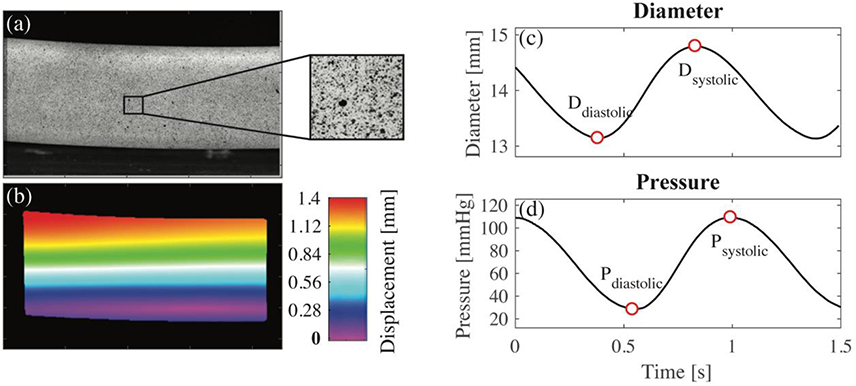
(a) High resolution image showing the surface of the model; (b) displacement color map obtained from virtual comparison of subsequent images; (c) systolic and diastolic diameter determined from minimum and maximum wall displacement with respect to time; (d) systolic and diastolic pressure, measured experimentally, with respect to time
Two-dimensional (2D) deformation for a 50-mm section of tubing was calculated using strain analysis software (StrainMaster, Lavision, MI). In this program, surface images (Figure 3a) acquired by the high-speed camera are discretized into small cells with distinct patterns. The software creates a displacement field by measuring the displacement and deformation of each cell (Figure 3b). A computer-generated line is manually placed along the diameter of each model in the first recorded image. A virtual strain gauge was used to automatically quantify the change in length of this line for each subsequent image. It was assumed that the thickness of the tubes was constant. The minimum line length was exported as the outer diastolic diameter and the maximum line length was exported as the outer systolic diameter (Figure 3c). The inner diameter was determined by subtracting two times the thickness from the outer diameter measurements. PEM, introduced by Peterson et al. [26], was calculated from the diastolic and systolic inner diameters and pressures (Figure 3d). This index, shown in equation 1, is proposed to determine the local stiffness of an artery as a whole [27]. Ds and Dd are the systolic and diastolic inner diameters, respectively. Ps and Pd are the systolic and diastolic pressures, respectively. The experiment was performed twice to ensure repeatability.
| (Eq. 1) |
Benchtop Experimental Determination of PWV
PWV was calculated in each model using data acquired from a benchtop experiment (Figure 4). The pump, tubing length, in-vitro model test unit, and fittings were configured exactly as they were during the optics experiment. The compliance chamber and resistance valve were also adjusted in the same manner. Flow was acquired using a clip-on transit time ultrasonic flow probe (16PXL, Transonic, NY) attached to the 6-inch tygon tubing connected to the model. Measurements were performed at both ends of the tube separately and included ECG signal data for flow alignment. The ECG was generated by the PD-1100 pump system and was in sync with the piston movement. Data was acquired for 14 cycles and imported to Matlab for PWV calculation.
Fig. 4.
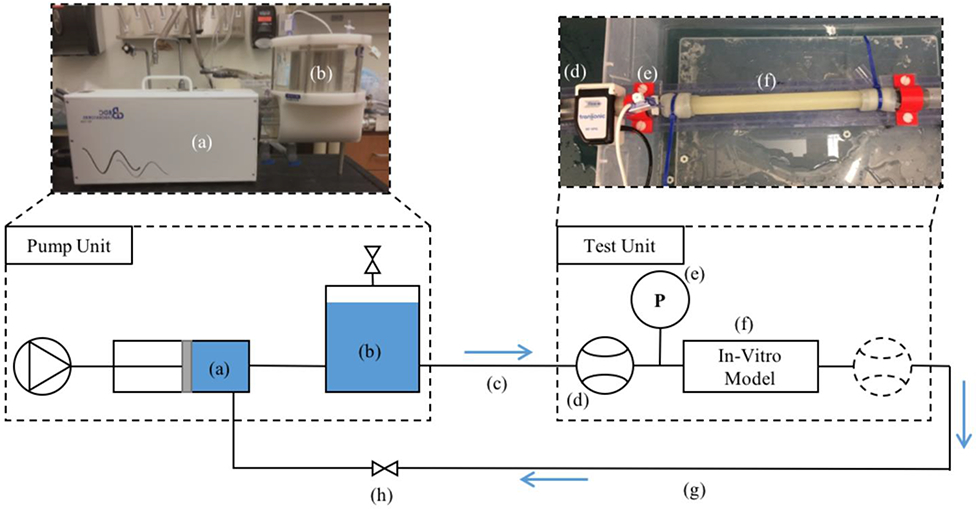
Schematic of bench top experimental setup. (a) Pulsatile pump; (b) 1.5 L compliance chamber; (c) 25 ft of PVC tubing; (d) PXL16 transit time ultrasonic flow probe; (e) luer-lock pressure transducer; (f) in-vitro model; (g) 25 ft of PVC tubing; (h) resistance valve
A Matlab program was created to calculate PWV from experimental data. The ECG signals acquired during the proximal and distal acquisition were used to align the flow waveforms as if they were obtained simultaneously (Figure 5). Flow waveforms were smoothed using a savitsky-golay filter. PWV was calculated using the equation, Δd/Δt, where Δd is the distance between flow measurement sites and Δt is the transit-time automatically calculated through the XCOR, TTM and TTF algorithms. This results in a “regional” PWV measurement, but is theoretically equal to the local PWV due to constant model material properties and geometry. This calculation is made once for each cycle for a total of 14 cycles. The experimental procedure was repeated 3 times for a total of 42 PWV measurements. PWV is expressed as the average of those calculations, plus or minus one standard deviation (SD).
Fig. 5.
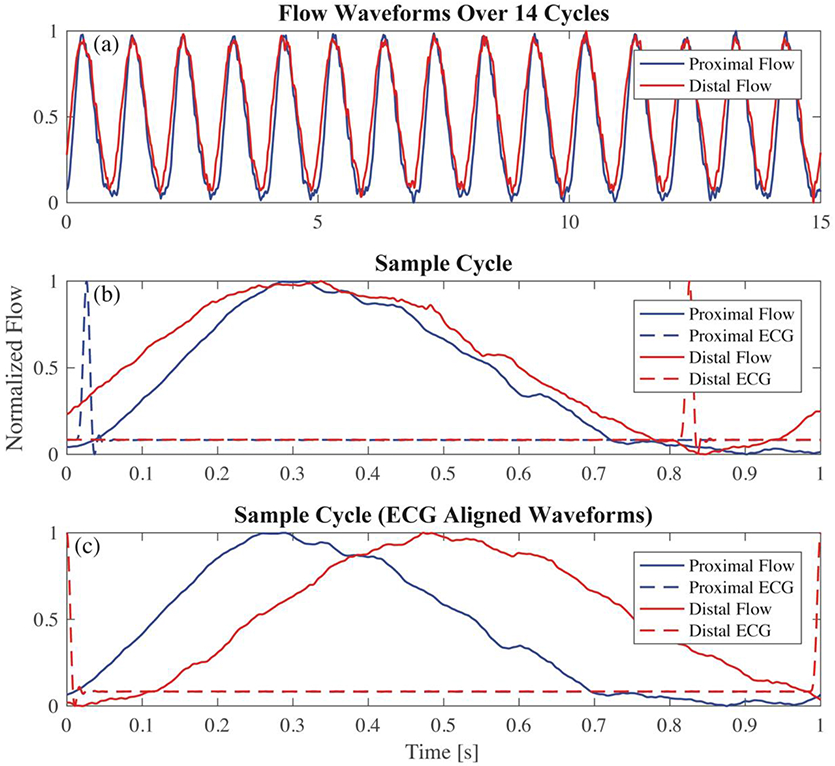
(a) flow waveforms for proximal and distal locations are separately measured for 14 cycles; (b) each set of waveforms is examined individually; (c) proximal and distal waveforms are aligned using the ECG signal from each acquisition
MRI Scanning for Determination of PWV
Each in-vitro model was prepared for MRI scanning using the setup shown in Figure 6. The pump, tubing length, in-vitro model test unit and fittings were configured exactly as they were during the optics and benchtop experiment. The compliance chamber and resistance valve were also adjusted with the same parameters. MRI scanning was completed on a clinical 3T scanner (Discovery MR 750, GE Healthcare, WI) using a cardiac coil. 4D Flow MRI was performed with a 5-pt phase contrast vastly undersampled isotropic projection (PC-VIPR) technique, with parameters set to provide high temporal resolution [28]. Imaging parameters were: FOV = 22 x 22 x 22 cm; 1.375 mm acquired isotropic spatial resolution; echo time (TE) = 2.2 ms; repetition time (TR) = 5.3 ms; temporal resolution = 20 ms; scan time approximately 14 minutes; and velocity encoding (VENC) = 125 cm/s to account for expected peak velocities and to avoid velocity aliasing. Time resolved 4D Flow data were reconstructed to 50 time frames per cardiac cycle to provide sufficient temporal resolution. Phase offsets for Maxwell and eddy currents were corrected automatically during reconstruction[29,30]. Velocity weighted angiograms were calculated from the final velocity and magnitude data for all 50 time frames [28]. Reconstructed 4D Flow MRI data was imported into EnSight (CEI, NC) for flow quantification. A 130 mm spline was placed along the longitudinal axis of each model. 40 2D planes were automatically placed at equal distances from each other, normal to the created spline (Figure 8a). Flow waveforms were obtained for the entire pump cycle in each 2D plane and exported (Figure 8b). Datasets for each model were imported into Matlab for PWV calculation.
Fig. 6.
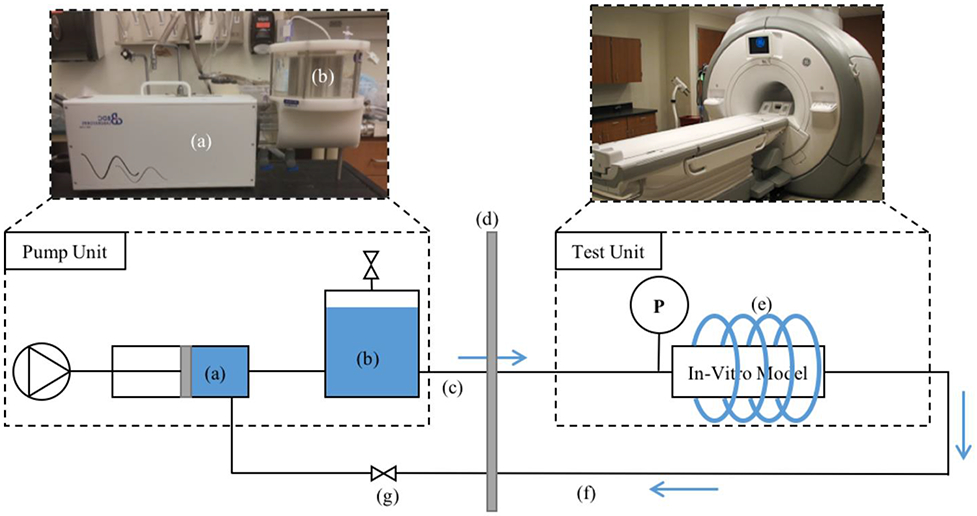
MRI experiment setup. (a) Pulsatile pump; (b) 1.5 L compliance chamber; (c) 25 ft of PVC tubing; (d) wall separating scan room and control room; (e) cardiac coil; (f) 25 ft of PVC tubing; (g) resistance valve
Fig. 8.
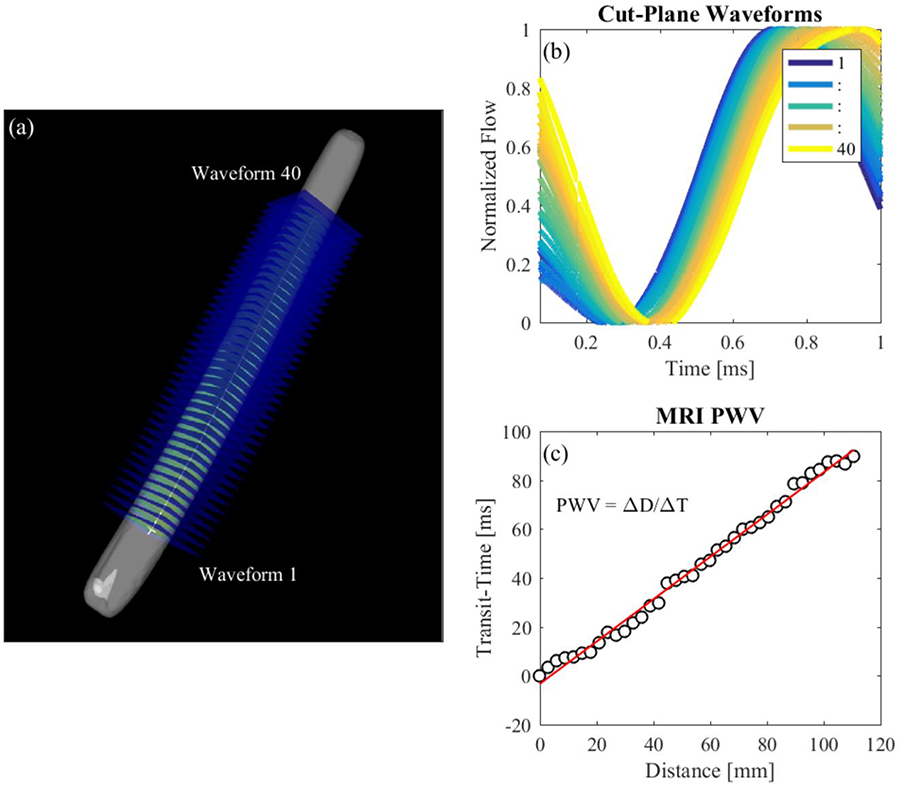
MRI PWV Calculation. (a) Cut-planes placed along the model in EnSight; (b) flow waveforms of each cut-plane; (c) line fitted to transit-time vs distance data for PWV estimation
A Matlab program was written to calculate PWV from processed 4D Flow data. Flow waveforms were smoothed using a savitsky-golay filter (figure 7) and upsampled to achieve the same time step as the benchtop experiment. Transit-time between flow at the first 2D cut plane and flow at each subsequent cut plane was calculated based on the XCOR, TTM and TTF algorithms. Transit-time was plotted against the distance of each cut plane to the first cut plane. PWV is expressed as the inverse slope of a line fitted to the transit-time vs distance data (Figure 8c), as previously described by Markl et al. [17].
Fig. 7.
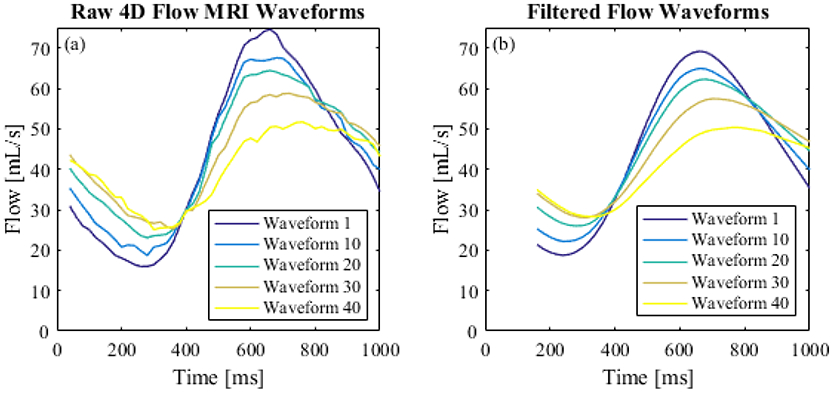
(a) Raw 4D Flow MRI waveforms; (b) smoothed flow waveforms
RESULTS
4D Flow MRI Validation for Local Stiffness Estimation
PEM values and PWV values are shown in Table 2. PEM has the units of kPa and is expressed as a mean ± SD averaged from 2 separate experiments. PWV using XCOR, TTM and TTF algorithms are listed for both Benchtop and MRI experimental procedures. Benchtop PWV is expressed as a mean ± SD averaged over 42 pump cycles. 4D Flow MRI PWV is expressed as the inverse slope of a line fitted to distance vs. transit-time data, where time-resolved flow waveforms are inherently averaged over the length of the scan. 4D Flow MRI data shows increasing PWV with increasing PEM in every case. In addition, the TTM algorithm gives the lowest estimate for PWV and the TTF algorithm gives the highest estimation for every model.
Table 2.
Pulse Wave Velocity vs Petersons Elastic Modulus
| XCOR [m/s] | TTM [m/s] | TTF [m/s] | |||||
|---|---|---|---|---|---|---|---|
| Model # |
PEM [kPa] (n=2) |
Benchtop (n=42) |
MRI* | Benchtop (n=42) |
MRI* | Benchtop (n=42) |
MRI* |
| 1 | 47.94 ± 0.68 | 1.10 ± 0.03 | 1.03 | 0.93 ± 0.02 | 0.86 | 1.26 ± 0.06 | 1.34 |
| 2 | 79.32 ± 1.01 | 1.59 ± 0.09 | 1.7 | 1.32 ± 0.04 | 1.06 | 1.82 ± 0.15 | 2.29 |
| 3 | 691.93 ± 15.65 | 5.49 ± 0.96 | 5.29 | 4.62 ± 0.35 | 4.65 | 5.87 ± 1.23 | 5.99 |
| 4 | 1120.57 ± 3.29 | 7.91 ± 1.64 | 8.46 | 6.28 ± 0.77 | 7.44 | 9.00 ± 2.17 | 9.62 |
4D Flow MRI inherently averages data over the scan time at a rate of 60 BPM and produces a single time-dependent flow waveform for each cut-plane.
4D Flow MRI PWV is plotted with respect to PEM values in Figure 9a to determine the strength of correlation for each transit-time algorithm used. In Figure 9b, the correlation of benchtop PWV and PEM is examined to verify its use as a comparative tool for 4D Flow MRI PWV. Both 4D Flow MRI PWV and benchtop PWV are strongly correlated with PEM, with R2 values of 0.99 for all transit time algorithms.
Fig. 9.
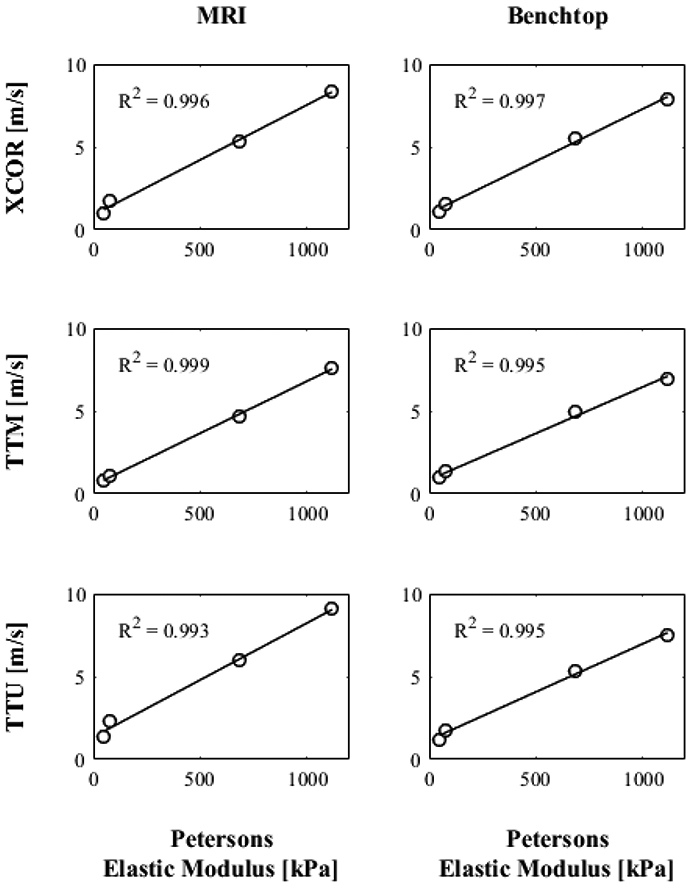
PEM values of each model compared to estimations of benchtop and 4D Flow MRI PWV using XCOR, TTM and TTF transit-time algorithms
In addition to correlation with PEM, benchtop and MRI experiments were compared. The percent difference is shown in table 3 for each transit-time algorithm and model. The XCOR algorithm shows the lowest average percent difference (6%), followed by the TTF algorithm (10%) and the TTM algorithm (12%). In addition, the XCOR algorithm shows the closest grouping of percent differences (4% - 7%) when compared with the other methods (1% - 20% for TTM, 2% - 26% for TTF).
Table 3:
4D Flow MRI PWV Error
| XCOR | TTM | TTF | |||||||
|---|---|---|---|---|---|---|---|---|---|
| Tube # |
Benchtop (m/s) |
MRI (m/s) |
% Difference |
Benchtop (m/s) |
MRI (m/s) |
% Difference |
Benchtop (m/s) |
MRI (m/s) |
% Difference |
| 1 | 1.10 | 1.03 | 6% | 0.93 | 0.86 | 7% | 1.26 | 1.34 | 7% |
| 2 | 1.59 | 1.7 | 7% | 1.32 | 1.06 | 20% | 1.82 | 2.29 | 26% |
| 3 | 5.49 | 5.29 | 4% | 4.62 | 4.65 | 1% | 5.87 | 5.99 | 2% |
| 4 | 7.91 | 8.46 | 7% | 6.28 | 7.44 | 18% | 9.00 | 9.62 | 7% |
Effect of Transit-Time Algorithm
Transit-time algorithms were analyzed within each PWV experimental methodology for their effect on the results. Figure 10 shows the difference in mean and SD for benchtop PWV. Each transit time algorithm returns values of PWV that increase with increasing model PEM. However, the standard deviation is smallest for the TTM algorithm PWV and largest for the TTF algorithm PWV in every case. In addition, SDs were lower for models with lower stiffness than models with higher stiffness.
Fig. 10.
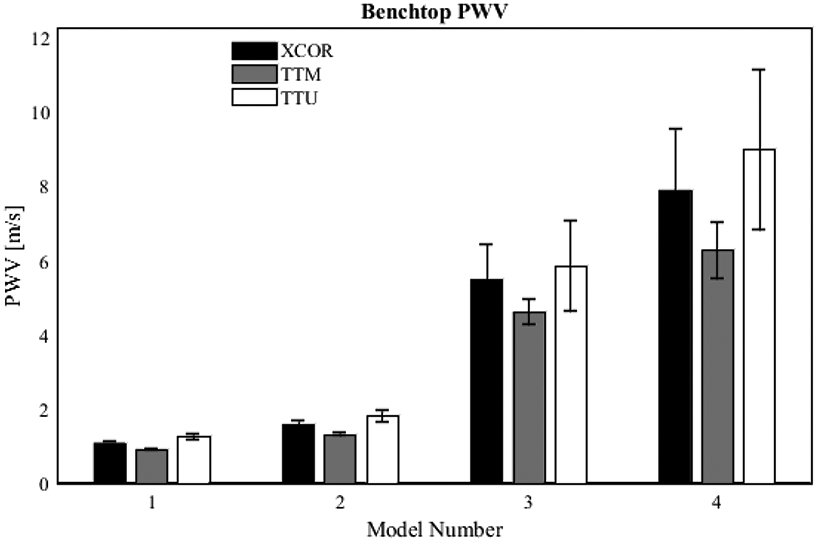
Effect of transit-time algorithm on benchtop PWV. Data was acquired for 42 pump cycles; waveforms from each cycle were aligned using ECG gating; transit-time was automatically calculated
Figure 11 shows the distance vs. transit-time data and linear regression used to calculate PWV for each model studied with 4D Flow MRI. R2 values are given to quantify the stability (how scattered data points are) of each calculation. In general, TTM PWV R2 values are higher than the other two transit-time methods, averaging 0.845. The XCOR algorithm produces a lower average R2, 0.813, followed by the TTF algorithm with an average R2 of 0.767.
Fig. 11.
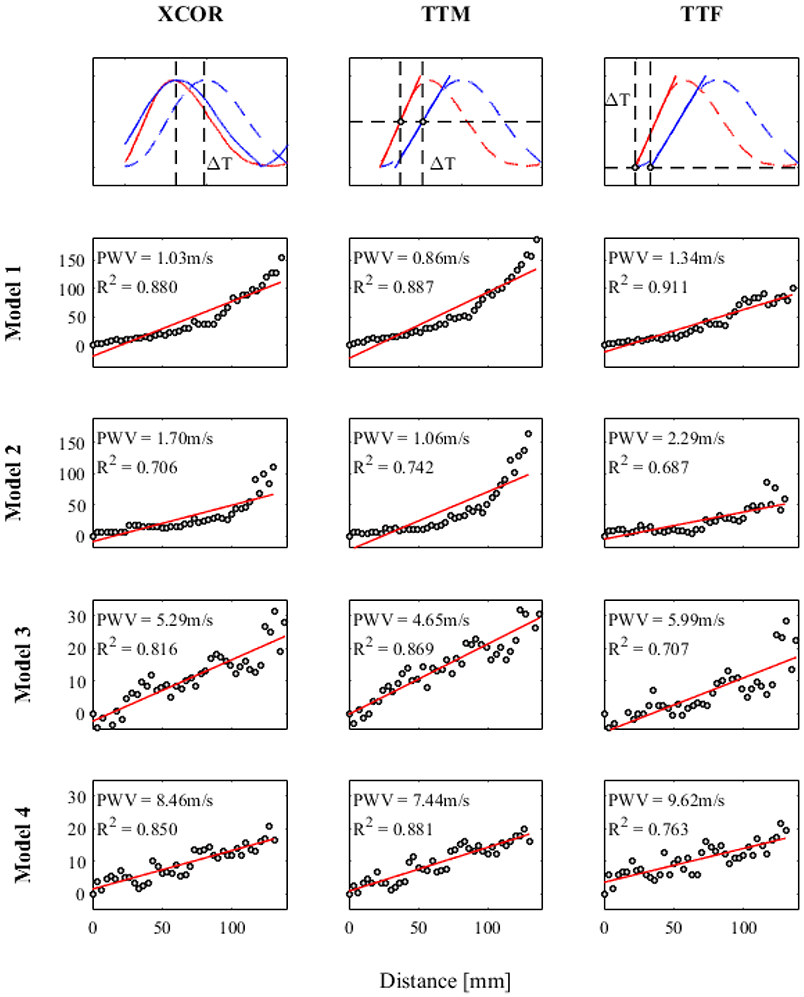
Stability of transit-time algorithm for 4D Flow MRI PWV
DISCUSSION
PWV was measured in four in-vitro models of varying stiffness using two experimental methodologies and three transit-time algorithms. PEM, calculated from high-speed camera images and pressure measurements was correlated with both measurements of PWV to determine their validity for evaluating local stiffness in simple in-vitro models. Correlation was assessed in unison with a PWV comparison between 4D Flow MRI and a reference benchtop experiment. Our results suggest that (1) 4D Flow MRI is a valid method for estimating local PWV in simple in-vitro models and (2) the accuracy of the transit time algorithm depends on the model flow conditions.
4D Flow MRI Local PWV Validity
The comparison between PWV from both experiments with PEM is an effective analysis for validation because the in-vitro models are uniform in dimension and material properties. Both regional PWV from the benchtop experiment and local PWV from 4D Flow MRI should be equivalent. PWV from 4D Flow MRI and the benchtop experiment are strongly correlated with PEM, with R2 values of 0.99 for all estimations. This demonstrates that PWV, calculated from both methods, is a reliable metric for predicting changes in local model stiffness in this study. However, correlation data does not show that 4D Flow MRI produces accurate PWV values in an absolute sense. The comparison between 4D Flow MRI and reference benchtop PWV calculation methods shows good agreement and provides insight on the absolute accuracy of 4D Flow MRI PWV. Validity of 4D Flow MRI as a tool for local PWV calculation is increased by showing that PWV has a 4% to 7% difference with the reference invasive method (benchtop) for the XCOR transit time algorithm. By establishing 4D Flow MRI as a valid method of measuring local PWV in simple models, the validation methods can be extended to anatomical in-vitro models, where stiffness and geometry are anatomical and heterogeneous. Validation of 4D Flow MRI local PWV in more realistic models will allow its use for (1) the reliable investigation of how local arterial stiffness contributes to the pathology of CVD and (2) the potential use of local PWV for prognosis and diagnosis of CVD. The small and relatively widespread sample size may limit the strength of these results. To add validity, additional models should be measured for PEM and PWV using the experimental methods described.
Transit-Time Algorithm
Theoretically, PWV should be constant in a tube with uniform dimensions and material properties, assuming that the mean pressure in the tube remains constant. With these assumptions, the distance vs. transit-time data used for MRI PWV calculation should display linear characteristics. However, for models 1 and 2, data shows a non-linear increasing curve, which indicates a decreasing local PWV. This could be due to a mean pressure drop along the length of the models[31], or an attenuation of the flow wave amplitude as the elasticity of each model adds compliance to the flow loop. Calculating the PWV of different segments would yield different values. For example, PWV in tube 1 evaluated over the first half of the tube equals 2.62 m/s for the XCOR algorithm. Evaluated over the second half, PWV equals 0.57 m/s. However, when averaged over the entire length, PWV is equal to 1.03 m/s (the value used for comparison with the benchtop experiment). This shows that 4D Flow MRI can detect changes in local stiffness, but if averaged over the length of an artery, displays regional stiffness. Another reason for non-linearity is the temporal resolution limitations of 4D Flow MRI, which leads to scattered distance vs. transit-time data points. R2 values, assessing stability, are highest for the TTM algorithm when compared with XCOR and TTF methods for simple in-vitro models using 4D Flow MRI. However, R2 values cannot be used exclusively for algorithm analysis if local PWV changes along the length of a vessel, as was found in models 1 and 2. To supplement the R2 values, PWV from benchtop experiments show that TTM PWV has the lowest SD for every model. This suggests that TTM may be the most precise method for transit-time estimation. However, lower percent differences of the XCOR method between experiments shows XCOR as the most accurate method for these experiments. These results demonstrate the importance of transit-time algorithms on PWV, but do not necessarily show that TTM or XCOR are the best algorithms for every case. Markl et al. reported the TTF method as more stable than other methods when using 4D Flow MRI to calculate PWV for in-vivo vessels[17]. This discrepancy may occur due to differences in waveform shape between in-vivo vessels and the in-vitro models of this study. Choice of transit time algorithm should include an analysis of propagative waveform shape being measured, and how those waveforms change as a function of length. It is possible that different regions of vasculature will benefit from the use of different algorithms.
Previous research studies have analyzed and compared MRI-based PWV calculation methods. PWV calculated from 4D Flow MRI has been compared with 2D PC MRI methods in in-vivo vessels[16,18]. These studies demonstrate the feasibility of 4D Flow MRI for measuring PWV, but do not analyze its ability to measure local stiffness. There is also no invasive reference due to the in-vivo nature of these studies. Other MRI-based PWV calculation methods have been studied on in-vitro models similar to those described in this study[22,32]. This overcomes the invasive limitation of in-vivo studies and make valid comparisons to relatively standard PWV calculation methods. However, 4D Flow MRI is not considered and there is no evidence of comparison between PWV and model stiffness. There have also been studies which attempted to explore and validate local PWV measured from ultrasound or calculated from analytical equations and methods[33-37]. However, ultrasound methods require experts for measurement and are limited to certain arterial regions. Analytical calculation models lack validation. To our knowledge, the present study is the first of its kind to validate 4D Flow MRI for local PWV measurement in in-vitro models. The in-vitro nature gives us control over experimental parameters and allows the use of high speed cameras for reliable PEM value calculation. However, further validation is required in order for its use in clinical settings. The findings and methods of this study provide a framework for future investigation of local PWV using 4D Flow MRI.
A limitation of 4D Flow MRI is the temporal resolution, with typical values between 30 and 52 ms [19]. This limits the detection of waveform changes for high PWVs. For this study, the temporal resolution was increased to 20 ms. However, this required a sacrifice in spatial resolution and scan time, which may not be acceptable for in-vivo studies. The mean pressure and amplitude of the flow wave may also have an effect on local PWV, and should be examined for future in-vitro studies. In addition, 4D Flow MRI data processing procedures such as data reconstruction, spline placement, number of generated cut-planes, and upsampling methods may alter results. A limitation of the benchtop experiment is the use of coupler fittings, proximal and distal to the model. The effects of these fittings on wave shape and speed were not studied.
In addition to limitations for the current study, future research will require a reduction in the number of assumptions. Flow during the benchtop experiment was acquired before the proximal and after the distal coupler, whereas 4D flow MRI measures flow along the model (between couplers). Although models in this study had uniform stiffness and geometry, the local PWV may change due to changes in mean pressure and flow amplitude. Future anatomical models of varying stiffness will require a benchtop experiment which can detect local changes in stiffness along the in-vitro model due to material properties, dimensions, mean pressure and flow amplitude. Irregular vessel characteristics and wave reflections may also cause changes in PWV or waveform shape[38,39]. As a consequence, the transit time calculated using characteristics of the flow waveform may change. Saline bags were also used to mimic surrounding static tissue and may fail to accurately represent tissue for in-vitro experiments [22]. Validated tissue mimicking substances should be used in the future to prevent velocity artifacts.
In summary, 4D Flow MRI is a valid method for measuring local PWV in simple in-vitro models. Although the TTM and XCOR algorithm showed good precision and accuracy, respectively, different vascular regions will likely require specific transit time algorithms. The methods in this study also provide a framework for validating 4D Flow MRI. Future studies should include the validation of 4D Flow MRI local PWV for anatomical in-vitro models and in-vivo vessels where model geometry, material properties, mean pressures, flow amplitudes and wave reflections are considered. If established as a valid tool, 4D Flow MRI gains clinical credibility for estimating local PWV and can be used to investigate how local stiffness plays a role in CVD pathology.
Supplementary Material
Footnotes
No human studies were carried out by the authors for this article
No animal studies were carried out by the authors for this article
Timothy Ruesink, David Rutkowski, Rafael Medero and Alejandro Roldán-Alzate declare that they have no conflict of interest.
REFERENCES
- 1.Lozano R, Naghavi M, Foreman K, et al. Global and regional mortality from 235 causes of death for 20 age groups in 1990 and 2010: A systematic analysis for the Global Burden of Disease Study 2010. Lancet. 2012;380(9859):2095–2128. doi: 10.1016/S0140-6736(12)61728-0 [DOI] [PMC free article] [PubMed] [Google Scholar]
- 2.World Health Organization. Cardiovascular diseases. http://www.who.int/mediacentre/factsheets/fs317/en/. Published 2017. Accessed March 4, 2018.
- 3.Laurent S, Cockcroft J, Van Bortel L, et al. Expert consensus document on arterial stiffness: Methodological issues and clinical applications. Eur Heart J. 2006;27(21):2588–2605. doi: 10.1093/eurheartj/ehl254 [DOI] [PubMed] [Google Scholar]
- 4.Mitchell GF, Hwang S-J, Vasan RS, et al. Arterial Stiffness and Cardiovascular Events: The Framingham Heart Study. Circulation. 2010;121(4):505–511. doi: 10.1161/CIRCULATIONAHA.109.886655 [DOI] [PMC free article] [PubMed] [Google Scholar]
- 5.Boutouyrie P, Tropeano AI, Asmar R, et al. Aortic stiffness is an independent predictor of primary coronary events in hypertensive patients: a longitudinal study. Hypertension. 2002;39(1):10–15. doi: 10.1161/hy0102.099031 [DOI] [PubMed] [Google Scholar]
- 6.Boutouyrie P, Briet M, Collin C, Vermeersch S, Pannier B. Assessment of pulse wave velocity. Artery Res. 2009;3(1):3–8. doi: 10.1016/j.artres.2008.11.002 [DOI] [Google Scholar]
- 7.Laurent S, Katsahian S, Fassot C, et al. Aortic stiffness is an independent predictor of fatal stroke in essential hypertension. Stroke. 2003;34(5):1203–1206. doi: 10.1161/01.STR.0000065428.03209.64 [DOI] [PubMed] [Google Scholar]
- 8.Blacher J, Guerin AP, Pannier B, Marchais SJ, Safar ME, London GM. Impact of Aortic Stiffness on Survival in End-Stage Renal Disease. Circulation. 1999:2434–2439. doi: 10.1161/01.CIR.99.18.2434 [DOI] [PubMed] [Google Scholar]
- 9.Cruickshank K, Riste L, Anderson SG, Wright JS, Dunn G, Gosling RG. Aortic pulse-wave velocity and its relationship to mortality in diabetes and glucose intolerance: An integrated index of vascular function? Circulation. 2002;106(16):2085–2090. doi: 10.1161/01.CIR.0000033824.02722.F7 [DOI] [PubMed] [Google Scholar]
- 10.Quinaglia T, Bensalah MZ, Bollache E, et al. Differential impact of local and regional aortic stiffness on left ventricular remodeling. J Hypertens. 2018;36(3):1. doi: 10.1097/HJH.0000000000001597 [DOI] [PubMed] [Google Scholar]
- 11.London GM, Safar ME. Arterial wall remodelling and stiffness in hypertension: heterogeneous aspects. Clin Exp Pharmacol Physiol. 1996;23(8):S1–5. http://www.ncbi.nlm.nih.gov/pubmed/8886505. [DOI] [PubMed] [Google Scholar]
- 12.Van Sloten TT, Schram MT, Van Den Hurk K, et al. Local stiffness of the carotid and femoral artery is associated with incident cardiovascular events and all-cause mortality: The hoorn study. J Am Coll Cardiol. 2014;63(17):1739–1747. doi: 10.1016/j.jacc.2013.12.041 [DOI] [PubMed] [Google Scholar]
- 13.Yang EY, Chambless L, Sharrett AR, et al. Carotid arterial wall characteristics are associated with incident ischemic stroke but not coronary heart disease in the Atherosclerosis Risk in Communities (ARIC) Study. Stroke. 2012;43(1):103–108. doi: 10.1161/STROKEAHA.111.626200 [DOI] [PMC free article] [PubMed] [Google Scholar]
- 14.Mattace-Raso FUS, Van Der Cammen TJM, Hofman A, et al. Arterial stiffness and risk of coronary heart disease and stroke: The Rotterdam Study. Circulation. 2006;113(5):657–663. doi: 10.1161/CIRCULATIONAHA.105.555235 [DOI] [PubMed] [Google Scholar]
- 15.Boutouyrie P, Fliser D, Goldsmith D, et al. Assessment of arterial stiffness for clinical and epidemiological studies: Methodological considerations for validation and entry into the European Renal and Cardiovascular Medicine registry. Nephrol Dial Transplant. 2014;29(2):232–239. doi: 10.1093/ndt/gft309 [DOI] [PubMed] [Google Scholar]
- 16.Markl M, Wallis W, Strecker C, Gladstone BP, Vach W, Harloff A. Analysis of pulse wave velocity in the thoracic aorta by flow-sensitive four-dimensional MRI: Reproducibility and correlation with characteristics in patients with aortic atherosclerosis. J Magn Reson Imaging. 2012;35(5):1162–1168. doi: 10.1002/jmri.22856 [DOI] [PubMed] [Google Scholar]
- 17.Markl M, Wallis W, Brendecke S, Simon J, Frydrychowicz A, Harloff A. Estimation of global aortic pulse wave velocity by flow-sensitive 4D MRI. Magn Reson Med. 2010;63(6):1575–1582. doi: 10.1002/mrm.22353 [DOI] [PubMed] [Google Scholar]
- 18.Wentland AL, Wieben O, François CJ, et al. Aortic pulse wave velocity measurements with undersampled 4D flow-sensitive MRI: Comparison with 2D and algorithm determination. J Magn Reson Imaging. 2013;37(4):853–859. doi: 10.1002/jmri.23877 [DOI] [PMC free article] [PubMed] [Google Scholar]
- 19.Wentland AL, Grist TM, Wieben O. Review of MRI-based measurements of pulse wave velocity: a biomarker of arterial stiffness. Cardiovasc Diagn Ther. 2014;4(2):193–206. doi: 10.3978/j.issn.2223-3652.2014.03.04 [DOI] [PMC free article] [PubMed] [Google Scholar]
- 20.Hermeling E, Reesink KD, Reneman RS, Hoeks APG. Measurement of Local Pulse Wave Velocity: Effects of Signal Processing on Precision. Ultrasound Med Biol. 2007;33(5):774–781. doi: 10.1016/j.ultrasmedbio.2006.11.018 [DOI] [PubMed] [Google Scholar]
- 21.Papageorgiou GL, Jones NB. Physical modelling of the arterial wall. Part 1: Testing of tubes of various materials. J Biomed Eng. 1987;9(2):153–156. doi: 10.1016/0141-5425(87)90027-6 [DOI] [PubMed] [Google Scholar]
- 22.Bolster BD, Atalar E, Hardy CJ, McVeigh ER. Accuracy of arterial pulse-wave velocity measurement using MR. J Magn Reson Imaging. 1998;8(4):878–888. doi: 10.1002/jmri.1880080418 [DOI] [PMC free article] [PubMed] [Google Scholar]
- 23.Dogui A, Redheuil A, Lefort M, et al. Measurement of aortic arch pulse wave velocity in cardiovascular MR: Comparison of transit time estimators and description of a new approach. J Magn Reson Imaging. 2011;33(6):1321–1329. doi: 10.1002/jmri.22570 [DOI] [PubMed] [Google Scholar]
- 24.Chiu YC, Arand PW, Shroff SG, Feldman T, Carroll JD. Determination of pulse wave velocities with computerized algorithms. Am Heart J. 1991;121(5):1460–1470. doi: 10.1016/0002-8703(91)90153-9 [DOI] [PubMed] [Google Scholar]
- 25.Millasseau SC, Stewart AD, Patel SJ, Redwood SR, Chowienczyk PJ. Evaluation of carotid-femoral pulse wave velocity: Influence of timing algorithm and heart rate. Hypertension. 2005;45(2):222–226. doi: 10.1161/01.HYP.0000154229.97341.d2 [DOI] [PubMed] [Google Scholar]
- 26.PETERSON LH, JENSEN RE, PARNELL J. Mechanical Properties of Arteries in Vivo. Circ Res. 1960;8(3):622–639. doi: 10.1161/01.RES.8.3.622 [DOI] [Google Scholar]
- 27.Nichols W, O’Rourke M. McDonald’s Blood Flow In Arteries. 5th ed. New York: Oxford University Press Inc.; 2005. [Google Scholar]
- 28.Johnson KM, Lum DP, Turski PA, Block WF, Mistretta CA, Wieben O. Improved 3D phase contrast MRI with off-resonance corrected dual echo VIPR. Magn Reson Med. 2008;60(6):1329–1336. doi: 10.1002/mrm.21763 [DOI] [PMC free article] [PubMed] [Google Scholar]
- 29.Walker PG, Cranney GB, Scheidegger MB, Waseleski G, Pohost GM, Yoganathan AP. Semiautomated method for noise reduction and background phase error correction in MR phase velocity data. J Magn Reson Imaging. 1993;3(3):521–530. doi: 10.1002/jmri.1880030315 [DOI] [PubMed] [Google Scholar]
- 30.Gu T, Korosec FR, Block WF, et al. PC VIPR: A high-speed 3D phase-contrast method for flow quantification and high-resolution angiography. Am J Neuroradiol. 2005;26(4):743–749. doi:26/4/743 [pii] [PMC free article] [PubMed] [Google Scholar]
- 31.Nichols WW, McDonald DA. Wave-velocity in the proximal aorta. Med Biol Eng. 1972;10(3):327–335. doi: 10.1007/BF02474213 [DOI] [PubMed] [Google Scholar]
- 32.Taviani V, Patterson AJ, Graves MJ, et al. Accuracy and repeatability of fourier velocity encoded M-mode and two-dimensional cine phase contrast for pulse wave velocity measurement in the descending aorta. J Magn Reson Imaging. 2010;31(5):1185–1194. doi: 10.1002/jmri.22143 [DOI] [PubMed] [Google Scholar]
- 33.Dogui A, Kachenoura N, Frouin F, et al. Consistency of aortic distensibility and pulse wave velocity estimates with respect to the Bramwell-Hill theoretical model: A cardiovascular magnetic resonance study. J Cardiovasc Magn Reson. 2011;13(1):11. doi: 10.1186/1532-429X-13-11 [DOI] [PMC free article] [PubMed] [Google Scholar]
- 34.Meinders JM, Kornet L, Brands PJ, Hoeks a. PG. Assessment of local pulse wave velocity in arteries using 2D distension waveforms. Ultrason Imaging. 2001;23(4):199–215. doi: 10.1177/016173460102300401 [DOI] [PubMed] [Google Scholar]
- 35.Wang Z, Yang Y, Yuan LJ, Liu J, Duan YY, Cao TS. Noninvasive method for measuring local pulse wave velocity by dual pulse wave Doppler: In vitro and in vivo studies. PLoS One. 2015;10(3):1–13. doi: 10.1371/journal.pone.0120482 [DOI] [PMC free article] [PubMed] [Google Scholar]
- 36.Westenberg JJM, Van Poelgeest EP, Steendijk P, Grotenhuis HB, Jukema JW, De Roos A. Bramwell-Hill modeling for local aortic pulse wave velocity estimation: A validation study with velocity-encoded cardiovascular magnetic resonance and invasive pressure assessment. J Cardiovasc Magn Reson. 2012;14(1):2. doi: 10.1186/1532-429X-14-2 [DOI] [PMC free article] [PubMed] [Google Scholar]
- 37.Swillens A, Taelman L, Degroote J, Vierendeels J, Segers P. Comparison of non-invasive methods for measurement of local pulse wave velocity using fsi-simulations and in vivo data. Ann Biomed Eng. 2013;41(7):1567–1578. doi: 10.1007/s10439-012-0688-z [DOI] [PubMed] [Google Scholar]
- 38.Tijsseling A, Anderson A. A. Isebree Moens and DJ Korteweg: On the Speed of Propagation of Waves in Elastic Tubes Conf Press Surges, BHR Gr; 2012:1–19. http://www.win.tue.nl/~atijssel/pdf_files/CASA-12-42.pdf. [Google Scholar]
- 39.Nichols W, Singh B. Augmentation index as a measure of peripheral vascular disease state. Curr Opin Cardiol. 2002;17(5):543–551. doi: 10.1097/01.HCO.0000024184.40973.C9 [DOI] [PubMed] [Google Scholar]
Associated Data
This section collects any data citations, data availability statements, or supplementary materials included in this article.


