Abstract
Nanozymes are nanomaterials with intrinsic magnetism and superparamagnetic properties. In the presence of an external magnet, nanozyme particles aggregate and redisperse without a foreign attraction. We evaluated the performances of nanozyme by changing the biosensing platforms and substituting other biological variants for a complete cancer assay detection. We investigated the expression of morphological variants in the transmission of signals using an electrochemical method. The signal responses, including signal enhancement with the nanozyme (Au-Fe2O3), showed a wide capturing range (greater than 80%, from 102 to 105 cells ml−1 in phosphate-buffered saline buffer, pH 7.4). The platform showed a fast response time within a dynamic range of 10–105 cells ml−1 for the investigated T47D cancer cell line. We also obtained higher responses for anti-HER2 (human epidermal receptor 2)/streptavidin interface as the biosensing electrode in the presence of T47D cancer cells. The positive assay produced a sixfold increase in current output compared to the negative target or negative biological variant. We calculated the limit of detection at 0.4 U ml−1, and of quantitation at 4 U ml−1 (units per millilitre). However, blood volume amounts in clinical settings may constrain diagnosis and increase detection limit value significantly.
Keywords: amperometry detection, cancer biomarkers, limit of detection, biosensor amplification
1. Introduction
Cancer biomarkers are increasingly relevant in diagnostic, prognostic and therapeutic evaluations of patient survival and long-term clinical management. Biomarkers are biological tools used for mapping the metastatic cascade in in vitro and in vivo environments. More recently, interest in cancer-based interface technologies is expanding the detection of early-stage disease [1]. However, cancer cells are highly heterogeneous, and the quantitative profiling of biomarkers using analytical methods of detection becomes imperative.
Some of the standard techniques for profiling biomarkers include electrochemical, fluorescence, surface-enhanced Raman scattering and surface plasmon resonance techniques. Importantly, electrochemical applications to biological environments using biomolecule–nanomaterials at the electrode interface may play a lead role in point-of-care settings in the future [2]. The integration of nanomaterials to biosensing platforms also may display enzyme mimic properties [3]. Nano-based platforms can facilitate cancer cell capture and release [4], charge transfer reactions [5], enhance the signal read out at the electrode surface [6]. These attributes make nano-based sensing platforms extremely sensitive, significant, over complementary techniques [7].
Iron oxide nanomaterials display enzyme-mimic properties towards chromogenic substances [8]. It is common knowledge that nanoparticles can replace the enzyme horseradish peroxidase (HRP) during the oxidation of tetramethylbenzidine [9,10]. The oxide nanomaterials are beneficial as capture agents and catalysts in the detection of autoantibodies and microRNA biological samples [11–13]. Thus, materials with nanoscale dimensions, especially with porous architecture, electrical and optical properties, are significant in biomedical applications [12,14,15].
Not only are electrochemical tools essential for profiling the redox status of a biological or chemical environment, the technique is the gold standard for redox enzymes on thin-film electrode surfaces. Currently, third-generation biosensors involving the integration of porous gold or platinum particles are in demand for high market potential, superior sensitivity, and nanoporous-mimicking activities for signal amplification [16,17]. We describe, in this paper, the strategies and evaluation of cancer biomarkers with iron oxide loaded with Au particles (nanozyme), conjugated with antibodies raised against specific biomarkers.
1.1. Biomarker expression levels in breast cancer cells
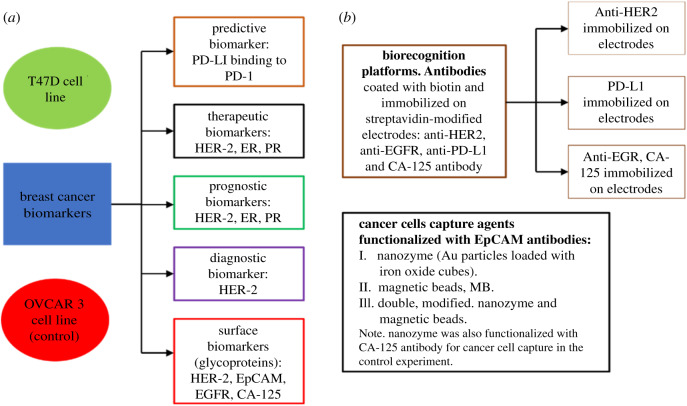
Biomarkers are cell surface receptors expressed by healthy or cancer cells. However, cancer cells overexpress biological molecules produced at the cell surface. The way to measure the expression is by matching the biomarker to a specific antibody (bioreceptor) it recognizes. Depending on the interaction, the signal transduction can either be low or high and is distinct to one cell type. The concept around modification is, therefore, enhancing the signal output using any of the standard techniques. We provide a summary of the cancer biomarkers (scheme 1). T47D cell line was used as the breast cancer cell model and OVCAR3 (ovarian cell line) as the control experiment.
Scheme 1.
Classification of breast cancer biomarkers and assay profiling. T47D cell line is from the human breast cancer cells, and OVCAR 3 cell line is from the human ovarian cancer cells. The scheme shows the basic concept for the classification of biomarkers discussed in this paper. EpCAM (epithelial cell adhesion molecule), EGFR (epithelial growth factor receptor), HER-2 (human epidermal growth factor receptor 2), PD-L1 (programmed death-ligand 1), PD-1 (programmed cell death protein 1), CA-125 (cancer antigen, 125), ER (oestrogen receptor), PR (progesterone receptor).
2. Experimental
2.1. Material and methods
The synthesis and characterization of Au-Fe2O3 (nanozyme) (10 mg), including the loading/releasing effects have been reported previously [18]. Abcam supplied the biotin (Type B) fast conjugation (ab201796) kit. R & D Systems, Australia, provided the human antibodies for HER-2, PD-L1, EGFR and EpCAM. We restored the powdered antibodies to the liquid state just before use at the company's recommendation concentration at 0.50 mg ml−1, except for EpCAM human antibody supplied as a liquid and reconstituted at 1.00 mg ml−1. R&D Systems, Australia, provided CA-125 antibody used as the capturing agent and the biosensing platform for the negative control experiments. Life Technologies, Australia, supplied the phosphate buffer saline (PBS; 10 mM, pH 7.4). Invitrogen, Australia provided the bovine serum albumin (BSA, 50 mg ml−1). The stock solution was diluted to 0.1 wt% before use as a blocking agent. Sigma-Aldrich, Australia, supplied polyethylene glycol (PEG-8000). The 1% PEG solution was used to stabilize antibody molecules during Au-Fe2O3 functionalization. Sigma-Aldrich, Australia, provided the hydroquinone (HQ) that was used to prepare the stock solution (10 mM). Chem-supply, Australia, supplied hydrogen peroxide (H2O2, 30 wt%) and potassium ferrocyanide trihydrate (AR grade). The water conductivity provided at 0.025 µS cm−1. Antibody reconstitution and further dilutions were prepared in sterile PBS buffer, except where otherwise specified.
Metrohm Dropsens, Spain, supplied all the disposable streptavidin electrodes used on the CH instrument model 700E series workstation. We preconditioned the electrodes at room temperature for 30 min. The samples and assays prepared on Eppendorf Thermomixer at 23°C and 300 r.p.m. Thermo Scientific Heraeus™Pico™17 microcentrifuge tubes were used for the separation of the unbound EpCAM antibodies. The anti-EpCAM/Au-Fe2O3 was extracted by discarding the supernatant solution. Thermo Fisher Scientific supplied Countess II used to count the number of free cells and digital images of cancer cells captured. Invitrogen, Australia, supplied the trypan blue (0.4%) for the cell staining. Thermo Fischer Scientific, supplied the DynaMag magnetic separation rack used for the washing and isolation of the cells captured.
2.2. Cell culture preparation
We used the subculture cells of the human adenocarcinoma breast and ovarian cancer cell lines of the American Type Culture Collection (ATCC). Dulbecco's Modified Eagle Medium (DMEM) from Gibco supplied the cell culture nutrient requirements. Thermofisher Scientific supplied the fetal bovine serum (FBS) used for cell growth. Overall, the cell media were constituted of 90% DMEM, 5% FBS plus 0.5% penicillin-streptomycin. Subculture cells were maintained in the incubator at 5% CO2, 37°C. We harvested the cancer cells at 80% confluency with TryLE™ Express and retrieved them as pellets at 2500 r.p.m. for 5 min. The cancer cells were dispersed in 1 ml PBS buffer solution at pH 7.4.
2.3. EpCAM antibody coating with biotin
Abcam supplied the biotin kit used for anti-EpCAM coating. We added a 1 µl modifier reagent directly to 10 µl EpCAM antibody (10 ng ml−1) at room temperature. Then gently mixed biotin powder for another 15 min. We stopped the reaction with a quencher reagent (1 µl) and used directly without further purification.
2.4. Cancer cells captured with Au-Fe2O3 (nanozyme), scheme 3(1)
We modified the preparations according to [11,19–22]. We gently mixed 20 µl nanozyme (1.0 mg ml−1) with 10 µl EpCAM antibody (10 ng ml−1) for 5 min and added 1.0 µl of 1.0% PEG. Then stirred the sample mixture on a thermomixer for 30 min at room temperature. The centrifuge process removed the unreacted EpCAM antibody, and Au-Fe2O3/EpCAM antibody conjugate dispersed in 20 µl PBS buffer solution. The nanozyme-EpCAM antibody conjugate was washed twice and dispersed in 10 µl PBS buffer solution containing 1% PEG (1.0 µl). We extracted the aggregate particles with an external magnet and redispersed in 10 µl of T47D cells at the required cancer concentration ranges.
2.5. Cancer cells captured with magnetic beads, scheme 3(2)
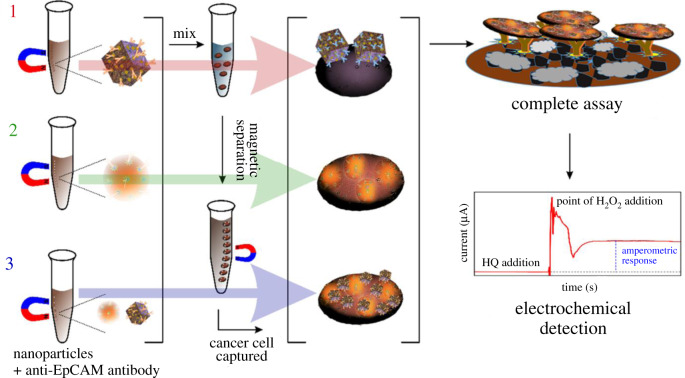
Scheme 3.
Pathways to assay schemes. Scheme 3(1) biotinylated anti-HER2/streptavidin-modified electrode. Scheme 3(2) and Scheme 3(3) biotinylated anti-EGFR/streptavidin-modified electrode.
We vortexed the streptavidin-coated magnetic beads (MBs; 10 mg ml−1) for 30 s and transferred 30 µl to a 1.5 ml tube. We mixed 1 mg ml−1 (×10 dilution) of streptavidin-coated MBs with 10 µl of biotin coated EpCAM antibody (10 ng ml−1) described in §2.3. After stirring for 30 min on a thermomixer, the mixture was washed on a magnetic rack and dispersed in 10 µl PBS solution. We extracted the aggregate particles with an external magnet and redispersed in 10 µl of T47D cells at the required cancer concentration range.
2.6. Cancer cells captured with double-modified nanozyme and magnetic beads, scheme 3(3)
The final samples products of scheme 3(1), nanozyme/anti-EpCAM, and of scheme 3(2), MBs/anti-EpCAM, were used to capture T47D cancer cells according to modifications of published methods [11,20,21]. We split 10 µl of harvested cells dispersed in PBS buffer equally and transferred the preconcentrate of schemes 3(1) and 3(2). We merged the two mixtures and mixed on a thermomixer at (23°C, 300 r.p.m. for one hour). The captured cells were extracted using magnetic separation and redispersed in 10 µl PBS buffer solution.
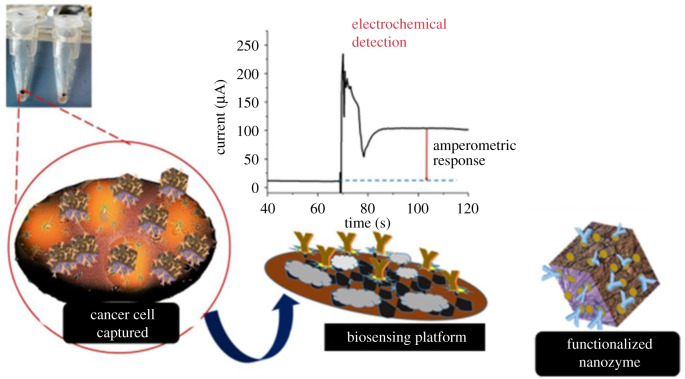
Figure 3.
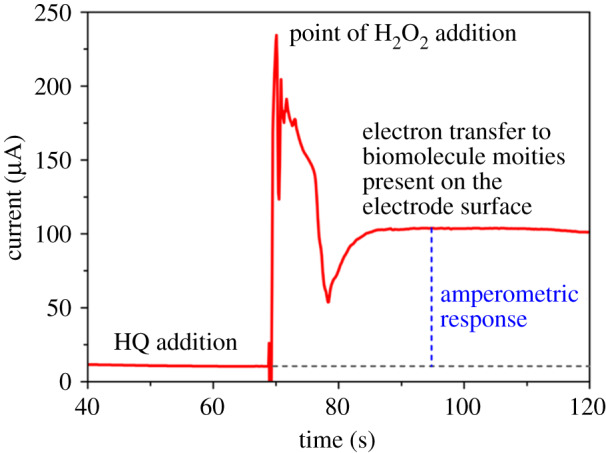
Amperometry (current versus time plot) response in the presence of cancer cells using 1 mM HQ/10 M H2O2.
2.7. Complete assay development
We developed a biorecognition platform for each assay route following the steps taken in §§2.4–2.6. First, we added 10 µl of biotin coated anti-EpCAM (10 ng ml−1) to a streptavidin-modified electrode surface and mixed for 1 h at 23°C and 300 r.p.m. The streptavidin modified surface was washed twice with a 5 µl PBS buffer solution to remove the unreacted biotin coated anti-EpCAM. We blocked the non-specific EpCAM antibody on the electrode surface with 0.1% BSA. Then, we transferred the cancer cells captured using the descriptions of §§2.4–2.6 according the general schematic routes (figure 1).
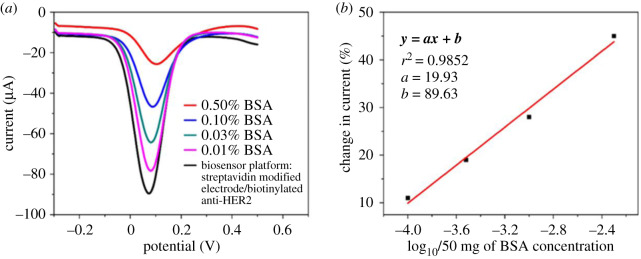
Figure 1.
The biosensing performance of the platform was characterized electrochemically with DPV. The biosensing part, biotinylated anti-HER2 and streptavidin-modified electrodes. (a) BSA % at different concentrations. (b) Linear range of BSA concentration. The DPV experiment was monitored in 2.5 mM [K3Fe(CN)6] and 2.5 mM [K4Fe(CN)6] electrolyte solution.
2.8. Direct cancer cell capture on the streptavidin-coated electrode surface
The direct cell capture process follows a modification from a published method [21]. We added 10 µl of biotin coated anti-EpCAM (10 ng ml−1) to a streptavidin-modified electrode surface and mixed for one hour at 23°C and 300 r.p.m. The electrode surface was washed twice with a 5 µl PBS buffer solution to remove the unreacted biotin coated anti-EpCAM. Subsequently, we blocked the non-specific EpCAM antibody on the electrode surface with 0.1% BSA concentration for 10 min. Then, we transferred 10 µl of T47D cells dispersed in PBS at 105 cells ml−1. The assay was incubated on the thermomixer for 1 h and washed sparingly.
3. Results and discussion
We investigated the platforms for cancer cell capture, compared the amperometry performance, and profiled biomarker expression levels using a breast cancer model. T47D cell line was used as the ideal breast cancer model because the cancer cells have more distinctive molecular characteristics than the MCF-7 cell line. MCF-7 is also susceptible to progesterone (PR) of the luminal A subtype breast cancer family [23]. Luminal T47D cells also display tightly cohesive mass structures [24].
In this study, we used T47D cells for the positive experiment and OVCAR-3 for the control experiment (scheme 1). Since EpCAM expression in cancer cells is significantly high [25], we used anti-EpCAM/nanozyme as the dispersible capture agent to recognize T47D cell expression of EpCAM. Additionally, we evaluated the positive HER-2 expression of T47D breast cancer type using an HER-2 antibody. Importantly, HER-2 forms heterodimers easily with EGFR, and T47D breast cancer type is known to display a preponderance of the protein [26]. However, PD-L1 (programmed cell death) receptor in breast cancer types is associated with large size tumour, estrogen receptor, ER (−), progesterone receptor, PR−, HER-2(+) in HER-2 enriched subtype [27]. CA-125 is a significant biomarker in ovarian cancer patients, and 90% of women with the disease have elevated serum levels [28].
We incorporated nanomaterials as our capture cargo to (i) increase the surface area, (ii) provide high surface activity, (iii) provide good adsorption capacity, (iv) concentrate the analytes and (v) amplify the signal. To this end, we developed the biorecognition platforms by immobilizing biotin (Bio.) coated antibodies to streptavidin-modified electrodes (STE). The following modified electrodes were used, STE/Bio.: (i) anti-HER2, (ii) anti-EGFR, (iii) CA-125 antibody and (iv) anti-PD-L1.
The general preparation route before detection (scheme 2) consisted of (I) nanomaterial functionalization, (II) cell capture, (III) biorecognition staging and (IV) electrochemical profiling. The inclusion of PEG to the nanomaterials and biomolecules confers stability to the molecular assemblies. PEG can also increase the antibody hydration, thereby enhancing the stability of the conjugate during the PEGylating process [21,29]. PEG functionalization increased the stability of the conjugation (antibody–PEG–nanomaterials).
Scheme 2.
The stages in the electrochemical detection of cancer cells. (I) Nanozyme functionalized with the EpCAM antibody (capture agent). (II) Dispersed the capture agent in cancer cells containing PBS buffer solution at pH 7.4. We extracted the cancer cells with an external magnet. (II) Biosensing platform developed. (IV) Transferred the cancer cells captured on the recognition platform. (V) Electrochemical detection and profiling of cancer cells using the amperometry method.
The biosensing platform involves the formation of non-covalent interactions between biotin and the streptavidin modified electrode surface. The addition of a BSA solution blocks any non-specific protein–surface and protein–protein interactions that may hinder assay performance during use as a biorecognition platform [30,31]. In this report, we used a 0.1% BSA concentration solution for 10 min at room temperature incubation as the optimal blocking condition. While other blocking agents including Tween 20 [32], PEG [29], milk proteins [33] and serum albumins [34] are equally good, BSA participation as a blocking agent shows the least steric hindrance during protein–protein binding [29]. Adopting this approach increased the sensitivity and specificity of our biorecognition platforms. The different pathways initially considered for the comparative performance of the best performing breast cancer assays (scheme 3) are in table 1, with a more elaborate discussion elsewhere (figure 4).
Table 1.
Cell capture platform performance. STE, streptavidin modified screen-printed electrode; STR, streptavidin; Bio., biotinylated.
| method | biorecognition platform | cell capture | net amperometry response (µA) |
|---|---|---|---|
| scheme 3(1) | STE/Bio.Anti-HER2 | T47D-Anti.EpCAM-Au-Fe2O3 | 100 |
| scheme 3(2) | STE/Bio.Anti-EGFR | T47D-Bio.Anti.EpCAM-STE.MBs | 40 |
| scheme 3(3) | STE/Bio.Anti-EGFR | STR.MBs-Bio.Anti-EpCAM/T47D/Anti.EpCAM-Au-Fe2O3 | 0 |
| direct cell capture with STE | STE/Bio.Anti-EpCAM | T47D | 5 |
Figure 4.
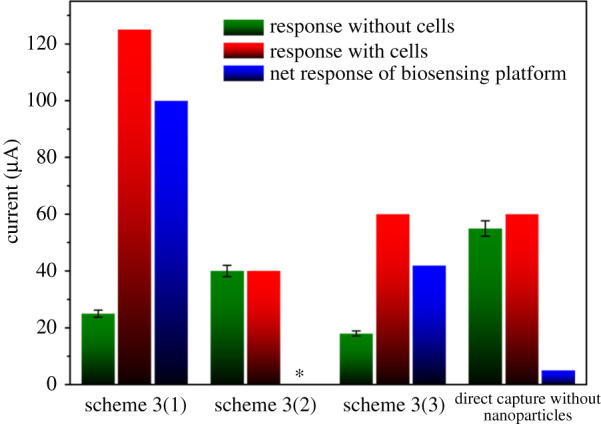
Assay performances in the presence of 1 mM HQ/10 M H2O2. The biosensing interfaces, biotinylated anti-HER-2 as scheme 3(1). Schemes 3(2) and 3(3) as biotinylated anti-EGFR. Biotinylated anti-EpCAM used in direct cell capture. Relative standard deviation of 5.0% (n = 3). *Net response was unobtainable in scheme 3(2) due to no current difference in with/without cells.
The differential pulse voltammetry (DPV) profile (figure 1) measured the serial dilution of BSA concentrations on the surface of the biorecognition platform. We obtained the layer by layer interface with the stepwise addition of 2 mM [Fe(CN)6]4−/3− of an electrolyte solution. The first layer formed the profile of the biorecognition platform after adding a redox probe, Fe[(CN)6]3−/4−, with a successive dilution of BSA concentration (figure 1a) and linear range of BSA concentration (figure 1b). The profiling and calibration of the BSA concentration confirmed two things. First that the biosensing platform had a functional signal readout as the drop in current correlated to the increase in BSA concentration (figure 1a). Second, the linear BSA range indicated the acceptable concentration range for use as a blocking agent (figure 1b). We used 0.1% BSA in all the experiments to minimize steric hindrance and increase the specificity and sensitivity of the biorecognition platform.
A similar DPV profile for the reactant molecules (figure 2) indirectly or directly attached to the surface of the same biorecognition platform showed a current decrease as the biological concomitant moieties increased on the electrode surface. The Faradaic current corresponds to the partial flow of electrons [35,36]. As the concentration of biomolecule moieties increased, electron access to the surface was partially hindered, leading to a drop in the current response. The limitations with the DPV technique are that the sensitivity increases with a small group of reactants and is not suitable for copious reactants or minuscule reactants with no detectable signal [37]. Interestingly, amperometry biosensors depend mostly on the electrode properties, with signal response near to the biosensing electrode [6].
Figure 2.
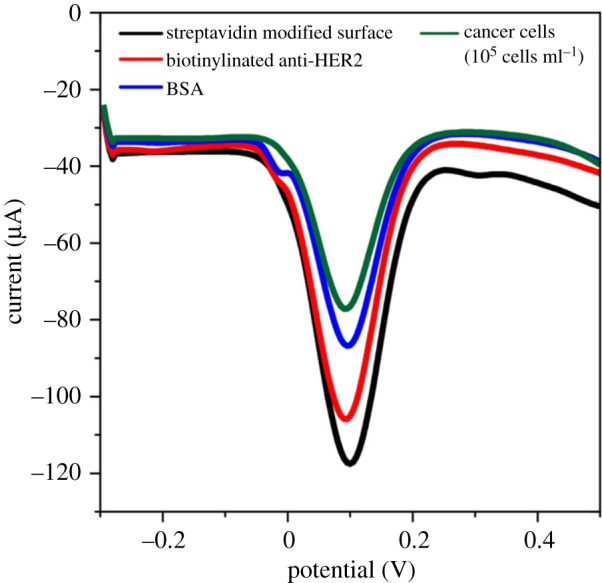
The DPV method was used to monitor the different stages of assay development. The streptavidin-modified electrode conjugated to biotinylated HER-2 antibody, with the subsequent addition of 0.1% BSA concentration for 10 min. Finally, the cells captured (anti-EpCAM/Au-Fe2O3 dispersed in PBS buffer containing T47D cells). The DPV experiment was monitored in 2.5 mM [K3Fe(CN)6] and 2.5 mM [K4Fe(CN)6] electrolyte solution.
We obtained the amperometry response profile (figure 3) by adding 35 µl of 1 mM HQ to the test sample to give a momentary baseline signal. Then followed it with the addition of 35 µl of 10 mM H2O2 (30% v/v). The encounter of HQ solution with H2O2 on the electrode surface leads to a charge transfer of electrons. The electron transfer takes place during the oxidation of HQ to Q. The lift (or jump) in signal response is at the point of addition of H2O2. The returned plateau (stabilized signal) is relative to the HQ response, and the difference is the amperometry response of the assay.
The inclusion of nanomaterials to a biosensor is to amplify the signal and concentrate the analytes for detection. The Amperometry biosensor depends on the current resulting from the redox reaction of a biorecognition platform, and it is the source that provides the specific, quantitative analytical information. Nanomaterial inclusion in cancer-based assays tends to produce higher current responses in amperometry technique. Kung et al. [38] showed the oxidation of HQ to Q increased in the presence of Fe oxide derivative as the concentration of HQ decreased. Also, oxides with a higher surface area oxidize twice as much HQ to quinone and pH had little or no effect on the oxidation of HQ in the presence of an iron oxide loaded surface material [38]. Unexpectedly, the amperometry profile (figure 4 and table 1) indicated a lower response in scheme 3(3), approximately 40 µA than the nanozyme assay in scheme 3(1), approximately 100 µA. There was no signal response in scheme 3(2) containing MBs, suggesting there was a partial flow of electrons from nanozyme in the double-modified nanomaterials in scheme 3(3). We also suggest that replacing the biosensing interface with Bio.anti-HER2 in scheme 3(3) may increase the dual-signal amplification performance. The direct capture method with EpCAM immobilized STE produced a relatively low net signal response (approx. 5 µA). Nonetheless, scheme 3(1) pathway with nanozyme produced the highest signal response (approx. 100 µA).
We calculated the amperometry responses by considering the response without cells (control), response with cells and the net response of the biosensing platform (figure 4) according to the following calculations:
| 3.1 |
where IR (HQ/H2O2 stabilized response) is the stabilized current response at the addition of HQ/H2O2 and IR (HQ addition) is the current response at the addition of HQ only. Here, we noted that HQ addition induced different current responses, attributed to the different interface layers. Therefore, subtracting equation (3.1) removed the solvent background and other interfering signals during the redox process. The net amperometry response:
| 3.2 |
The net signal response corresponds to the amperometry response of the cancer biomarker profiling.
We showed nanozyme capture efficiency of cancer cells (figure 5a,b) and post-capture subculture (figure 5c) at different cell concentrations (105 to 10 cells ml−1). The green colour mapping (figure 5c) were the viable cells and the red colour mapping the dead cells. Interestingly, we observed viable cell growth of post-capture release after 6 h in a tissue culture flask (figure 5c). The result from figure 5 showed the practicability of using the nanozyme capture platform in post-capture culture expansions.
Figure 5.
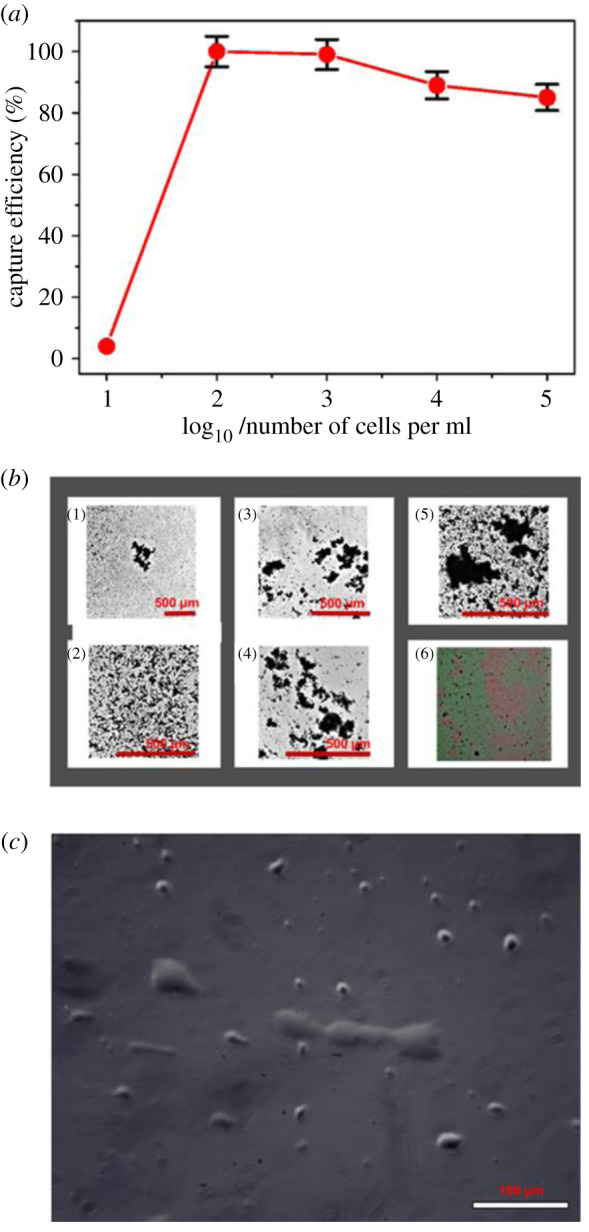
The capture efficiency of cancer cells and the expansion of cancer cells released. (a) The capture efficiency was enumerated directly using an automated cell counter. (b) Numbered 1–5, the photomicrographs of T47D breast cancer cells captured at different serial dilution concentrations (10 to 105 cells ml−1) (scale bar = 500 µm). Numbered 6, digital images of viable cells captured (green colour dots as viable cells and red colour dots as dead cells). (c) Post capture expansion of T47D cancer cells in a standard tissue flask (scale bar = 100 µm).
The precursor derivative of nanozyme without the gold particles demonstrates great potential as efficient transport and control release of drug. Noteworthy, gold particles loading to iron oxide (nanozyme structure) provides fast adsorption of antigen and antibodies on the gold particle surface. The incubation of cells in either free serum or serum proteins (BSA) may either increase the cellular uptake of the nanoparticles via endocytosis [39] or inhibit the cellular uptake of the nanoparticles using the so-called scavenger receptors in serum-containing samples [40]. The present study considers the cell surface attachment to Au particles (Au-Fe2O3) as the probable mechanism and not endocytosis.
The calibration plot (figure 6b) was used to calculate the limit of detection, LOD, and the limit of quantitation, LOQ, using the direct amperometry response for the serial dilution of T47D cells in the presence of HQ/H2O2 (figure 6a). We obtained the LOD and LOQ calculations from a linear regression plot [41]. Then, we used the plot as the model to compute the LOD and LOQ as follows:
| 3.3 |
| 3.4 |
| 3.5 |
where S is the standard deviation of the response (represents the standard error in this report), and a is the slope of the calibration plot within the dynamic range for the serial dilution of cell concentration. Compared to the LOD of the existing biosensor platforms (table 2), we obtained a significantly low LOD (0.4 U ml−1) and LOQ (4 U ml−1), with good reproducibility within the linear range of cancer cell detection.
Figure 6.
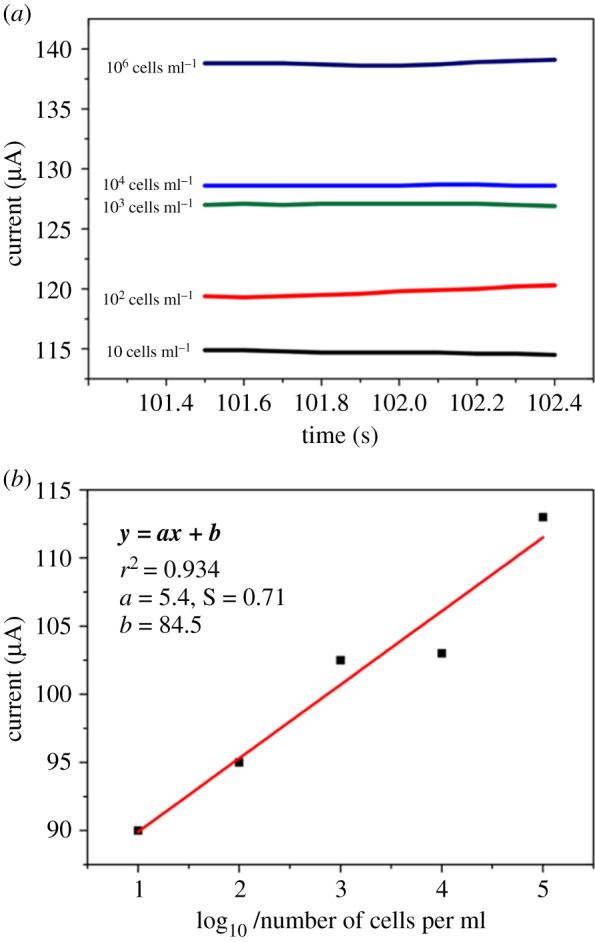
(a) The direct amperometry responses (current versus time) obtained for breast cancer cells captured at different serial dilution concentrations (10–105 cells ml−1). The responses measured in 1 mM HQ/10 M H2O2. Relative standard deviation of 5.0% (n = 3). The calibration plot in (b) was used to calculate LOD and LOQ values. The slope of the graph, 5.4; the standard error of slope, 0.7; the linear regression (r2), 0.93. We considered the net responses in the LOD and LOQ calculations.
Table 2.
Limit of detection of the existing biosensor platforms.
| breast cancer type/target | biosensor specifications | linear range (cells/ml) | detection limit (cells/ml) | reference |
|---|---|---|---|---|
| MCF-7 (MUC1) | porous GO/Au composites and PtFe alloy | 102–5 × 10⁷ | 38 | [42] |
| MCF-7 (MUC1) | HRP/MUC1/aptamer1/Au electrode | 102–1 × 10⁷ | 100 | [43] |
| MCF-7 (MUC1 and CEA) | MUC1/aptamer/MCF-7/anti-CEA-CdSNPs | 104–107 | 3.3 × 10² | [44] |
| MCF-7 (EpCAM) | anti-EpCAM/LC-SPDP/Au electrode | 105–107 | 1 × 10⁵ | [45] |
| MCF-7 (HER-2) | anti-cerbB2/polypyrrole-NHS/GCE | 102–104 | 100 | [46] |
| SKBR-3 (HER-2) | S6 aptamer/AuNPs/ZnO/G/ITO electrode | 102–106 | 58 | [47] |
| SKBR-3 (HER-2) | NFG/AgNPs/PANI | 10–5 × 10⁶ | 2 | [48] |
| SKBR-3 (HER-2) | hydrazine/AuNPs/aptamer | 50–2 × 10⁴ | 26 | [49] |
| MB-231 and T47D (H2O2 traces in cells) | AuPtPd/rGO-modified GCE | 0.005 µM – 6.5 mM | 2 nM | [50] |
| T47D (EpCAM and HER-2) | anti-EpCAM/Au-Fe2O3/Bio.Anti-HER2/STE | 10–1 × 10⁵ | 0.4 U ml−1 (LOD), 4 U ml−1 (LOQ) | this worka |
aLOD is the lowest concentration of the analyte detected in the sample but not quantitated under the stated conditions of the test. LOQ is the lowest concentration of the analyte determined with acceptable precision and accuracy under the stated conditions of test.
We also investigated the amperometry responses for the positive and negative experiments (figure 7). There was increase in signal response with the biosensing platform as STE/Bio.anti-HER in the presence of T47D cells. However, control assays (negative control) with OVCAR3, no cancer cells, or a negative marker as a capture agent, or as part of a biosensing platform, produced relatively low signal responses, equivalent to approximately one-sixth in the output response of the positive setup assay. Since the immediate signal response of a negative test is not necessarily a zero response [6], the direct amperometry responses for the negative control set up (figure 7b) were within experimental measurements. The negative control can only be zero or insignificant using the net amperometry response calculation in equations (3.1) and (3.2).
Figure 7.
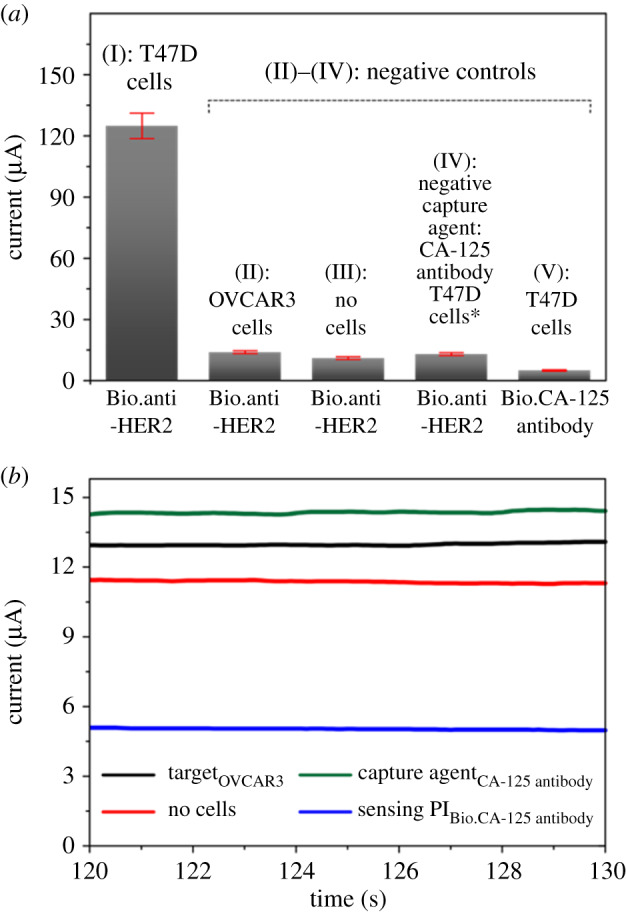
The direct amperometry responses of current for (a) I positive experiment and II-V negative controls. (b) Direct amperometry (i–t) profile of the negative controls. The responses measured in the presence of 1 mM HQ/10 M H2O2. Sensing platforms, biotinylated: anti-HER and CA-125 antibody. CA-125 is a cancer antigen marker for ovarian cancer cells. Relative standard deviation of 5.0% (n = 3).
We also investigated the mean amperometry responses using different biosensing interfaces (figure 8), biotinylated (I) anti-HER2, (II) anti-EGFR and (III) anti-PD-L1, to profile biomarker expression levels in T47D cells. The cancer cells captured, T47D-Anti.EpCAM-Au-Fe2O3, remained the same during the amperometry measurement. Interestingly, we observed significant amperometry responses. The biosensing platform with anti-HER 2 responded with the highest signal, suggesting the presence of HER2 (+). The low PD-L1 signal response may suggest unidentified biomarkers of ER (−), PR (−) and high progesterone (PR+) levels. In a similar work conducted by Cahall [51] using a flow cytometry analysis, the EGFR:HER-2 obtained 1:2 fold expression detection with the flow cytometry method [51]. We got a 1:55 fold expression detection. The PD-L1 expression, as opposed to EGFR expression, suggests a slight upregulation in the presence of (HQ/BQ system), which may be due to cytotoxic local immune response [27].
Figure 8.
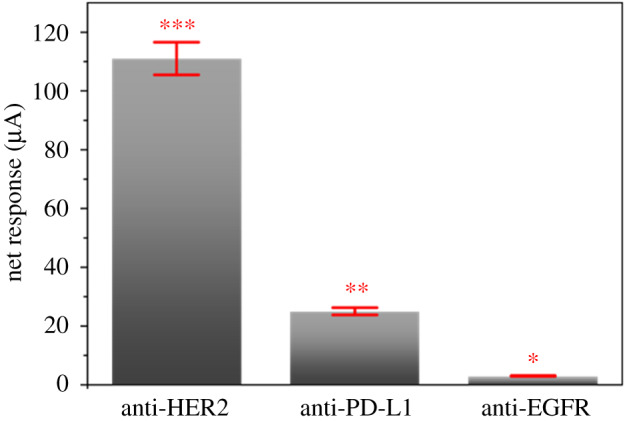
Amperometry responses from the biomarker expressions in the presence of 1 mM HQ/10 M H2O2, with T47D breast cancer cells. Relative standard deviation of 5.0% (n = 3).
4. Conclusion
The cancer assay developed using nanozyme and anti-HER2 antibody as the biosensing interface exhibited high sensitivity and low LOD. We obtained a LOD value of 0.4 U ml−1 and LOQ of 4 U ml−1. Compared to the existing biosensor platforms available, the streptavidin-modified electrode surface reproducibility is significantly high. We also obtained a wide capturing range (greater than 80%, from 10 to 105 cells ml−1 in PBS buffer, pH 7.4) for the T47D cancer cells. We showed the practicability of a post-capture expansion of the cancer cells, which may be useful in the evaluation of the phenotypes. The selective responses obtained by changing the biorecognition platform are proof of concept that this platform is suitable for cancer biomarker profiling.
Supplementary Material
Acknowledgements
V.A. acknowledges the Griffith University for the GUPR and GUIPR scholarships.
Data accessibility
The authors confirm that the data supporting the findings of this study are available within the results section of this paper.
Authors' contributions
V.A. carried out the laboratory work and data analysis, participated in the design of the study, coordinated the study and drafted the manuscript; M.J.A.S. participated in the design of the study, coordinated the study and helped draft the manuscript; T.H.K. coordinated the manuscript and helped draft the manuscript; C.L.B. coordinated the manuscript and helped draft the manuscript; Y.Y. provided the nanozyme and the technical information about the material; I.E.C. coordinated the study and helped draft the manuscript. All authors gave final approval for publication.
Competing interests
We declare we have no competing interest.
Funding
V.A. acknowledges research grant from the Griffith University towards doctoral programme.
References
- 1.Jha NK, et al. 2020. Clinical relevance of ‘biomarkers’ in cancer metabolism. In Cancer cell metabolism: a potential target for cancer therapy (ed. Kumar D.), pp. 127–146. Singapore: Springer Singapore. [Google Scholar]
- 2.Mittal S. 2017. Biosensors for breast cancer diagnosis: a review of bioreceptors, biotransducers and signal amplification strategies. Biosens. Bioelectron. 88, 217–231. ( 10.1016/j.bios.2016.08.028) [DOI] [PubMed] [Google Scholar]
- 3.Revathi C. 2019. Enzymatic and nonenzymatic electrochemical biosensors. In Fundamentals and sensing applications of 2D materials, pp. 259–300. Cambridge, UK: Elsevier. [Google Scholar]
- 4.Yu X. 2013. Magneto-controllable capture and release of cancer cells by using a micropillar device decorated with graphite oxide-coated magnetic nanoparticles. Small 9, 3895–3901. ( 10.1002/smll.201300169) [DOI] [PubMed] [Google Scholar]
- 5.Luo Y. 2009. Detection of extracellular H O released from human liver cancer cells based on TiO nanoneedles with enhanced electron transfer of cytochrome. Anal. Chem. 81, 3035–3041. ( 10.1021/ac802721x) [DOI] [PubMed] [Google Scholar]
- 6.Topkaya SN. 2016. Electrochemical biosensors for cancer biomarkers detection: recent advances and challenges. Electroanalysis 28, 1402–1419. ( 10.1002/elan.201501174) [DOI] [Google Scholar]
- 7.Huang X, O'Connor R, Kwizera EA. 2017. Gold nanoparticle based platforms for circulating cancer marker detection. Nanotheranostics 1, 80 ( 10.7150/ntno.18216) [DOI] [PMC free article] [PubMed] [Google Scholar]
- 8.Gao L. 2017. Iron oxide nanozyme: a multifunctional enzyme mimetic for biomedical applications. Theranostics 7, 3207–3227. ( 10.7150/thno.19738) [DOI] [PMC free article] [PubMed] [Google Scholar]
- 9.Bhattacharjee R, et al. 2018. Porous nanozymes: the peroxidase-mimetic activity of mesoporous iron oxide for the colorimetric and electrochemical detection of global DNA methylation. J. Mater. Chem. B 6, 4783–4791. ( 10.1039/c8tb01132j) [DOI] [PubMed] [Google Scholar]
- 10.Yadav S. 2017. Gold-loaded nanoporous iron oxide nanocubes: a novel dispersible capture agent for tumor-associated autoantibody analysis in serum. Nanoscale 9, 8805–8814. ( 10.1039/C7NR03006A) [DOI] [PubMed] [Google Scholar]
- 11.Ambrosi A. 2007. Double-codified gold nanolabels for enhanced immunoanalysis. Anal. Chem. 79, 5232–5240. ( 10.1021/ac070357m) [DOI] [PubMed] [Google Scholar]
- 12.Islam MN. 2017. A PCR-free electrochemical method for messenger RNA detection in cancer tissue samples. Biosens. Bioelectron. 98, 227–233. ( 10.1016/j.bios.2017.06.051) [DOI] [PubMed] [Google Scholar]
- 13.Islam MN. 2018. Gold-loaded nanoporous ferric oxide nanocubes for electrocatalytic detection of MicroRNA at attomolar level. Biosens. Bioelectron. 101, 275–281. ( 10.1016/j.bios.2017.09.027) [DOI] [PubMed] [Google Scholar]
- 14.Kaneti YV, et al. 2017. Strategies for improving the functionality of zeolitic imidazolate frameworks: tailoring nanoarchitectures for functional applications. Adv. Mater. 29, 1700213 ( 10.1002/adma.201700213) [DOI] [PubMed] [Google Scholar]
- 15.Masud MK. 2017. Gold-loaded nanoporous ferric oxide nanocubes with peroxidase-mimicking activity for electrocatalytic and colorimetric detection of autoantibody. Anal. Chem. 89, 11 005–11 013. ( 10.1021/acs.analchem.7b02880) [DOI] [PubMed] [Google Scholar]
- 16.Das P. 2016. Recent advances on developing 3rd generation enzyme electrode for biosensor applications. Biosens. Bioelectron. 79, 386–397. ( 10.1016/j.bios.2015.12.055) [DOI] [PubMed] [Google Scholar]
- 17.Taurino I. 2016. Recent advances in third generation biosensors based on Au and Pt nanostructured electrodes. TrAC, Trends Anal. Chem. (Regular ed.) 79, 151–159. ( 10.1016/j.trac.2016.01.020) [DOI] [Google Scholar]
- 18.Zakaria MB. 2015. Prussian blue derived nanoporous iron oxides as anticancer drug carriers for magnetic-guided chemotherapy. Chem. Asian J. 10, 1457–1462. ( 10.1002/asia.201500232) [DOI] [PubMed] [Google Scholar]
- 19.Boriachek K. 2019. Avoiding pre-isolation step in exosome analysis: direct isolation and sensitive detection of exosomes using gold-loaded nanoporous ferric oxide nanozymes. Anal. Chem. 91, 3827–3834. ( 10.1021/acs.analchem.8b03619) [DOI] [PubMed] [Google Scholar]
- 20.Maltez-Da C. 2012. Simple monitoring of cancer cells using nanoparticles. Nano Lett. 12, 4164–4171. ( 10.1021/nl301726g) [DOI] [PubMed] [Google Scholar]
- 21.Min H. 2015. Efficient capture and simple quantification of circulating tumor cells using quantum dots and magnetic beads. Small 11, 2536–2542. ( 10.1002/smll.201403126) [DOI] [PubMed] [Google Scholar]
- 22.Perfézou M. 2012. Cancer detection using nanoparticle-based sensors. Chem. Soc. Rev. 41, 2606–2622. ( 10.1039/C1CS15134G) [DOI] [PubMed] [Google Scholar]
- 23.Yu S. 2017. The T47D cell line is an ideal experimental model to elucidate the progesterone-specific effects of a luminal A subtype of breast cancer. Biochem. Biophys. Res. Commun. 486, 752–758. ( 10.1016/j.bbrc.2017.03.114) [DOI] [PubMed] [Google Scholar]
- 24.Holliday DL. 2011. Choosing the right cell line for breast cancer research. Breast Cancer Research: BCR 13, 215 ( 10.1186/bcr2889) [DOI] [PMC free article] [PubMed] [Google Scholar]
- 25.Königsberg R. 2011. Detection of EpCAM positive and negative circulating tumor cells in metastatic breast cancer patients. Acta Oncol. 50, 700–710. ( 10.3109/0284186X.2010.549151) [DOI] [PubMed] [Google Scholar]
- 26.Eccles SA. 2001. The role of c-erbB-2/HER2/neu in breast cancer progression and metastasis. J. Mammary Gland Biol. Neoplasia 6, 393–406. ( 10.1023/A:1014730829872) [DOI] [PubMed] [Google Scholar]
- 27.Sabatier R. 2015. Prognostic and predictive value of PDL1 expression in breast cancer. Oncotarget 6, 5449–5464. ( 10.18632/oncotarget.3216) [DOI] [PMC free article] [PubMed] [Google Scholar]
- 28.Razmi N. 2018. Current advancement on diagnosis of ovarian cancer using biosensing of CA 125 biomarker: analytical approaches. TrAC, Trends Anal. Chem. (Regular ed.) 108, 1–12. ( 10.1016/j.trac.2018.08.017) [DOI] [Google Scholar]
- 29.Reimhult K, Petersson K, Krozer A. 2008. QCM-D analysis of the performance of blocking agents on gold polystyrene surfaces. Langmuir 24, 8695–8700. ( 10.1021/la800224s) [DOI] [PubMed] [Google Scholar]
- 30.Jeyachandran YL. 2010. Efficiency of blocking of non-specific interaction of different proteins by BSA adsorbed on hydrophobic and hydrophilic surfaces. J. Colloid Interface Sci. 341, 136–142. ( 10.1016/j.jcis.2009.09.007) [DOI] [PubMed] [Google Scholar]
- 31.Rankl M. 2006. Conformational reorientation of immunoglobulin G during nonspecific interaction with surfaces. Chemphyschem 7, 837–846. ( 10.1002/cphc.200500448) [DOI] [PubMed] [Google Scholar]
- 32.Steinitz M. 2000. Quantitation of the blocking effect of tween 20 and bovine serum albumin in ELISA microwells. Anal. Biochem. 282, 232–238. ( 10.1006/abio.2000.4602) [DOI] [PubMed] [Google Scholar]
- 33.Haab BB, Dunham MJ, Brown PO. 2001. Protein microarrays for highly parallel detection and quantitation of specific proteins and antibodies in complex solutions. Genome Biol. 2, 0004.1 ( 10.1186/gb-2001-2-2-research0004) [DOI] [PMC free article] [PubMed] [Google Scholar]
- 34.Greenwood FC. 1963. The preparation of I-131-labelled human growth hormone of high specific radioactivity. Biochem. J. 89, 114–123. ( 10.1042/bj0890114) [DOI] [PMC free article] [PubMed] [Google Scholar]
- 35.Das J. 2011. Protein detection using arrayed microsensor chips: tuning sensor footprint to achieve ultrasensitive readout of CA-125 in serum and whole blood. Anal. Chem. 83, 1167–1172. ( 10.1021/ac102917f) [DOI] [PubMed] [Google Scholar]
- 36.Yadav S, Carrascosa LG, Sina AAI, Shiddiky MJA, Hill MM, Trau M. 2016. Electrochemical detection of protein glycosylation using lectin and protein–gold affinity interactions. Analyst 141, 2356–2361. ( 10.1039/C6AN00528D) [DOI] [PubMed] [Google Scholar]
- 37.Brown AP. 1977. Cyclic and differential pulse voltammetric behavior of reactants confined to the electrode surface. Anal. Chem. 49, 1589–1595. ( 10.1021/ac50019a033) [DOI] [Google Scholar]
- 38.Kung KH. 1988. Electron transfer processes between hydroquinone and iron oxides. Clays Clay Miner. 36, 303–309. ( 10.1346/CCMN.1988.0360403) [DOI] [Google Scholar]
- 39.Chithrani BD. 2007. Elucidating the mechanism of cellular uptake and removal of protein-coated gold nanoparticles of different sizes and shapes. Nano Lett. 7, 1542–1550. ( 10.1021/nl070363y) [DOI] [PubMed] [Google Scholar]
- 40.Patel PC, Giljohann DA, Daniel WL, Zheng D, Prigodich AE, Mirkin CA. 2010. Scavenger receptors mediate cellular uptake of polyvalent oligonucleotide-functionalized gold nanoparticles. Bioconjug. Chem. 21, 2250–2256. ( 10.1021/bc1002423) [DOI] [PMC free article] [PubMed] [Google Scholar]
- 41.Shrivastava. 2011. Methods for the determination of limit of detection and limit of quantitation of the analytical methods. Chronicles Young Sci. 2, 21 ( 10.4103/2229-5186.79345) [DOI] [Google Scholar]
- 42.Yan M. 2013. An aptasensor for sensitive detection of human breast cancer cells by using porous GO/Au composites and porous PtFe alloy as effective sensing platform and signal amplification labels. Anal. Chim. Acta 798, 33–39. ( 10.1016/j.aca.2013.08.046) [DOI] [PubMed] [Google Scholar]
- 43.Zhu X. 2013. Sensitive detection of human breast cancer cells based on aptamer–cell–aptamer sandwich architecture. Anal. Chim. Acta 764, 59–63. ( 10.1016/j.aca.2012.12.024) [DOI] [PubMed] [Google Scholar]
- 44.Li T. 2010. Detection of breast cancer cells specially and accurately by an electrochemical method. Biosens. Bioelectron. 25, 2686–2689. ( 10.1016/j.bios.2010.05.004) [DOI] [PubMed] [Google Scholar]
- 45.Arya SK. 2013. Anti-EpCAM modified LC-SPDP monolayer on gold microelectrode based electrochemical biosensor for MCF-7 cells detection. Biosens. Bioelectron. 41, 446–451. ( 10.1016/j.bios.2012.09.006) [DOI] [PubMed] [Google Scholar]
- 46.Seven B. 2013. Impedimetric biosensor for cancer cell detection. Electrochem. Commun. 37, 36–39. ( 10.1016/j.elecom.2013.10.003) [DOI] [Google Scholar]
- 47.Liu F. 2014. Application of ZnO/graphene and S6 aptamers for sensitive photoelectrochemical detection of SK-BR-3 breast cancer cells based on a disposable indium tin oxide device. Biosens. Bioelectron. 51, 413–420. ( 10.1016/j.bios.2013.07.066) [DOI] [PubMed] [Google Scholar]
- 48.Salahandish R. 2018. Nano-biosensor for highly sensitive detection of HER2 positive breast cancer. Biosens. Bioelectron. 117, 104–111. ( 10.1016/j.bios.2018.05.043) [DOI] [PubMed] [Google Scholar]
- 49.Zhu Y. 2013. Ultrasensitive and selective electrochemical diagnosis of breast cancer based on a hydrazine–Au nanoparticle–aptamer bioconjugate. Anal. Chem. 85, 1058–1064. ( 10.1021/ac302923k) [DOI] [PubMed] [Google Scholar]
- 50.Jiang G. 2017. Colorimetric and visual determination of adenosine triphosphate using a boronic acid as the recognition element, and based on the deaggregation of gold nanoparticles. Mikrochimica Acta 184, 4305–4312. ( 10.1007/s00604-017-2454-2) [DOI] [Google Scholar]
- 51.Cahall CF. 2015. A quantitative perspective on surface marker selection for the isolation of functional tumor cells. Breast Cancer Basic Clin. Res. 9s1, BCBCR.S25461 ( 10.4137/BCBCR.S25461) [DOI] [PMC free article] [PubMed] [Google Scholar]
Associated Data
This section collects any data citations, data availability statements, or supplementary materials included in this article.
Supplementary Materials
Data Availability Statement
The authors confirm that the data supporting the findings of this study are available within the results section of this paper.


